


Abstract
L1 retrotransposons are autonomous retroelements that are active in the human and mouse genomes. Previously, we developed a cultured cell assay that uses a neomycin phosphotransferase (neo) retrotransposition cassette to determine relative retrotransposition frequencies among various L1 elements. Here, we describe a new retrotransposition assay that uses an enhanced green fluorescent protein (EGFP) retrotransposition cassette to determine retrotransposition kinetics in cultured cells. We show that retrotransposition is not detected in cultured cells during the first 48 h post-transfection, but then proceeds at a continuous high rate for at least 16 days. We also determine the relative retrotransposition rates of two similar human L1 retrotransposons, L1RP and L1.3. L1RP retrotransposed in the EGFP assay at a rate of ~0.5% of transfected cells/day, ~3-fold higher than the rate measured for L1.3. We conclude that the new assay detects near real time retrotransposition in a single cell and is sufficiently sensitive to differentiate retrotransposition rates among similar L1 elements. The EGFP assay exhibits improved speed and accuracy compared to the previous assay when used to determine relative retrotransposition frequencies. Furthermore, the EGFP cassette has an expanded range of experimental applications.
INTRODUCTION
Retrotransposable elements are likely present in all eukaryotic genomes and have contributed substantially to genome structure and evolution. In humans, L1 retrotransposons constitute 15–17% of the genome (1). The L1 reverse transcriptase may also mobilize Alu elements and processed pseudogenes, comprising an additional 15% of the genome (2). The discovery of de novo L1 and Alu insertions (3–6) and the cloning of multiple active L1 elements (7) have demonstrated that these elements continue to expand the genome. In addition to producing insertions, L1 retrotransposons can also sculpt the genome by homologous recombination (8,9) and by transduction of 3′-flanking sequences to new genomic locations (10).
The retrotransposition cassette, a selectable marker for detecting new retrotransposition events, is an important advance in studies of retrotransposon biology (11,12). A neomycin phosphotransferase (neo) retrotransposition cassette has been used to demonstrate retrotransposition of mouse IAP elements, processed pseudogenes and mammalian L1 retrotransposons (13–17). Similar retrotransposition cassettes have been used to demonstrate retrotransposition of yeast Ty1 elements and Drosophila I elements (18,19). However, a major disadvantage of previous retrotransposition cassettes is the necessity for antibiotic selection or for fixing and staining cells to score retrotransposition. Green fluorescent protein (GFP), a chromophore from the jellyfish Aequorea victoria, can be used as a marker in living cells without antibiotic selection or staining (20), making an enhanced green fluorescent protein (EGFP)-based retrotransposition cassette ideal for use in several previously infeasible experimental applications.
In this paper we describe construction of the EGFP cassette and demonstrate its efficacy. We use the EGFP cassette to determine retrotransposition kinetics and to determine relative retrotransposition rates between two similar human L1 elements, L1RP and L1.3. L1RP was recently discovered as a de novo insertion into the RP2 gene of a retinitis pigmentosa patient (4) and L1.3 is an element cloned from the human genome using a probe specific for an active subfamily of L1 elements (7). The EGFP retrotransposition cassette provides significant advantages over previous cassettes and is a novel tool for use in retroelement studies.
MATERIALS AND METHODS
Creation of plasmids
pRJD532 contains the EGFP gene (Clontech) interrupted by an antisense γ-globin intron (21). We removed the thymidine kinase (TK) poly(A) signal from pOG44-Cre (a gift of Brian Crenshaw, University of Pennsylvania) as a blunted RsrII–PvuII fragment and ligated the fragment into a blunted NotI site in pRJD532 downstream of the EGFP cassette to create pRJD532-TKpolyA. The EGFP cassette containing the TK poly(A) signal was removed from pRJD532 as an EcoRI–SalI fragment and ligated into the EcoRI and SalI digested multiple cloning site (MCS) of pEGFP-N1 (Clontech) to create pCMV-EGFP-TKpolyA. The complete EGFP cassette was removed from pCMV-EGFP-TKpolyA as a SalI–blunted AseI fragment and ligated into the SalI and blunted EcoRI digested MCS of pBluescript KS– to create pBSKS–-EGFP-INT. pJCC5 (the precursor to pJCC9 described in 15) contains the L1.2A element (22) cloned into a modified pBluescript KS–. We swapped the L1.3 element from pJM101/L1.3 (23) and the L1RP element from pJM101/L1RP (23) into JCC5 as NotI–BstZ17I fragments to create pJCC5(L1.3) and pJCC5(L1RP), respectively. We then ligated the entire EGFP cassette as a XmaI–blunted SalI fragment into the XmaI and BstZ17I sites in the 3′-UTRs of the pJCC5 L1 elements, to create pBS-L1.3-EGFP and pBS-L1RP-EGFP. pJM111 encodes an L1 element containing two missense mutations in the ORF1 coding region that were previously shown to abolish retrotransposition (15). To create a negative control construct, we subcloned a 263 bp AgeI–BstEII fragment containing the missense mutations into pBS-L1RP-EGFP, creating pBS-L1RP(JM111)-EGFP. The EGFP-tagged L1 elements were ligated as NotI–blunted ApaI fragments into NotI and blunted SfiI sites in the MCS of pRJD099, a modified pCEP4 (Invitrogen) lacking the cytomegalovirus (CMV) promoter (21), to create pL1.3-EGFP, pL1RP-EGFP and pL1RP(JM111)-EGFP. In the same manner, the EGFP-tagged L1 elements were also cloned into the MCS of pCEP-puro, a plasmid similar to pRJD099 but with the hygromycin resistance gene replaced by the puromycin resistance gene, to create pL1.3-EGFP(puro), pL1RP-EGFP(puro) and pL1RP(JM111)-EGFP(puro). As a positive control for maintenance and expression of the CEP-based vectors, we ligated a NotI–blunted AseI fragment from pEGFP-N1, containing the EGFP gene and CMV promoter, into the PvuII and NotI digested MCS of pRJD099 to create pCEP-EGFP.
Growth of cells
HeLa cells were grown in a humidified, 5% CO2 incubator at 37°C in high glucose (4.5 g/l) Dulbecco’s modified Eagle’s medium (DMEM) lacking pyruvate (Gibco BRL). DMEM was supplemented with 10% fetal bovine calf serum, 2 mM l-glutamine and 100 U/ml penicillin, 0.1 mg/ml streptomycin (DMEM complete).
Transfection and selection of cells
HeLa cells were seeded in 6-well dishes at a target density of 4 × 10⁵ cells/well and grown to 70% confluency in DMEM complete. Plasmid DNA was purified on maxiprep columns (Qiagen) and diluted in sterile dH2O to 1 µg/µl. Cells were transfected with the FuGENE 6 transfection reagent (Boehringer Mannheim) following the manufacturer’s protocol. Each transfection well received 1 µg plasmid DNA, 3 µl FuGENE reagent and 2 ml DMEM complete. Antibiotic selection was begun 24 h after transfection. Hygromycin-resistant (hygR) cells were selected by growth in DMEM complete medium containing 200 µg/ml hygromycin (DMEM-Hyg) while puromycin-resistant cells (purR) were selected by growth in DMEM complete medium containing 10 µg/ml puromycin (DMEM-Pur).
Isolation of genomic DNA from EGFP-expressing clones, PCR analysis and sequencing
HeLa cells were transfected with the pL1RP-EGFP construct and selected for hygR cells as described in the previous section. After complete antibiotic selection, the cells were trypsinized and plated at low density in 6-well dishes. EGFP-expressing clones were observed by fluorescence microscopy. Several fluorescent colonies were picked, transferred to individual wells in 6-well dishes and expanded in DMEM-Hyg. Genomic DNA was isolated with the Qiagen Blood & Cell Culture DNA Mini Kit.
The oligonucleotides used for PCR were GFP968F (5′-GCA-CCATCTTCTTCAAGGACGAC-3′) and GFP1013R (5′-TCT-TTGCTCAGGGCGGACTG-3′). Amplifications were performed in 50 µl containing 1.25 U AmpliTaq Gold polymerase (Roche), 2.5 mM MgCl2, 1× GeneAmp PCR Gold buffer (Roche), 0.2 mM each dNTP, 200 ng of each oligonucleotide primer and ~500 ng genomic DNA or 70 ng plasmid DNA template. After an initial step at 94°C (15 min), 35 cycles of amplification were performed (30 s at 94°C, 30 s at 59°C, 2 min at 72°C), followed by a final step at 72°C (10 min). PCR products from several independent clones were used as templates for direct sequencing. Sequencing reactions used 35 ng of PCR product and 3.2 pmol oligonucleotide primer GFP1077S (5′-GGACGGCAACATCCTGGGG-3′). Sequencing was performed using ABI 377 and 373A Stretch sequencers (DNA Sequencing Core, University of Pennsylvania).
Fluorescence microscopy and fluorescence-activated cell scanning (FACS)
Fluorescence microscopy was performed using a Leica DM-IL inverted microscope with an ultra high pressure lamp (HBO/100 W), a vertical fluorescence illuminator and a FITC filter set (530 nm peak excitation; Chroma) (21). Cells were prepared for FACS analysis by washing once with 2 ml phosphate-buffered saline (PBS) and then incubating for 10 min in a modified Versene solution (5 mM EDTA in PBS) to gently remove the adherent cells from the 6-well dishes. The suspended cells were transferred to polystyrene tubes by passage through cell strainer caps (Falcon) and kept on ice until FACS analysis. Cells were analyzed with a FACScan tabletop analysis instrument (Becton Dickinson) containing a blue argon laser (488 nm) and fluorescein filter sets (530/30 bandpass). Between 10 000 and 20 000 total events were analyzed per sample. Live–dead gating was performed based on forward scatter versus side scatter profile. Living cells were analyzed for fluorescence intensity. Data analysis was performed using the CellQuest v.3.1 software package.
In experiments using hygromycin selection, cells transfected with the pCEP4 vector alone were used as a negative control to determine background fluorescence. On day 8 post-transfection, we arbitrarily set a threshold at a fluorescence intensity such that <0.05% of the pCEP4-transfected cells fluoresced above this level. The threshold was left at a constant intensity level throughout each experiment. The percentage of pCEP4-transfected cells that fluoresced above this threshold was considered the false positive frequency. As an additional negative control, we transfected cells with a construct containing the L1RP(JM111) element. Untransfected HeLa cells were used to determine when antibiotic selection had been completed. We used cells transfected with pCEP-EGFP as a positive control for maintenance and expression of the pCEP4 plasmid. Cells transfected with pCEP-EGFP also served as an additional control to monitor efficiency of antibiotic selection. In the hygromycin experiments, we sampled three independent transfection wells per construct at each time point. Each transfection well was sampled only once during the experiment. In this manner, the data within each time point are independent of the previous time points. Additionally, we were able to avoid disrupting cell growth in a transfection well until the time of cell harvest. Experiments using the puromycin resistance constructs were performed similarly to the hygromycin experiments except that pL1RP(JM111)-EGFP(puro) was the negative control for determining false positive frequency and we sampled four independent transfection wells per construct at each time point.
RESULTS
An EGFP retrotransposition cassette to detect near real time L1 retrotransposition
We created a retrotransposition cassette consisting of the EGFP gene, the CMV immediate early promoter, the TK poly(A) signal and a γ-globin intron in the opposite orientation to the EGFP gene. The EGFP retrotransposition cassette was then cloned into the 3′-UTR of various L1 elements. Before retrotransposition, EGFP transcripts from the CMV promoter contain the γ-globin intron in the opposite orientation and cannot produce functional EGFP protein. EGFP expression and concomitant fluorescence under UV light can only occur when the γ-globin intron is removed by splicing during a retrotransposition event (Fig. 1A).
Figure 1.

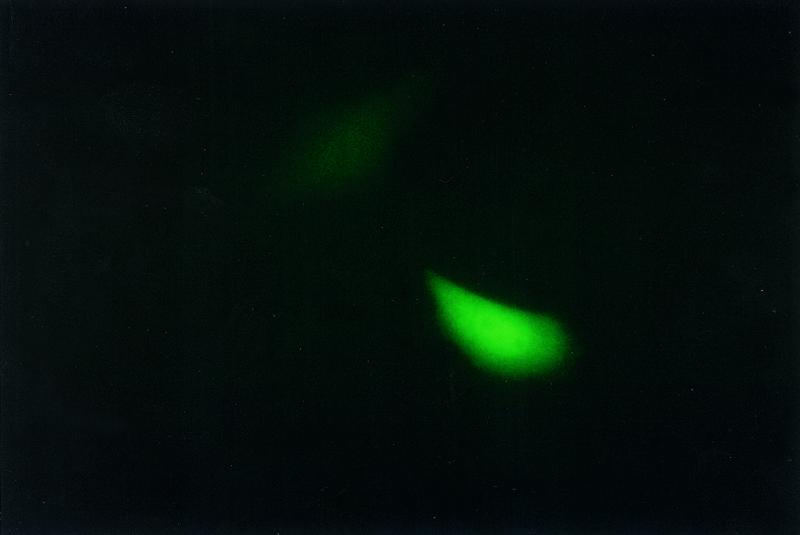
(A) The L1 element consists of the 5′- and 3′-UTRs and two ORFs. The EGFP retrotransposition cassette is cloned into the L1 3′-UTR in the antisense orientation. The cassette consists of the CMV immediate early promoter (pCMV), the EGFP gene disrupted by a sense orientation γ-globin intron (Intron) and the TK poly(A) signal (pA). The splice donor (SD) and splice acceptor (SA) sites of the intron are indicated. Cells only express EGFP when an L1 transcript containing the antisense EGFP marker undergoes splicing, reverse transcription and integration into chromosomal DNA. EGFP is then expressed from the pCMV promoter. (B) L1 elements tagged with the EGFP cassette are cloned into the pCEP-based mammalian expression vectors, which places a SV40 poly(A) signal (SV40pA) downstream of the EGFP-tagged L1. The pCEP-based vectors are able to replicate as episomes in HeLa cells by using the origin of replication for eukaryotic cells (OriP/EBNA). The vectors contain either the hygromycin or puromycin resistance genes. The pCEP-based constructs containing the tagged L1 elements were transfected into HeLa cells and antibiotic selection was begun 24 h post-transfection. After antibiotic selection was completed, the cells were analyzed by FACS. (C) Retrotransposition is detected by EGFP fluorescence under UV light. The cassette demonstrates near real time retrotransposition in a single cell as indicated in this photograph of fluorescent cells detected by fluorescence microscopy (400× total magnification) 3 days post-transfection with an EGFP-tagged L1RP element.
We cloned L1 elements containing the EGFP retrotransposition marker into the pCEP4 episomally replicating mammalian expression vector, which contains a hygromycin resistance gene, or into a pCEP-based vector in which the hygromycin resistance gene was replaced by the puromycin resistance gene. These constructs were then transfected into HeLa cells. Cells transfected with the L1 constructs were selected by applying the appropriate antibiotic (hygromycin or puromycin) 24 h post-transfection. After eliminating untransfected cells, we determined relative retrotransposition frequencies by FACS (Fig. 1B). We were able to detect fluorescent cells, presumably containing retrotransposition events, by microscopy as early as 48 h post-transfection (Fig. 1C).
We assessed whether the γ-globin intron was appropriately removed by splicing. First, we picked several independent EGFP-expressing colonies from the retrotransposition assay, expanded the colonies and isolated genomic DNA. Then we performed PCR using intron-flanking primers, which indicated that in every case the intron had been removed as expected (Fig. 2). We confirmed precise splicing of the γ-globin intron by sequencing several of the PCR products (data not shown).
Figure 2.
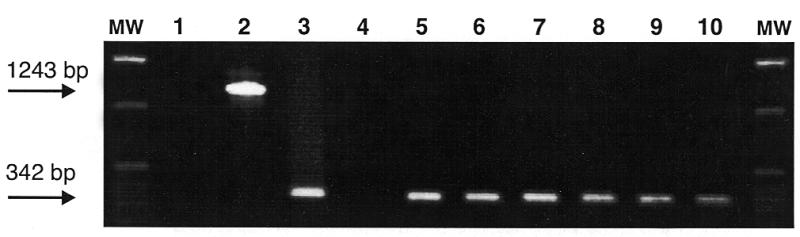
Genomic DNA from independent EGFP-expressing clones was isolated and used as template in PCR to determine if the γ-globin intron had been removed by splicing. The PCR products were separated on a 0.7% agarose gel containing ethidium bromide. A 342 bp product diagnostic for loss of the intron was detected in each clone (lanes 5–10) and from a control plasmid template containing EGFP without the γ-globin intron (lane 3). Lane 2 contains the expected 1243 bp PCR product from a control plasmid containing EGFP with the γ-globin intron. Lane 4 contains DNA from untransfected HeLa cells and lane 1 contains no template as negative controls. A 1 kb molecular mass size ladder (Gibco BRL) is indicated in the flanking lanes (MW).
Retrotransposition is not detected in cell culture during the first 48 h post-transfection, then proceeds at a continuous high rate for at least 16 days
We performed two types of experiments to determine retrotransposition kinetics in cell culture. In the first type, we used constructs encoding EGFP-tagged L1 elements and the hygromycin resistance gene. As observed by microscopy, untransfected cells were almost completely eliminated after 7 days of hygromycin selection. More than 99% of the remaining untransfected cells were excluded by live–dead gating, confirming elimination of untransfected cells by 8 days post-transfection. None of the untransfected control cells analyzed was fluorescent above the threshold. To sample time points earlier than 8 days post-transfection, we performed a second type of experiment using constructs encoding the EGFP-tagged L1 elements and the puromycin resistance gene. Untransfected cells were nearly completely eliminated by puromycin selection 3 days post-transfection and >98% of the remaining untransfected cells were excluded by live–dead gating. As before, none of the untransfected cells analyzed were fluorescent above the threshold. Using fluorescence microscopy, retrotransposition was not detected until 48 h post-transfection in any of the experiments. Fluorescent cells were detected between 48 and 72 h post-transfection among the cells transfected with any construct that contained the tagged L1RP or L1.3 elements.
Following the 48 h period of no detectable retrotransposition, a continuous high rate of retrotransposition was observed. In experiments using hygromycin selection, the false positive frequency ranged from 0.05 to 0.35%. The low false positive frequency indicates that we had set the threshold marker at an appropriate intensity level to exclude cells having low background autofluorescence. Cells transfected with pCEP4 (the expression vector containing no L1 element) or pL1RP(JM111)-EGFP (the expression vector containing a tagged L1 with a mutation known to eliminate retrotransposition) did not show a statistically significant difference in percent fluorescence above threshold, suggesting that either construct was an appropriate negative control for estimating the false positive frequency, presumably the result of autofluorescence, and strongly suggesting that events scored as positive represented authentic retrotransposition events and not recombination of a cDNA intermediate with genomic or episomal DNA.
EGFP was detectable by fluorescence microscopy in cells transfected with pCEP-EGFP as soon as 12 h post-transfection, indicating robust expression from the pCEP plasmid. After antibiotic selection and for the duration of the experiment, 94–100% of cells transfected with pCEP-EGFP were fluorescent above the threshold level, confirming sufficient antibiotic selection and indicating maintenance and expression of the pCEP4 plasmid.
The retrotransposition rate for each element tested was estimated by plotting the percent fluorescent cells exceeding the false positive frequency for each time point and calculating the slope of a line created by linear regression (Fig. 3A). In the hygromycin experiments, the estimated rate of retrotransposition for the L1RP element was 0.48% of transfected cells per day, while the estimated rate of retrotransposition of the L1.3 element was 3.4-fold lower at 0.14% of transfected cells per day.
Figure 3.

(A) Percent fluorescent cells exceeding the false positive frequency was plotted as a function of time for the hygromycin experiments. Each time point represents cells analyzed from three independent transfection wells. The error bars indicate one standard deviation in each direction. Sampling and analysis were performed at 8, 9, 11, 14, 16 and 18 days post-transfection. (B) Percent fluorescent cells exceeding the false positive frequency was plotted over time for the puromycin experiments. Each time point represents cells analyzed from four independent transfection wells. The error bars indicate one standard deviation in each direction. Sampling and analysis were performed at 3, 4, 5 and 6 days post-transfection. In both sets of experiments, retrotransposition rates were estimated from the slope of a line created by linear regression.
In the puromycin experiments, the false positive frequency ranged from 0.02 to 0.26%. The retrotransposition rate for each element was estimated as in the hygromycin experiments described above (Fig. 3B). In the puromycin experiments, the estimated rate of retrotransposition for the L1RP element was 0.60% of transfected cells per day and the estimated rate of retrotransposition of the L1.3 element was 2.3-fold lower at 0.26% of transfected cells per day.
DISCUSSION
Determination of retrotransposition kinetics in cultured cells
The EGFP assay can detect near real time retrotransposition in a single cell, allowing us to determine retrotransposition kinetics in cultured cells. Here we show a 48 h delay in the detection of retrotransposition followed by a continuous high rate of retrotransposition for at least 16 days. It is interesting that retrotransposition is not detected until at least 2 days post-transfection. The entire delay cannot be accounted for by the time required for plasmid transfection, plasmid replication or expression from the pCEP-based vectors because a majority of cells transfected with pCEP-EGFP are clearly fluorescent by 12 h post-transfection, indicating that EGFP rapidly accumulates to detectable levels when expressed from the pCEP episome. We cannot exclude the possibility that a single genomic copy of EGFP resulting from a retrotransposition event expresses at a very low level, requiring additional time for accumulation to a detectable threshold. However, we do not believe that this could account for a majority of the observed delay because low copy GFP expression and low intracellular GFP concentrations are easily and rapidly detected in other systems (24). Furthermore, a similar delay in retrotransposition is observed using a blasticidin deaminase retrotransposition cassette (J.Goodier, personal communication). When using the appropriate antibiotic selection, the blasticidin deaminase enzyme should be detected at lower intracellular concentrations than the GFP chromophore.
A significant portion of the delay may occur at some step during retrotransposition. Possible explanations for the delay are listed in order of their postulated occurrence during retrotransposition. (i) Regulation exerted at the transcriptional or post-transcriptional level, such as antisense RNA-mediated or double-stranded RNA-mediated interference (RNAi), could affect tagged L1 transcripts. RNA-mediated regulation might be overcome by excess accumulation of tagged L1 transcripts caused by overexpression from the L1 expression vector. RNA-mediated regulation has been demonstrated for both retrotransposons and transposons (25–28). (ii) The delay may reflect time required for translation of the L1 protein products and accumulation of retrotransposition intermediates. (iii) Retrotransposition-competent ribonucleoprotein complexes may require nuclear membrane breakdown during mitosis in order to gain access to the nucleus. Proteins with molecular weights >60 kDa cannot enter the nucleus by passive diffusion (for a review see 29). The putative 149 kDa ORF2 protein is required for retrotransposition (15) and therefore either traverses the nuclear pores by active transport or reaches the genomic DNA after nuclear membrane breakdown during mitosis. (iv) L1 integration into genomic DNA may require active DNA synthesis and therefore require passage through the cell cycle.
Determination of retrotransposition rates
The EGFP-based assay is a rapid and accurate method to determine relative retrotransposition rates among L1 elements in cultured cells. In this study, we show that the EGFP-based retrotransposition assay is sufficiently sensitive to differentiate retrotransposition rates between two L1 elements with similar activity, L1RP and L1.3. Taken together, the hygromycin and puromycin experimental results indicate that L1RP retrotransposes at a rate ~3-fold higher than the rate for L1.3. These results are consistent with findings from the neo retrotransposition assay, in which L1RP had ~2-fold greater activity than L1.3 when their transcription was driven by their endogenous promoters (23). The similarity in the measured relative retrotransposition rates between the hygromycin and puromycin experiments suggests that the EGFP assay can be used to measure relative retrotransposition rates accurately among L1 elements.
It is interesting that there is a detectable difference in the retrotransposition rates between the L1.3 and L1RP elements. These two elements are 99.6% identical at the nucleotide level and have only one amino acid difference in the predicted ORF1 protein and four amino acid differences in the predicted ORF2 protein. The amino acid difference between the L1.3 and L1RP predicted ORF1 proteins is Val251→Ala, which is polymorphic among known active human L1 elements. The amino acid differences between the L1.3 and L1RP predicted ORF2 proteins include Met485→Lys, Val760→Thr and Asp795→Glu, all of which are also polymorphic among active human L1 elements. The remaining ORF2 protein amino acid change is Asn5→Thr, which is not polymorphic among active human elements but is not conserved in L1 elements from other species. However, there are six nucleotide differences in the 5′-UTR, including a 4 bp deletion in the L1RP element. We are currently investigating the possibility that the 5′-UTR changes contribute to the difference in detectable retrotransposition rate between these similar elements.
Our assay may not measure absolute retrotransposition rates for several reasons. First, calculation of absolute rates requires the same rate of cell division and cell death among EGFP-expressing and non-expressing cells. EGFP may be toxic when expressed at high levels and create a disadvantage to cells that have had retrotransposition events. Second, EGFP expression resulting from a retrotransposition event is not entirely stable. We have found that cell lines expanded from a single EGFP-expressing cell will eventually contain cells that have lost fluorescence. Analysis of these cells should determine whether loss of fluorescence is due to elimination or mutation of the integrated EGFP marker or to a specific mechanism, such as methylation, that eliminates EGFP expression at the site of a retrotransposition event. Third, L1 elements frequently undergo 5′ truncation during the retrotransposition process (30). Truncations resulting in loss of the complete EGFP cassette cannot be scored in the EGFP assay. Fourth, retrotransposition may occur into an area of the genome in which the EGFP cassette is not expressed because of chromatin structure or proximity to negative regulatory elements. Lastly, we have set very stringent threshold markers for determining positive events and are excluding true positives that fluoresce at very low intensity.
All of the aforementioned reasons will cause an underestimation of absolute retrotransposition rate. We believe that our estimates are conservative on the low side. Therefore, retrotransposition from an episome in cell culture occurs at a very high rate. As many as one in 12 cells transfected with the L1RP construct scored positive 18 days post-transfection. This result is consistent with our best estimates from the neo retrotransposition assay, where roughly one in 35 cells transfected with the same L1 element scored positive after 20 days of retrotransposition (23).
An improved assay to determine relative retrotransposition frequency
The EGFP-based assay has several advantages over previous retrotransposition assays for determining relative retrotransposition frequency. First, retrotransposition frequencies can be measured much more rapidly. Estimates can be made by FACS analysis as soon as antibiotic selection is complete, in 3 days with puromycin selection or in 8 days with hygromycin selection. Second, cells without retrotransposition events are not killed with antibiotic selection in the EGFP assay, making it easy to obtain an accurate denominator for calculating retrotransposition frequency. Third, the EGFP-based assay is not susceptible to some sources of error that affect previous assays. For example, cells which split from a growing colony during feeding and reseed to form a new colony do not affect frequency calculations. Fourth, the EGFP assay uses fluorescence intensity as an objective threshold for scoring positive retrotransposition events. Assays which depend upon cell division and colony formation use a colony size threshold for scoring positive retrotransposition events. Therefore, the EGFP assay exhibits improved speed and accuracy compared to the previous assays.
Additional EGFP retrotransposition cassette applications
In addition to offering an improved method for determining retrotransposition frequencies, the EGFP assay can be used for a variety of novel applications. For example, we show the ability of the assay to determine retrotransposition kinetics and to determine relative retrotransposition rates. We do not yet know how the rate of retrotransposition from an episome in cell culture may differ from the rate of retrotransposition from a genomic element in vivo. However, the EGFP retrotransposition cassette is ideal for use in an animal model of retrotransposition which could address this question. Additional uses for the EGFP cassette include: (i) the study of retroelements in non-transformed, slowly dividing or non-dividing and non-adherent cell types; (ii) determination of the dependence of retrotransposition on cell cycle and nuclear membrane breakdown; (iii) use in a high throughput screen for activity of mutagenized retroelements; (iv) the study of loss of expression from new retrotransposition integration sites.
Acknowledgments
ACKNOWLEDGEMENTS
We thank B. Crenshaw for providing pOG44-Cre and J. Goodier for providing pCEP-puro. We also thank J. Goodier and J. Mayer for critical reading of the manuscript and the DNA sequencing core and cancer center flow cytometry and cell sorter core facilities at the University of Pennsylvania School of Medicine. H.H.K. and J.V.M. were supported by NIH grants. E.M.O. was supported by a Howard Hughes Medical Institute Pre-doctoral Fellowship.
REFERENCES
- 1.Smit A.F.A. (1999) Curr. Opin. Genet. Dev., 9, 657–663. [DOI] [PubMed] [Google Scholar]
- 2.Jurka J. (1997) Proc. Natl Acad. Sci. USA, 94, 1872–1877. [DOI] [PMC free article] [PubMed] [Google Scholar]
- 3.Kazazian H.H. Jr (1998) Curr. Opin. Genet. Dev., 8, 343–350. [DOI] [PubMed] [Google Scholar]
- 4.Schwahn U., Lanzer,S., Dong,J., Feil,S., Hinzmann,B., van Duijnhoven,G., Kirschner,R., Hemberger,M., Bergen,A.A., Rosenberg,T. et al. (1998) Nature Genet., 19, 327–332. [DOI] [PubMed] [Google Scholar]
- 5.Yoshida K., Nakamura,A., Yazaki,M., Ikeda,S. and Takeda,S. (1998) Hum. Mol. Genet., 7, 1129–1132. [DOI] [PubMed] [Google Scholar]
- 6.Meischl C., De Boer,M. and Roos,D. (1998) Eur. J. Haematol., 60, 349–350. [Google Scholar]
- 7.Sassaman D.M., Dombroski,B.A., Moran,J.V., Kimberland,M.L., Naas,T.P., DeBerardinis,R.J., Gabriel,A., Swergold,G.D. and Kazazian,H.H.,Jr (1997) Nature Genet., 16, 37–43. [DOI] [PubMed] [Google Scholar]
- 8.Burwinkel B. and Kilimann,M.W. (1998) J. Mol. Biol., 277, 513–517. [DOI] [PubMed] [Google Scholar]
- 9.Segal Y., Peissel,B., Renieri,A., de Marchi,M., Ballabio,A., Pei,Y. and Zhou,J. (1999) Am. J. Hum. Genet., 64, 62–69. [DOI] [PMC free article] [PubMed] [Google Scholar]
- 10.Moran J.V., DeBerardinis,R.J. and Kazazian,H.H.,Jr (1999) Science, 283, 1530–1534. [DOI] [PubMed] [Google Scholar]
- 11.Heidmann T., Heidmann,O. and Nicolas,J.-F. (1988) Proc. Natl Acad. Sci. USA, 85, 2219–2223. [DOI] [PMC free article] [PubMed] [Google Scholar]
- 12.Freeman J.D., Goodchild,N.L. and Mager,D.L. (1994) Biotechniques, 17, 46–52. [PubMed] [Google Scholar]
- 13.Heidmann O. and Heidmann,T. (1991) Cell, 64, 159–170. [DOI] [PubMed] [Google Scholar]
- 14.Maestre J., Tchenio,T., Dhellin,O. and Heidmann,T. (1995) EMBO J., 14, 6333–6338. [DOI] [PMC free article] [PubMed] [Google Scholar]
- 15.Moran J.V., Holmes,S.E., Naas,T.P., DeBerardinis,R.J., Boeke,J.D. and Kazazian,H.H.,Jr (1996) Cell, 87, 917–927. [DOI] [PubMed] [Google Scholar]
- 16.Naas T.P., DeBerardinis,R.J., Moran,J.V., Ostertag,E.M., Kingsmore,S.F., Seldin,M.F., Hayashizaki,Y., Martin,S.L. and Kazazian,H.H.,Jr (1998) EMBO J., 17, 590–597. [DOI] [PMC free article] [PubMed] [Google Scholar]
- 17.DeBerardinis R.J., Goodier,J.L., Ostertag,E.M. and Kazazian,H.H.,Jr (1998) Nature Genet., 20, 288–290. [DOI] [PubMed] [Google Scholar]
- 18.Curcio M.J. and Garfinkel,D.J. (1991) Proc. Natl Acad. Sci. USA, 88, 936–940. [DOI] [PMC free article] [PubMed] [Google Scholar]
- 19.Dupressoir A. and Heidmann,T. (1996) Mol. Cell. Biol., 16, 4495–4503. [DOI] [PMC free article] [PubMed] [Google Scholar]
- 20.Chalfie M., Tu,Y., Euskirchen,G., Ward,W.W. and Prasher,D.C. (1994) Science, 263, 802–805. [DOI] [PubMed] [Google Scholar]
- 21.DeBerardinis R.J. (1998) PhD thesis, University of Pennsylvania.
- 22.Dombroski B.A., Mathias,S.L., Nanthakumar,E., Scott,A.F. and Kazazian,H.H.,Jr (1991) Science, 254, 1805–1808. [DOI] [PubMed] [Google Scholar]
- 23.Kimberland M.L., Divoky,V., Prchal,J., Schwahn,U., Berger,W. and Kazazian,H.H.,Jr (1999) Hum. Mol. Genet., 8, 1557–1560. [DOI] [PubMed] [Google Scholar]
- 24.Amsterdam A., Lin,S., Moss,L.G. and Hopkins,N. (1996) Gene, 173, 99–103. [DOI] [PubMed] [Google Scholar]
- 25.Chaboissier M.-C., Bucheton,A. and Finnegan,D.J. (1998) Proc. Natl Acad. Sci. USA, 95, 11781–11785. [DOI] [PMC free article] [PubMed] [Google Scholar]
- 26.Jensen S., Gassama,M.-P. and Heidmann,T. (1999) Nature Genet., 21, 209–212. [DOI] [PubMed] [Google Scholar]
- 27.Tabara H., Sarkissian,M., Kelly,W.G., Fleenor,J., Grishok,A., Timmons,L., Fire,A. and Mello,C.C. (1999) Cell, 99, 123–132. [DOI] [PubMed] [Google Scholar]
- 28.Ketting R.F., Haverkamp,T.H.A., van Luenen,H.G.A.M. and Plasterk,R.H.A. (1999) Cell, 99, 133–141. [DOI] [PubMed] [Google Scholar]
- 29.Nigg E.A. (1997) Nature, 386, 779–787. [DOI] [PubMed] [Google Scholar]
- 30.Grimaldi G., Skowronski,J. and Singer,M.F. (1984) EMBO J., 3, 1753–1759. [DOI] [PMC free article] [PubMed] [Google Scholar]