


Abstract
Alternative splicing occurs in the C-terminal region of the p53 tumor suppressor gene between two alternative 3′ splice sites in intron 10. This alternative splicing event has been detected in murine cells, but not in rat or human tissues. In this paper, we have characterized the pattern of p53 alternative splicing in cell lines from five different species. Our results confirm that p53 alternative splicing is species-specific, being detected only in cell lines of rodent origin. Using transient transfection assays, we have established that the rat p53 gene undergoes efficient alternative splicing in both mouse and rat cell lines, thus demonstrating that it has all the necessary cis-acting sequences to be alternatively spliced. In contrast, we were unable to detect any usage of the human alternative 3′ splice site under the same experimental conditions. Thus, the low levels or absence of alternatively spliced p53 mRNA in rat and human cell lines seems to be the result of different mechanisms. Our results support the hypothesis that there are species-specific mechanisms implicated in the regulation of p53 activity.
INTRODUCTION
The p53 tumor suppressor gene plays a very important role in oncogenesis, as it is mutated in nearly 50% of most types of tumors (1,2). The p53 protein is involved in the G1/S and G2/M transitions of the cell cycle, in a pathway responsible for DNA damage repair and in the induction of apoptosis (3–6). After various forms of cellular stress such as DNA damage or hypoxia, p53 protein levels are greatly increased, mainly by protein stabilization (7–9). Following these augmented levels, p53 will send signals to downstream effectors which will ultimately lead to cell cycle arrest or apoptosis (8–10). The p53 protein can positively or negatively regulate the transcription of several cellular genes and binds directly to cellular and viral proteins (5). Furthermore, p53 is able to directly recognize damaged DNA (11–13) and to promote re-annealing of both DNA and RNA (14,15).
The p53 protein contains four functional domains, an N-terminal transcriptional activation region (amino acids 1–42), a proline-rich domain (amino acids 61–94) involved in growth suppression and apoptosis, a central sequence-specific DNA-binding domain (amino acids 102–292) and a C-terminal region (amino acids 293–393). The C-terminal region can be subdivided into a flexible linker, a tetramerization domain and a DNA and RNA annealing domain which can also bind single-stranded DNA without any sequence specificity (6). The C-terminal region of p53 plays a direct role in sensing damaged DNA and it has been suggested that this region allosterically regulates p53 DNA-binding activity, possibly by masking the DNA-binding region located in the central part of the molecule (3,5,6).
An alternative splicing event has been described in the murine p53 gene between exon 10 and two alternative 3′ splice sites, one located at the border of exon 11 (3′R) and the other (3′Cas) located 96 nt upstream of the regular 3′ splice site (16–18). The presence of a stop codon in the 96 nt insert from intron 10 results in production of a protein of 381 residues in which the last 26 amino acids of the regular p53 (p53R) are missing and are replaced by a 17 amino acid sequence of unknown function, unique to the alternatively spliced p53 (p53Cas) (18).
The p53R and p53Cas gene products have distinct biochemical activities and are functionally different. The p53Cas protein has constitutive sequence-specific DNA binding whereas the p53R protein requires activation for efficient DNA binding (19–21). While p53R has RNA and DNA annealing activities, p53Cas lacks these activities (15). It has also been reported that murine p53Cas induces apoptosis in myeloid cells, albeit with kinetics that are different from the p53R isoform (22). Finally, although both p53 isoforms can inhibit growth of cells lacking endogenous p53, endogenous p53R and p53Cas proteins respond to DNA damage with different kinetics of nuclear accumulation and efficiencies of binding to a p53 consensus DNA sequence (23).
p53Cas RNA has been detected in both murine cells lines and normal mouse tissues (17,18). Using a p53 antibody specific for the alternatively spliced form of p53, it has been shown that the p53Cas protein is preferentially expressed during the G2 phase of the cell cycle, in contrast to the regular p53 protein, which is preferentially expressed in G1 (18). In addition, p53Cas is differentially expressed in proliferating epidermal cells when compared to differentiating cultures (18) or at different stages of keratinocyte differentiation (24). The timing of p53Cas and p53R RNA and protein synthesis during the cell cycle could be important in p53 biochemical functions which are mediated by interaction between two protein products of the wild-type p53 gene (21). The marked increase in DNA-binding activity of p53Cas relative to p53R implies that a potential mechanism for activating p53 function in a cellular context could be by increasing the relative amount of p53Cas to p53R.
Recently, a more complex alternative splicing pattern generating four different isoforms in the C-terminal region of p73, a protein having substantial functional and structural similarity to p53, has also been described in the human p73 gene (25,26). Another closely related member of the p53 family, named p63, also exhibits a complex pattern of alternative splicing that is conserved between the murine and human genes in both the N- and C-terminal regions (27).
In this paper, we have characterized the alternative splicing pattern in the C-terminal region of the p53 gene from different cell lines and species and have used transient transfection assays to study the molecular basis for the difference observed in the alternative splicing pattern of the C-terminal region of the rat, murine and human p53 genes.
MATERIALS AND METHODS
DNA sequences
The DNA sequences have been deposited in GenBank under the following accession nos: mouse, AF190269; rat, AF190270; hamster, AF190271; gorilla, AF190272.
Cell lines
All the cell lines were grown in DMEM supplemented with 10% fetal bovine serum and an antibiotic/antimycotic mix (100 U/ml penicillin G, 100 µg/ml streptomycin, 0.25 µg/ml Fungizone) (Gibco), with the exception of the HeLa cell line, which was grown in RPMI 1640, and the CHO cell line, which was grown in α-MEM. Both the RPMI 1640 and α-MEM media were supplemented with 10% fetal bovine serum and an antibiotic/antimycotic mix (100 U/ml penicillin G, 100 µg/ml streptomycin, 0.25 µg/ml Fungizone) (Gibco).
Probes for RNase protection
Probe MT7C-E9The murine probe MT7C-E9 corresponding to the mouse p53Cas cDNA was generated by in vitro transcription on a PCR template containing the T7 RNA polymerase promoter region (28). The PCR template was generated by amplification of a p53Cas cDNA with oligonucleotides E9S1 (5′-AACCACTTGATGGAGAGTATTTCACC-3′) and T7Cas (5′-TAATACGACCACTATAGGGAAGGCTTGGAAGGCTCTAGGCTGGAGG-3′). The p53Cas cDNA was obtained by reverse transcription of cytoplasmic mRNA purified from the N2A cell line.
Probe MT7E-E9. The murine probe MT7E-E9 corresponding to the mouse p53R cDNA was generated by in vitro transcription on a PCR template containing the T7 RNA polymerase promoter region (28). The PCR template was generated by amplification of a p53R cDNA with oligonucleotides E9S1 (5′-AACCACTTGATGGAGAGTATTTCACC-3′) and T7E11A1 (5′-TAATACGACTCACTATAGGGTCAGTCTGAGTCAGGCCC-3′). The p53R cDNA was obtained by reverse transcription of cytoplasmic mRNA purified from the N2A cell line.
Probe HT7E-PuIThe human probe HT7E-PuI was generated by in vitro transcription on a PCR template containing the T7 RNA polymerase promoter region (28). The PCR template was generated by amplification of the plasmid pπp53 with oligonucleotides T7E11A1 (5′-TAATACGACTCACTATAGGGTCAGT- CTGAGTCAGGCCC-3′) and HPuInS1 (5′-GGTAAGGGAAGATTACGAGAC-3′).
Probes Mp53L and Rp53LThe mouse probe Mp53L and the rat probe Rp53L were generated by in vitro transcription with T3 RNA polymerase on plasmids pTEP Mp53L and pTEP Rp53L digested with NheI. A 181 nt BamHI–NheI fragment from phage λ was inserted between the p53 minigene and the SV40 polyadenylation signal of pTEP Mp53 to generate pTEP Mp53L and of pTEP Rp53 to generate pTEP Rp53L.
Probe Hp53BThe human probe Hp53B was generated by in vitro transcription with T3 RNA polymerase on plasmid pTEP Hp53 digested with BglII.
RNase protection of endogenous p53 mRNA from cell lines
Extraction of cytoplasmic RNA was done using the NP40/urea method as described previously (28). RNA hybridization was performed essentially as described previously (29). Hybridization was performed overnight at 55°C with the mouse probe MT7C-E9 for the mouse, rat and hamster cell lines and with the human probe HT7E-PuI for the human and monkey cell lines. Following hybridization, the RNA was digested with 50 U of RNase T1 and 0.05 µg of RNase A at 30°C for 1 h. The mouse MT7C-E9 and human HT7E-PuI RNA probes were synthesized by in vitro transcription with T7 RNA polymerase and radiolabeled with [32P]UTP as described previously (28).
RT–PCR analysis of RNA from cell lines
Cytoplasmic RNA from cell lines was extracted by the NP40/urea method (28). Reverse transcription with AMV reverse transcriptase was done at 42°C for 30 min, using the E11A7 oligonucleotide primer (5′-ACTTTCTTAGCCATTGTTTT-3′) for mouse, hamster and rat cell lines or the MPuA2 oligonucleotide primer (5′-AGACTGGCCCTTCTTGGTCTTCAGG-3′) for human and monkey cell lines. Following denaturation at 94°C for 1 min, PCR was performed for 30 cycles (94°C for 1 min, 65°C for 1 min), with a final incubation at 72°C for 2 min, using the primers E10S1 (5′-GTCTCGAGCGCTTCGAGATGTTC-3′) and MPuA2. PCR products were run on a 5% polyacrylamide gel with 0.5× TBE.
PCR amplification of the p53 exon 10–exon 11 region
The mouse p53 exon 10–exon 11 region was amplified by PCR from plasmid pM53R-18 containing the p53 gene from the CB7 cell line (30) using oligonucleotides E10S1 (5′-GTCTCGAGCGCTTCGAGATGTTC-3′) and E11A1 (5′-GGAA- GCTTCAGTCTGAGTCAGG-3′). PCR was performed for 30 cycles (94°C for 1 min, 55°C for 1 min). The human p53 exon 10–exon 11 region was amplified by PCR from the plasmid pπp53 containing the human p53 gene from human fetal liver (kindly provided by Dr L. Crawford, ICRF, London, UK) using oligonucleotides E10S1and E11A1. PCR was performed for 30 cycles (94°C for 1 min, 55°C for 1 min). The gorilla p53 exon 10–exon 11 region was amplified by PCR with oligonucleotides E10S3 (5′-TGTTCCGAGAGCTGAATGAGGCCT-3′) and E11A1, using gorilla genomic DNA (kindly provided by Dr G. Boissonneault, Université de Sherbrooke, Sherbrooke, Canada). PCR was performed for 40 cycles (94°C for 1 min, 50°C for 1 min, 72°C for 1 min). The rat p53 exon 10–exon 11 region was amplified by PCR with oligonucleotides E10S4 (5′-CG-CTTCGAGATGTTCCGGGAGCTGAAT-3′) and Rp53A1 (5′-GGACTAGCATTGTCTTGTCAGC-3′), using genomic DNA extracted from rat kidneys. PCR was performed for 40 cycles (94°C for 1 min, 60°C for 1 min, 72°C for 1.5 min). The hamster p53 intron 10–exon 11 region was amplified by PCR with oligonucleotides PuIn (5′-GGTGAAAGGGAGGATAAACTGA-3′) and E11A1, using genomic DNA extracted from hamster kidneys. PCR was performed for 40 cycles (94°C for 1 min, 60°C for 1 min, 72°C for 1.5 min).
DNA sequence analysis of PCR products
All the DNA sequences were determined using a Pharmacia sequencing kit (Pharmacia) and [35S]ATP. Oligonucleotides E10S1 and E11A1 contain, respectively, XhoI and HindIII restriction sites that were used to clone the PCR fragments into the plasmid pBluescript KS+ (Stratagene). The mouse p53 sequence (CB7) was determined from two independent plasmids (pMp53) generated from cloning of DNA fragments derived from two independent PCR reactions. The PCR fragments were digested with XhoI and HindIII and cloned into the plasmid pBluescript KS+ digested with XhoI and HindIII. The sequence was determined using the universal and reverse primers (Pharmacia) with the pMp53 plasmid and a derivative plasmid obtained by deletion of an internal NheI–XbaI fragment. The human p53 sequence was determined from a plasmid (pHp53) generated from cloning of a DNA fragment obtained by PCR. The DNA from the PCR reaction was digested with XhoI and HindIII and cloned into the plasmid pBluescript KS+ digested with XhoI and HindIII. The sequence was determined using the universal and reverse primers with pHp53 and derivative plasmids obtained by EcoRI–EcoRI and BglII–BamHI internal deletions. The gorilla p53 sequence was determined from a plasmid (pGop53) generated from cloning of a DNA fragment obtained by PCR. The DNA from the PCR reaction was cloned into the plasmid pBluescript SK+ digested with EcoRV. The sequence of the 3′-region was determined using the reverse primer with pGop53. The rat p53 sequence was determined by direct cycle sequencing of a PCR reaction from the rat p53 gene with oligonucleotides E10S4 and E11A1 on an Applied Biosystems 373A (University of Calgary Sequencing Services) and also from a plasmid (pRp53) generated from cloning of a DNA fragment obtained by PCR. DNA from the PCR reaction was cloned in the plasmid pBluescript KS+ digested with EcoRV. The sequence was determined using oligonucleotides E10S4 (5′-CGCTTCGAGATGTTCCGGGAGCTGAAT-3′), E11A1 and E11A4 (5′-GATCAAGGCTTGGAAGGCTCTAGGCTGGA-3′) with pRp53. The hamster p53 sequence was determined from a plasmid (pHap53) generated from cloning of a DNA fragment obtained by PCR. A DNA fragment from the PCR reaction was cloned in the plasmid pBluescript KS+ digested with EcoRV. The sequence was determined using the universal and reverse primers with pHap53.
p53 minigene expression vectors and transient transfection assays
The exon 10–exon 11 region of the mouse, rat and human p53 genes were inserted into the pTEP expression vector, a derivative of pCMVSV containing the cytomegalovirus (CMV) promoter region and the poly(A) signal from SV40 virus (kindly provided by Dr B. Chabot, Université de Sherbrooke, Sherbrooke, Canada) (31). In Figure 5A (lanes 1–3), cells were transfected with 2 µg of plasmid DNA and 4 µl of Fugene (Roche) according to the supplier’s recommendations. Cytoplasmic RNA was isolated 48 h after transfection by the NP40/urea method as described previously (28) and RNA samples were subjected to DNase I digestion. RNA hybridization was performed essentially as described (29). Cytoplasmic RNA and the Mp53L probe were hybridized at 50°C overnight. RNase digestion was performed with 100 U of RNase T1.
Figure 5.

RNase protection analysis of the alternative splicing pattern of the mouse, rat and human p53 gene in cell lines from different species after transient transfection. (A) Transfection of the murine neuroblastoma N2A cell line with murine p53 (Mp), rat p53 (Rp) or human p53 (Hp) expression vectors. The mouse p53 probe Mp53L was used in lanes 1–4 and the human p53 probe Hp53B was used in lane 5 (see Materials and Methods). C, control (non-transfected cell line); Exo, exogenous (transfected) p53 mRNA; Endo, endogenous p53 mRNA. (B) Transfection of the human Panc and N2A cell lines with the murine p53 expression vector (Mp). The mouse p53 cDNA probe MT7E-E9 is shown schematically. The protected fragments corresponding to the transfected (p53R Exo and p53C Exo) products are indicated. C, control (non-transfected cell line). (C) Transfection of the rat cell lines NBTII (NBT) and NRK with the mouse (Mp) and rat (Rp) p53 expression vectors. RNA in lanes 1 and 2 was protected with the mouse probe Mp53L. RNA in lanes 3 and 4 was protected with the rat p53 probe Rp53L (see Materials and Methods). Additional bands correspond to incomplete RNase digestion products.
In Figure 5A (lanes 4 and 5), cells were transfected with 2 µg of plasmid DNA and 4 µl of Fugene (Roche) according to the supplier’s recommendations. Cytoplasmic RNA was isolated 24 h after transfection by the NP40/urea method and subjected to DNase I digestion. RNA was hybridized overnight at 50°C with the Mp53L probe and digested with 100 U of RNase T1 (lane 4) or with the Hp53B probe and digested with 100 U of RNase T1 and 0.1 µg of RNase A (lane 5). In Figure 5B, cell were transfected with 2 µg of plasmid DNA and 4 µl of Dosper Liposomal Transfection Reagent (Boehringer) according to the supplier’s recommendations. Cytoplasmic RNA was isolated 48 h after transfection by the NP40/urea method and treated with DNase I. RNA was hybridized overnight at 50°C with the MT7E-E9 probe and digested with 100 U of RNase T1. In Figure 5C, cells were transfected with 2 µg of plasmid DNA and 4 µl of Fugene (Roche). Cytoplasmic RNA was isolated 24 h after transfection by the NP40/urea method and digested with DNase I. RNA was hybridized overnight at 50°C with the Mp53L probe (lanes 1 and 2) or with the Rp53L probe (lanes 3 and 4) and digested with 100 U of RNase T1.
RESULTS
Analysis of expression of the p53R and p53Cas isoforms in cell lines
As a first step in characterization of the alternative splicing event affecting the C-terminal region of the p53 gene (Fig. 1), we analyzed the levels of p53Cas and p53R mRNA in cell lines from five different species. To determine the relative frequency of utilization of the two alternative 3′ splice sites of the p53 gene, we analyzed the steady-state levels of mRNA of each type by RNase protection assays and by RT–PCR (Table 1). As shown by the RNase protection assay depicted in Figure 2A, although the ratio p53R:p53Cas varied between cell lines, the alternatively spliced p53 mRNA (p53Cas) was readily detected in all the murine cell lines tested. Quantification of the two murine isoforms by phosphorimaging indicated that p53Cas is expressed at levels varying between 2 and 26% of the p53R mRNA. Analysis of the expression of the two different p53 isoforms in rat cell lines also showed the presence of low (NRK cell line) to very low (FR3T3, IEC6, IEC6ras, NRK and NBTII cell lines) levels of p53Cas in these cell lines using the RNase protection assay or RT–PCR with incorporation of radiolabeled [32P]dCTP (Fig. 2). We were unable to detect any p53Cas in one monkey, two hamster and seven human cell lines despite the fact that we easily detected the p53R isoform in these cell lines (Fig. 2).
Figure 1.

Alternative splicing of the p53 tumor suppressor gene. (A) Diagrammatic representation of the p53 gene structure. (B) Alternative splicing pattern in the C-terminal region of the p53 gene with two alternative 3′ splice sites (3′Cas and 3′Reg) in intron 10.
Table 1. Cell lines tested for alternative splicing in the C-terminal region of p53 between exons 10 and 11.
| Species | Cell line | p53Cas |
|---|---|---|
| Mouse | N2A | +a,b |
| Balb/c | +a,b | |
| CB7 | +a,b | |
| DP28 | +a,b | |
| BNL | +a,b | |
| NIH 3T3 | +a,b | |
| P19 | +b | |
| Rat | NBT II | +/–a |
| NRK | +/–a,b | |
| IEC6 | +/–a,b | |
| IEC6ras | +/–a,b | |
| FR3T3 | +/–a,b | |
| Hamster | CHO | –b |
| BHK | –b | |
| Monkey | COS | –b |
| Human | Mia Paca | –a,b |
| Panc | –a,b | |
| MCF7 | –a,b | |
| MRC-5 | –a,b | |
| ECV-304 | –a,b | |
| HeLa | –a | |
| T47D | –b | |
| Jurkat | –b |
+, detected; +/–, low to very low levels; –, not detected.
aTested by RNase protection.
bTested by RT–PCR.
Figure 2.
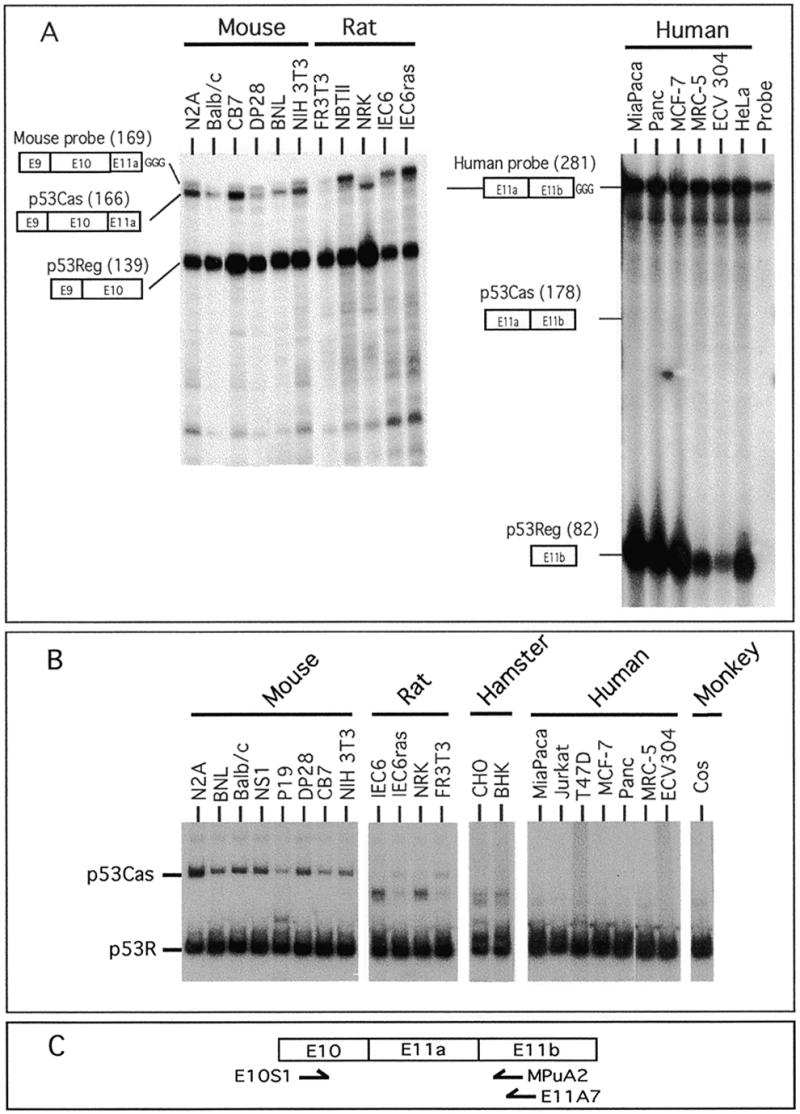
Analysis of p53 mRNA levels in cell lines. (A) Analysis of expression of the p53Cas and p53Reg mRNAs in different cell lines by RNase protection assay. The mouse (MT7C-E9) and human (H7E-PuI) probes used are depicted schematically (see Materials and Methods). The sizes of the protected fragments in nucleotides are indicated in parentheses. The 169 nt band located just above the p53Cas protected fragment (166 nt) represents the undigested probe. (B) Analysis of expression of the p53Cas and p53R mRNAs in different cell lines by RT–PCR. The identity of the amplified PCR fragment corresponding to the two p53 isoforms is indicated. The band located between the p53Cas and the p53R bands in some lanes corresponds to a spurious PCR artifact. (C) Diagrammatic representation of the p53 oligonucleotides used in the RT–PCR analysis shown above. Reverse transcription of cytoplasmic RNA was done using the E11A7 oligonucleotide primer for mouse, hamster and rat RNA or the MPuA2 oligonucleotide primer for human and monkey RNA. PCR amplification was performed using the primers E10S1 and MPuA2.
Sequence analysis of the p53 exon 10–exon 11 region from different species
To gain a better understanding of the differences observed in the p53R:p53Cas ratio between the different species analyzed above, we first analyzed the DNA sequence of the alternatively spliced p53 region to see whether cis-acting sequences could explain the observed differences. To do so, we amplified by PCR the region between exon 10 and exon 11 from cloned genomic fragments (murine and human p53 genes) or genomic DNA (gorilla, hamster and rat p53 genes) with p53-specific oligonucleotides (Fig. 3).
Figure 3.

Diagrammatic representation of the PCR amplification products used for DNA sequencing of the mouse, human, rat and hamster p53 exon 10–exon 11 region. The p53-specific oligonucleotides are indicated by arrows. The sizes of the PCR amplification products are shown below the oligonucleotides.
The region between exon 10 and exon 11 of the human p53 gene produced a PCR fragment of 1105 bp compared to PCR fragments of 778 and 884 bp for the murine and rat p53 genes, respectively. The hamster p53 gene was amplified with oligonucleotides located in intron 10 and exon 11 giving an amplification product of 293 nt (Fig. 3 and Materials and Methods).
Sequencing of an exon 10–exon 11 PCR fragment amplified from a plasmid containing part of human p53 was done to ensure that the amplified p53 fragment used to generate our human p53 expression vector did not suffer mutations in its 5′ and 3′ splicing signals during the process of PCR amplification. The human p53 DNA we obtained was shown to have a 5′ splice site and 3′ splicing signals identical to the splicing signals of the published human p53 gene (GenBank accession nos X54156 and U94788).
Similarly, we determined the sequence of the murine exon 10–exon 11 region from the erythroleukemic cell line CB7 (30). The DNA sequence of the mouse alternatively spliced 3′-region was found to be identical to the previously published sequence of this region (16). In addition, the sequence of the exon 10–exon 11 region of the murine p53 gene was determined from genomic DNA isolated from the Balb/c cell line. The sequence of the 5′ splice site and the alternatively spliced 3′-region of the p53 gene from the CB7 and Balb/c cell lines were found to be identical (M.Laverdière and A.Lavigueur, unpublished results). The complete DNA sequence of rat p53 intron 10 and the sequences of the hamster and gorilla p53 3′-region of intron 10 were also determined (Fig. 4).
Figure 4.

Sequence alignment of the mouse, rat, human, gorilla and hamster p53 exon 10–exon 11 region. To facilitate the alignment, sequences corresponding to the Alu element in the human p53 gene were deleted (Hp53ΔAlu). The 5′ splice site (5′SS), the alternative 3′ splice site (3′Cas) and the regular 3′ splice site (3′Reg) are indicated. The consensus GT dinucleotide at the 5′ splice site and the consensus AG dinucleotide at the 3′ splice sites are shown in lower case.
As determined by DNA sequence analysis, the size difference between the human and the rodent p53 genes is due to the presence of an Alu element present in intron 10 of the human gene. While the same region from the gorilla p53 gene was not sequenced completely, the size of the PCR amplification fragment (~1100 bp) and the very close evolutionary distance between these two species is consistent with the presence of an Alu element in intron 10 of the p53 gorilla gene. One peculiar feature of the murine and rat p53 genes is the presence of TGA/G triplet repeats in intron 10 of both genes. Two stretches of 10 and 14 triplets were found in the murine gene whereas a stretch of 20 repeats was present in the rat gene (Fig. 4).
Comparison of the homology between the murine, rat and human p53 intron 10 sequences showed 78% conservation of nucleotides between the murine and the rat gene, whereas only 42% of the nucleotides were identical between the mouse and human p53 intron 10 sequences, excluding the Alu element (Tables 2 and 3).
Table 2. Size of intron 10 in the mouse, rat and human p53 gene.
| Species | p53Cas intron (bp) | p53R intron (bp) |
|---|---|---|
| Mouse | 490 | 586 |
| Rat | 510 | 605 |
| Human ΔAlu | 635 | 729 |
| Human | 821 | 915 |
Table 3. Percentage of homology in intron 10 from the mouse, rat and human p53 gene.
| Intron | Rat p53R | Human p53R |
|---|---|---|
| Mouse p53R | 78% (471/605) | 42% (308/729) |
| Rat p53R | 42% (307/729) |
The comparison of the 5′ and 3′ splicing signals of the 3′Cas and the 3′R region among themselves and with consensus sequences revealed some interesting features. Although there was a 1 nt difference at position +3 between the murine and rat and human p53 5′ splice site, the exon 10 donor splice site from these three species matched the 5′ splice site consensus sequence gtRAGT (Fig. 4). Similarly, the 3′R splice site of human, rat and mouse did not deviate significantly from the consensus 3′ splice site Y(n)AG with the human 3′R splice site having a somewhat poorer match to the consensus than the murine and rat genes. The human 3′R polypyrimidine tract has a long stretch of 23 pyrimidines interrupted by two purines at positions –11 and –17, whereas the murine and rat polypyrimidine tracts contain only one purine at position –12. On the other hand, the 3′Cas splice site from the rat and murine genes showed a relatively short polypyrimidine tract of, respectively, 11 and 12 uninterrupted pyrimidines, whereas the human 3′Cas splice site showed a particularly poor pyrimidine stretch interrupted by several purines (Fig. 4).
We also sequenced a region covering the 3′ splicing signals of hamster and gorilla p53. The hamster 3′ splicing signals showed a very strong homology to the rat and murine p53 counterparts with the only difference being a purine inserted at position –11 of the 3′Cas site (Fig. 4). The sequence of the same region from gorilla showed that there was complete homology between the gorilla sequence and the human gene over the 180 nt shown in Figure 4, indicating that the p53Cas polypyrimidine stretch interrupted by several purines that was detected in human is identical in this closely related species.
We noted the presence of a fairly good potential branch site in the mouse, rat and hamster p53Cas splice site with the A residue of the branch site consensus sequence (YNYYRAY) located at position –15 from the AG. A potential branch site with complete homology to the branch site consensus sequence was found in the human and gorilla p53Cas site with the A residue located at position –22 from the 3′ splice site AG dinucleotide (Fig. 4).
It has been reported that the p53Cas mRNA encodes a protein with a stretch of 17 different amino acids in the C-terminal region (LQPRAFQALIKEESPNC) compared to the regular p53 protein (18). Comparison of the translated amino acid sequence in the alternatively spliced region shows that the putative rat peptide (LQPRTFQALIKKESPNC) is very well conserved, since both the mouse and rat regions encode a 17 amino acid peptide with only two amino acid differences. In contrast, the putative Cas-specific protein sequence encoded by the hamster gene comprises only eight amino acids (LHPRAFQT) that show partial homology with the mouse sequence. The hypothetical Cas-specific C-terminal region encoded by the human p53Cas region (LRPFKALVREKGHRPSHSCDVIFPPCFCLLQPPEVQKGSVYLPP) is even more divergent compared with the mouse sequence since the human p53 gene has the potential to encode a C-terminal region of 44 residues showing little homology with the murine sequence.
Analysis of the relative use of p53 alternative 3′ splice sites by transient transfection
Our analysis of the DNA sequencing data suggests that failure to use the p53Cas alternative splice site in the human gene could be due to its poor 3′ splice signal. On the other hand, the p53 rat gene may not use its Cas 3′ splice site in spite of a good 3′ splicing signal, possibly due to trans-acting factors. We decided to test the splicing potential of the Cas 3′ splice sites from the human, rat and mouse p53 genes by transfecting them into cell lines. The p53 splicing pattern was analyzed by RNase protection after transient transfection.
As shown in Figure 5A, transfection of the murine p53 expression vector into the murine N2A cell line readily led to the detection of exogenous p53Cas and p53R mRNAs. The production of a relatively similar p53Cas:p53R ratio from the transfected expression vector and the endogenous gene indicated that our minigene is sufficient for proper utilization of the 3′ alternatively spliced sites (Fig. 5A, lane 2). Also, we detected both p53 mRNAs from the expression vector containing the rat p53 gene when transfected into the same murine cell line (Fig. 5A, lanes 3 and 4), with a proportion of p53Cas mRNA significantly higher than in the rat cell lines analyzed in Figure 2. On the other hand, we were not able to detect any human p53Cas mRNA in the N2A cell line, in spite of the fact that the human p53R mRNA was easily detected, suggesting that the Cas 3′ splice site from the human p53 gene is intrinsically very weak or non-functional (Fig. 5A, lane 5).
We also transfected the Panc human cell line with the murine p53 expression vector. As a transfection control in this experiment, we used the murine N2A cell line (Fig. 5B, lanes 3 and 4). As shown in this figure, we easily detected the p53R and p53Cas mRNAs from the murine p53 expression vector when transfected in both of these cell lines.
To test the ability of a rat cell line to use a p53Cas 3′ splice site, we transfected two rat cell lines (NBTII and NRK) which both express low levels of endogenous p53Cas mRNA. The NBTII cell line was transfected with the murine p53 minigene whereas the NRK cell line was transfected with the rat p53 minigene. As shown in Figure 5, the p53R and p53Cas mRNAs produced from the murine p53 expression vector were easily detected when transfected into the NBTII cell line. The amount of p53Cas mRNA produced by splicing of the transcript encoded by the transfected vector (Fig. 5C, lane 2) was significantly higher than the p53Cas endogenous level observed in this rat cell line and the CB7 cell line (Fig. 2), suggesting that the rat NBTII cell line can utilize the Cas 3′ splice site from the mouse p53 gene. Following transfection of the NRK cell line with the rat p53 minigene, we also easily detected the p53R and p53Cas mRNAs produced from the rat p53 expression vector. Surprisingly, the amount of p53Cas mRNA produced by splicing of the transcript encoded by the transfected vector (Fig. 5C, lane 4) was significantly higher than the p53Cas endogenous level observed in this rat cell line (Fig. 2), suggesting that the low levels of endogenous rat p53Cas mRNA are not simply due to its p53Cas 3′ splice site, as suggested by the DNA sequence analysis.
DISCUSSION
Analysis of the expression of the p53R and p53Cas isoforms in cell lines
The results we have obtained from RNase protection and RT–PCR analysis of cell lines show a broad variation in the ratio of the p53 isoforms among cell lines and between species. Among the different murine cell lines derived from various tissues that we have analyzed, we have detected the presence of the p53Cas mRNA in all cases, albeit with considerable differences between cell lines. It is possible that these differences are due to the cell type or differentiation state of the cells analyzed. Previously, such tissue-specific variations were also reported from the analysis of murine whole tissues (32). It is also possible that in some cell lines other cis-acting sequences, such as splicing enhancers (33–37) or splicing silencers (38–49), might be mutated in the p53 gene. This possibility is currently being investigated.
Unlike Will and collaborators (32), we have detected small amounts of the p53Cas mRNA in some rat cell lines, indicating that the rat p53Cas 3′ splice site is used to some extent in these cell lines (Fig. 2). It is possible that the apparent discrepancy between their results and ours is due to technical differences such as the use of cell lines instead of whole tissues, in the experimental conditions used for the RT or PCR reactions or the amount of starting material. For instance, we used up to 50 µg of total RNA from some cell lines to obtain a good signal from the p53R mRNA, likely reflecting a very low level of p53 mRNA in these cell lines. However, it is clear that the level of p53Cas in the rat samples is indeed relatively low to almost undetectable. The physiological implications, if any, of such low levels of p53Cas mRNA remain to be determined.
Our analysis of eight different cell lines derived from various human tissues failed to detect any p53Cas mRNA in spite of the fact that we obtained a strong signal for the p53R mRNA. Similarly, we did not detect any p53Cas mRNA in the CHO or BHK hamster cell lines or the monkey Cos-1 cell line. Thus, based on our results and the results of other groups (17,32), the production of p53Cas mRNA is almost exclusively detected in tissues or cell lines of rodent origin.
Sequence analysis of the p53 exon 10–exon 11 region from different species
The human p53 sequence shows that the p53Cas 3′ splice site has a poor polypyrimidine tract, suggesting that the lack of p53Cas mRNA might be due, at least in part, to cis-acting sequences. In addition, the reading frame after the human p53Cas splice site is different from the rodent sequences, since the putative human p53Cas peptide is 44 amino acids long and with a sequence very different from its murine counterpart. These results suggest that the human gene has suffered several mutations in the p53Cas region during evolution, leading to inactivation of this 3′ splice site and production of the p53R mRNA only. The DNA sequence from the same 3′ region of the gorilla p53 gene is completely identical to the human sequence (Fig. 4), indicating that this sequence is not unique to the human p53 gene and making it highly unlikely that a sequencing error or a mutation in the parental pπp53 plasmid is responsible for the sequence differences.
The Cas 3′ splice site of the hamster p53 gene may represent an intermediate case, with a polypyrimidine tract poorer than the murine one but better than the human polypyrimidine tract. Although we would expect the hamster Cas 3′ splice site to be used rather weakly considering its splice site sequence, the splicing potential of this 3′ splice site remains to be established. Utilization of the hamster 3′ Cas splice site would lead to a putative hamster p53Cas-specific peptide with only eight amino acid residues that shows only limited homology to its murine counterpart, which has 17 amino acid residues.
Our DNA sequence analysis of the murine and rat p53 C-terminal region revealed that in spite of nearly identical 5′ and 3′ splicing signals, these two species use the p53Cas splice site quite differently. On the basis of sequence alone, it seems that the Cas splice site from the rat p53 gene should be functional. Furthermore, translation of the DNA segment encoding the putative rat p53Cas protein shows that the rat p53Cas protein should be identical in its C-terminal region to the murine p53Cas protein with the exception of two residues. These results suggest that although the rat p53 gene has the potential to encode a p53Cas protein very similar to the murine protein, regulation of p53 gene expression is different between these two species. This interpretation is supported by the observation that there are species-specific differences between the mouse and the rat p53 proteins in their phosphorylation (50), as discussed previously by others (32).
Although other genes are known to exhibit species-specific splicing patterns (51–57), it is somewhat surprising that a gene very well conserved in evolution like the p53 gene displays such behavior (58). In addition, a closely related member of the p53 gene family, named p63, shows a complex pattern of alternative splicing in both the C- and N-terminal regions which, unlike the p53 gene, is conserved between the mouse and human genes (27).
Analysis of the relative frequency of utilization of p53 alternative 3′ splice sites from different species by transient transfection
The rat p53 gene has all the cis-acting sequences required for efficient use of the Cas 3′ splice site because it is readily used when expressed in a murine cell line. In fact, relatively large amounts of rat p53Cas mRNA were also made in the NRK rat cell line expressing high levels of the transfected rat p53 minigene. We also observed good utilization of the mouse p53Cas 3′ splice site in the NBTII rat cell line. Because the rat NBTII and NRK cell lines normally produce small amounts of endogenous p53Cas mRNA, our results suggest that rat cells may contain a factor that prevents use of the endogenous p53Cas 3′ splice site. We propose that the better utilization of the rat Cas 3′ splice site in this situation may be due to a larger amount of RNA produced in the transfections compared to endogenous levels. The excess of pre-mRNA might deregulate the splicing machinery, possibly by titrating a limiting or a negatively acting splicing factor, thereby leading to higher levels of alternatively spliced transcripts. Although these results indicate that the levels of expression of the rat p53 pre-mRNA we have obtained are not physiological, since regulation of alternative 3′ splice site selection is lost, they nevertheless show that the rat p53 gene has all the necessary cis-acting sequences to be spliced in both murine and rat cells. Thus, the lack of utilization of the endogenous p53Cas 3′ splice site in rat cell lines cannot be attributed to intrinsically poor consensus 5′ and 3′ splicing signals or to the lack of trans-acting splicing factors needed to recognize and utilize this 3′ splice site. These results do not rule out the possibility that cis-acting sequences contained in the rat p53 minigene are involved in splice site selection.
Indeed, it is possible that cis-acting elements such as a splicing silencer are present in the rat p53 gene, but have a weaker activity or are absent in the mouse p53 gene. Alternatively, it is possible that a splicing silencer is functional in both the rat and mouse p53 genes but that the levels of a factor recognizing this element is lower in mouse cells. Further experiments with hybrid constructs between the rat and the mouse p53 minigenes should help to map and identify such putative control elements. The presence of this type of regulatory element in intron 10 of the p53 gene would be consistent with a titratable factor negatively regulating utilization of the rat p53Cas 3′ splice site and possibly the murine p53Cas 3′ splice site.
The observation that the human Panc cell line can produce an easily detectable level of p53Cas mRNA from the murine expression vector indicates that this human cell line has all the necessary splicing factors to generate p53Cas mRNA from a heterologous murine p53 pre-mRNA. We have been unable to detect the production of any human p53Cas mRNA in mouse cells in spite of the fact that we readily detected p53R mRNA produced from the transfected human p53 expression vector in these cells (Fig. 5). Also, we have been unable to detect the production of any human p53Cas mRNA in the rat NBTII cell line (data not shown), which is capable of producing large amounts of exogenous human p53R and easily detectable amounts of p53Cas mRNA from the transfected mouse and rat p53 expression vectors (Fig. 5C, lanes 2 and 4). In conjunction with the DNA sequencing data, these results are consistent with a human p53Cas splice site that is intrinsically weak or non-functional. Our results cannot rule out the presence of a very strong negative regulatory element in the human p53 splicing unit inhibiting utilization of the human p53Cas mRNA in its natural context. Although such an element could overwhelm the titration effect observed when large amounts of pre-mRNA are produced by transient transfection assays, this interpretation seems less likely. Again, hybrid constructs between the human and mouse p53 alternative splicing units should help resolve this issue.
Taken together, our results indicate that the mechanism of alternative splice site selection in the C-terminal region of the p53 gene varies according to the species and that although the human and rat p53 genes produce low or undetectable levels of p53Cas mRNA they seem to reach that goal by different means. Whereas the rat p53Cas 3′ splice site is functional, but possibly repressed by a titratable factor, the human p53Cas 3′ splice site appears to be intrinsically weak or non-functional.
It has been reported that splicing regulation of the alternative exon 6A is lost when rat recipient cells are transfected with a chicken β-tropomyosin minigene, suggesting that the process of inclusion of alternative exons involves regulatory elements and trans-acting factors (59). In another study, the same group also reported that the differences in splicing regulation of the β-tropomyosin gene observed between the rat and chicken genes could be attributed to differences in the nucleotide sequences at the 5′ splice site, in the composition of the polypyrimidine tract and to the presence of an intronic splicing enhancer in exon 6A (57). These results are consistent with our observations and with the presence of other putative splicing regulatory elements that may be overridden by overexpression of the pre-mRNA during a transient transfection assay.
Our results also indicate the presence of negative cis-acting regulatory sequences in the p53 minigene that may be recognized by a titratable factor. A similar titration effect leading to lack of regulation in the inclusion of exon IIIb of the FGF-R2 receptor was recently described and is consistent the interpretation of our data (60). Identification of the cis-acting sequences and trans-acting factors responsible for the differences observed in the splicing pattern between the mouse, rat and human p53 genes will help to further clarify the mechanisms affecting splice site selection.
Acknowledgments
ACKNOWLEDGEMENTS
We are grateful to Drs B. Chabot and D. Gibson for comments on the manuscript. This work was supported by a grant from the National Sciences and Engineering Research Council of Canada. A.L. was supported by a scholarship from the Fonds de Recherches en Santé du Québec. M.L. is supported by a studentship from the Fonds pour la Formation de Chercheurs et l’Aide à la Recherche.
DDBJ/EMBL/GenBank accession nos AF190269–AF190272
REFERENCES
- 1.Hollstein M., Shomer,B., Greenblatt,M., Soussi,T., Hovig,E., Montesano,R. and Harris,C.C. (1996) Nucleic Acids Res., 24, 141–146. [DOI] [PMC free article] [PubMed] [Google Scholar]
- 2.Greenblatt M.S., Bennett,W.P., Hollstein,M. and Harris,C.C. (1994) Cancer Res., 54, 4855–4878. [PubMed] [Google Scholar]
- 3.Ko L.J. and Prives,C. (1996) Genes Dev., 10, 1054–1072. [DOI] [PubMed] [Google Scholar]
- 4.Gottlieb T.M. and Oren,M. (1996) Biochim. Biophys. Acta, 1287, 77–102. [DOI] [PubMed] [Google Scholar]
- 5.Levine A.J. (1997) Cell, 88, 323–331. [DOI] [PubMed] [Google Scholar]
- 6.Giaccia A.J. and Kastan,M.B. (1998) Genes Dev., 12, 2973–2983. [DOI] [PubMed] [Google Scholar]
- 7.Kastan M.B. (1996) Bioessays, 18, 617–619. [DOI] [PubMed] [Google Scholar]
- 8.Lane D.P. and Hall,P.A. (1997) Trends Biochem. Sci., 22, 372–374. [DOI] [PubMed] [Google Scholar]
- 9.Prives C. (1998) Cell, 95, 5–8. [DOI] [PubMed] [Google Scholar]
- 10.Sherr C.J. (1998) Genes Dev., 12, 2984–2991. [DOI] [PubMed] [Google Scholar]
- 11.Reed M., Woelker,B., Wang,P., Wang,Y., Anderson,M.E. and Tegtmeyer,P. (1995) Proc. Natl Acad. Sci. USA, 92, 9455–9459. [DOI] [PMC free article] [PubMed] [Google Scholar]
- 12.Lee S., Elenbaas,B., Levine,A. and Griffith,J. (1995) Cell, 81, 1013–1020. [DOI] [PubMed] [Google Scholar]
- 13.Jayaraman L. and Prives,C. (1995) Cell, 81, 1021–1029. [DOI] [PubMed] [Google Scholar]
- 14.Oberosler P., Hloch,P., Ramsperger,U. and Stahl,H. (1993) EMBO J., 12, 2389–2396. [DOI] [PMC free article] [PubMed] [Google Scholar]
- 15.Wu L., Bayle,J.H., Elenbaas,B., Pavletich,N.P. and Levine,A.J. (1995) Mol. Cell. Biol., 15, 497–504. [DOI] [PMC free article] [PubMed] [Google Scholar]
- 16.Arai N., Nomura,D., Yokota,K., Wolf,D., Brill,E., Shohat,O. and Rotter,V. (1986) Mol. Cell. Biol., 6, 3232–3239. [DOI] [PMC free article] [PubMed] [Google Scholar]
- 17.Han K.A. and Kulesz-Martin,M.F. (1992) Nucleic Acids Res., 20, 1979–1981. [DOI] [PMC free article] [PubMed] [Google Scholar]
- 18.Kulesz-Martin M.F., Lisafeld,B., Huang,H., Kisiel,N.D. and Lee,L. (1994) Mol. Cell. Biol., 14, 1698–1708. [DOI] [PMC free article] [PubMed] [Google Scholar]
- 19.Bayle J.H., Elenbaas,B. and Levine,A.J. (1995) Proc. Natl Acad. Sci. USA, 92, 5729–5733. [DOI] [PMC free article] [PubMed] [Google Scholar]
- 20.Wolkowicz R., Peled,A., Elkind,N.B. and Rotter,V. (1995) Proc. Natl Acad. Sci. USA, 92, 6842–6846. [DOI] [PMC free article] [PubMed] [Google Scholar]
- 21.Wu Y., Liu,Y., Lee,L., Miner,Z. and Kulesz-Martin,M. (1994) EMBO J., 13, 4823–4830. [DOI] [PMC free article] [PubMed] [Google Scholar]
- 22.Almog N., Li,R., Peled,A., Schwartz,D., Wolkowicz,R., Goldfinger,N., Pei,H. and Rotter,V. (1997) Mol. Cell. Biol., 17, 713–722. [DOI] [PMC free article] [PubMed] [Google Scholar]
- 23.Wu Y., Huang,H., Miner,Z. and Kulesz-Martin,M. (1997) Proc. Natl Acad. Sci. USA, 94, 8982–8987. [DOI] [PMC free article] [PubMed] [Google Scholar]
- 24.Rehberger P.A., Richter,K.H., Schwartz,D., Goldfinger,N., Oskato,R., Almog,N., Marks,F. and Rotter,V. (1997) Cell Growth Differ., 8, 851–860. [PubMed] [Google Scholar]
- 25.Kaghad M., Bonnet,H., Yang,A., Creancier,L., Biscan,J.C., Valent,A., Minty,A., Chalon,P., Lelias,J.M., Dumont,X., Ferrara,P., McKeon,F. and Caput,D. (1997) Cell, 90, 809–819. [DOI] [PubMed] [Google Scholar]
- 26.De Laurenzi V., Costanzo,A., Barcaroli,D., Terrinoni,A., Falco,M., Annicchiarico-Petruzzelli,M., Levrero,M. and Melino,G. (1998) J. Exp. Med., 188, 1763–1768. [DOI] [PMC free article] [PubMed] [Google Scholar]
- 27.Yang A., Kaghad,M., Wang,Y., Gillett,E., Fleming,M.D., Dotsch,V., Andrews,N.C., Caput,D. and McKeon,F. (1998) Mol. Cell, 2, 305–316. [DOI] [PubMed] [Google Scholar]
- 28.Chabot B. (1994) In Higgins,S.J. and Hames,B.D. (eds), RNA Processing—A Practical Approach. IRL, Oxford, UK, Vol. I, pp. 1–29.
- 29.Melton D.A., Krieg,P.A., Rebagliati,M.R., Maniatis,T., Zinn,K. and Green,M.R. (1984) Nucleic Acids Res., 12, 7035–7056. [DOI] [PMC free article] [PubMed] [Google Scholar]
- 30.Lavigueur A., Maltby,V., Mock,D., Rossant,J., Pawson,T. and Bernstein,A. (1989) Mol. Cell. Biol., 9, 3982–3991. [DOI] [PMC free article] [PubMed] [Google Scholar]
- 31.Yang X., Bani,M.R., Lu,S.J., Rowan,S., Ben-David,Y. and Chabot,B. (1994) Proc. Natl Acad. Sci. USA, 91, 6924–6928. [DOI] [PMC free article] [PubMed] [Google Scholar]
- 32.Will K., Warnecke,G., Bergmann,S. and Deppert,W. (1995) Nucleic Acids Res., 23, 4023–4028. [DOI] [PMC free article] [PubMed] [Google Scholar]
- 33.Horowitz D.S. and Krainer,A.R. (1994) Trends Genet., 10, 100–106. [DOI] [PubMed] [Google Scholar]
- 34.Valcárcel J. and Green,M.R. (1996) Trends Biochem. Sci., 21, 296–301. [PubMed] [Google Scholar]
- 35.Manley J.L. and Tacke,R. (1996) Genes Dev., 10, 1569–1579. [DOI] [PubMed] [Google Scholar]
- 36.Black D.L. (1995) RNA, 1, 763–771. [PMC free article] [PubMed] [Google Scholar]
- 37.Chabot B. (1996) Trends Genet., 12, 472–478. [DOI] [PubMed] [Google Scholar]
- 38.Amendt B.A., Simpson,S.B. and Stoltzfus,C.M. (1995) J. Virol., 69, 5068–5076. [DOI] [PMC free article] [PubMed] [Google Scholar]
- 39.Chan R.C. and Black,D.L. (1997) Mol. Cell. Biol., 17, 4667–4676. [DOI] [PMC free article] [PubMed] [Google Scholar]
- 40.Chen C.D., Kobayashi,R. and Helfman,D.M. (1999) Genes Dev., 13, 593–606. [DOI] [PMC free article] [PubMed] [Google Scholar]
- 41.Cook C.R. and McNally,M.T. (1999) J. Virol., 73, 2394–2400. [DOI] [PMC free article] [PubMed] [Google Scholar]
- 42.Del Gatto-Konczak F., Olive,M., Gesnel,M.C. and Breathnach,R. (1999) Mol. Cell. Biol., 19, 251–260. [DOI] [PMC free article] [PubMed] [Google Scholar]
- 43.Gooding C., Roberts,G.C. and Smith,C.W. (1998) RNA, 4, 85–100. [PMC free article] [PubMed] [Google Scholar]
- 44.Hibbert C.S., Gontarek,R.R. and Beemon,K.L. (1999) RNA, 5, 333–343. [DOI] [PMC free article] [PubMed] [Google Scholar]
- 45.Kanopka A., Mühlemann,O. and Aküsjarvi,G. (1996) Nature, 381, 535–538. [DOI] [PubMed] [Google Scholar]
- 46.McNally L.M. and McNally,M.T. (1999) J. Virol., 73, 2385–2393. [DOI] [PMC free article] [PubMed] [Google Scholar]
- 47.Si Z.H., Rauch,D. and Stoltzfus,C.M. (1998) Mol. Cell. Biol., 18, 5404–5413. [DOI] [PMC free article] [PubMed] [Google Scholar]
- 48.Staffa A., Acheson,N.H. and Cochrane,A. (1997) J. Biol. Chem., 272, 33394–33401. [DOI] [PubMed] [Google Scholar]
- 49.Zheng Z.M., Huynen,M. and Baker,C.C. (1998) Proc. Natl Acad. Sci. USA, 95, 14088–14093. [DOI] [PMC free article] [PubMed] [Google Scholar]
- 50.Patschinsky T., Knippschild,U. and Deppert,W. (1992) J. Virol., 66, 3846–3859. [DOI] [PMC free article] [PubMed] [Google Scholar]
- 51.Renshaw J., King-Underwood,L. and Pritchard-Jones,K. (1997) Genes Chromosom. Cancer, 19, 256–266. [DOI] [PubMed] [Google Scholar]
- 52.Mollat P., Fournier,A., Yang,C.Z., Alsat,E., Zhang,Y., Evain-Brion,D., Grassi,J. and Thang,M.N. (1994) J. Cell Sci., 107, 427–435. [DOI] [PubMed] [Google Scholar]
- 53.Conboy J.G., Cox,T.C., Bottomley,S.S., Bawden,M.J. and May,B.K. (1992) J. Biol. Chem., 267, 18753–18758. [PubMed] [Google Scholar]
- 54.Reddy R.S. and Swarup,G. (1995) DNA Cell Biol., 14, 1007–1015. [DOI] [PubMed] [Google Scholar]
- 55.Ito M., Iwata,N., Taniguchi,T., Murayama,T., Chihara,K. and Matsui,T. (1994) Cell Growth Differ., 5, 1127–1135. [PubMed] [Google Scholar]
- 56.Laurell H., Grober,J., Vindis,C., Lacombe,T., Dauzats,M., Holm,C. and Langin,D. (1997) Biochem. J., 328, 137–143. [DOI] [PMC free article] [PubMed] [Google Scholar]
- 57.Pret A.M. and Fiszman,M.Y. (1996) J. Biol. Chem., 271, 11511–11517. [DOI] [PubMed] [Google Scholar]
- 58.Soussi T. and May,P. (1996) J. Mol. Biol., 260, 623–637. [DOI] [PubMed] [Google Scholar]
- 59.Balvay L., Pret,A.M., Libri,D., Helfman,D.M. and Fiszman,M.Y. (1994) J. Biol. Chem., 269, 19675–19678. [PubMed] [Google Scholar]
- 60.Carstens R.P., McKeehan,W.L. and Garcia-Blanco,M.A. (1998) Mol. Cell. Biol., 18, 2205–2217. [DOI] [PMC free article] [PubMed] [Google Scholar]