

Abstract
Local adaptation is considered to be the result of fitness trade-offs for particular phenotypes across different habitats. However, it is unclear whether such phenotypic trade-offs exist at the level of individual genetic loci. Local adaptation could arise from trade-offs of alternative alleles at individual loci or by complementary sets of loci with different fitness effects of alleles in one habitat but selective neutrality in the alternative habitat. To evaluate the genome-wide basis of local adaptation, we performed a field-based quantitative trait locus (QTL) mapping experiment on recombinant inbred lines (RILs) created from coastal perennial and inland annual races of the yellow monkeyflower (Mimulus guttatus) grown reciprocally in native parental habitats. Overall, we detected 19 QTLs affecting one or more of 16 traits measured in two environments, most of small effect. We identified 15 additional QTL effects at two previously identified candidate QTLs [DIVERGENCE (DIV)]. Significant QTL by environment interactions were detected at the DIV loci, which was largely attributable to genotypic differences at a single field site. We found no detectable evidence for trade-offs for any one component of fitness, although DIV2 showed a trade-off involving different fitness traits between sites, suggesting that local adaptation is largely controlled by non-overlapping loci. This is surprising for an outcrosser, implying that reduced gene flow prevents the evolution of individuals adapted to multiple environments. We also determined that native genotypes were not uniformly adaptive, possibly reflecting fixed mutational load in one of the populations.
Keywords: genetic trade-offs, local adaptation, Mimulus, quantitative trait locus mapping, reciprocal transplant
Introduction
It is thought that much of the phenotypic divergence among populations within a species can be attributed to local adaptation to different ecological conditions (Dobzhansky 1951). While there is ample evidence for local adaptation among natural populations (reviewed by Schluter 2000; Kawecki & Ebert 2004; Hereford 2009), little is known about the fitness effects of particular loci across complex natural habitats. Local adaptation is widely considered to be the result of fitness trade-offs of particular phenotypes across habitats (Futuyma & Moreno 1988; Thompson 1994). However, it is unclear whether or not such trade-offs exist at the level of the genetic locus. Local adaptation could theoretically arise from allelic trade-offs at individual loci (i.e. antagonistic pleiotropy), with alleles in their native habitat having higher fitness than foreign alleles (Hedrick 1986; Linhart & Grant 1996; Kawecki & Ebert 2004; Roff & Fairbairn 2007). Alternatively, local adaptation could be caused by multiple independent loci, where native alleles at some loci are favoured over non-native alleles in one habitat and these alleles are selectively equivalent in the alternate habitat (i.e. conditional neutrality). Organismal level trade-offs could still occur however if other loci show the opposite pattern across habitats (Weinig et al. 2003; Verhoeven et al. 2004; Gardner & Latta 2006; Lowry et al. 2009). This latter pattern might only be expected to occur between populations linked by little or no migration, as even modest rates of gene flow and recombination would be expected to facilitate the homogenization of the populations, with fixation of the conditionally beneficial alleles.
Coastal perennial and inland annual ecological races of the yellow monkeyflower, Mimulus guttatus, are an ideal system to study the genetic basis of local adaptation. Previous studies have consistently shown that coastal and inland populations of M. guttatus are locally adapted to their respective habitats through a suite of phenotypic differences (Hall & Willis 2006; Lowry et al. 2008, 2009). Inland annual populations are locally adapted through early flowering to escape the onset of summer seasonal drought, whereas the more slowly growing perennials transplanted into inland habitats die before flowering (Hall & Willis 2006; Lowry et al. 2008). Persistent summer fog and lower temperatures along the Pacific Ocean allow coastal populations to grow to a much larger size before flowering than transplanted annual plants, ultimately resulting in substantially greater seed set in the first year and survival over multiple years (Hall & Willis 2006; Lowry et al. 2008). While coastal perennials can persist over at least several years, they face other stresses, such as oceanic salt spray, to which they are also locally adapted (Lowry et al. 2008, 2009). Previously, we found that three known salt tolerance quantitative trait loci (QTLs) have locally adapted fitness effects in coastal habitats, while there is no difference in fitness between genotypes at these loci at inland habitats (Lowry et al. 2009). However, local adaptation in this system involves more traits than salt tolerance (Hall & Willis 2006; Lowry et al. 2008).
In order to evaluate the genome-wide basis of local adaptation between these ecological races and to determine whether previously identified large effect, highly pleiotropic QTLs are involved, we combined a reciprocal transplant experiment with QTL mapping using genetically diverse hybrid recombinant inbred lines (RILs) created from an annual parent originating from Iron Mountain in Oregon’s western Cascades (IM) and a perennial parent from Oregon Dunes National Recreation Area along the Pacific coast (DUN). First we ask, what is the genetic architecture of phenotypic and fitness traits across habitats and genetic backgrounds? For example, are native alleles locally adaptive? We have clear evidence from a previous reciprocal transplant study that the parents of the RILs are, indeed, locally adapted, yet we have little understanding of whether many genes contribute to local adaptation and whether or not local alleles are always favoured. Second, we ask whether there is evidence that trade-offs at individual loci can contribute to local adaptation. More specifically, our study aims to understand whether or not the same or different set of genetic loci contribute to local adaptation in the different habitats.
Materials and methods
Generation of experimental hybrid and parental plants
We previously generated recombinant inbred lines (RILs) from reciprocal crosses between the inbred line IM62 (assembled whole genome sequence of this line is available at http://www.phytozome.net/mimulus) and a single outbred, field-collected DUN individual, as detailed in Hall & Willis (2006). We created RILs instead of other classes of hybrids such as F2s so that we could evaluate the performance of diverse sets of genetically identical hybrids in each environment and to map QTLs contributing to local adaptation. We initially began with 840 RILs, but most (~77%) lines became extinct for random or genetic reasons due to the extended period of inbreeding, resulting in 191 RILs. Each RIL was propagated by self-fertilization and single-seedling descent for three to seven generations (depending on the line), with expected homozygosity of the final RILs averaging 96.2% and ranging from 87.5% to 99.2%. Because the RILs may suffer from inbreeding depression, we did not use them directly in the field experiments for fitness assessment. Instead, we back-crossed each RIL as the female parent to unrelated Parental Inbred Lines (PILs) derived from the IM and DUN populations (as described in detail in Hall & Willis 2006) to produce genetically uniform, outbred BC-IM and BC-DUN populations (Fig. S1, Supporting Information). These backcross populations were used for field experiments. The BC-IM and BC-DUN classes of RILs differ significantly for all traits measured in the field that were used in this study (Hall & Willis 2006), so we treat them separately for all analyses in this study.
Reciprocal transplant design
The experimental design and field monitoring are previously described in detail (Hall & Willis 2006). Briefly, 1146 total seedlings from BC-IM and BC-DUN classes (191 × 3 replicates × 2 BC-types) were transplanted into the Cascades (near Iron Mountain) and Dunes field sites on 31 May and 1 June 2003, respectively. On the day the first flower opened on an individual plant, we recorded the date and we measured corolla width, corolla tube length, leaf width and stem thickness. We also measured plant height, rosette diameter, total leaf number, total flower number and survival weekly until plants died, into 2004 for some plants at the Dunes site. Large plant and flower size have been shown to be selectively advantageous at both sites (Hall & Willis 2006). Stolons were counted (Dunes site only) and seeds from each plant were collected and counted in year 1 (2003). Total seed production for year 2 (for those who survived to year 2) was estimated based on the number of seeds produced per flower in year 1 multiplied by the total number of flowers produced per plant in year 2. For those few individuals that only produced seeds in year 2, we used the average number of seeds produced per flower for their genotypic class (i.e. BC-DUN) to estimate their year 2 fecundity. Fitness components for individual plants included survival to flowering, total flower number, seed set, survival in year 1 and year 2 (Dunes site only) and overall fitness (λ). The phenotypic traits measured contribute to lifetime fitness for these organisms and were included to represent different critical phases of the plants’ life-history. For example, in M. guttatus, large flower size has been shown to be more attractive to pollinators than small flower size (Martin 2004), thereby increasing fitness; and larger plants may be more likely to survive to reproduce in subsequent years, particularly at the Dunes site. Although many of the phenotypic traits were normally distributed, fitness traits were not (i.e. many zero values). Data transformations are not suitable for fitness characters because of the way they treat zero values.
Because annual and perennial plants may differ in the traits that contribute to fitness, we used a composite measure of fitness to better compare each site. We estimated , the growth rate of a population where all individuals are equivalent to the ith individual (McGraw & Caswell 1996). At the Cascades, was simply equivalent to each individual plant’s fecundity in year 1 (F1), as none of the plants survived to year 2. Plants that died before setting seed were scored as = 0. At the Dunes, because some plants survived for more than 1 year, we also scored survival until the end of year 1 (P1) where plants that lived were coded as 1 and plants that died as 0, fecundity in year one (F1), survival until the end of year 2 (P2), and fecundity in year 2 (F2) in a stage-classified population matrix A in the equation,
| (1) |
The population vector is
| (2) |
where is the number of new seeds at the post-breeding census and is the number of 1-year-old individuals at time . We have no estimates of seed survival or recruitment success. The projection matrix is
| (3) |
This matrix was used to estimate the dominant eigen-value, , or the growth rate of a population with characteristics identical to the ith individual. We assumed that was equal to zero for all plants, otherwise each plant that survived until year 2 would be immortal. We provided sample sizes for all traits measured in Table S1 (Supporting Information).
Linkage map construction
We constructed a linkage map for this RIL population (N = 186) using joinmap (Stam 1993) at 189 EST markers, as explained in detail in Lowry et al. (2009). The linkage map spans 1394.4 cM Haldane and includes 14 linkage groups, which is consistent with previous mapping and cytogenetic studies of M. guttatus (Fishman et al. 2001, 2008; Hall & Willis 2005). The RILs used to create the linkage map were later-generation plants than those used for creation of BC-RILs in this experiment and genotypes were assumed to be the same.
Quantitative trait locus mapping
Genome-wide QTL analysis.
We mapped QTLs for single traits using composite interval mapping (CIM; Zeng 1993, 1994) in QTL Cartographer v. 1.17 (Basten et al. 2002) and QTL Cartographer Windows 2.0 (Wang et al. 2005). We treated BC-IM and BC-DUN classes of plants separately in each site, for four separate QTL analyses. For each trait, the CIM procedure tested the hypothesis that a test site in an interval between adjacent markers had a QTL affecting the trait, while accounting for genetic background by using multiple regression on additional markers as cofactors. The cofactors included in each CIM model were determined by forward–backward stepwise regression, with the critical P values set at 0.05. Tests were performed at 2-cM intervals with a flanking window size of 10 cM. The LR test statistic is . Experimentwise significant levels (α = 0.05) were determined by permuting the phenotypes against the genotypes 1000 times for each trait (Churchill & Doerge 1994).
For each QTL, genotypic values were defined as a for IM/IM, d for IM/DUN, and −a for DUN/DUN, where a and d are additive and dominance effects, respectively. QTL Main Effects (ME) for BC-IM are (a−d), and are (a + d) for BC-DUN. There is no standard criterion for estimating QTL effects and the magnitude of effect can vary dramatically depending on how they are estimated (Lexer et al. 2005). The most commonly used measure of QTL effect, particularly in lab or agricultural systems, is the percentage of variance explained (PVE), which accounts for the range of phenotypic variation within the mapping population. However, perhaps a more useful measure for understanding adaptive divergence in the wild is to estimate QTL effect in terms of the difference between parental populations (Fishman et al. 2002). For example, True et al. (1997) uses a fairly stringent criterion by defining a large (major) QTL as one for which the distributions for alternative homozygotes for a particular QTL show little or no overlap, so that the probability of misclassification of phenotype is <5%, equivalent to 3.28 environmental standard deviations (ESDs). To estimate the magnitude of effect of individual QTLs on each trait, we divided the ME value for the appropriate backcross type by the Environmental Standard Deviation (ESD) for a given trait to obtain a more biologically relevant estimate of QTL effect. We calculated the ESD differently for BC-IM plants and BC-DUN plants, as the mean trait values for these two backcross populations differ dramatically (Hall & Willis 2006). For BC-IM plants, which are phenotypically very similar to IM parents for nearly all traits (Hall & Willis 2006), the ESD was estimated as the square root of the IM variance. This was calculated separately for each trait. For the BC-DUN plants, we used the same calculation to estimate ESD by using the DUN variance instead of the IM variance (DUN and BC-DUN plants also have very similar trait means; Hall & Willis 2006).
Candidate QTL analysis.
In a previous QTL study involving these same two parental M. guttatus populations, we discovered two major highly pleiotropic QTLs on linkage group (Lg) 8 that contributed to divergence between these two populations for size and life-history traits, including stem thickness, leaf width, corolla width and length, flowering time and reproductive allocation (Hall et al. 2006). We refer to them as DIVERGENCE (DIV) QTLs. Because we examined many of the same traits in this and the previous study, we had an apriori hypothesis for detecting QTL effects measured in the field at these two candidate positions. The current RIL linkage map shares many markers with the previous F2 map generated from the same pair of parental populations (Hall et al. 2006). Therefore, we used markers in these regions on Lg8 shared between previous and current maps as candidate positions for detecting QTLs in this analysis in addition to QTLs detected solely from CIM (above). If a trait in our joint analysis had a LR test value greater than a significance threshold value of at either (or both) of these candidate QTL regions, we reported these effects. This test does not require corrections for multiple tests along the genome because each position is fixed prior to the test, which increases the power to detect QTL effects on multiple traits (Jiang & Zeng 1995).
QTL genotype by environment interactions.
To test for genotype by environment (G × E) interactions, we measured the same traits on genetically identical RILs in two distinct field environments (Cascades and Dunes sites), which is statistically equivalent to measuring multiple genetically correlated traits in the same environment (Falconer 1952). We employed Multitrait Composite Interval Mapping (MCIM; Jiang & Zeng 1995) using QTL Cartographer v. 1.17 (Basten et al. 2002) and QTL Cartographer Windows 2.0 (Wang et al. 2005) to jointly map traits measured in the two environments and to test for G × E interactions. The MCIM procedure is similar to single trait CIM, but the LR test statistic is , where is the likelihood under the alternative hypothesis that the test site is a QTL affecting the trait in either environment. At test positions where the null hypothesis is rejected, tests of QTL G × E interactions are performed. Here, the hypotheses tested are
| (4) |
where and represent main effects of a QTL in environments 1 and 2. Two sets of LR scores (one for the joint analysis and one for the QTL by environment analysis) are thus evaluated (Jiang & Zeng 1995). Experimentwise significance levels (α = 0.05) were determined by permuting the phenotypes against the genotypes 1000 times so that the correlations between traits were maintained (Churchill & Doerge 1994).
Results
Genome-wide QTL analysis
In this study of the genetic basis of variation of 16 traits in M. guttatus measured in two field environments, we identified 10 genomic regions (QTLs) in the BC-IM lines that significantly affected variation in one (or for one QTL, two) trait(s) (three of which affected traits at the Cascades site, seven at the Dunes site; Table 1, Fig. 1); and nine genomic regions (with 11 total QTL effects) in the BC-DUN lines (one at the Cascades, eight at the Dunes; Table 2, Fig. 1). Here and throughout, we refer to particular genomic locations that affect one or more traits as QTLs. Most QTLs affected only single traits, but in a few cases, they affected multiple traits. The majority of the QTLs (16 of 22 total QTL effects) detected had relatively small (change of <1 ESD) phenotypic effect at both sites (Tables 1 and 2, Fig. 1), where the substitution of one allele for another (IM/IM vs. IM/DUN in BC-IM lines; IM/DUN vs. DUN/DUN in BC-DUN lines) caused a change in phenotype <1 ESD. The remaining 6 QTLs (some at overlapping postions) had larger effects of >1 ESD for individual traits (Tables 1 and 2, Fig. 1).
Table 1.
QTL main effects (ME) and magnitude relative to ESD for RILs back-crossed to IM parent at the Cascades and Dunes field sites
| Trait | QTL map position: Lg, marker, cM | Cascades | Dunes | ||
|---|---|---|---|---|---|
|
|
|
||||
| ME | ME/ESD | ME | ME/ESD | ||
|
| |||||
| Corolla width | 8, 15, 79.47a | −3.012 | −0.959 | ||
| 2, 12, 66.97 | −2.551 | −1.093 | |||
| Days to first flowering | 3, 6, 48.28 | 8.923 | 0.674 | ||
| Maximum rosette diameter | 6, 13, 65.41 | −6.635 | −0.753 | ||
| Maximum plant height | 4, 7, 65.14 | −7.581 | −0.176 | ||
| 10, 7, 73.60 | −9.411 | −0.219 | |||
| Maximum stolon number† | 10, 5, 46.69 | −2.722 | −1.824 | ||
| Survival to flowering | 6, 10, 50.02 | 0.213 | 0.425 | ||
| Total flower number (year 1) | 6, 1, 0.01 | −0.582 | −0.571 | ||
| 8, 12, 59.14 | 0.314 | 0.362 | |||
| Lambda | 8, 16, 80.70a | −47.413 | −1.501 | ||
QTL main effects for BC-IM are (a–d), IM/IM is defined as a, IM/DUN is d. Negative values of ME indicate that IM carries the minus allele/DUN carries the plus allele. Fitness components are in bold. All QTLs are significant at P < 0.05, based on 1000 permutations.
QTL effects detected at the same position share a letter.
Trait only measured at Dunes field site.
Fig. 1.
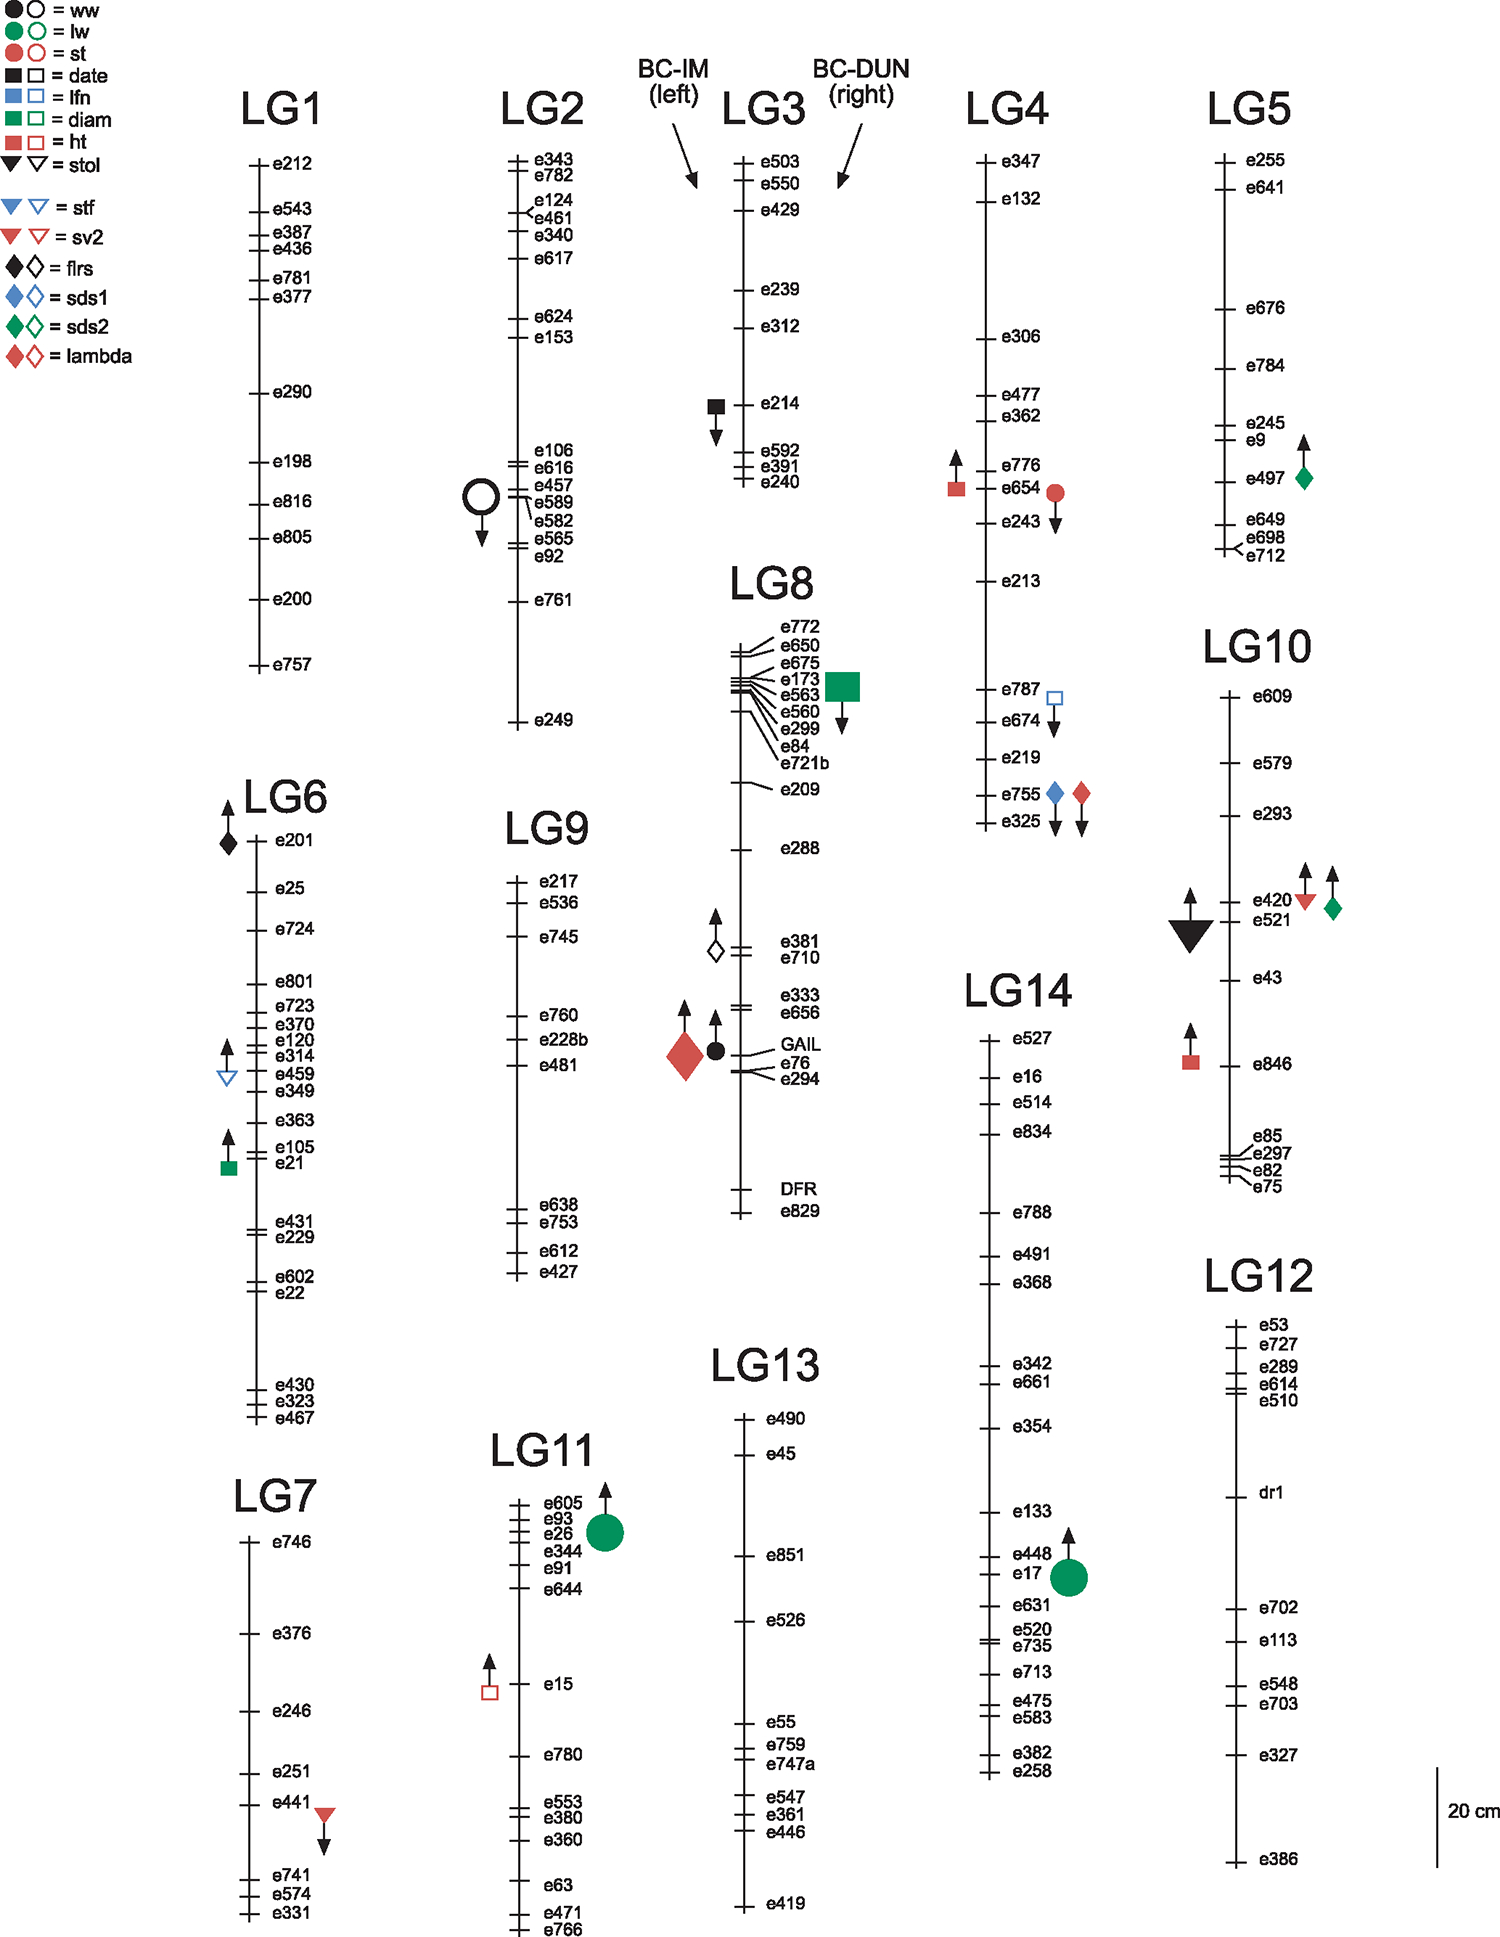
Linkage map of M. guttatus IM × DUN RILs. Locations of significant QTLs affecting BC-IM lines are on the left, BC-DUN on right. Size of symbol indicates the size of the QTL main effect. Small symbols, ME < 1ESD; large symbols, ME > 1. Up arrows indicate that native alleles are favoured (based on results of phenotypic selection analyses; Hall & Willis 2006), down arrows indicate QTLs where foreign alleles have higher fitness than native alleles. Filled symbols indicate a detected QTL effect at the Dunes site, open symbols at the Cascades site. Trait symbols: ww = corolla wide width, ctl = corolla tube length, lw = leaf width, st = stem thickness, date = date of first flower production, lfn = maximum leaf number, diam = maximum plant diameter, ht = maximum plant height, stol = stolon number, stf = survival to flowering, sv1 = survival to end of year 1, sv2 = survival to end of year 2, flrs = total number of flowers produced, sds1 = total seeds produced in year 1, sds2 = total seeds produced in year 2, lambda = total lifetime fitness.
Table 2.
QTL main effects (ME) and magnitude relative to ESD for RILs back-crossed to DUN parent at the Cascades and Dunes field sites
| Trait | QTL map position: LG, marker, cM | Cascades | Dunes | ||
|---|---|---|---|---|---|
|
|
|
||||
| ME | ME/ESD | ME | ME/ESD | ||
|
| |||||
| Leaf width† | 11, 3, 5.19 | −4.33 | −1.892 | ||
| 14, 13, 106.63 | −4.63 | −2.023 | |||
| Stem thickness† | 4, 7, 65.14 | 0.614 | 0.453 | ||
| Maximum leaf number | 4, 10, 109.33 | −1.56 | −0.983 | ||
| Maximum rosette diameter | 8, 8, 8.22 | 43.61 | 1.212 | ||
| Survival (year 2) † | 7, 5, 54.51 | 0.0684 | 0.232 | ||
| 10, 4, 42.85a | −0.0873 | −0.295 | |||
| Total seeds produced (year 1) † | 4, 13, 126.49b | 854.96 | 0.459 | ||
| Total seeds produced (year 2) † | 5, 6, 63.87 | −796.36 | −0.373 | ||
| 10, 5, 44.69a | −860.82 | −0.403 | |||
| Lambda † | 4, 13, 126.49b | 853.70 | 0.459 | ||
QTL main effects for BC-DUN are (a + d), DUN/DUN is defined as −a, IM/DUN is d. Negative values of ME indicate that IM carries the minus allele/DUN carries the plus allele. Fitness components are in bold. All QTLs are significant at P < 0.05, based on 1000 permutations.
Trait only measured at Dunes field site.
a,bQTL effects detected at the same position share a letter.
We found three QTLs where two separate traits mapped to roughly the same position, suggesting that some loci affect multiple traits within the same environment. At the Dunes site, for example, a pleiotropic QTL on Lg10 affected both survival and seed production in year 2 in BC-DUN plants (Table 2, Fig. 1). It should be noted that our analysis does not allow us to distinguish true pleiotropy from tight linkage of multiple genes acting independently on different traits. Further fine-scale mapping and positional cloning of these QTLs would elucidate this issue.
There was also evidence for separate QTLs affecting different components of fitness in the multi-year life-cycle of the plants at the Dunes site. For example, separate QTLs control survival in year 2, seed set in year 1 and seed set in year 2 (Table 2).
Fitness trait QTLs, including those affecting survival, flower production, seed production, survival-to-flowering and differed in effects across the two field sites. At the Cascades site, native (IM) alleles were favoured for all (2/2) fitness QTLs detected in the genome-wide analysis, as evidenced by the sign of the QTL main effect (Table 1).
At the Dunes site, the native allele was favored at four of six of the fitness QTLs detected in the genome-wide scan (Tables 1 and 2). Interestingly, both of the QTLs with non-native favourable alleles were found in the BC-DUN population, with DUN homozygotes having lower fitness than heterozygous individuals (Table 2). In contrast, the native allele was favoured in the two fitness QTLs detected in the BC-IM plants, such that the heterozygotes for the DUN allele had higher fitness than IM homozygotes at the Dunes site (Table 1).
Candidate QTLs
Using single marker analysis for each of the two candidate QTL positions on Lg8 (DIV1 & DIV2), we detected effects on seven and eight (for BC-IM and BC-DUN, respectively) additional traits (Fig. 2, Table 3). Three of these QTL effects were large (>1 ESD; Table 3), which is consistent with a previous QTL study on an F2 population created from the same two parental populations used in this experiment (Hall et al. 2006).
Fig. 2.
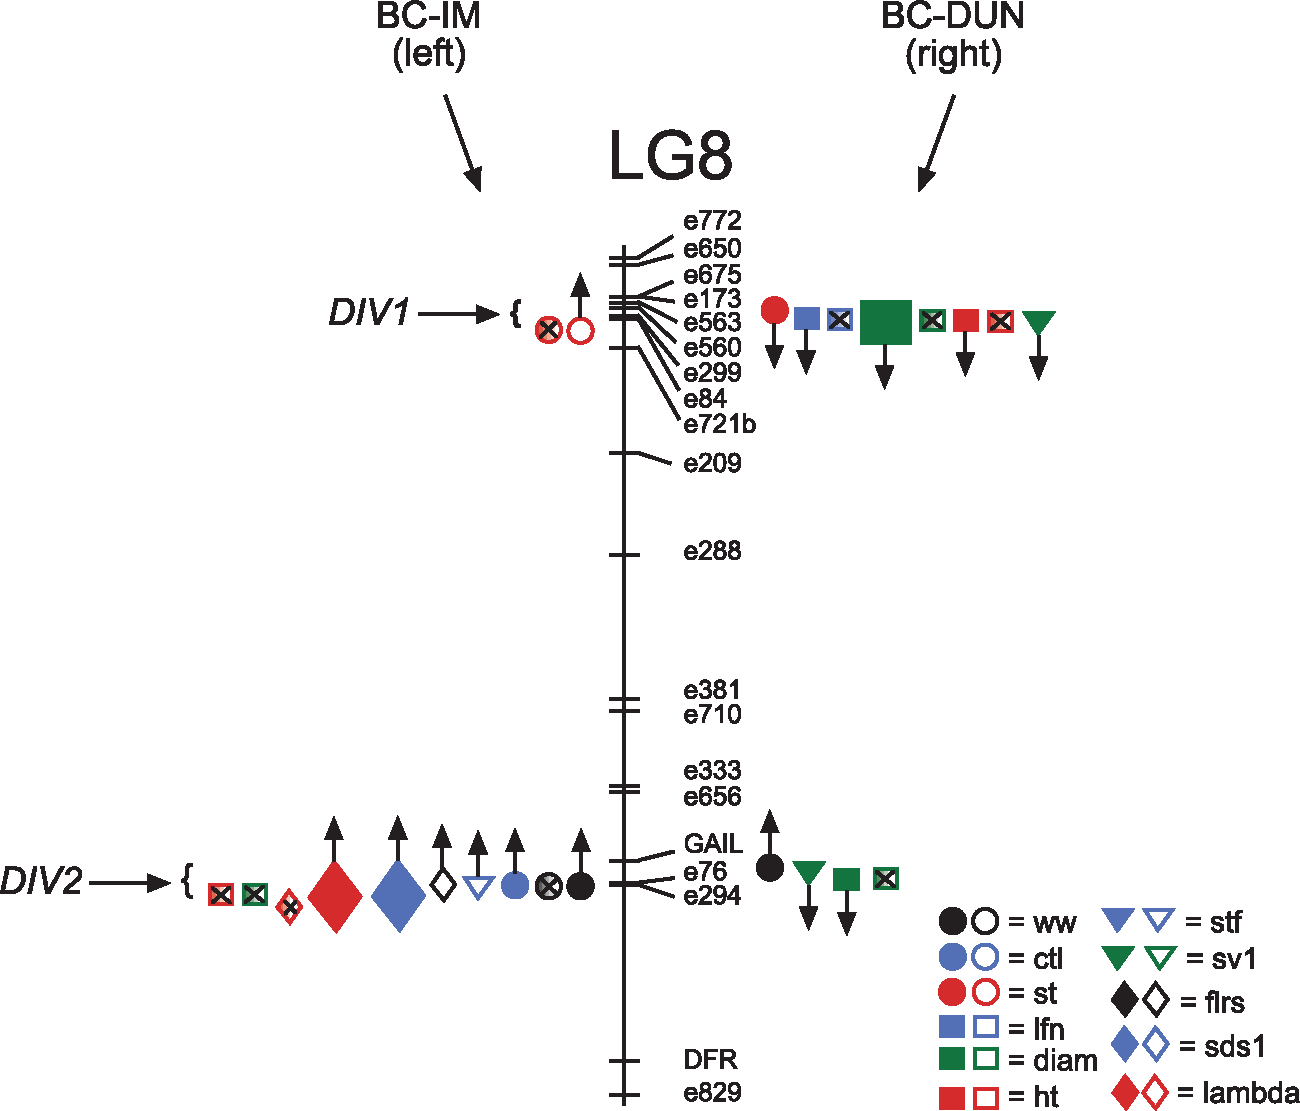
Location and effects of candidate QTLs, DIV1 and DIV2, located on Lg8. QTLs with significant QTL by environment interactions between sites are shaded and marked with an ‘x’ to signify an interaction. Locations of significant QTLs affecting BC-IM lines are on the left, BC-DUN on right. Up arrows indicate that native alleles are favoured, down arrows indicate QTLs where foreign alleles have higher fitness than native alleles. Filled symbols indicate a detected QTL effect at the Dunes site, open symbols at the Cascades site. Trait symbols: ww = corolla wide width, ctl = corolla tube length, lw = leaf width, st = stem thickness, date = date of first flower production, lfn = maximum leaf number, diam = maximum plant diameter, ht = maximum plant height, stol = stolon number, stf = survival to flowering, sv1 = survival to end of year 1, sv2 = survival to end of year 2, flrs = total number of flowers produced, sds1 = total seeds produced in year 1, sds2 = total seeds produced in year 2, λ = total lifetime fitness.
Table 3.
QTL main effects (ME) and their magnitude relative to the ESD detected in (A) BC-IM lines and (B) BC-DUN lines using CIM at candidate marker locations, both on Lg 8, at the Cascades and Dunes field sites. DIV1 is between position 5.22–10.22 cM (markers e173–e84). DIV2 is between position 80.70–106.01 cM (markers GAIL-e294). At these positions, a significant QTL effect was determined if it had an LR test ratio greater than a significance threshold of 5.99 (χ20.05,2)
| (A) | DIV1 | DIV2 | ||||
|---|---|---|---|---|---|---|
|
|
|
|
||||
| Cascades | Cascades | Dunes | ||||
|
|
|
|
||||
| Trait | ME | ME/ESD | ME | ME/ESD | ME | ME/ESD |
|
| ||||||
| Corolla width | −2.672 | −0.850 | ||||
| Corolla tube length | −0.995 | −0.628 | ||||
| Stem thickness | 0.128 | 0.422 | ||||
| Survival to flowering | 0.172 | 0.343 | ||||
| Total flower number (year 1) | 0.336 | 0.387 | ||||
| Seeds (year 1) | −41.787 | −1.323 | ||||
| Lambda | −47.413 | −1.501 | ||||
| (B) | DIV1 | DIV2 | ||
|---|---|---|---|---|
|
|
|
|
||
| Dunes | Dunes | |||
|
|
|
|||
| Trait | ME | ME/ESD | ME | ME/ESD |
|
| ||||
| Corolla width† | −1.322 | −0.381 | ||
| Stem thickness† | 0.338 | 0.250 | ||
| Maximum leaf number | 13.539 | 0.475 | ||
| Maximum rosette diameter | 43.607 | 1.212 | 29.670 | 0.824 |
| Maximum plant height | 13.564 | 0.086 | ||
| Survival (year 1) † | 0.146 | 0.291 | 0.135 | 0.269 |
QTL main effects for BC-IM are (a–d), for BC-DUN (a + d). IM/IM is defined as a, IM/DUN is d, and DUN/DUN is −a. Fitness components are in bold.
Trait was only measured at Dunes field site.
Several QTLs detected in the genome-wide analysis mapped to roughly the same position and affected the same traits as the DIV loci. These QTLs are presented separately in Tables 1 and 2 for the genome wide scan and in Table 3 for the candidate QTL analysis, though they are likely to be the same QTL. For example, QTLs affecting k and corolla width were detected in the genome wide scan in the BC-IM population at the Dunes site at the same position as DIV2. In the candidate analyses, these same traits were also affected by DIV2 and are treated as the same genomic location.
The DIV2 locus in the BC-IM plants appears to show an example of a fitness trade-off. At the Cascades, this locus affected both survival-to-flowering and total flower number, where native IM homozygotes had greater fitness than heterozygotes (Table 3a, Fig. 2). DIV2 also affected seed production and λ, as well as flower size (which is positively correlated with fitness), with heterozygotes for the native DUN allele having both larger flowers and higher fitness than IM homozygotes (Table 3a, Fig. 2). Two of these fitness traits, flower number and seed number (or λ, which is an estimate based largely on seed number) are highly correlated (Spearman’s ρ = 0.56), even across sites. Although our measures of genotype by environment interaction focus on individual traits only, the effects detected at these correlated traits provide evidence for a trade-off at DIV2.
We also detected pleiotropy on size and fitness traits in the BC-DUN plants at the Dunes site. DIV1 had an effect on stem thickness, leaf number, rosette diameter, plant height and year 1 survival, suggesting that these size traits may be genetically linked to survival in the first year. At this locus, plants heterozygous for the IM allele were larger and more likely to survive than homozygotes for native DUN alleles (Table 3b, Fig. 2). Interestingly, at DIV2, we detected a different pattern with respect to flower size. Plants with IM alleles had smaller flowers (both corolla width and length), wider diameters and a greater likelihood of surviving to the end of the first summer at the Dunes site than DUN homozygotes (Table 3b, Fig. 2).
QTL genotype by environment interactions
Although we tested for QTL by environment interactions across all linkage groups for individual traits, we found no significant QTLs involved in interactions in the genome-wide analysis. However, we did find evidence for QTL by environment interactions at the two DIV loci, which we wanted to examine more closely using posthoc analyses. First, in order to test the DIV loci for QTL by environment interactions at a particular trait, we conducted single marker analysis with the marker most closely linked to the QTL peak using two-way analysis of variance (anova). Missing genotype data for individuals was inferred from adjacent markers within the DIV1 or DIV2 locus. The markers in DIV1 are all tightly linked and located within a large inversion (Lowry et al. 2009; D. Lowry and J. Willis, unpublished). Both DIV QTLs are located on Lg8 and are unlinked (>50 cM apart). In each case, the trait was the dependent variable and the relevant marker genotype and site were factors. All significant QTL effects are presented in Table 4.
Table 4.
QTL main effects (ME) and their magnitude relative to the ESD detected in (A) BC-IM lines and (B) BC-DUN lines using CIM at candidate marker locations, both on Lg 8, at the Cascades and Dunes field sites. DIV1 is between position 5.22–10.22 cM (markers e173–e84). DIV2 is between position 80.70–106.01 cM (markers GAIL-e294). At these positions, a significant QTL effect was determined if it had an LR test ratio greater than a significance threshold of 5.99 (χ20.05,2). In a separate test, all QTLs were positive for significant QTL × environment interactions. Fitness components are in bold
| DIVI | DIV2 | |||||||
|---|---|---|---|---|---|---|---|---|
|
|
|
|||||||
| Cascades | Dunes | Cascades | Dunes | |||||
|
|
|
|
|
|||||
| Trait | ME | ME/ESD | ME | ME/ESD | ME | ME/ESD | ME | ME/ESD |
|
| ||||||||
| (A) | ||||||||
| Corolla width | 0.073 | 0.031 | −0.537 | −0.171 | ||||
| Stem thickness | 0.119 | 0.393 | −0.024 | −0.078 | ||||
| Maximum rosette diameter | 0.523 | 0.074 | −1.412 | −0.160 | ||||
| Maximum plant height | 1.125 | 0.073 | −2.049 | −0.048 | ||||
| Lambda | −5.953 | −0.105 | −21.39 | −0.677 | ||||
| (B) | ||||||||
| Maximum leaf number | −0.654 | −0.412 | 6.540 | 0.229 | ||||
| Maximum rosette diameter | −0.861 | −0.163 | 20.812 | 0.578 | 0.920 | 0.220 | 15.258 | 0.391 |
| Maximum plant height | −1.201 | −0.500 | 5.628 | 0.0357 | ||||
The anova results generally support the QTL results, indicating significant genotype by environment interactions exist for the majority of these traits at candidate loci (Tables 4 and 5, Figs 3 and 4). The anova results also reveal that the site factor was the most statistically significant factor in the model for nearly all traits (Table 5, Figs 3 and 4), where plants of all genotypes grown at the Dunes site are larger than plants at the Cascades site.
Table 5.
Two-way anova for effects of genotype and site (Cascades vs. Dunes) at individual markers located where QTL × environment interactions were detected. (A) BC-IM lines; (B) BC-DUN lines
| Trait (marker) | Source of variation | df | F | P |
|---|---|---|---|---|
|
| ||||
| (A) | ||||
| Corolla width (GAIL) | Genotype | 1 | 1.31 | 0.2539 |
| Site | 1 | 81.76 | <0.0001 | |
| Genotype × site | 1 | 4.45 | 0.0360 | |
| Error | 233 | |||
| Stem thickness (e299) | Genotype | 1 | 0.88 | 0.3503 |
| Site | 1 | 12.63 | 0.0005 | |
| Genotype × site | 1 | 0.31 | 0.5784 | |
| Error | 150 | |||
| Rosette diameter (e294) | Genotype | 1 | 0.094 | 0.7593 |
| Site | 1 | 22.46 | <0.0001 | |
| Genotype × site | 1 | 5.05 | 0.0254 | |
| Error | 290 | |||
| Plant height (e294) | Genotype | 1 | 0.28 | 0.5960 |
| Site | 1 | 8.56 | 0.0037 | |
| Genotype × site | 1 | 6.73 | 0.0100 | |
| Error | 290 | |||
| λ (GAIL) | Genotype | 1 | 3.81 | 0.0518 |
| Site | 1 | 1.44 | 0.2311 | |
| Genotype × site | 1 | 7.13 | 0.0080 | |
| Error | 300 | |||
| (B) | ||||
| Leaf number (e84) | Genotype | 1 | 8.35 | 0.0041 |
| Site | 1 | 189.00 | <0.0001 | |
| Genotype × site | 1 | 10.44 | 0.0014 | |
| Error | 312 | |||
| Plant height (e84) | Genotype | 1 | 5.12 | 0.0244 |
| Site | 1 | 333.69 | <0.0001 | |
| Genotype × site | 1 | 8.51 | 0.0038 | |
| Error | 312 | |||
| Rosette diameter (e84) | Genotype | 1 | 11.68 | 0.0007 |
| Site | 1 | 473.65 | <0.0001 | |
| Genotype × site | 1 | 13.57 | 0.0003 | |
| Error | 312 | |||
| Rosette diameter (e294) | Genotype | 1 | 0.32 | 0.5718 |
| Site | 1 | 459.57 | <0.0001 | |
| Genotype × site | 1 | 0.19 | 0.6619 | |
| Error | 300 | |||
Fig. 3.
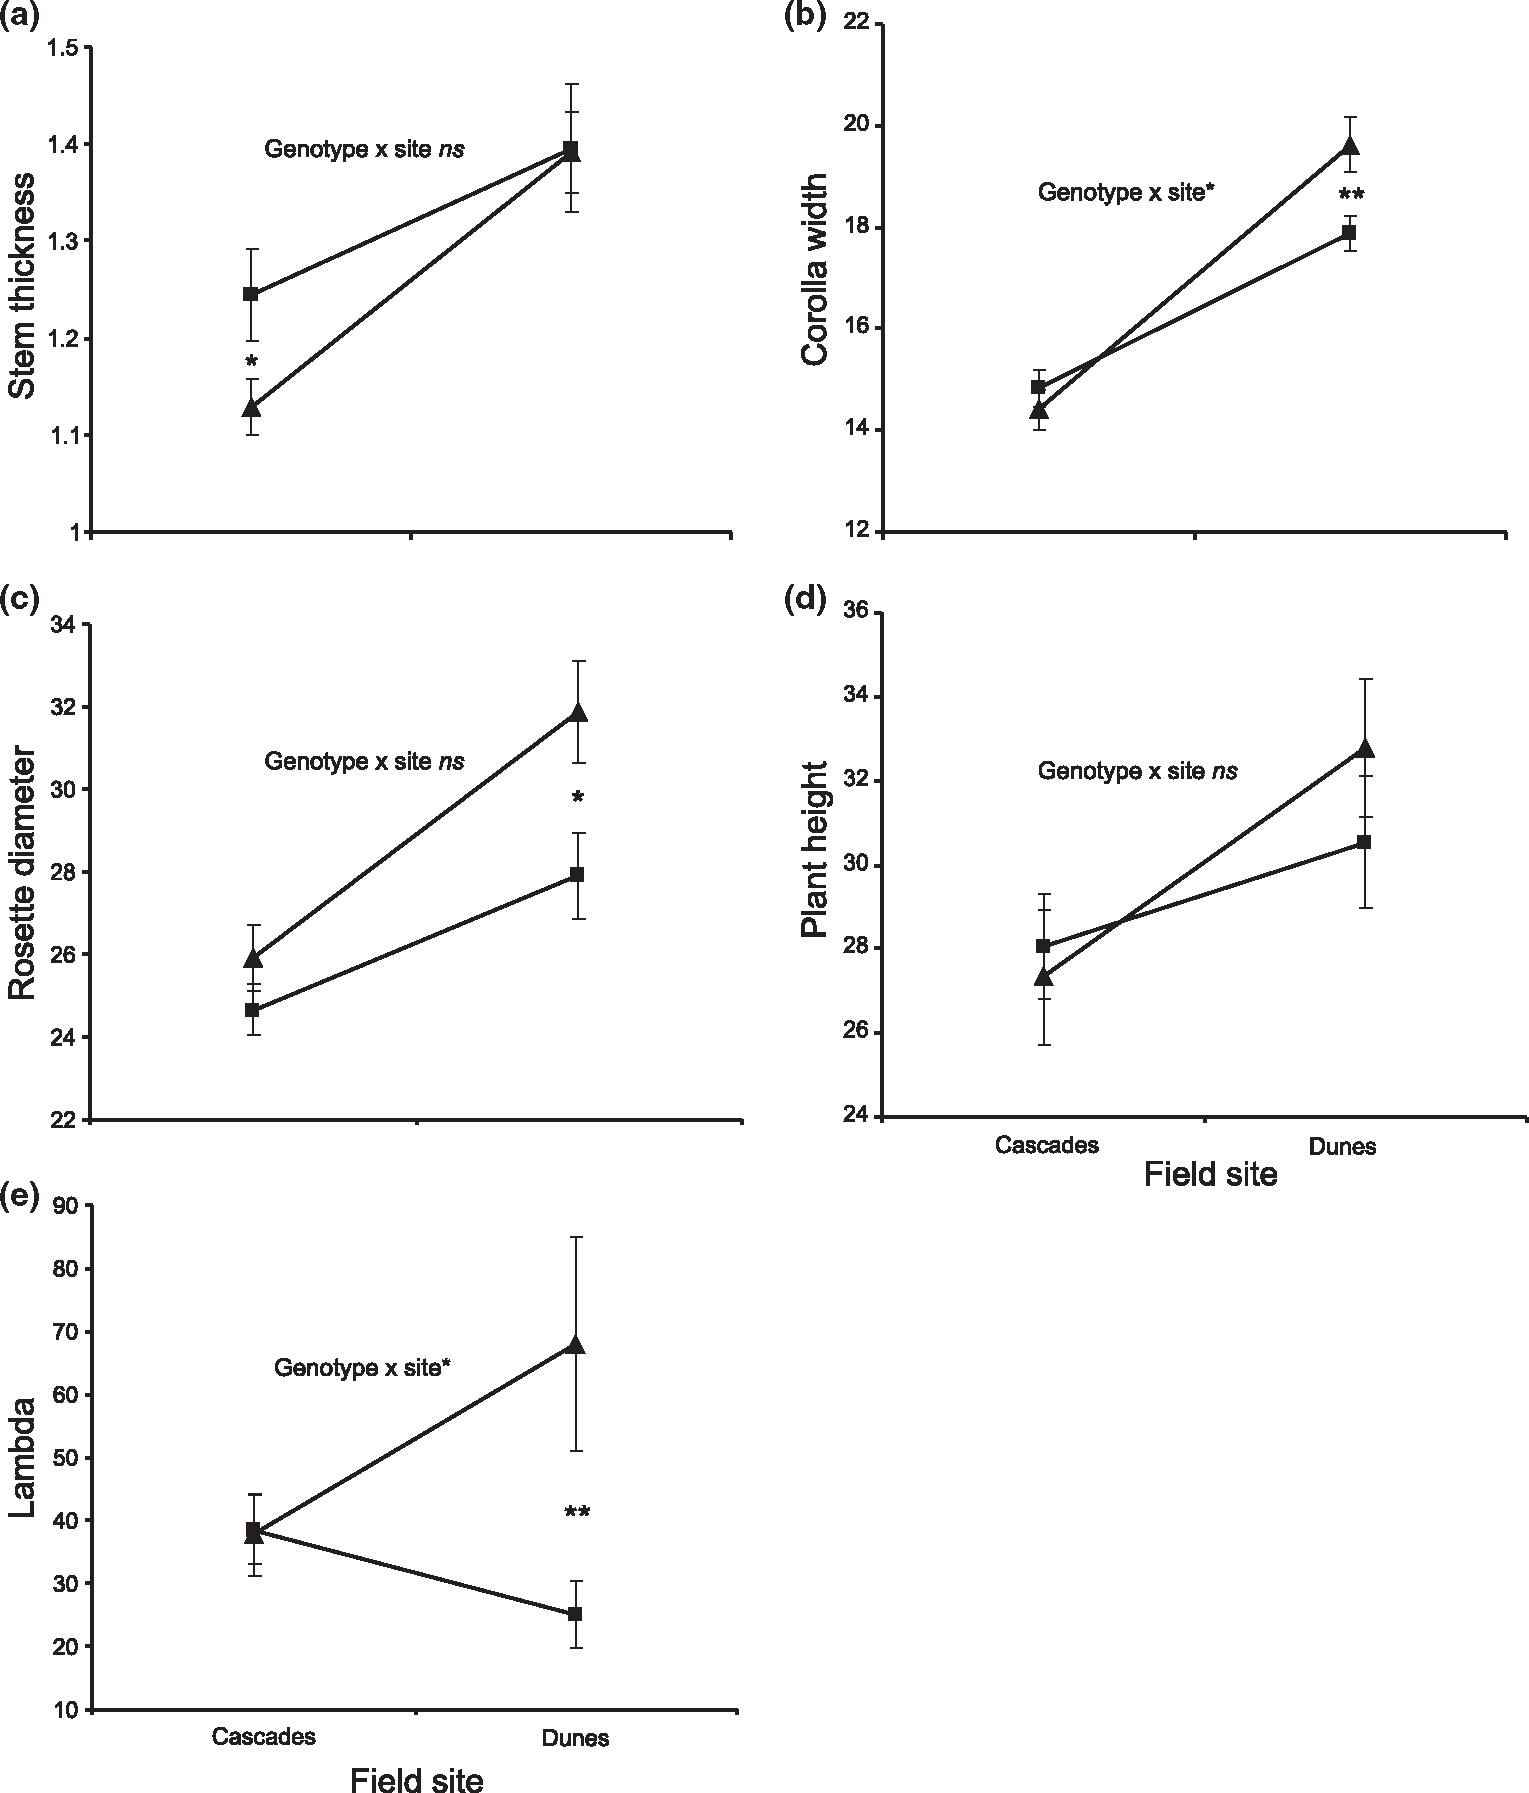
Mean (±SE) trait values for different genotypes measured in the two field environments for BC-IM lines at candidate markers DIV1 and DIV2 linked to the significant QTL peak detected in MCIM analysis. DIV1 and DIV2 represent the composite genetic effect all of linked loci spanning these QTLs. All size traits are in mm. Allelic effect of markers: (a) DIV1, (b–e) DIV2. Significant genotype × site interactions based on ANOVA (Table 5) at above markers are indicated. ns = not significant, *P < 0.05, **P < 0.01, ***P < 0.001. Differences between genotypes at a single site were tested using t-tests and only significant results (as indicated by P values) are shown. Significant t-test results for: (a) stem thickness at the Cascades site (DIV1), t103 = 2.20 (P = 0.030); (b) corolla width at the Dunes site (DIV2), t141 = −2.88 (P = 0.0046); (c) rosette diameter at the Dunes site (DIV2), t161 = −2.37 (P = 0.0188); e) lambda at the Dunes site (DIV2), t163 = −2.95 (P = 0.0036). ■ = IM/IM homozygotes, ▲ = IM/DUN heterozygotes.
Fig. 4.
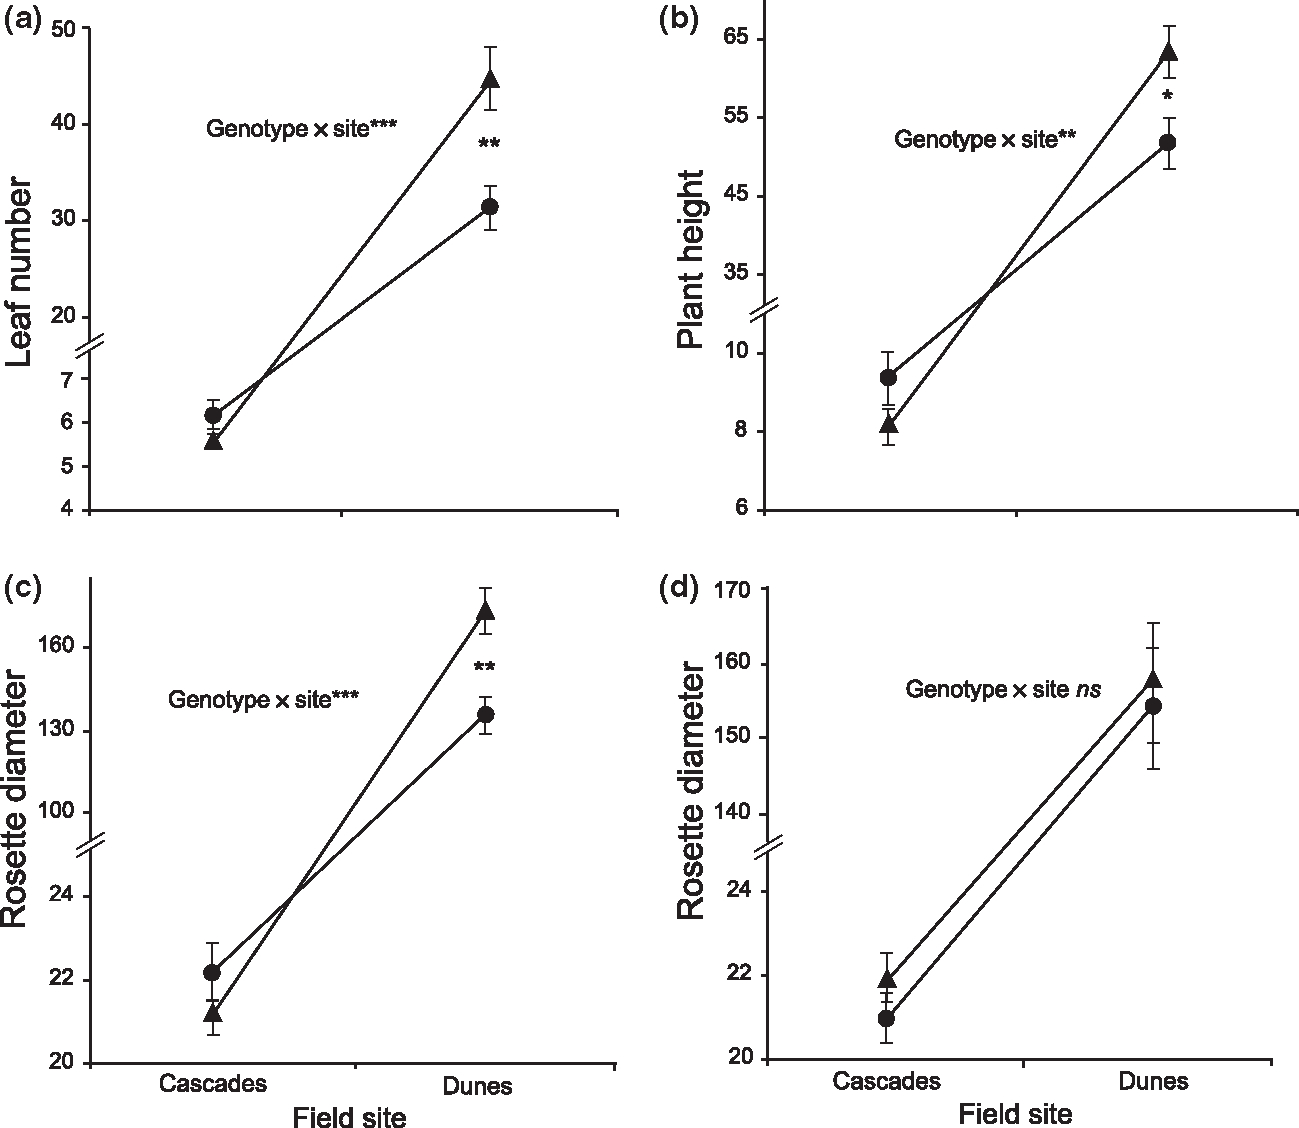
Mean (±SE) trait values for different genotypes measured in the two field environments for BC-DUN lines at candidate markers DIV1 and DIV2 linked to the significant QTL peak detected in MCIM analysis. DIV1 and DIV2 represent the composite genetic effect all of linked loci spanning these QTLs. All size traits are in mm. Allelic effect of markers: (a–c) DIV1, (d) DIV2. Significant genotype × site interactions based on ANOVA (Table 5) at above markers are indicated. ns = not significant, *P < 0.05, **P < 0.01, ***P < 0.001. Differences between genotypes at a single site were tested using t-tests and only significant results (as indicated by P values) are shown. Significant t-test results for: (a) leaf number at the Dunes site (DIV1), t173 = 3.23 (P = 0.0015); (b) plant height at the Dunes site (DIV1), t173 = 2.44 (P = 0.0157); (c) rosette diameter at the Dunes site (DIV1), t173 = 3.36 (P = 0.0010). ● = DUN/DUN homozygotes, ▲= IM/DUN heterozygotes.
The presence of significant QTL by environment interaction alone does not indicate whether or not trade-offs exist between sites and loci. To clarify whether interactions are the result of trade-offs as opposed to conditional neutrality, we performed t-tests on the different genotypes within a site to see if they were significantly different from each other. Significant trade-offs are unambiguously supported only if genotypes have significantly different fitness values at both sites AND if native genotypes are favoured at both sites. In the BC-IM lines, there appears to be evidence of conditional neutrality as the cause of QTL by environment interactions, not trade-offs, for many of the traits. For example, plants with a native DUN allele at DIV2 have significantly greater fitness (λ) than non-native IM homozygous at the Dunes site, but there is no affect on fitness at the Cascades site at this locus (Table 5, Fig. 3). For BC-DUN plants, however, we detected significant differences between genotypes at both sites for both leaf number and plant height (Table 5, Fig. 4), and in opposite directions, indicating a change in rank for these traits. Despite the appearance of genetic trade-offs for these traits, the native genotypes have lower trait values (larger plant height and more leaves are selectively favoured at both sites; Hall & Willis 2006) relative to less-native genotypes, which is inconsistent with local adaptation to each site (though these traits do not measure fitness directly). This pattern could be an example of mutational load at this locus or associative over-dominance at linked loci.
Discussion
In this study, we found a total of 19 QTLs (with each QTL controlling 1.16 traits, on average) affecting 16 traits in a genome wide analysis of two wild populations of M. guttatus. We also found 15 additional QTL effects in a targeted investigation of two previously identified candidate QTLs, DIV1 and DIV2. Many of the alleles controlling fitness traits were advantageous in their native habitat, but surprisingly, in some cases native alleles were not superior. We detected significant QTL genotype by environment interactions for both size and fitness traits at two candidate QTLs. When examining single traits, we found no clear evidence of a cost associated with adaptive loci in alternative habitats, which is consistent with a handful of other recent studies in other systems that suggest non-overlapping sets of loci to be involved in local adaptation to different habitats (Weinig et al. 2003; Verhoeven et al. 2004, 2008; Gardner & Latta 2006). However, when we examined fitness traits that are highly correlated (such as flower number and seed number), we found evidence for a trade-off at DIV2 in the BC-IM population, where native IM homozygotes had greater fitness than heterozygotes at the Cascades site and these same IM homozygotes had reduced fitness compared to heterozygotes at the Dunes site.
Challenges for field-based QTL analyses
There are many challenges to both field-based reciprocal transplant experiments and QTL analyses conducted in wild populations (reviewed in Slate 2005). Compared to greenhouse-based QTL studies, for example, we found very few QTLs considering the large number of traits measured, even when examining this same pair of populations (Hall et al. 2006). Our ability to detect QTLs was likely hindered by environmental variability, relatively low sample size, quality of genotype data, segregation distortion and breeding design. All of these caveats should be taken into account when interpreting field QTL studies such as ours.
All field-based QTL studies must contend with high levels of micro-environmental variation that may obscure the ability to detect genotypic variation underlying phenotypic differences and to map QTLs in the field. We used only a modest number of RILs in our study, and low sample sizes will reduce the power to detect QTLs. The gene-based markers used for linkage map construction in this experiment had reasonably high-density coverage of all 14 linkage groups in M. guttatus (Lowry et al. 2009), though we had a high proportion of missing data points per marker (17.85%) due to poor amplification at some markers, residual heterozygosity still segregating in the lines and other factors. In addition, the presence of segregation distortion (nearly 50% of markers in this cross), severe in some regions (i.e. Lg2; Lowry et al. 2009), likely limited our power to detect QTLs. Further, the genotype data and linkage map construction were based on later-generation RILs than those used in the field experiment. We inferred the genotypes in our field lines and likely had reduced power to detect marker-trait associations in our QTL analyses.
Finally, breeding design can influence the results of field-based QTL studies. In this study we backcrossed RILs to parental lines in the last generation of our breeding design to eliminate inbreeding depression (Hall & Willis 2006). Unfortunately, this only allowed us to compare one homozygous genotype to a heterozygous genotype in a given genetic background (BC-IM, BC-DUN). More complex and labour intensive crossing designs might have allowed us to compare alternative genotypes homozygous (but not identical by descent) for each population’s alleles, ultimately increasing our ability to detect and characterize QTLs effects.
Genetic architecture of local adaptation
In this study we identified many loci contributing to local adaptation, although the effects of the QTLs differed across habitats and genetic backgrounds. In the Cascades, we only detected QTLs affecting fitness traits in the BC-IM population, presumably because most of the slowly developing BC-DUN plants died of drought before flowering. At this site, the QTL homozygous genotypes with native IM alleles at all fitness QTLs had higher fitness than the heterozygotes with a DUN allele, as expected for local adaptation. Two of these pleiotropic QTLs affected growth rate and resource allocation traits, an important indicator of annual and perennial life-history strategies (Roux et al. 2006). Early-flowering (or rapid onset of reproduction) is selectively advantageous at this Cascades site (Hall & Willis 2006) and at other annual sites in M. guttatus (Willis 1996; Lowry et al. 2008). Indeed, none of the slower-growing perennial DUN parental plants flowered at this site before the summer drought reduced soil moisture to below that needed for M. guttatus to persist (Hall & Willis 2006). Many of these life-history developmental processes are functionally well-characterized in other plant systems (recently reviewed by Ingram & Waites 2006; Anastasiou & Lenhard 2007; Bogre et al. 2008; Busov et al. 2008; Krizek 2009) and should facilitate candidate gene identification underlying these Mimulus QTLs.
In contrast to the consistent finding of selectively favoured native alleles at the Cascades site, we found that at the Dunes field site selection favoured genotypes with native alleles at only four of the eight total fitness QTL positions (including those identified in both genome-wide analyses and non-overlapping candidate QTLs), with the non-native IM alleles seemingly favoured at the other loci. However this result is difficult to interpret because it is entirely dependent on genetic background, as all four QTLs with seemingly favourable non-native alleles were detected only in the BC-DUN mapping population, where the alternative genotypes are native DUN homozygotes and IM/DUN heterozygotes. Of course it is conceivable that the non-native IM alleles really are favoured over the native DUN alleles at these loci, implying environmentally dependent maladaptation, but perhaps the most likely explanation for this pattern is that the DUN population harbours recessive deleterious alleles at high frequencies that have accumulated in this isolated, largely clonal population. Although our breeding design ensured that all plants were outcrossed with respect to alleles from the same population, thereby preventing the expression of inbreeding depression, it is known that the DUN population has low genetic variation and may suffer from some fixed mutational load. This coastal perennial population has unusually low variation at microsatellite loci, with expected heterozygosities of only 0.00–0.14 for nine markers, compared to an average of 0.62 for the same markers in the IM population (Kelly & Willis 1998; Sweigart et al. 1999; Willis 1999; Marriage & Kelly 2009). Importantly, the DUN population is also unusual in that it exhibits essentially no reduced fitness upon inbreeding (Marriage & Kelly 2009). These results are consistent with a genetic bottle-neck and/or high levels of clonal (asexual) reproduction in the DUN population, which could result in high fixed mutational load. If this idea is correct, then the two QTLs with high heterozygote fitness might be explained by the IM alleles masking the deleterious recessive effects of DUN alleles at those genomic regions.
Costs associated with local adapted loci
Fitness trade-offs, commonly observed at the phenotypic level in ecologically distinct populations (reviewed in Schluter 2000) are a predicted outcome of local adaptation (Kawecki & Ebert 2004). It is less clear whether or not such trade-offs exist at single loci, where alternate alleles contribute to local adaptation in contrasting environments and therefore have a fitness cost in non-native environments. Genotype by environment interactions can indicate true genetic trade-offs (change in rank between environments) or they can be the result of strong phenotypic differences observed between habitats or among genotypes at a single site.
Our analysis was designed to test for QTL genotype by environment interactions for individual traits measured in the two distinct habitats. We found significant QTL by environment interactions for plant size and fitness in two contrasting environments for both DIV loci in the BC-IM population. Large plant size is selectively favoured at both sites (Hall & Willis 2006) and our results show that the native alleles tend to be larger and fitter in their respective habitats. The significant interaction implies that these QTLs are locally adapted, though in most cases this is due to one genotype having higher fitness in its native environment while the alternate genotype is selectively neutral between sites without detectable evidence of a cost.
Although we found evidence for conditional neutrality for individual traits measured in the two environments, when we examine fitness traits jointly, we find evidence for a trade-off in the BC-IM population at the DIV2 locus for two highly correlated fitness traits: total flower number in year 1 and total seed number in year 1, or λ (λ is a composite fitness estimate that includes seed production in year 1). In this example, individuals with native homozygous genotypes produce more flowers at the Cascades site than plants with a non-native DUN allele (heterozygous individuals). At this same locus at the Dunes site, the opposite is true, where individuals with the native DUN allele produce substantially more seeds than genotypes homozygous for non-native alleles. We also detected these same QTL effects in the genome wide analysis (affecting flower number in the Cascades and λ at the Dunes site), though the location of the QTL affecting flower number is at a slightly different position (~20 cM) away. Because we did not examine confidence intervals or 2-LOD scores at these individual QTLs, it is not unlikely that these QTL effects are caused by the same underlying QTL.
Our study is the first that we are aware of where there appears to be a genetic trade-off at an individual locus (DIV2) contributing to local adaptation. Even so, our study also provided many more potential examples of conditional neutrality where native alleles are favoured at one site and selectively neutral at another site. To date, there has been evidence of QTL by environment interactions due to conditional neutrality (Weinig et al. 2003; Verhoeven et al. 2004, 2008; Gardner & Latta 2006). Notably, all of these previous studies focused on selfing organisms, where limited recombination between populations could favour the maintenance of allelic variation at separate loci involved in local adaptation. In an outcrosser such as M. guttatus, however, even limited gene flow or recombination would facilitate the fixation of conditionally beneficial alleles. It is therefore striking that we also found evidence for conditional neutrality at several individual traits. It is possible that the modest favouring of native alleles in each environment for fitness could maintain variation at these loci (Weinig et al. 2003) and it is certainly possible that weak selective differences in one habitat might be undetectable in reasonably large field experiments. It is also worth noting that in any field study, there are likely to be unmeasured components of fitness that could contribute to local adaptation and exhibit trade-offs. Given that we detected trade-offs at correlated fitness traits, it is also likely that different components of fitness carry different weight in different environments and it is therefore difficult to directly compare a single trait across habitats.
Granted the importance of local adaptation in driving the diversification of organisms, it is surprising that only now are evolutionary biologists beginning to deconstruct the dynamics of this process at the level of the individual locus. Trade-offs at individual loci across habitats is an implicit assumption of genomic scans for adaptive loci (Turner et al. 2010) and are thought to be involved in the formation of ecological reproductive isolating barriers (Nosil et al. 2009). Future field experimentation across multiple systems will be necessary to resolve how often trade-offs are actually involved in crucial evolutionary processes.
Supplementary Material
Table S1 Sample sizes per trait for the number of line means measured in each genetic background at both (A) Cascades and (B) Dunes field sites
Fig. S1 Crossing design.
Acknowledgements
The authors would like to thank L. Cooley, R. McDevitt and J. Morich for field assistance, as well as Tim Vines, Aurélie Bonin and four anonymous reviewers for helpful comments to the manuscript. The Duke Sequencing Facility staff, especially L. Bukovnik, made this research possible. Funding was provided by the National Science Foundation grants EF-0328636 and EF-0723814 to J.W. as well as two Doctoral Dissertation Improvement Grants to M.H. (DEB-010577) and D.L. (DEB-0710094). Additional funding was also provided by a Sigma Xi Grants-In-Aid of Research to M.H. and a NIH graduate student fellowship to D.L.
Footnotes
M.C.H. is an Assoc. Research Specialist at the Energy Biosciences Institute at UC Berkeley and is interested in using genomics to understand plant adaptations. D.B.L. is a postdoctoral researcher at UT Austin with interest in plant ecological speciation and adaptation. J.H.W. is a Professor of Biology at Duke University. This work was done while M.C.H. and D.B.L. were PhD students in the Willis lab, which addresses diverse topics in evolutionary and ecological genetics, especially by studying natural populations of Mimulus species.
Supporting Information
Additional supporting information may be found in the online version of this article.
References
- Anastasiou E, Lenhard M (2007) Growing up to one’s standard. Current Opinion in Plant Biology, 10, 63–69. [DOI] [PubMed] [Google Scholar]
- Basten CJ, Weir BS, Zeng ZB (2002) QTL Cartographer: A Reference Manual and Tutorial for QTL Mapping. Department of Statistics, North Carolina State University, Raleigh, NC. [Google Scholar]
- Bogre L, Magyar Z, Lopez-Juez E (2008) New clues to organ size control in plants. Genome Biology, 9, 226. [DOI] [PMC free article] [PubMed] [Google Scholar]
- Bradshaw HD, Schemske DW (2003) Allele substitution at a flower colour locus produces a pollinator shift in monkeyflowers. Nature, 426, 176–178. [DOI] [PubMed] [Google Scholar]
- Busov VB, Brunner AM, Strauss SH (2008) Genes for control of plant stature and form. The New Phytologist, 177, 589–607. [DOI] [PubMed] [Google Scholar]
- Churchill GA, Doerge RW (1994) Empirical threshold values for quantitative trait mapping. Genetics, 138, 963–971. [DOI] [PMC free article] [PubMed] [Google Scholar]
- Dobzhansky T (1951) Genetics and The Origin of Species. Columbia University Press, New York. [Google Scholar]
- Falconer DS (1952) The problem of environment and selection. The American Naturalist, 86, 293–298. [Google Scholar]
- Fishman L, Kelly A, Morgan E, Willis JH (2001) A genetic map in the Mimulus guttatus species complex reveals transmission ratio distortion due to heterospecific interactions. Genetics, 159, 1701–1716. [DOI] [PMC free article] [PubMed] [Google Scholar]
- Fishman L, Kelly AJ, Willis JH (2002) Minor quantitative trait loci underlie floral traits associated with mating system divergence in Mimulus. Evolution, 56, 2138–2155. [DOI] [PubMed] [Google Scholar]
- Fishman L, Aagaard J, Tuthill JC (2008) Toward the evolutionary genomics of gametophytic divergence: patterns of transmission ratio distortion in monkeyflower (Mimulus) hybrids reveal a complex genetic basis for conspecific pollen precedence. Evolution, 62, 2558–2571. [DOI] [PubMed] [Google Scholar]
- Futuyma DJ, Moreno G (1988) The evolution of ecological specialization. Annual Review of Ecology and Systematics, 19, 207–233. [Google Scholar]
- Gardner KM, Latta RG (2006) Identifying loci under selection across contrasting environments in Avena barbata using quantitative trait locus mapping. Molecular Ecology, 15, 1321–1333. [DOI] [PubMed] [Google Scholar]
- Hall MC, Willis JH (2005) Transmission ratio distortion in intraspecific hybrids of Mimulus guttatus: implications for genomic divergence. Genetics, 170, 375–386. [DOI] [PMC free article] [PubMed] [Google Scholar]
- Hall MC, Willis JH (2006) Divergent selection on flowering time contributes to local adaptation in Mimulus guttatus populations. Evolution, 60, 2466–2477. [PubMed] [Google Scholar]
- Hall MC, Basten CJ, Willis JH (2006) Pleiotropic quantitative trait loci contribute to population divergence in traits associated with life history variation in Mimulus guttatus. Genetics, 172, 1829–1844. [DOI] [PMC free article] [PubMed] [Google Scholar]
- Hansen TF, Carter AJR, Pelabon C (2006) On adaptive accuracy and precision in natural populations. The American Naturalist, 168, 168–181. [DOI] [PubMed] [Google Scholar]
- Hedrick PW (1986) Genetic polymorphism in heterogeneous environments: a decade later. Annual Review of Ecology and Systematics, 17, 535–566. [Google Scholar]
- Hereford J (2009) A quantitative survey of local adaptation and fitness trade-offs. The American Naturalist, 173, 579. [DOI] [PubMed] [Google Scholar]
- Ingram GC, Waites R (2006) Keeping it together: co-ordinating plant growth. Current Opinion in Plant Biology, 9, 12–20. [DOI] [PubMed] [Google Scholar]
- Jiang C, Zeng ZB (1995) Multiple trait analysis of genetic mapping for quantitative trait loci. Genetics, 140, 1111–1127. [DOI] [PMC free article] [PubMed] [Google Scholar]
- Kawecki TJ, Ebert D (2004) Conceptual issues in local adaptation. Ecology Letters, 7, 1225–1241. [Google Scholar]
- Kelly A, Willis J (1998) Polymorphic microsatellite loci in Mimulus guttatus and related species. Molecular Ecology, 7, 769–774. [Google Scholar]
- Krizek BA (2009) Making bigger plants: key regulators of final organ size. Current Opinion in Plant Biology, 12, 17–22. [DOI] [PubMed] [Google Scholar]
- Lexer C, Rosenthal DM, Raymond O, Donovan LA, Rieseberg LH (2005) Genetics of species differences in the wild annual sunflowers, Helianthus annuas and Helianthus petiolaris. Genetics, 169, 2225–2239. [DOI] [PMC free article] [PubMed] [Google Scholar]
- Linhart YB, Grant MC (1996) Evolutionary significance of local genetic differentiation in plants. Annual Review of Ecology and Systematics, 27, 237–277. [Google Scholar]
- Lowry DB, Rockwood RC, Willis JH (2008) Ecological reproductive isolation of coast and inland races of Mimulus guttatus. Evolution, 62, 2196–2224. [DOI] [PMC free article] [PubMed] [Google Scholar]
- Lowry DB, Hall MC, Willis JH (2009) Genetic and physiological basis of adaptive salt tolerance divergence between coastal and inland Mimulus guttatus. The New Phytologist, 183, 776–799. [DOI] [PubMed] [Google Scholar]
- Marriage TN, Kelly JK (2009) Inbreeding depression in an asexual population of Mimulus guttatus. Journal of Evolutionary Biology, 22, 2320–2331. [DOI] [PubMed] [Google Scholar]
- Martin N (2004) Flower size preferences of the honeybee (Apis mellifera) foraging on Mimulus guttatus (Scrophularaceae). Evolutionary Ecological Research, 6, 772–782. [Google Scholar]
- McGraw JB, Caswell H (1996) Estimation of individual fitness from life-history data. The American Naturalist, 147, 47–64. [Google Scholar]
- Nosil P, Funk DJ, Ortiz-Barrientos D (2009) Divergent selection and heterogeneous genomic divergence. Molecular Ecology, 18, 375–402. [DOI] [PubMed] [Google Scholar]
- Rieseberg LH, Archer MA, Wayne RK (1999) Transgressive segregation, adaptation and speciation. Heredity, 83, 363–372. [DOI] [PubMed] [Google Scholar]
- Rieseberg LH, Raymond O, Rosenthal DM et al. (2003a) Major ecological transitions in wild sunflowers facilitated by hybridization. Science, 301, 1211–1216. [DOI] [PubMed] [Google Scholar]
- Rieseberg LH, Widmer A, Arntz AM, Burke JM (2003b) The genetic architecture necessary for transgressive segregation is common in both natural and domesticated populations. Philosophical Transactions of the Royal Society: Series B, 358, 1141–1147. [DOI] [PMC free article] [PubMed] [Google Scholar]
- Roff DA, Fairbairn DJ (2007) The evolution of trade-offs: where are we? Journal of Evolutionary Biology, 20, 433–447. [DOI] [PubMed] [Google Scholar]
- Roux F, Touzet P, Cuguen J, Le Corre V (2006) How to be early flowering: an evolutionary perspective. Trends in Plant Science, 11, 375–381. [DOI] [PubMed] [Google Scholar]
- Schluter D (2000) The Ecology of Adaptive Radiation. Oxford University Press, Oxford. [Google Scholar]
- Slate J (2005) Quantitative trait locus mapping in natural populations: progress, caveats and future directions. Molecular Ecology, 14, 363–379. [DOI] [PubMed] [Google Scholar]
- Stam P (1993) Construction of integrated genetic linkage maps by means of a new computer package JOINMAP. The Plant Journal, 3, 739–744. [Google Scholar]
- Sweigart AL, Karoly K, Jones A, Willis JH (1999) The distribution of individual inbreeding coefficients and pairwise relatedness in a population of Mimulus guttatus. Heredity, 83, 625–632. [DOI] [PubMed] [Google Scholar]
- Thompson JN (1994) The Coevolutionary Process. University of Chicago Press, Chicago. [Google Scholar]
- True JR, Liu J, Stam LF, Zeng Z-B, Laurie CC (1997) Quantitative genetic analysis of divergence in male secondary sexual traits between Drosophila simulans and Drosophila mauritiana. Evolution, 51, 816–832. [DOI] [PubMed] [Google Scholar]
- Turner TL, von Wettberg EJ, Hu TT, Bourne EC, Nuzhdin SV (2010) Population resequencing reveals local adaptation of Arabidopsis lyrata to serpentine soils. Nature Genetics, 42, 260–263. [DOI] [PubMed] [Google Scholar]
- Verhoeven KJF, Vanhala TK, Biere A, Nevo E, van Damme JMM (2004) The genetic basis of adaptive population differentiation: a quantitative trait locus analysis of fitness traits in two wild barley populations from contrasting habitats. Evolution, 58, 270–283. [PubMed] [Google Scholar]
- Verhoeven KJF, Poorter H, Nevo E, Biere A (2008) Habitat-specific natural selection at a flowering-time QTL is a main driver of local adaptation in two wild barley populations. Molecular Ecology, 17, 3416–3424. [DOI] [PubMed] [Google Scholar]
- Wang S, Basten CJ, Zeng ZB (2005) Windows QTL Cartographer 2.0. Department of Statistics, North Carolina State University, Raleigh, NC. [Google Scholar]
- Weinig C, Dorn LA, Kane NC et al. (2003) Heterogeneous selection at specific loci in natural environments in Arabidopsis thaliana. Genetics, 165, 321–329. [DOI] [PMC free article] [PubMed] [Google Scholar]
- Willis JH (1996) Measures of phenotypic selection are biased by partial inbreeding. Evolution, 50, 1501–1511. [DOI] [PubMed] [Google Scholar]
- Willis JH (1999) Inbreeding load, average dominance and the mutation rate for mildly deleterious alleles in Mimulus guttatus. Genetics, 153, 1885–1898. [DOI] [PMC free article] [PubMed] [Google Scholar]
- Zeng ZB (1993) Theoretical basis of separation of multiple linked gene effects on mapping quantitative trait loci. Proceedings of the National Academy of Sciences, USA, 90, 10972–10976. [DOI] [PMC free article] [PubMed] [Google Scholar]
- Zeng ZB (1994) Precision mapping of quantitative trait loci. Genetics, 136, 1457–1468. [DOI] [PMC free article] [PubMed] [Google Scholar]
Associated Data
This section collects any data citations, data availability statements, or supplementary materials included in this article.
Supplementary Materials
Table S1 Sample sizes per trait for the number of line means measured in each genetic background at both (A) Cascades and (B) Dunes field sites
Fig. S1 Crossing design.