

Abstract
Neurofibrillary tangles of the Tau protein and plaques of the amyloid β peptide are hallmarks of Alzheimer’s disease (AD), which is characterized by the conversion of monomeric proteins/peptides into misfolded β-sheet rich fibrils. Halting the fibrillation process and disrupting the existing aggregates are key challenges for AD drug development. Previously, we performed in vitro high-throughput screening for the identification of potent inhibitors of Tau aggregation using a proxy model, a highly aggregation-prone hexapeptide fragment 306VQIVYK311 (termed PHF6) derived from Tau. Here we have characterized a hit molecule from that screen as a modulator of Tau aggregation using in vitro, in silico, and in vivo techniques. This molecule, an anthraquinone derivative named Purpurin, inhibited ~ 50% of PHF6 fibrillization in vitro at equimolar concentration and disassembled pre-formed PHF6 fibrils. In silico studies showed that Purpurin interacted with key residues of PHF6, which are responsible for maintaining its β-sheets conformation. Isothermal titration calorimetry and surface plasmon resonance experiments with PHF6 and full-length Tau (FL-Tau), respectively, indicated that Purpurin interacted with PHF6 predominantly via hydrophobic contacts and displayed a dose-dependent complexation with FL-Tau. Purpurin was non-toxic when fed to Drosophila and it significantly ameliorated the AD-related neurotoxic symptoms of transgenic flies expressing WT-FL human Tau (hTau) plausibly by inhibiting Tau accumulation and reducing Tau phosphorylation. Purpurin also reduced hTau accumulation in cell culture overexpressing hTau. Importantly, Purpurin efficiently crossed an in vitro human blood–brain barrier model. Our findings suggest that Purpurin could be a potential lead molecule for AD therapeutics.
Electronic supplementary material
The online version of this article (10.1007/s00018-019-03312-0) contains supplementary material, which is available to authorized users.
Keywords: Aggregation, Amyloid, Inhibitor, Purpurin, PHF6 peptide, Tau protein
Introduction
Alzheimer disease (AD), a major form of dementia is a progressive neurodegenerative disorder of the elderly [1]. Currently, worldwide there are more than 50 million people are diagnosed with AD (https://www.alz.co.uk/research/statistics). Owing to advances in medicine, human lifespan is increasing; hence this number is expected to increase at an alarming rate in the near future with severe social and economic consequences. Current treatments aim at alleviating AD symptoms, yet no disease-modifying therapeutics is available for this disease. The two pathological hallmarks of the AD brain are the accumulation of intra-cellular neurofibrillary tangles (NFT) of the Tau protein and extracellular deposits of amyloid beta (Aβ) as senile plaques, both of which are neurotoxic and lead to the demise of neurons [2–5]. Tau is an intra-neuronal protein, abundant in the central nervous system and is a member of the family of microtubule associated proteins [6, 7]. Under physiological conditions, Tau plays a key role in cytoskeleton stabilization by binding to the interface of tubulin heterodimers forming microtubules [6, 8]. However, in the diseased brain, the Tau protein undergoes abnormal post-translational modifications which on the one hand lead to its detachment from microtubules, resulting in their disassembly (loss-of-function), and on the other hand promote the self-assembly of natively unfolded soluble Tau monomers into toxic insoluble amyloid assemblies (gain-of-function) [8–11].
Recent research suggests that accumulation of Tau and deposition of NFTs correlates better than Aβ pathology with clinical features of dementia [12, 13]. Thus, there is a revived interest in understanding the mechanism of Tau aggregation and finding agents that are capable of modulating its self-assembly for therapeutic purposes. The major challenge in AD and other related Tau-engendered diseases termed tauopathies [14] is to inhibit the accumulation of toxic Tau species to halt disease progression and as well as to clear the existing Tau deposits to alleviate disease symptoms. In recent years, Tau oligomers have been shown to propagate from cell to cell presenting an additional target for therapeutics [15, 16]. Self-assembly of Tau is believed to be instigated by two highly aggregation-prone hexapeptide fragments, namely 275VQIINK280 (termed PHF6*) and 306VQIVYK311 (termed PHF6) located in the second and third repeat of the microtubule-binding region of Tau, respectively [17–19]. Along these lines, cryo-EM analysis of Tau filaments showed that PHF6 forms the β-1 of the eight β-sheets (β-core) of the Tau fibrils [20]. Recently, Seidler and co-workers demonstrated a significant role of PHF6* in driving tau aggregation [19]. Experimental and theoretical studies with PHF6 indicate that the peptide displays a strong self-assembling tendency owing to the steric-zipper conformation in a highly ordered antiparallel-layered parallel β-sheet arrangement governed by main-chain hydrogen bonds [21–23]. Additionally, PHF6 is present in both 3R and 4R isoforms of Tau and forms in vitro fibrils analogous to those formed by full-length Tau (FL-Tau) [24–27]. Therefore, this hexapeptide fragment is widely used as a proxy model for FL-Tau to screen potential anti-amyloidogenic drug candidates for AD [24, 28–32].
The search for inhibitors of amyloid aggregation has resulted so far in several efficacious agents, including natural products such as alkaloids, polyphenolic compounds, and synthetic biomaterials such as peptide-based inhibitors [33–37]. For example, we have previously demonstrated the ability of Naphthoquinone-Tryptophan hybrids, i.e., NQTrp and Cl-NQTrp, to inhibit PHF6 aggregation and disassemble the pre-formed PHF6 aggregates in vitro. We reported that NQTrp hybrids ameliorate AD-related symptoms in transgenic Drosophila fly models expressing the FL-WT human Tau protein (hereafter hTau) or Aβ [24–26, 38]. Recently, we performed an in vitro High-throughput screening (HTS) using PHF6 as a model and identified potential hit small molecules that modulate its aggregation [30].
In the present work, we have characterized a lead hit from that HTS, a naturally occurring anthraquinone dye pigment named Purpurin. The modulatory effect of Purpurin on Tau aggregation was evaluated using in vitro, in silico, and in vivo techniques. Using complementary in vitro assays, we found that Purpurin inhibited PHF6 aggregation in a dose-dependent manner and disassembled pre-formed PHF6 fibrils. Using binding and thermodynamic studies, we established that Purpurin interacted with monomeric PHF6 predominantly via hydrophobic contacts and displayed a concentration-dependent complexation with FL-Tau protein. Using a computational approach, we determined a plausible mechanism of action of Purpurin in disaggregating pre-formed PHF6 fibril. Using an animal model and a cell model overexpressing hTau, we demonstrated that Purpurin alleviates AD-like symptoms and reduces the accumulation of total hTau, respectively. Using an in vitro model of the human blood–brain barrier (BBB) [39], comprising of human brain-like endothelial cells (BLECs) together with brain pericytes, we observed that Purpurin was able to cross it efficiently. These results are in line with the reported ability of other anthraquinone analogs to inhibit Tau aggregation and dissolve PHFs in vitro and in a cell model [40]. Insights obtained from the present work suggest Purpurin as an efficient candidate for modulating Tau aggregation and may help in the rational design of small molecule compounds for AD therapeutics.
Materials and methods
Materials
All chemicals and reagents were of analytical grade. Unless otherwise stated, all chemicals were obtained from Sigma-Aldrich (Rehovot, Israel). Synthetic PHF6 peptide (Ac-VQIVYK-NH2) was purchased from GL Biochem (Shanghai, China), and FL-Tau (longest isoform, 441 amino acids) was purchased from AnaSpec (CA, USA). Antibody (AT180) against phosphorylated Tau was purchased from Thermo Fisher Scientific (IL, USA), antibody (ab64193) against total Tau and antibody (ab9485) against GAPDH was purchased from Abcam (Cambridge, UK). Cell culture media and supplies were purchased from Biological Industries (Israel) unless specified.
Stock preparation
PHF6 peptide for the in vitro assays was prepared as described previously [24, 28]. Monomeric PHF6 peptide was attained after a 10 min pre-treatment with HFIP and was subsequently dried using SpeedVac. The resulting thin film was dissolved in ddH2O and sonicated for 3 min (three times). The concentration of the peptide was determined using a NanoDrop (Denovix spectrophotometer) (calculated according to ε280 of 1490 M−1 cm−1) and adjusted to a stock concentration of 1 mM with 20 mM MOPS (pH 7.2). A stock solution of Thioflavin S (ThS, 4 mM) and heparin (100 µM) were prepared in 20 mM MOPS (pH 7.2).
High-throughput screening assay
The hit molecule (Purpurin) used in this study was obtained from the HTS described earlier [30]. Briefly, the screen of the chemical library consisting of 2401 FDA approved/bioactive compounds was performed based on ThS fluorescence. All assays were done on flat black 384 well plates under automated HTS conditions (Tecan robot; Freedom EVO 200). The reaction mixture contained 50 µM PHF6, 100 µM ThS, 10 µM heparin and 10 µM compounds (in 20 mM pH 7.2 MOPS). Kinetic fluorescence data were collected at 25 °C with measurements taken at 20 s intervals for 30 min. PHF6 alone in DMSO served as a control for the screen.
PHF6 aggregation inhibition and fibril disassembly assay
For aggregation assay, stock solutions were diluted in 100 µL wells of a 96-well black plate containing 50 µM PHF6 and 100 µM ThS in 20 mM MOPS. For the inhibition assays, 50 µM PHF6 and 100 µM ThS were incubated in the presence of various doses of Purpurin (0, 10, 50, 100 and 250 µM) in MOPS buffer. Immediately before the experiment, heparin (10 µM) was added to initiate PHF6 aggregation. For the disassembly of pre-formed fibrils, PHF6 was allowed to aggregate as mentioned above. When a plateau of ThS fluorescence was observed (~ 45 min), Purpurin (10, 50, 100 and 250 µM) was added to the designated wells, and the assay was continued for additional ~ 60 min. Control wells were supplemented with the same concentration of DMSO as the test wells containing Purpurin. Kinetic fluorescence data were collected at 25 °C in replicates using Infinite M200 microplate reader (Tecan, Switzerland), with the measurement taken at every 20 s interval (ThS: λex—440 nm and λem—490 nm). All assays were performed at least twice to ensure reproducibility.
Circular dichroism spectroscopy
To analyze the secondary structure of the aggregates, PHF6 peptide (50 µM) was incubated with increasing concentration of Purpurin (0, 10, 50 and 250 µM) and heparin (10 µM) for 2 h at 25 °C. For disassembly of PHF6 fibrils, the peptide was allowed to aggregate for 2 h in the absence of Purpurin and subsequently incubated for 3 h with increasing concentration of Purpurin. Before measurements, all samples were diluted to 40 µM and placed in 1 mm cuvette. CD spectra were then recorded on a Chirascan spectrometer in the range of 200–250 nm, and the background was subtracted from the CD spectra values. Since DMSO absorbs at far UV range, stocks of Purpurin were prepared in methanol for this assay.
Transmission electron microscopy
For inhibition and disaggregation experiments, PHF6 peptide was prepared as mentioned in “PHF6 aggregation inhibition and fibril disassembly assay”. Samples (10 µl) were placed on 400-mesh copper grids covered with a carbon-stabilized Formvar film [Electron Microscopy Sciences (EMS), PA, USA] for 2 min. Excess fluid was removed, and the grids were negatively stained with 2% Uranyl acetate solution (10 µl) for 2 min. Finally, excess fluid was removed, and the samples were observed by a JEM-1400 TEM (JEOL) operated at 80 kV.
Isothermal titration calorimetry (ITC)
ITC measurements were performed as described previously [41]. Fresh monomeric PHF6 and Purpurin were diluted to 400 μM and 50 μM, respectively in 20 mM MOPS. A sample of 300 µL Purpurin was inserted into the Nano ITC low volume cell (TA Instruments, DE, USA) and the titrating syringe was filled with 50 μL PHF6 solution. The system was allowed to reach a stable temperature of 25 °C along 2000 s and then collected baseline for 500 s. Subsequently, PHF6 was titrated to the Purpurin solution or MOPS. Titration was carried out in 5 μL aliquots that were let to equilibrate for 300 s before adding the next drop along ten drops of total 47.5 μL (1st drop is half volume). The resulting isotherm was analyzed by Nanoanalyze software using an independent interaction model. Baseline correction was performed by titrating PHF6 to MOPS blank.
Surface plasmon resonance (SPR)
SPR binding assay was performed on ProteOn XPR36 protein interaction array system (Bio-Rad, CA, USA) with GLC chip, coated with monomeric FL-Tau protein. Tau was attached to the chip using standard crosslinking procedure after activation with 1-ethyl-3-[3-dimethylaminopropyl] carbodiimide (EDC, 50 mM) mixed with N-hydroxysulfosuccinimide (sNHS, 5 mM) (Bio-Rad ProteOn user’s manual, Bulletin_6295). FL-Tau (6 µg) was dissolved in 300 mL acetate buffer (pH 5.5) and circulated in the activated chip for measuring the binding over 300 s. Control channel was coated with bovine serum albumin (BSA, 6 µg) as mentioned above to determine the non-specific interactions. Following coating, the chip was circulated with ethanolamine (1 M, 300 s) and washed with PBST. Subsequently, Purpurin (5 μM and 10 μM) in PBST was inserted to the system, and the chip response was measured over 600 s. Following protein-Purpurin interaction, the chip was cleaned with PBST. The actual response of FL-Tau was obtained after subtracting the non-specific signal of the BSA coated channel.
Molecular docking
Purpurin was docked to the monomeric PHF6 peptide (PDB ID: 2ON9) using induced fit docking (IFD) protocol as described previously [30]. All docking computations were performed using the Schrodinger software, release 2016-2 and Small-molecule drug discovery suite (Schrodinger, LLC, NY, 2016) on Windows and Linux platforms. The following Schrodinger modules were used: Protein Preparation Wizard [42], LigPrep, Glide [43–45], Prime [46, 47] and IFD [48–50]. All modules were accessed via the Maestro graphical interface.
Molecular dynamics simulation
The coordinates of PHF6 peptides were obtained from PDB ID: 2ON9 [51] and the N-terminus of the peptide was acetylated. Further, the X-ray unit cell of the 2ON9 was replicated to attain the fibril structure consisting of 42 peptide units [26]. Three-dimensional conformer of Purpurin was obtained from PubChem (CID: 6683), and GROMACS topology for the molecule was generated using the PRODRG Server [52]. The atomic charge and charge groups of Purpurin were generated based on the GROMOS96 54a7 force field parameters [53]. Molecular dynamics simulation was performed in the isothermal-isobaric ensemble using GROMACS (4.5.3) with GROMOS96 54a7 force field [53–55]. Water was described using the simple point charge (SPC) water model. The pressure was controlled at 1 atm and temperature was retained at 310 K using Parrinello-Rahman Barostat and V-rescale thermostat, respectively. A salt concentration of 0.15 M NaCl was added to mimic the physiological conditions. Two femtoseconds (fs) time step was used to integrate the equation of motion. The electrostatic interaction was calculated using particle mesh Ewald sums with a non-bonded cut off 10 Å. Bonds between hydrogen and heavy atoms were constrained at their equilibrium length using the linear constraint solver (LINCS) algorithm [56]. Initially, the energy minimization of the system was carried out followed by the equilibration for 100 picoseconds (ps). Subsequently, a production run for 20 ns was performed. Trajectories were saved at 10 ps intervals, and analyses of the trajectories were carried out using GROMACS suite of programs and PyMOL (https://pymol.org/2/).
Fly keeping
Flies were reared on standard cornmeal-molasses medium and were kept at 25 °C. Crosses were performed at 25 °C. Adult offspring (F1) from the crosses were collected up to 2 days after the beginning of their eclosion at 25 °C.
Fly genetics and crossing
Transgenic strain overexpressing hTau, comprising 441 amino acids [57, 58], under the upstream activating sequence (UAS) has been described previously [59] and was a generous gift from Dr. George Jackson (University of Texas Medical Branch, Galveston, TX). The GMR-Gal4 strain used to drive the expression of hTau in the eyes was a kind gift from Dr. Hermann Steller (Rockefeller University, New York, NY). Virgin females, carrying the GMR-Gal4 driver on chromosome X, were collected and crossed with males carrying UAS-hTau on the 2nd chromosome or with wild type Oregon-R (OR) males as a control (hereafter GMR-Gal4 control). This resulted in F1 offspring overexpressing hTau in the retina.
Fly feeding
Purpurin was added to standard molasses medium at a concentration of 0.75 mg/mL, as previously described for NQTrp [38, 60], and the mixture was aliquoted into rearing vials. The vials were kept at 4 °C, in the dark until use. Crosses were performed either on standard Drosophila medium (lacking Purpurin) or on medium supplemented with Purpurin. Animals were fed on the appropriate medium from the beginning of the larval stage onwards throughout adult life.
Scanning electron microscopy (SEM)
Twelve-day-old female flies from each of the resultant F1 groups, crossed and reared at 25 °C, were fixed in 4% paraformaldehyde (PFA, #28908, Thermo Scientific) for 1 h at room temperature. After repeated washes with PBS, the flies were dehydrated with increasing concentrations of ethanol, critical-point dried and coated with gold. The samples were analyzed with a JCM-6000PLUS NeoScope Benchtop SEM.
Qualitative classification of the eye phenotype
Both eyes of each 10 days old female flies from the resultant F1 groups were examined under a stereomicroscope. The eye defects observed were classified into three classes according to their severity (see Fig. 6a): class 1 had normal eyes, class 2 had mucosal eyes but had otherwise normal morphology, class 3 exhibited a collapse of the eye tissue, and class 4 had black spots of apoptotic tissue on their eyes. Chi-squared test was performed to examine whether the distribution of eye classes in each experimental group was significantly different from the untreated flies overexpressing hTau. Student’s t test was performed on the averages of the groups. p value < 0.05 was considered to be significantly different in both tests. The validity of this categorization was verified beforehand by finding that the classification results of three independent researchers do not differ significantly.
Fig. 6.
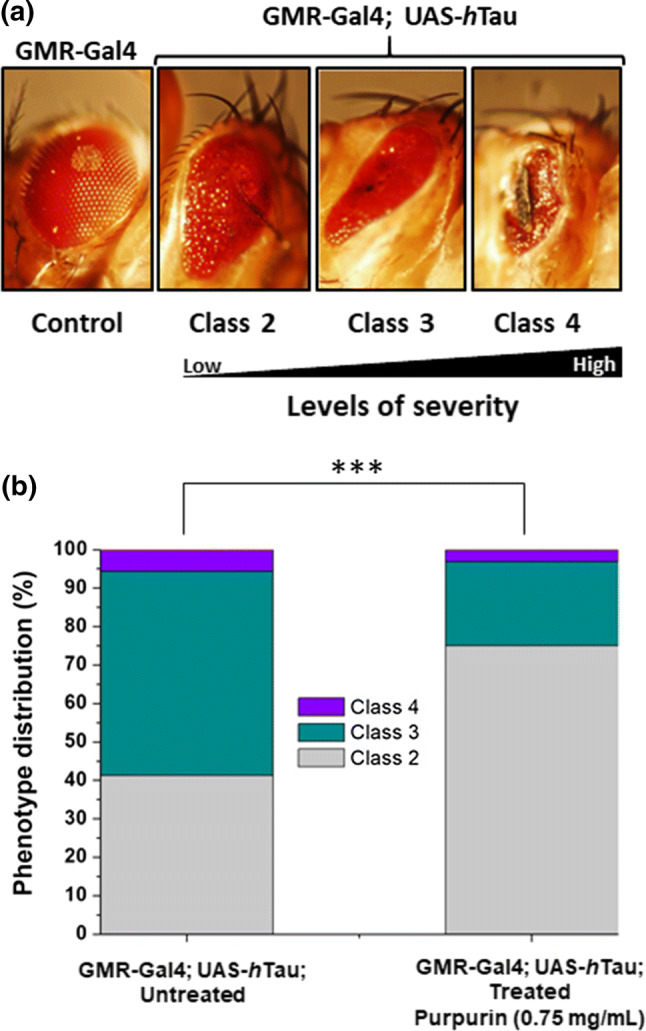
Classification and phenotype distribution of eyes of flies untreated or treated with Purpurin a Stereo-microscope aided classification of eye severity phenotypes caused by overexpression of hTau in the GMR-Gal4; UAS-hTau flies eyes, b distribution of qualitatively classified eye phenotypes in a population of flies overexpressing hTau (GMR-Gal4; UAS-hTau), without or with Purpurin treatment. Percentages of the classification categories for each group are shown on the bars (number of flies = 80 in each group). Student’s t test analysis showed ***p < 0.01
Quantification of eye pigment
Seven-day-old female flies from each of the F1 groups were stored for 1 day at − 80 °C, decapitated and their heads were distributed into 3–5 tubes containing 15 heads each. Next, 50 µl of AEA buffer (50% ethanol, pH 2.0) were added to each tube, and the tubes were stored for 3 days at room temperature in the dark. Then, each sample was diluted with an equivalent volume of AEA buffer. The absorbance of the samples was measured using a NanoDrop (Denovix spectrophotometer) at 480 nm and was normalized according to the formula:
T test was performed for evaluating the statistical significance of the observed differences (p value < 0.05 was considered to be statistically different).
Western blot analysis
Samples were subjected to SDS-PAGE using 4–20% (w/v) polyacrylamide gel under reducing conditions and transferred onto PVDF membrane using a dry blot (iBlot®, Life Technologies, Grand Island, NY). Western blot analysis was performed to detect the presence of phosphorylated Tau using the AT180 antibody which detects pThr231 or to evaluate total Tau levels using the ab64193 antibody. Briefly, the membrane was blocked for 1 h using 5% milk diluted in TBS. AT180 or ab64193; diluted 1:1000 in Signal Boost™ or milk were added on the subsequent day to the membrane for overnight incubation at 4 °C, followed by several washes with TBST (0.3% Tween). Next, the membrane was incubated with Goat anti-Mouse IgG-HRP diluted in Signal Boost™ for AT180 and Goat anti-Rabbit IgG-HRP diluted in milk for ab64193 as secondary antibodies (Santa Cruz Biotechnology, TX, USA) for 1 h at room temperature while shaking. Blots were developed after thorough TBST washes, using an Amersham Imager 600 (GE Healthcare). Densitometric analysis of phosphorylated and total Tau levels was performed using ImageJ software [61].
Cell culture
SH-SY5Y (ATCC CRL-2266) cells were cultured in Dulbecco’s Modified Eagle’s Medium/Nutrient Mixture F-12 (DMEM-F12) supplemented with 10% fetal bovine serum, 1% l-glutamine, 1% pen-strep nystatin, and 1% non-essential amino acids. Cells were incubated under 5% CO2 at 37 °C. Cells were stably transfected with the pcDNA4 plasmid containing hTau, using Lipofectamine LTX (Invitrogen). Cells were sub-cloned, and one colony was chosen for subsequent experiments. For selection, Zeocin antibiotic (Tamar laboratories, Israel) at a concentration of 150 μg/mL was added from day three post-transfection throughout the culture period. To determine the effect of Purpurin on the accumulation of hTau, cells overexpressing hTau were seeded onto a 6-well plate and cultured for 2 days. Subsequently, 10 μM Purpurin was added to the designated wells and incubated for 2 additional days. Non-transfected cells that do not overexpress hTau, untreated or treated with Purpurin were used as control. Later, the cells were harvested, lysed and the total protein was subjected to SDS-PAGE. Total hTau from Purpurin treated hTau overexpressing cells was analyzed using western blot immunolabelled with total Tau antibody (ab64193 antibody) and compared to total hTau from untreated cells overexpressing hTau. GAPDH labeled with ab9485 antibody was used as a loading control. Quantification of total hTau/GAPDH was performed using densitometric analysis (GE Healthcare Densitometer, Pharmacia Biotech, USA).
Blood–brain barrier (BBB) permeability assay
The human BBB model developed by Gosselet’s team is intensively used to measure molecules passage across the human BBB [39, 62–66]. Briefly, this model consists of isolated progenitors of endothelial cells, expressing the CD34+ marker, from human umbilical cord blood. These cells were Differentiated into endothelial cells and subsequently cultivated with brain pericytes. After 6 days of co-culture, cells express the major properties observed by the human BBB and named as brain-like endothelial cells (BLECs). Filter inserts, containing confluent monolayers of BLECs were cultivated in the 12-well plate after which compound solution containing the fluorescent integrity marker sodium fluorescein (50 µg/mL; Sigma, United States) or Purpurin (0.5 mM) was added to the luminal side, and then placed on a shaker at 37 °C. After 20 min, inserts were transferred to a new 12-well plate, and aliquots from the abluminal solution were taken, and the fluorescence was quantified using a calibration curve. Inserts without cells were tested in each Pe measurement. Sodium Fluorescein and Purpurin detection were carried out on an Infinite 200 PRO (Tecan, Switzerland) plate reader using the excitation/emission wavelength (nm) settings: 485/538 and 505/700, respectively. Pe coefficient was obtained from the slope of the calculated clearance curve as described previously [67]. Typical Pe value for the control was Pe = 0.3 × 10⁻³ cm min−1.
Results and discussion
Purpurin: a hit from high-throughput screening for small molecule inhibitors of Tau aggregation
To find an effective inhibitor molecule of Tau protein aggregation, we screened a library of 2401 FDA approved, bio-active and natural compounds (The Spectrum Collection, Microsource Discovery Systems Inc., CT, USA) using the Tau-derived PHF6 peptide (Fig. 1a), which is a proxy model [24, 29, 32] for aggregation of the FL-Tau protein (Fig. 1b). The hit small molecule used in the present study, named Purpurin (1,2,4-Trihydroxyanthraquinone) (Fig. 1c), is an anthraquinone derivative, which was obtained from our previous screen [30]. The in vitro high-throughput screening (HTS) was based on monitoring ThS fluorescence signal which directly correlates with the extent of amyloidogenic species in the mixture [68]. Incubation of PHF6 peptide with Purpurin significantly reduced the ThS signal when compared to PHF6 control, i.e., PHF6 aggregated in the absence of any small molecule, and thus emerged as one of the top hits from the HTS (SI Fig. 1).
Fig. 1.

Molecular structure of a Tau-derived PHF6 peptide, b scheme of FL-Tau protein, c Purpurin
Purpurin inhibits aggregation of the PHF6 peptide in a dose-dependent manner
Several complementary in vitro assays were performed to determine the inhibitory potency of Purpurin towards PHF6 aggregation. First, ThS assay was conducted by incubating PHF6 (50 µM) with increasing concentrations (0, 10, 50, 100, and 250 µM) of Purpurin. Thioflavin is a benzothiazole based amyloid reporter dye, which is barely fluorescent when free in solution but upon binding to cross β-sheet rich structures, as observed in amyloid fibrils, shows an increase in fluorescence intensity correlated with the quantity of amyloid fibrils in the solution [69, 70]. As shown in Fig. 2a, the control samples, i.e., PHF6 incubated in the absence of Purpurin rapidly aggregated and attained a plateau of ThS fluorescence within less than 20 min. Upon incubation with Purpurin (from time t = 0 min) ThS fluorescence decreased with increasing concentration of Purpurin, signifying a robust dose-dependent inhibition of PHF6 aggregation. A plot of % amyloid vs. dose of Purpurin revealed significant inhibition (~ 50%) of PHF6 aggregation at 1:1 molar ratio (PHF6: Purpurin) compared with the control sample, i.e., PHF6 incubated in the absence of Purpurin. Maximum inhibition occurred at a molar ratio of 1:5, which accounted for ~ 90% inhibition (Fig. 2b).
Fig. 2.

Inhibitory effect of Purpurin towards PHF6 aggregation a Inhibition of PHF6 peptide fibrillization (50 µM) by Purpurin at 5:1, 1:1, 1:2 and 1:5 molar ratio (PHF6: Purpurin) monitored by ThS fluorescence assay, b plot showing percentage amyloid remaining in the mixture after aggregation inhibition. Error bars indicate standard error, c circular dichroism spectroscopy analysis of PHF6 peptide fibrils in the absence or presence of Purpurin. Representative TEM images of PHF6 peptide fibrils: d control fibrils, e 5:1, f 1:1, g 1:5 molar ratio (PHF6: Purpurin)
To obtain insights into the secondary structural changes occurring during the aggregation process, samples of PHF6 aggregates formed in the absence or presence of Purpurin were analyzed using CD spectroscopy. PHF6 monomers at time t = 0, exhibited a negative peak around 195 nm, indicating the native random coil conformation (SI Fig. 2). However, after the addition of heparin (10 μM) control sample, i.e., in the absence of Purpurin, adopted a robust negative peak around 218 nm, indicating that the peptides had acquired a β-sheet rich conformation upon aggregation, which is typical to that of amyloid structures (Fig. 2c). Next, the spectra of PHF6 aggregated in the presence of various doses of Purpurin were analyzed. The negative ellipticity peak at 218 nm denoting β-sheet structures decreased gradually with increasing concentration of Purpurin (Fig. 2c). This data suggests that Purpurin could effectively interfere with the aggregation process and significantly reduce the conversion of PHF6 monomers to β-sheet rich amyloid assemblies.
TEM imaging of the PHF6 fibrils formed in the absence or presence of Purpurin at molar ratios 5:1, 1:1 and 1:5 (PHF6: Purpurin) were performed, and representative images are shown in Fig. 2d–g. In the absence of Purpurin, i.e., PHF6 control, the fibrils appeared mature, long, dense, and uniform (Fig. 2d). In contrast, when treated with Purpurin PHF6 fibrils with broken morphology and a prominent decrease in the fibril density were observed in a dose-dependent manner (Fig. 2e–f). At the highest molar ratio of 1:5 (PHF6: Purpurin), only a few short fibrils were visible (Fig. 2g). This result is in good agreement with the insights obtained from ThS assay and CD analysis, i.e., drop in amyloid content and reduced β-sheet conformation upon Purpurin treatment, which collectively indicate that Purpurin efficiently inhibited the formation of PHF6 amyloids.
Characterization of Purpurin’s interaction with the PHF6 peptide and FL-Tau protein
To evaluate the thermodynamic properties of Purpurin binding with PHF6, we performed isothermal titration calorimetry (ITC) measurements. Fresh monomeric preparation of PHF6 (400 μM) was titrated into a cell containing Purpurin (50 μM) to measure the corrected heat and the enthalpy value. Results of the titration profile and the thermodynamic values were calculated and are displayed in Fig. 3a, b and Table 1. Titration of PHF6 to Purpurin resulted in exothermal peaks. The Gibbs free energy (ΔG) was calculated from the enthalpy (ΔH) and entropy (ΔS) values. ΔG was found to be negative (− 33.191 kJ mole−1), indicating that the binding of Purpurin to PHF6 is spontaneous. A negative value for ΔH (− 9.139 kJ mole−1) and a positive value for TΔS (24.052 kJ mole−1) at 25 °C were determined. The absolute value of ΔH was much smaller than TΔS, suggesting that the interaction between Purpurin and PHF6 is an entropy-driven process. Enthalpy-favored binding is reported to occur through hydrogen bonding and electrostatic interactions, whereas entropy-favored binding occurs through hydrophobic contacts [71, 72]. Therefore, our results indicate that the binding of Purpurin to PHF6 was preferentially due to hydrophobic interactions. Additionally, the binding constant (Kd) value of 1.53 μM supported the strong affinitive binding of Purpurin to PHF6 monomers. The stoichiometric ratio (n = 0.905) indicates that one Purpurin molecule interacted with one PHF6 monomer, which collectively suggests that Purpurin binds to PHF6 at early stages of aggregation.
Fig. 3.

Binding of Purpurin to PHF6 and FL-Tau protein a heat pattern during PHF6-Purpurin binding measured by isothermal titration calorimetry (ITC), b curve showing the enthalpy changes with increasing PHF6 to Purpurin mole fraction. Data were fitted using an independent binding model, c molecular docking for Purpurin and PHF6 peptide monomer. Colour codes: Green sticks represent Purpurin, and blue-grey sticks represent PHF6; yellow, cyan, and green dashed lines represent hydrogen bonds, aromatic hydrogen bond, and hydrophobic contacts, respectively. See zoomed image in SI Fig. 3. Interaction of Purpurin with d FL-Tau protein and with e bovine serum albumin determined by surface plasmon resonance (SPR)
Table 1.
Thermodynamic properties of binding between Purpurin and monomeric PHF6 as determined by ITC measurements
| Parameter | Value | Standard deviation |
|---|---|---|
| Kd (M) | 1.53E−06 | NA |
| n | 0.905 | 0.083 |
| ΔH (kJ mol−1) | − 9.139 | 1.254 |
| ΔS (J mol−1 K) | 80.71 | NA |
Molecular docking was performed to determine the putative PHF6 residues interacting with Purpurin and to obtain insight into its binding mechanism underlying inhibition of aggregation. The best docking conformer is represented in Fig. 3c and SI Fig. 3, and the amino acid interactions are summarized in Table 2. We found that Purpurin had strong affinitive binding sites with PHF6 peptide. Purpurin predominantly interacted with the hydrophobic residue Val displaying hydrogen bonds and hydrophobic contacts. The small molecule formed two hydrogen bonds with the main chain of Val1 and several hydrophobic contacts with Val1 and Val4. Additionally, an aromatic hydrogen bond was observed between Purpurin and the side-chain of Gln2. These aforementioned interactions of Purpurin with monomeric PHF6 at early stages might account for its inhibitory effect towards PHF6 aggregation and abrogation of higher-order fibril formation.
Table 2.
Summary of docking studies showing Purpurin association with monomeric PHF6
| Hydrogen bonds | Aromatic hydrogen bond | Hydrophobic contacts | |||
|---|---|---|---|---|---|
| Interacting atom of amino acid residues | Interacting atoms of Purpurin | Interacting atom of amino acid residue | Interacting atom of Purpurin | Interacting atom of amino acid residues | Interacting atoms of Purpurin |
| O of Val1 | H of O5 | OE1 of Gln2 | H5 of C11 | HG22 of Val1 | C9 |
| O of Val1 | H of O4 | HG13 of Val1 | C9 | ||
| CG1 of Val1 | C9 | ||||
| HG12 of Val4 | C12 | ||||
| HG11 of Val4 | C13 | ||||
| CG1 of Val4 | C13 | ||||
The ultimate target for inhibition in the cell is the FL-Tau protein. Therefore, we studied the binding properties of Purpurin with FL-Tau using surface plasmon resonance (SPR) measurements. Briefly, FL-Tau protein was attached to the SPR ProteOn chip, and Purpurin solution was then circulated over the Tau-coated chip to allow interaction of the two entities. An immediate response was evident by the shift in chip plasmon size, due to the adhesion of Purpurin to the Tau-coated plasmons on the chip. Purpurin solutions (5 μM and 10 μM, diluted in PBST) gave rise to a strong dose-dependent SPR response, which indicated the significant interaction between Purpurin and the FL-Tau protein (Fig. 3d). It should be emphasized that the FL-Tau was attached to the chip at its monomeric state; hence the interaction shown here was specific with the Tau monomer before further aggregation. To reduce any non-specific interaction of the small molecule with the protein, bovine serum albumin (BSA) containing channel on the chip was measured for its interaction with Purpurin, and subsequently subtracted from the response curve of FL-Tau and Purpurin. However, it is noteworthy that this non-specific interaction was much smaller in magnitude (Fig. 3e) in chip response compared to Purpurin’s interaction with FL-Tau.
Taken together, ITC and molecular docking studies suggest that there prevails significant interaction between PHF6 and Purpurin, which is favorably driven by hydrophobic contacts. Additionally, SPR results show that Purpurin has a strong binding with FL-Tau protein and thus might interact to reduce Tau aggregation.
Purpurin disassembles pre-formed PHF6 fibrils and decreases the amyloid load
Next, we investigated the ability of Purpurin to disassemble pre-formed PHF6 fibrils using in vitro assays. To this end, PHF6 (50 µM) was allowed to assemble for 45 min under optimized aggregating conditions, and once a stable plateau in ThS curve was attained, representing formation of fibrils (see Fig. 2a, d), Purpurin was added to these pre-formed PHF6 fibrils at various molar ratios (5:1, 1:1, 1:2 and 1:5, PHF6: Purpurin). The incubation was continued for additional 60 min during which the kinetics of disassembly was monitored using ThS fluorescence. Whereas the enhancement in ThS fluorescence intensity during aggregation is due to the assembly of amyloid structures, the reduction in ThS fluorescence intensity is owing to the disassembly of the pre-formed aggregates [24, 26, 29]. Upon treating the pre-formed fibrils with Purpurin, a remarkable dose-dependent reduction in ThS fluorescence was observed with increased doses of Purpurin (Fig. 4a). Maximum disassembly of pre-formed fibrils was observed in the presence of fivefold molar excess of Purpurin, while twofold excess and equimolar concentration of Purpurin had notable disassembly effect.
Fig. 4.

Effect of Purpurin on disassembly of PHF6 fibrils a disassembly of pre-formed PHF6 fibrils (50 μM) by Purpurin as monitored by ThS fluorescence assay, b plot showing percentage amyloid remaining in the solution at the end of fibril disassembly assay. Error bars indicate standard error, c CD spectroscopy analysis of disassembled PHF6 fibrils in the absence or presence of Purpurin. Representative TEM images showing disassembled PHF6 fibrils at different molar ratios of Purpurin d control fibrils, e 5:1, f 1:1, g 1:5 (PHF6: Purpurin)
To quantify the disassembly effect of Purpurin towards pre-formed PHF6 fibrils, a plot of percentage amyloids vs. dose of Purpurin was generated. Level of control ThS fluorescence signal, i.e., sample containing pre-formed PHF6 fibrils incubated in the absence of Purpurin, was referred to as 100% and correspondingly, amyloid content remaining in the reaction mixture at the end of disassembly assay after Purpurin treatment was calculated (Fig. 4b). Purpurin could disassemble up to 75% and 50% of pre-formed PHF6 fibrils at fivefold and twofold molar excess, respectively, over a duration of 60 min. CD spectroscopy was performed to understand the secondary structural changes occurring at the end of the fibril disassembly assay. The control fibrils, i.e., in the absence of Purpurin, displayed a strong negative peak at 218 nm, as expected (Fig. 4c). Upon addition of Purpurin to the pre-formed fibrils, a reduction in the negative ellipticity peak at 218 nm was observed for equimolar ratio. A marked reduction in the β-sheet content was recorded at fivefold molar excess of Purpurin when compared to control PHF6 fibrils (Fig. 4c).
TEM analysis of the pre-formed PHF6 fibrils was performed at 5:1, 1:1 and 1:5 molar ratio (PHF6: Purpurin) to visualize the morphology of the disassembled fibrils following treatment with Purpurin. Representative TEM images are shown in Fig. 4d–g. The control PHF6 fibrils, in the absence of Purpurin, were mature and long (Fig. 4d), however, a drastic change was observed in fibril density and morphology with increasing doses of Purpurin (Fig. 4e, 4f). At the highest molar ratio of 1:5 (PHF6: Purpurin), only a few broken fibrils with thin morphology were visible (Fig. 4g). The TEM images corroborate the outcomes of the ThS assay and CD spectroscopy, collectively indicating that Purpurin efficiently disassembled the pre-formed PHF6 fibrils.
Hydrogen bonding and π–π stacking of Purpurin with PHF6 peptide arbitrate fibril disassembly
Molecular dynamics (MD) simulations were performed to obtain an atomistic insight into the interaction of Purpurin with PHF6 fibrils during disassembly. MD simulations of PHF6 oligomers and fibrils along with small molecules have been instrumental in explaining the molecular mechanisms of interaction and provided critical geometrical parameters [26, 30, 73, 74]. To that end, the PHF6 fibril system was built using 42 peptides in pre-defined β-sheet conformation, arranged in 2 strands with each strand containing 21 peptides [26]. Five Purpurin molecules were randomly placed inside the core of the fibril, and the MD simulation was performed for 20 ns. The control simulation was carried out with the fibril system in the absence of Purpurin molecules. The molecular structure and conformations that are specific and unique to the PHF6-Purpurin system were identified by comparing them with the control PHF6 fibril.
First, we calculated the Cα-root mean square deviation (RMSD) values over 20 ns, which is an indicator of equilibration and structural changes pertaining to the initial conformation of fibrils. RMSD values were found to increase in the first 5 ns of the simulation for both PHF6 control and PHF6-Purpurin fibril systems, and later they reached a plateau suggesting that equilibration was attained with time (SI Fig. 4a). Next, the count value was calculated as a function of simulation time to compute the number of interactions between Purpurin and the PHF6 fibril. As seen in SI Fig. 4b, Purpurin was at constant contact with the PHF6 fibril, and the number of interactions gradually increased from 0 to 20 ns. Previously, we have shown that intermolecular main-chain hydrogen bonds between Val, Ile, and Tyr facilitate the formation of a dimer from two PHF6 monomers [26]. Small molecules such as NQTrp hybrids (NQTrp and Cl-NQTrp) that form hydrogen bonds or π–π stacking with these key residues may disrupt the fibrillar architecture [26]. To verify whether Purpurin forms hydrogen bonds with PHF6, we calculated this interaction over 20 ns. As shown in SI Fig. 4c, each Purpurin molecule formed an average of approx one hydrogen bond with the PHF6 fibril. Purpurin molecules M1 and M2 formed one hydrogen bond with the main chain of Ile3 of peptide P1 (bond length = 3.3 Å) and Val1 of peptide P3 (bond length = 1.9 Å), respectively (Fig. 5a). The number of hydrogen bonds formed between Purpurin and residues of PHF6 peptides in the fibrillar arrangement is lesser when compared with those formed between PHF6 and NQTrp hybrids [26]. The low number of hydrogen bonds formed is expected since we deduced that the interaction between PHF6 and Purpurin is primarily due to hydrophobic contacts (Fig. 3a, b).
Fig. 5.

Interaction of Purpurin with PHF6 fibril a Purpurin molecules M1 forms one hydrogen bond with Ile residue of P1 and M2 forms one hydrogen bond with Val of P3, b π–π stacking of Purpurin (M2) with Tyr residue of P1, c disruption of the hydrogen bonds between peptide pairs P1–P2. Trajectories were recorded at the end of 20 ns simulation. The 3-D architecture of PHF6 fibril in the d absence or e presence of Purpurin. All interacting residues are shown as sticks. Color codes: Green sticks represent Purpurin. Brown arrowheads show β-sheet. Hydrogen bonds are shown as pink dashes. P1, P2, P3 and M1, M2 denotes PHF6 peptides and Purpurin molecules, respectively
Planar molecules such as polyphenol-based aggregation inhibitors were reported to intercalate between the hydrophobic residues of amyloid assemblies and inhibit the process of β-sheet formation [75, 76]. To examine whether Purpurin has the ability to intercalate between the residues of PHF6 during fibril disassembly, we analyzed the trajectories to visualize the stacking of the molecules. An aromatic ring of Purpurin (M2) formed π–π stacking with the side chain of Tyr residue of PHF6 peptide (P1) in the fibril arrangement (Fig. 5b). Taken together, it is evident that the formation of hydrogen bonds and π–π stacking break the inter-molecular main-chain hydrogen bonds between peptides P1 and P2 in the fibril strand, thus facilitating fibril disassembly (Fig. 5c).
Trajectories of the MD simulation were analyzed to visualize whether the interaction of Purpurin could cause ruptures in fibrillar strands of PHF6. In the control fibril, i.e., PHF6 fibril simulated in the absence of Purpurin, the strands displayed a uniform twist, and the β-sheet structure was intact without any evidence of disassembly (Fig. 5d). However, when simulated in the presence of Purpurin, the conformation of the fibril changed remarkably. Breaks in the fibrillar strand were noticed in regions where Purpurin came in contact with the PHF6 peptides (Fig. 5e). Additionally, when viewed from the central axis, the β-sheets in the control fibril were tightly packed, bonded well to each other rendering a hollow tubular arrangement (Fig. 5d). In contrast, the presence of Purpurin caused loosely packed β-sheets in fibril, which were moving away from the central axis (Fig. 5e). Collectively, insights obtained from MD simulation support the in vitro disassembly assays and together show that Purpurin efficiently disassembles pre-formed PHF6 fibrils.
Feeding Purpurin ameliorates eye neurodegeneration in a transgenic fly model of tauopathy
The in vitro results with the Tau-derived PHF6 proxy system prompted us to study the effect of Purpurin treatment on the hTau protein in vivo. Transgenic Drosophila flies overexpressing hTau in the central nervous system (CNS) have been effectively used as an in vivo model for understanding AD and related tauopathies, as well as for drug discovery [24, 25, 77–80]. Likewise, overexpression of hTau in the eye (part of the CNS), leading to accumulation of pathological Tau assemblies, was shown to result in a “rough-eye” phenotype characterized by disordered ommatidia and bristle deformities [59, 77]. Moreover, the importance of PHF6 in causing tauopathy symptoms in such flies has been recently highlighted by the finding that expression of hTau lacking the PHF6 fragment (306–311) results in reduced Tau hyperphosphorylation and showed no detectable neurodegeneration [81]. Here we used a UAS-hTau strain which allows the overexpression of the largest hTau isoform (441 aa), in the eyes of the fly via the GMR-Gal4 driver [82].
First, we determined the toxicity of Purpurin towards flies by feeding control flies (GMR-Gal4, see “Materials and methods”), which do not express hTau, with various concentration of Purpurin (0.5 mg/mL, 0.75 mg/mL and 1 mg/mL). Morphological examination of their eyes by a stereomicroscope revealed that the eyes appeared red with no morphological abnormalities and were comparable to eyes of control flies, which were not fed with Purpurin (SI Fig. 5). This indicates that Purpurin had no adverse effects on the flies even at a high concentration of 1 mg/mL. Grounded on this data and previous comparable studies using NQTrp and Cl-NQTrp [24, 25, 38], all fly experiments in the present study were performed by feeding a dose of 0.75 mg/mL Purpurin.
The neuroprotective ability of Purpurin was evaluated by feeding flies that overexpress hTau (GMR-Gal4; UAS-hTau) in their retina. Eye defects were qualitatively classified (Fig. 6a) (class 1—normal, class 2—a moderate defect, class 3—a high defect, class 4—a severe defect) as described previously [24]. Based on this classification, a chart of % phenotype distribution was generated (Fig. 6b) for the population of untreated vs. treated flies. A marked amelioration of eye neurodegeneration was observed when the hTau overexpressing flies were fed with Purpurin. This is evident by the clear shift in the distribution classes upon treatment, from more severe to milder defects (Fig. 6b). Specifically, treatment with Purpurin significantly increased the proportion of class 2 in the population, i.e., from ~ 40 to 75%, at the expense of class 3 and 4.
Scanning electron microscope (SEM) images of the fly eyes were used to complement the qualitative class scoring. In the untreated and Purpurin treated control flies (GMR-Gal4), the compound eyes had uniform lattice-like arranged ommatidia and orderly bristle alignment (Fig. 7a–d, insets). This result indicated that Purpurin had no detectable effect on eye morphology. On the other hand, the untreated flies overexpressing hTau (GMR-Gal4; UAS-hTau) had “rough eyes” with severe defects including the presence of necrotic tissue (class 4) along with deformed bristles and ommatidia (Fig. 7e, f, inset). However, treatment of flies overexpressing hTau with Purpurin resulted in the noticeable restoration of the ordered lattice-like morphology of the ommatidia (Fig. 7g, h, inset).
Fig. 7.

Representative Bright field and SEM images of eyes of flies untreated or treated with Purpurin (a, b), control (GMR-Gal4) flies without Purpurin treatment (c, d), control (GMR-Gal4) flies with Purpurin treatment (e, f), hTau overexpressing flies (GMR-Gal4; UAS-hTau) without Purpurin treatment (g, h), hTau overexpressing flies (GMR-Gal4; UAS-hTau) with Purpurin treatment. a, c, e, g represent stereomicroscope images, b, d, f, h represent SEM images. Insets show the zone of interest in SEM images
To obtain a quantitative measure of eye neurodegeneration, in the presence or absence of Purpurin, we measured pigment level in the eyes. The level of pigment was previously shown to correlate with neurodegeneration in flies overexpressing hTau in their eyes [24, 25, 83]. As shown in Fig. 8a, pigment levels in untreated flies that overexpress hTau (GMR-Gal4; UAS-hTau) were lower by 60% than pigment levels of the control flies (GMR-Gal4) that do not express hTau. However, upon Purpurin treatment, a significant increase (15%) in pigment level was observed compared to the untreated hTau overexpressing flies. This observation is in agreement with the results of the qualitative eye classification, indicating that feeding these flies with Purpurin led to an improvement in eye neurodegeneration.
Fig. 8.

Quantification of eye pigment and phosphorylated Tau a Pigment level as a quantitative measure for eye degeneration: Levels of pigment were determined according to a formula shown in “Materials and methods” (number of heads = 15, 3–5 repeats). b Levels of total and phosphorylated Tau in eye tissue determined by western blotting (left), and calculated ratios from densitometry of the blots (right). Student’s t test analysis showed **p < 0.05, ***p < 0.01
AD is characterized by the accumulation of hyper-phosphorylated hTau [84]. To examine this in the fly model, we measured the level of Tau phosphorylation at Thr 231 relative to the total Tau in extracts of heads from adult flies overexpressing hTau in the retina, using antibodies towards phosphorylated Tau (AT180) and total Tau (ab64913). No total or phosphorylated Tau was detected in the flies that do not express hTau (GMR-Gal4) (Fig. 8b). The ratio of phosphorylated Tau to total Tau levels was normalized according to the ratio found in untreated flies overexpressing hTau (GMR-Gal4; UAS-hTau). As shown in Fig. 8b, SI Table 1, Purpurin treated hTau overexpressing flies had a significantly lower ratio of phosphorylated Tau to total Tau in comparison to the untreated counterparts. This result is in agreement with the in vivo studies mentioned above and supports the conclusion that Purpurin ameliorates neurodegeneration plausibly by inhibiting Tau accumulation and reducing Tau phosphorylation in this animal model.
Purpurin reduces the accumulation of hTau and crosses the blood–brain barrier
Upon diagnosis, the brain of tauopathy patients already contains hTau deposits. Therefore, it becomes worthwhile to examine whether Purpurin can disassemble accumulated hTau. To this end, we developed a SH-SY5Y human neuroblastoma cell line overexpressing hTau (SI Fig. 6). The cells were cultured to overexpress hTau for 2 days, to enhance the accumulation of total hTau. Subsequently, the cells were treated with 10 μM Purpurin and after 2 additional days of incubation, total hTau was quantified relative to GAPDH. As shown in Fig. 9a, b; SI Table 2, there is a significant reduction of total hTau in Purpurin treated cells overexpressing hTau when compared to untreated cells overexpressing hTau. This result clearly suggests that Purpurin efficiently reduce the accumulation of hTau and may reflect disassembly of pre-formed aggregates as observed in vitro for PHF6.
Fig. 9.

Quantification of total hTau in cells a Western blots showing SH-SY5Y control cells and SH-SY5Y cells overexpressing hTau, untreated or treated with Purpurin. b Quantification of western blot by calculating ratios from the densitometry of the blots. Student’s t test analysis showed *p < 0.1
Ability to cross the blood–brain barrier (BBB) is a crucial attribute for a candidate therapeutic for tauopathies. To that end, we used an established in vitro model composed of human brain-like endothelial cells (BLECs) together with bovine brain pericytes (Fig. 10a) that closely mimic the in vivo BBB [85]. Purpurin or sodium fluorescein (NaF) was added at 0.5 mM and 27 µM, respectively, to the luminal compartment of the BBB in vitro model and the permeability was measured as described previously [85]. NaF has a molecular weight of 376 Da and is a paracellular marker widely used to assess the BBB permeability. No change in transendothelial electrical resistance (TEER) before and after the permeability assay (Fig. 10b) indicated that Purpurin itself had no barrier disrupting properties under these experimental conditions. As shown in Fig. 10c, the permeability of Purpurin was found to be ~ fivefold higher than NaF (1.49 vs. 0.27 10−3 cm min−1). These results demonstrate that Purpurin crosses the BBB better than NaF.
Fig. 10.

Purpurin permeates the BBB in vitro a scheme of the in vitro human BBB system. b Transendothelial electrical resistance measured before and after the permeability assay, i.e., 1 h after the addition of the compounds to the luminal compartment (n = 4 transwell per treatment). Data presented as mean ± SEM. c Permeability of Purpurin and NaF from luminal to the abluminal side was measured (n = 4 Transwell inserts per compound). Data presented as mean ± SEM. Student’s t test analysis showed **p < 0.05
Conclusions
Formation of toxic intra-neuronal Tau protein tangles is a hallmark of Alzheimer’s disease (AD) and is closely related to disease progression. Therefore, disrupting Tau aggregation in AD is an attractive strategy for developing disease-modifying therapeutics, which are urgently needed. In this work, we have characterized Purpurin, an anthraquinone-derived small molecule, as a modulator of Tau protein aggregation. In vitro assays suggested that Purpurin has dose-dependent inhibitory effect on the aggregation of the Tau-derived VQIVYK (PHF6) peptide and as well as effectively disassemble the pre-formed PHF6 aggregates. Binding assays with PHF6 and FL-Tau revealed that Purpurin displays a spontaneous and dose-dependent binding tendency towards the monomeric peptide/protein at early stages of aggregation, arbitrating its inhibitory nature. Furthermore, the molecular dynamics study showed that Purpurin disassembled pre-formed PHF6 fibril, facilitated by the formation of hydrogen bonds and hydrophobic contacts with crucial residues responsible for the β-sheet arrangement. In vivo experiments with transgenic flies overexpressing hTau demonstrated that Purpurin significantly ameliorated the AD-like neurodegenerative symptoms and rescued neurotoxicity of Tau-engendered phenotypes plausibly by inhibiting Tau accumulation and reducing Tau phosphorylation. Ex-vivo assays with cells overexpressing hTau showed that Purpurin can effectively reduce the accumulation of hTau. Taken together with the observation that Purpurin crosses the human BBB efficiently, our findings underscore Purpurin as an attractive lead molecule for AD drug development and other related tauopathies.
Electronic supplementary material
Below is the link to the electronic supplementary material.
Acknowledgements
This work was supported in part by the Alliance Family Foundation, and the Rosetrees Trust (to DS). This work was done in collaboration with the BLAVATNIK CENTER for Drug Discovery supported by the Blavatnik Family Foundation. GKV thanks TATA post-doctoral scholarship. Authors are grateful to the members of EG and DS research groups for fruitful discussions. We thank Donna Elyashiv Revivo for introduction and advice on fly work. Authors thank Dr. Vered Holdengreber for help with Electron Microscopy.
Author contributions
GKV and DS conceived and designed the project. GKV and DSh conducted the lab experiments. LL contributed to the development of cell model and western blots. EA and RJ performed ITC and SPR assays. GKV, EP, and AR executed the high throughput screening assay. HE performed molecular docking. FG established the in vitro BBB model. CS and IC performed the BBB permeability assay. GKV, DSh, EG and DS prepared the manuscript. All authors read and approved the manuscript.
Compliance with ethical standards
Conflict of interest
The authors declare no conflict of interest.
Footnotes
Publisher's Note
Springer Nature remains neutral with regard to jurisdictional claims in published maps and institutional affiliations.
Guru Krishnakumar Viswanathan and Dana Shwartz signify equal contribution to this work.
References
- 1.Maccioni RB, Munoz JP, Barbeito L. The molecular bases of Alzheimer’s disease and other neurodegenerative disorders. Arch Med Res. 2001;32:367–381. doi: 10.1016/S0188-4409(01)00316-2. [DOI] [PubMed] [Google Scholar]
- 2.Walsh DM, Selkoe DJ. Deciphering the molecular basis of memory failure in Alzheimer’s disease. Neuron. 2004;44:181–193. doi: 10.1016/j.neuron.2004.09.010. [DOI] [PubMed] [Google Scholar]
- 3.Bloom GS. Amyloid-β and tau: the trigger and bullet in Alzheimer disease pathogenesis. JAMA Neurol. 2014 doi: 10.1001/jamaneurol.2013.5847. [DOI] [PubMed] [Google Scholar]
- 4.Van Cauwenberghe C, Van Broeckhoven C, Sleegers K. The genetic landscape of Alzheimer disease: clinical implications and perspectives. Genet Med. 2016;18:421–430. doi: 10.1038/gim.2015.117. [DOI] [PMC free article] [PubMed] [Google Scholar]
- 5.Gotz J, Halliday G, Nisbet RM. Molecular pathogenesis of the tauopathies. Annu Rev Pathol. 2019;14:239–261. doi: 10.1146/annurev-pathmechdis-012418-012936. [DOI] [PubMed] [Google Scholar]
- 6.Mietelska-Porowska A, Wasik U, Goras M, et al. Tau protein modifications and interactions: their role in function and dysfunction. Int J Mol Sci. 2014;15:4671–4713. doi: 10.3390/ijms15034671. [DOI] [PMC free article] [PubMed] [Google Scholar]
- 7.Dehmelt L, Halpain S. The MAP2/Tau family of microtubule-associated proteins. Genome Biol. 2005;6:204. doi: 10.1186/gb-2004-6-1-204. [DOI] [PMC free article] [PubMed] [Google Scholar]
- 8.Kadavath H, Hofele RV, Biernat J, et al. Tau stabilizes microtubules by binding at the interface between tubulin heterodimers. Proc Natl Acad Sci U S A. 2015;112:7501–7506. doi: 10.1073/pnas.1504081112. [DOI] [PMC free article] [PubMed] [Google Scholar]
- 9.Alonso A, Zaidi T, Novak M, et al. Hyperphosphorylation induces self-assembly of tau into tangles of paired helical filaments/straight filaments. Proc Natl Acad Sci U S A. 2001;98:6923–6928. doi: 10.1073/pnas.121119298. [DOI] [PMC free article] [PubMed] [Google Scholar]
- 10.Barghorn S, Davies P, Mandelkow E. Tau paired helical filaments from Alzheimer’s disease brain and assembled in vitro are based on beta-structure in the core domain. Biochemistry. 2004;43:1694–1703. doi: 10.1021/bi0357006. [DOI] [PubMed] [Google Scholar]
- 11.Brunden KR, Ballatore C, Crowe A, et al. Tau-directed drug discovery for Alzheimer’s disease and related tauopathies: a focus on tau assembly inhibitors. Exp Neurol. 2010;223:304–310. doi: 10.1016/j.expneurol.2009.08.031. [DOI] [PMC free article] [PubMed] [Google Scholar]
- 12.Arriagada PV, Growdon JH, Hedley-Whyte ET, Hyman BT. Neurofibrillary tangles but not senile plaques parallel duration and severity of Alzheimer’s disease. Neurology. 1992;42:631–639. doi: 10.1212/WNL.42.3.631. [DOI] [PubMed] [Google Scholar]
- 13.Kametani F, Hasegawa M. Reconsideration of amyloid hypothesis and Tau hypothesis in Alzheimer’s disease. Front Neurosci. 2018;12:25. doi: 10.3389/fnins.2018.00025. [DOI] [PMC free article] [PubMed] [Google Scholar]
- 14.Irwin DJ. Tauopathies as clinicopathological entities. Parkinsonism Relat Disord. 2016;22(Suppl 1):S29–S33. doi: 10.1016/j.parkreldis.2015.09.020. [DOI] [PMC free article] [PubMed] [Google Scholar]
- 15.Yamada K. Extracellular tau and its potential role in the propagation of tau pathology. Front Neurosci. 2017;11:667. doi: 10.3389/fnins.2017.00667. [DOI] [PMC free article] [PubMed] [Google Scholar]
- 16.Shafiei SS, Guerrero-Muñoz MJ, Castillo-Carranza DL. Tau oligomers: cytotoxicity, propagation, and mitochondrial damage. Front Aging Neurosci. 2017;9:83. doi: 10.3389/fnagi.2017.00083. [DOI] [PMC free article] [PubMed] [Google Scholar]
- 17.Ganguly P, Do TD, Larini L, et al. Tau assembly: the dominant role of PHF6 (VQIVYK) in microtubule binding region repeat R3. J Phys Chem B. 2015;119:4582–4593. doi: 10.1021/acs.jpcb.5b00175. [DOI] [PMC free article] [PubMed] [Google Scholar]
- 18.von Bergen M, Friedhoff P, Biernat J, et al. Assembly of tau protein into Alzheimer paired helical filaments depends on a local sequence motif [(306)VQIVYK(311)] forming beta structure. Proc Natl Acad Sci U S A. 2000;97:5129–5134. doi: 10.1073/pnas.97.10.5129. [DOI] [PMC free article] [PubMed] [Google Scholar]
- 19.Seidler PM, Boyer DR, Rodriguez JA, et al. Structure-based inhibitors of tau aggregation. Nat Chem. 2018;10:170–176. doi: 10.1038/nchem.2889. [DOI] [PMC free article] [PubMed] [Google Scholar]
- 20.Fitzpatrick AWP, Falcon B, He S, et al. Cryo-EM structures of tau filaments from Alzheimer’s disease. Nature. 2017;547:185–190. doi: 10.1038/nature23002. [DOI] [PMC free article] [PubMed] [Google Scholar]
- 21.Goux WJ, Kopplin L, Nguyen AD, et al. The formation of straight and twisted filaments from short tau peptides. J Biol Chem. 2004;279:26868–26875. doi: 10.1074/jbc.M402379200. [DOI] [PubMed] [Google Scholar]
- 22.Plumley JA, Dannenberg JJ. The importance of hydrogen bonding between the glutamine side chains to the formation of amyloid VQIVYK parallel beta-sheets: an ONIOM DFT/AM1 study. J Am Chem Soc. 2010;132:1758–1759. doi: 10.1021/ja909690a. [DOI] [PMC free article] [PubMed] [Google Scholar]
- 23.Li DW, Mohanty S, Irbäck A, Huo S. Formation and growth of oligomers: a monte carlo study of an amyloid tau fragment. PLoS Comput Biol. 2008 doi: 10.1371/journal.pcbi.1000238. [DOI] [PMC free article] [PubMed] [Google Scholar]
- 24.Frenkel-Pinter M, Tal S, Scherzer-Attali R, et al. Naphthoquinone-tryptophan hybrid inhibits aggregation of the tau-derived peptide PHF6 and reduces neurotoxicity. J Alzheimers Dis. 2016;51:165–178. doi: 10.3233/JAD-150927. [DOI] [PubMed] [Google Scholar]
- 25.Frenkel-Pinter M, Tal S, Scherzer-Attali R, et al. Cl-NQTrp alleviates tauopathy symptoms in a model organism through the inhibition of tau aggregation-engendered toxicity. Neurodegener Dis. 2017;17:73–82. doi: 10.1159/000448518. [DOI] [PubMed] [Google Scholar]
- 26.KrishnaKumar VG, Paul A, Gazit E, Segal D. Mechanistic insights into remodeled Tau-derived PHF6 peptide fibrils by Naphthoquinone-Tryptophan hybrids. Sci Rep. 2018;8:71. doi: 10.1038/s41598-017-18443-2. [DOI] [PMC free article] [PubMed] [Google Scholar]
- 27.KrishnaKumar VG, Gupta S. Simplified method to obtain enhanced expression of tau protein from E. coli and one-step purification by direct boiling. Prep Biochem Biotechnol. 2017;47:530–538. doi: 10.1080/10826068.2016.1275012. [DOI] [PubMed] [Google Scholar]
- 28.Frenkel-Pinter M, Richman M, Belostozky A, et al. Selective inhibition of aggregation and toxicity of a tau-derived peptide using its glycosylated analogues. Chemistry. 2016;22:5945–5952. doi: 10.1002/chem.201504950. [DOI] [PubMed] [Google Scholar]
- 29.Mohamed T, Hoang T, Jelokhani-Niaraki M, Rao PPN. Tau-derived-hexapeptide (306)VQIVYK(311) aggregation inhibitors: nitrocatechol moiety as a pharmacophore in drug design. ACS Chem Neurosci. 2013;4:1559–1570. doi: 10.1021/cn400151a. [DOI] [PMC free article] [PubMed] [Google Scholar]
- 30.Haj E, Losev Y, Guru KrishnaKumar V, et al. Integrating in vitro and in silico approaches to evaluate the “dual functionality” of palmatine chloride in inhibiting and disassembling Tau-derived VQIVYK peptide fibrils. Biochim Biophys Acta. 2018;1862:1565–1575. doi: 10.1016/j.bbagen.2018.04.001. [DOI] [PubMed] [Google Scholar]
- 31.KrishnaKumar VG, Baweja L, Ralhan K, Gupta S. Carbamylation promotes amyloidogenesis and induces structural changes in Tau-core hexapeptide fibrils. Biochim Biophys Acta Gen Subj. 2018;1862:2590–2604. doi: 10.1016/j.bbagen.2018.07.030. [DOI] [PubMed] [Google Scholar]
- 32.Zheng J, Liu C, Sawaya MR, et al. Macrocyclic beta-sheet peptides that inhibit the aggregation of a tau-protein-derived hexapeptide. J Am Chem Soc. 2011;133:3144–3157. doi: 10.1021/ja110545h. [DOI] [PMC free article] [PubMed] [Google Scholar]
- 33.Calcul L, Zhang B, Jinwal UK, et al. Natural products as a rich source of tau-targeting drugs for Alzheimer’s disease. Future Med Chem. 2012;4:1751–1761. doi: 10.4155/fmc.12.124. [DOI] [PMC free article] [PubMed] [Google Scholar]
- 34.Hussain G, Rasul A, Anwar H, et al. Role of plant derived alkaloids and their mechanism in neurodegenerative disorders. Int J Biol Sci. 2018;14:341–357. doi: 10.7150/ijbs.23247. [DOI] [PMC free article] [PubMed] [Google Scholar]
- 35.Chua SW, Cornejo A, van Eersel J, et al. The polyphenol altenusin inhibits in vitro fibrillization of tau and reduces induced tau pathology in primary neurons. ACS Chem Neurosci. 2017;8:743–751. doi: 10.1021/acschemneuro.6b00433. [DOI] [PubMed] [Google Scholar]
- 36.Dammers C, Yolcu D, Kukuk L, et al. Selection and characterization of tau binding d-enantiomeric peptides with potential for therapy of alzheimer disease. PLoS One. 2016;11:e0167432. doi: 10.1371/journal.pone.0167432. [DOI] [PMC free article] [PubMed] [Google Scholar]
- 37.Sievers SA, Karanicolas J, Chang HW, et al. Structure-based design of non-natural amino-acid inhibitors of amyloid fibril formation. Nature. 2011;475:96–100. doi: 10.1038/nature10154. [DOI] [PMC free article] [PubMed] [Google Scholar]
- 38.Scherzer-Attali R, Farfara D, Cooper I, et al. Naphthoquinone-tyrptophan reduces neurotoxic Abeta*56 levels and improves cognition in Alzheimer’s disease animal model. Neurobiol Dis. 2012;46:663–672. doi: 10.1016/j.nbd.2012.03.005. [DOI] [PubMed] [Google Scholar]
- 39.Cecchelli R, Aday S, Sevin E, et al. A stable and reproducible human blood-brain barrier model derived from hematopoietic stem cells. PLoS One. 2014;9:e99733. doi: 10.1371/journal.pone.0099733. [DOI] [PMC free article] [PubMed] [Google Scholar]
- 40.Pickhardt M, Gazova Z, von Bergen M, et al. Anthraquinones inhibit tau aggregation and dissolve Alzheimer’s paired helical filaments in vitro and in cells. J Biol Chem. 2005;280:3628–3635. doi: 10.1074/jbc.M410984200. [DOI] [PubMed] [Google Scholar]
- 41.Viswanathan GK, Mohapatra S, Paul A, et al. Inhibitory effect of naphthoquinone-tryptophan hybrid towards aggregation of PAP f39 semen amyloid. Molecules. 2018 doi: 10.3390/molecules23123279. [DOI] [PMC free article] [PubMed] [Google Scholar]
- 42.Sastry GM, Adzhigirey M, Day T, et al. Protein and ligand preparation: parameters, protocols, and influence on virtual screening enrichments. J Comput Aided Mol Des. 2013;27:221–234. doi: 10.1007/s10822-013-9644-8. [DOI] [PubMed] [Google Scholar]
- 43.Friesner RA, Murphy RB, Repasky MP, et al. Extra precision glide: docking and scoring incorporating a model of hydrophobic enclosure for protein-ligand complexes. J Med Chem. 2006;49:6177–6196. doi: 10.1021/jm051256o. [DOI] [PubMed] [Google Scholar]
- 44.Friesner RA, Banks JL, Murphy RB, et al. Glide: a new approach for rapid, accurate docking and scoring. 1. method and assessment of docking accuracy. J Med Chem. 2004;47:1739–1749. doi: 10.1021/jm0306430. [DOI] [PubMed] [Google Scholar]
- 45.Halgren TA, Murphy RB, Friesner RA, et al. Glide: a new approach for rapid, accurate docking and scoring. 2. enrichment factors in database screening. J Med Chem. 2004;47:1750–1759. doi: 10.1021/jm030644s. [DOI] [PubMed] [Google Scholar]
- 46.Jacobson MP, Friesner RA, Xiang Z, Honig B. On the role of the crystal environment in determining protein side-chain conformations. J Mol Biol. 2002;320:597–608. doi: 10.1016/S0022-2836(02)00470-9. [DOI] [PubMed] [Google Scholar]
- 47.Jacobson MP, Pincus DL, Rapp CS, et al. A hierarchical approach to all-atom protein loop prediction. Proteins. 2004;55:351–367. doi: 10.1002/prot.10613. [DOI] [PubMed] [Google Scholar]
- 48.Farid R, Day T, Friesner RA, Pearlstein RA. New insights about HERG blockade obtained from protein modeling, potential energy mapping, and docking studies. Bioorg Med Chem. 2006;14:3160–3173. doi: 10.1016/j.bmc.2005.12.032. [DOI] [PubMed] [Google Scholar]
- 49.Sherman W, Beard HS, Farid R. Use of an induced fit receptor structure in virtual screening. Chem Biol Drug Des. 2006;67:83–84. doi: 10.1111/j.1747-0285.2005.00327.x. [DOI] [PubMed] [Google Scholar]
- 50.Sherman W, Day T, Jacobson MP, et al. Novel procedure for modeling ligand/receptor induced fit effects. J Med Chem. 2006;49:534–553. doi: 10.1021/jm050540c. [DOI] [PubMed] [Google Scholar]
- 51.Sawaya MR, Sambashivan S, Nelson R, et al. Atomic structures of amyloid cross-[beta] spines reveal varied steric zippers. Nature. 2007;447:453–457. doi: 10.1038/nature05695. [DOI] [PubMed] [Google Scholar]
- 52.Schuttelkopf AW, van Aalten DMF. PRODRG: a tool for high-throughput crystallography of protein-ligand complexes. Acta Crystallogr D Biol Crystallogr. 2004;60:1355–1363. doi: 10.1107/S0907444904011679. [DOI] [PubMed] [Google Scholar]
- 53.Schmid N, Eichenberger AP, Choutko A, et al. Definition and testing of the GROMOS force-field versions 54A7 and 54B7. Eur Biophys J. 2011;40:843–856. doi: 10.1007/s00249-011-0700-9. [DOI] [PubMed] [Google Scholar]
- 54.Lindahl E, Hess B, van der Spoel D. GROMACS 3.0: a package for molecular simulation and trajectory analysis. Mol Model Annu. 2001;7:306–317. doi: 10.1007/s008940100045. [DOI] [Google Scholar]
- 55.Gerben SR, Lemkul JA, Brown AM, Bevan DR. Comparing atomistic molecular mechanics force fields for a difficult target: a case study on the Alzheimer’s amyloid beta-peptide. J Biomol Struct Dyn. 2014;32:1817–1832. doi: 10.1080/07391102.2013.838518. [DOI] [PubMed] [Google Scholar]
- 56.Hess B, Bekker H, Berendsen HJC, Fraaije JGEM. LINCS: a linear constraint solver for molecular simulations. J Comput Chem. 1997;18:1463–1472. doi: 10.1002/(SICI)1096-987X(199709)18:12<1463::AID-JCC4>3.0.CO;2-H. [DOI] [Google Scholar]
- 57.Goedert M, Spillantini MG, Jakes R, et al. Multiple isoforms of human microtubule-associated protein tau: sequences and localization in neurofibrillary tangles of Alzheimer’s disease. Neuron. 1989;3:519–526. doi: 10.1016/0896-6273(89)90210-9. [DOI] [PubMed] [Google Scholar]
- 58.Kolarova M, Garcia-Sierra F, Bartos A, et al. Structure and pathology of tau protein in Alzheimer disease. Int J Alzheimers Dis. 2012;2012:731526. doi: 10.1155/2012/731526. [DOI] [PMC free article] [PubMed] [Google Scholar]
- 59.Chatterjee S, Sang T-K, Lawless GM, Jackson GR. Dissociation of tau toxicity and phosphorylation: role of GSK-3beta, MARK and Cdk5 in a Drosophila model. Hum Mol Genet. 2009;18:164–177. doi: 10.1093/hmg/ddn326. [DOI] [PMC free article] [PubMed] [Google Scholar]
- 60.Scherzer-Attali R, Pellarin R, Convertino M, et al. Complete phenotypic recovery of an Alzheimer’s disease model by a quinone-tryptophan hybrid aggregation inhibitor. PLoS One. 2010;5:e11101. doi: 10.1371/journal.pone.0011101. [DOI] [PMC free article] [PubMed] [Google Scholar]
- 61.Abramoff MD, Magelhaes PJ, Ram SJ. Image processing with ImageJ. Biophotonics Int. 2004;11:36–42. [Google Scholar]
- 62.Luo H, Gauthier M, Tan X, et al. Sodium transporters are involved in lithium influx in brain endothelial cells. Mol Pharm. 2018;15:2528–2538. doi: 10.1021/acs.molpharmaceut.8b00018. [DOI] [PubMed] [Google Scholar]
- 63.Loureiro JA, Andrade S, Duarte A, et al. Resveratrol and grape extract-loaded solid lipid nanoparticles for the treatment of Alzheimer’s disease. Molecules. 2017 doi: 10.3390/molecules22020277. [DOI] [PMC free article] [PubMed] [Google Scholar]
- 64.Eigenmann DE, Durig C, Jahne EA, et al. In vitro blood-brain barrier permeability predictions for GABAA receptor modulating piperine analogs. Eur J Pharm Biopharm. 2016;103:118–126. doi: 10.1016/j.ejpb.2016.03.029. [DOI] [PubMed] [Google Scholar]
- 65.Kuntz M, Candela P, Saint-Pol J, et al. Bexarotene promotes cholesterol efflux and restricts apical-to-basolateral transport of amyloid-beta peptides in an in vitro model of the human blood-brain barrier. J Alzheimers Dis. 2015;48:849–862. doi: 10.3233/JAD-150469. [DOI] [PubMed] [Google Scholar]
- 66.Praca C, Rai A, Santos T, et al. A nanoformulation for the preferential accumulation in adult neurogenic niches. J Control Release. 2018;284:57–72. doi: 10.1016/j.jconrel.2018.06.013. [DOI] [PubMed] [Google Scholar]
- 67.Cecchelli R, Dehouck B, Descamps L, et al. In vitro model for evaluating drug transport across the blood-brain barrier. Adv Drug Deliv Rev. 1999;36:165–178. doi: 10.1016/S0169-409X(98)00083-0. [DOI] [PubMed] [Google Scholar]
- 68.Khurana R, Coleman C, Ionescu-Zanetti C, et al. Mechanism of thioflavin T binding to amyloid fibrils. J Struct Biol. 2005;151:229–238. doi: 10.1016/j.jsb.2005.06.006. [DOI] [PubMed] [Google Scholar]
- 69.Groenning M. Binding mode of Thioflavin T and other molecular probes in the context of amyloid fibrils—current status. J Chem Biol. 2010;3:1–18. doi: 10.1007/s12154-009-0027-5. [DOI] [PMC free article] [PubMed] [Google Scholar]
- 70.Xue C, Lin TY, Chang D, Guo Z. Thioflavin T as an amyloid dye: fibril quantification, optimal concentration and effect on aggregation. R Soc Open Sci. 2017;4:160696. doi: 10.1098/rsos.160696. [DOI] [PMC free article] [PubMed] [Google Scholar]
- 71.Ross PD, Subramanian S. Thermodynamics of protein association reactions: forces contributing to stability. Biochemistry. 1981;20:3096–3102. doi: 10.1021/bi00514a017. [DOI] [PubMed] [Google Scholar]
- 72.Wang S-H, Liu F-F, Dong X-Y, Sun Y. Thermodynamic analysis of the molecular interactions between amyloid beta-peptide 42 and (-)-epigallocatechin-3-gallate. J Phys Chem B. 2010;114:11576–11583. doi: 10.1021/jp1001435. [DOI] [PubMed] [Google Scholar]
- 73.Berhanu WM, Masunov AE. Atomistic mechanism of polyphenol amyloid aggregation inhibitors: molecular dynamics study of Curcumin, Exifone, and Myricetin interaction with the segment of tau peptide oligomer. J Biomol Struct Dyn. 2015;33:1399–1411. doi: 10.1080/07391102.2014.951689. [DOI] [PubMed] [Google Scholar]
- 74.Zhao J-H, Liu H-L, Chuang C-K, et al. Molecular dynamics simulations to investigate the stability and aggregation behaviour of the amyloid-forming peptide VQIVYK from tau protein. Mol Simul. 2010;36:1013–1024. doi: 10.1080/08927022.2010.499147. [DOI] [Google Scholar]
- 75.Velander P, Wu L, Henderson F, et al. Natural product-based amyloid inhibitors. Biochem Pharmacol. 2017;139:40–55. doi: 10.1016/j.bcp.2017.04.004. [DOI] [PMC free article] [PubMed] [Google Scholar]
- 76.Armstrong AH, Chen J, McKoy AF, Hecht MH. Mutations that replace aromatic side chains promote aggregation of the Alzheimer’s Abeta peptide. Biochemistry. 2011;50:4058–4067. doi: 10.1021/bi200268w. [DOI] [PMC free article] [PubMed] [Google Scholar]
- 77.Sang T-K, Jackson GR. Drosophila models of neurodegenerative disease. NeuroRx. 2005;2:438–446. doi: 10.1602/neurorx.2.3.438. [DOI] [PMC free article] [PubMed] [Google Scholar]
- 78.Moloney A, Sattelle DB, Lomas DA, Crowther DC. Alzheimer’s disease: insights from Drosophila melanogaster models. Trends Biochem Sci. 2010;35:228–235. doi: 10.1016/j.tibs.2009.11.004. [DOI] [PMC free article] [PubMed] [Google Scholar]
- 79.Wittmann CW, Wszolek MF, Shulman JM, et al. Tauopathy in Drosophila: neurodegeneration without neurofibrillary tangles. Science. 2001;293:711–714. doi: 10.1126/science.1062382. [DOI] [PubMed] [Google Scholar]
- 80.Pandey UB, Nichols CD. Human disease models in Drosophila melanogaster and the role of the fly in therapeutic drug discovery. Pharmacol Rev. 2011;63:411–436. doi: 10.1124/pr.110.003293. [DOI] [PMC free article] [PubMed] [Google Scholar]
- 81.Passarella D, Goedert M. Beta-sheet assembly of Tau and neurodegeneration in Drosophila melanogaster. Neurobiol Aging. 2018;72:98–105. doi: 10.1016/j.neurobiolaging.2018.07.022. [DOI] [PMC free article] [PubMed] [Google Scholar]
- 82.Brand AH, Perrimon N. Targeted gene expression as a means of altering cell fates and generating dominant phenotypes. Development. 1993;118:401–415. doi: 10.1242/dev.118.2.401. [DOI] [PubMed] [Google Scholar]
- 83.Ephrussi B, Herold JL. Studies of eye pigments of Drosophila. I. Methods of extraction and quantitative estimation of the pigment components. Genetics. 1944;29:148–175. doi: 10.1093/genetics/29.2.148. [DOI] [PMC free article] [PubMed] [Google Scholar]
- 84.Bancher C, Brunner C, Lassmann H, et al. Accumulation of abnormally phosphorylated tau precedes the formation of neurofibrillary tangles in Alzheimer’s disease. Brain Res. 1989;477:90–99. doi: 10.1016/0006-8993(89)91396-6. [DOI] [PubMed] [Google Scholar]
- 85.Ravid O, Elhaik Goldman S, Macheto D, et al. Blood-brain barrier cellular responses toward organophosphates: natural compensatory processes and exogenous interventions to rescue barrier properties. Front Cell Neurosci. 2018;12:359. doi: 10.3389/fncel.2018.00359. [DOI] [PMC free article] [PubMed] [Google Scholar]
Associated Data
This section collects any data citations, data availability statements, or supplementary materials included in this article.