Abstract
Steroid receptor coactivator 3 (SRC-3) is a critical mediator of many intracellular signaling pathways that are crucial for cancer proliferation and metastasis. In this study, we performed structure-activity relationship (SAR) exploration and drug-like optimization of the hit compound SI-2, guided by in vitro/in vivo metabolism studies and cytotoxicity assays. Our efforts led to the discovery of two lead compounds, SI-10 and SI-12. Both compounds exhibit potent cytotoxicity against a panel of human cancer cell lines and demonstrate acceptable pharmacokinetic properties. A biotinylated estrogen response element (ERE) pull-down assay demonstrated that SI-12 could disrupt the recruitment of SRC-3 and p300 in the ER complex. Importantly, SI-10 and SI-12 significantly inhibited tumor growth and metastasis in vivo without appreciable acute toxicity. These results demonstrate the potential of SI-10 and SI-12 as drug candidates for cancer therapy, given their potent SRC-3 inhibition and promising pharmacokinetic and toxicity profiles.
Keywords: steroid receptor coactivator, small-molecule inhibitor, drug-like optimization, lead compounds
Graphical Abstract

INTRODUCTION
Nuclear hormone receptors (NRs) are a group of transcription factors that bind to DNA in a ligand-dependent manner and have a crucial role in controlling gene expression and various physiological processes.1,2 Coactivators are a class of non-DNA binding proteins that enhance the transcriptional activities of nuclear hormone receptors, as well as other non-ligand dependent transcription factors, such as nuclear factor-κB (NF-κB), signal transducers and activators of transcription (STATs), hypoxia-inducible factor 1 (HIF1), p53, and retinoblastoma-associated protein.3–7 Since our discovery of the first coactivator, steroid receptor coactivator 1 (SRC-1), more than 400 coactivators have been reported and associated with various pathological conditions, including neurological diseases and cancer. 2,8,9
SRC-3, also known as NCOA3 or AIB1, is one of the three homologous members in the p160 SRC family. It is frequently amplified in a variety of hormone-dependent and hormone-independent cancers, including breast, ovarian, prostate, colorectal, gastric, and pancreatic cancer.10,11 High levels of SRC-3 expression are often associated with larger tumor sizes, higher tumor grades, and poorer disease-free survival rates in clinical settings.10,12,13 Acting as a central regulator of cellular growth and development, SRC-3 plays a crucial role in multiple intracellular signaling pathways that are critical for cancer proliferation and metastasis.10 Extensive evidence supports the role of SRC-3 in promoting primary tumor formation in the pancreas and mammary gland14–18, while also regulating cell motility, invasion, and tumor metastasis.19–21 Studies have demonstrated that SRC-3 knockout mice are shielded from chemical- and oncogene-induced tumorigenesis in the mammary gland.14,22 Notably, genetic elimination of SRC-3 in adult mice has no impact on their lifespan14,23, suggesting pharmacologically targeting SRC-3 could potentially be a safe therapeutic approach.
As a large and mostly unstructured nuclear protein, SRC-3 is a highly challenging target for small molecule drug development. Despite recent advancements in resolving the structures of hormone receptors-SRC-3 complexes using cryoEM24,25, the structural resolutions are still insufficient for structure-based drug design. To address this, a cell-based functional assay for high throughput screening (HTS) was employed to identify small molecule inhibitors (SMIs) for SRC-3, leading to the discovery and refinement of a series of “proof-of-principle” SRC-3 SMIs.23,26–30 Notably, a new class of SRC-3 SMIs with improved drug-like properties and considerable potential for clinical development has been identified.29,30 As the archetype of this new class, SI-2, selectively reduces SRC-3 protein levels and is highly potent towards killing breast cancer cells without affecting normal cell viability.29 Additionally, SI-2 has shown efficacy in blocking breast cancer stem cells31, inhibiting primary breast tumor growth in vivo29, and synergizing with an estrogen receptor (ER) degrader in an endocrine-resistant breast cancer patient-derived xenograft (PDX) model.32 Other studies have also demonstrated the potential of SI-2 in treating serous endometrial cancer33, anaplastic thyroid cancer34, and multiple myeloma35. In a pilot toxicology study, SI-2 exhibited no observable acute or chronic toxicity to major organs in vivo.29 Despite the promising preclinical data of SI-2, its short plasma half-life (~1 h in mice) remains a major limitation for its clinical development. In this study, we performed structure-activity relationships (SAR) exploration and drug-like optimization of SI-2, leading to the identification of two lead compounds, SI-12 (6c) and SI-10 (6p). These two lead compounds exhibited more potent biological activities than SI-2 and significantly longer plasma half-life (22 h and 3.25 h, respectively, via intravenous administration) and good oral bioavailability. Consistently, SI-12 (6c) and SI-10 (6p) displayed highly potent antitumor activity in both in vitro and in vivo tumor models, positioning them as promising candidates for further development as cancer therapies.
RESULTS
Characterization of chemical structure of SI-2.
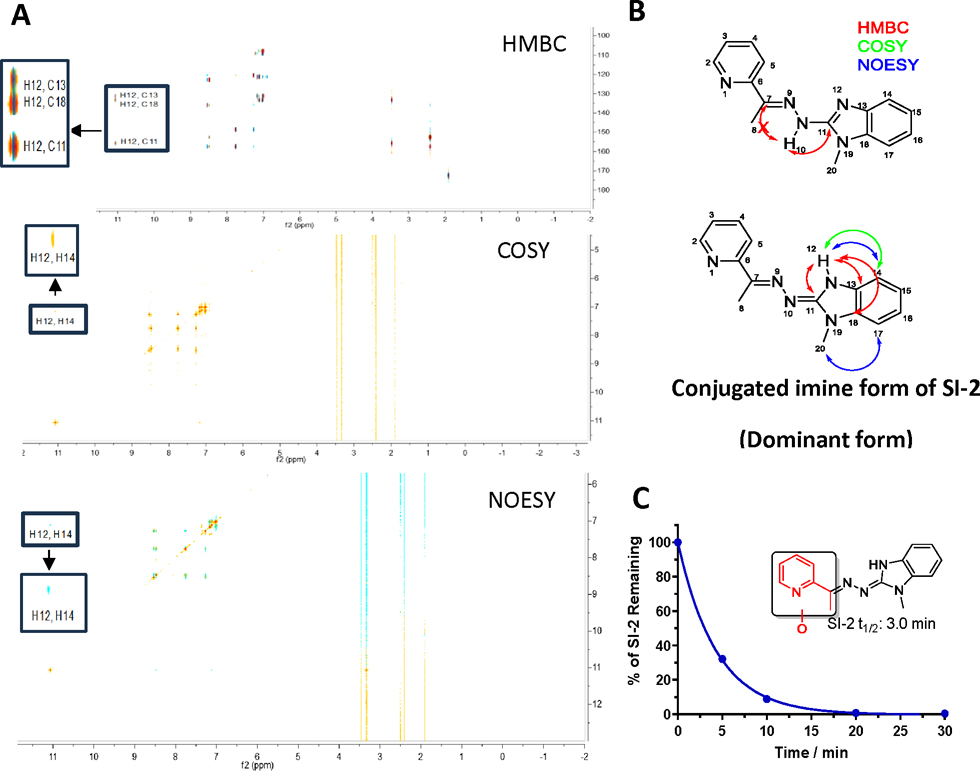
Our initial focus was to characterize the chemical structure of SI-2, considering its potential tautomers. To achieve this, we employed multiple 2D NMR methods (Fig 1A). Notably, the proton of the NH group in SI-2 showed no interaction with C7 but exhibited coupling with C13 and C18 of the benzimidazole, in disagreement with the hydrazone form of SI-2 (Fig 1B). The COSY spectrum further revealed a correlation between this reactive proton and H14 on the benzimidazole ring. Additionally, interaction of the reactive proton with H14 was observed in the NOESY spectrum. These 2D NMR spectra collectively demonstrated that SI-2 exists primarily in the conjugated imine form, rather than the hydrazone form (Fig 1B). Furthermore, X-ray crystallography of the SI-2 derivative, SI-12, provided additional evidence for the conjugated imine form (Fig S1). Additionally, density functional theory (DFT) calculations predicted that the energy of the conjugated imine form of SI-2 at 298 K is 3.2 and 3.4 kcal/mol lower than its hydrazone tautomer in H2O and DMSO, respectively (Table S1). These energy differences correspond to 99.5 and 99.7% of the conjugated imine form of SI-2 in H2O and DMSO, respectively. Our subsequent metabolite identification study revealed no hydrolysis product of hydrazone, indicating that the predominant form of SI-2 does not contain the hydrazone scaffold. These combined lines of evidence unequivocally establish the dominance of the conjugated imine scaffold in SI-2.
Figure 1.
Chemical structure characterization of SI-2 and metabolic stability in human liver microsomes (HLM). (A) 2D NMR spectroscopies of SI-2. (B) Illustration of chemical structure of SI-2. Conjugated imine is the dominant form of SI-2. (C) SI-2 was quickly metabolized in HLM. The half-life of SI-2 in HLM is 3.0 min and the major metabolite is the mono-oxidation on the pyridine ring (Highlighted in red).
To the best of our knowledge, our SRC-3 inhibitors represent a novel class of bioactive small molecules featuring the benzimidazoline imine scaffold. This work offers valuable insights into this novel scaffold, including aspects of synthesis, characterization, biological activities, and drug-like properties, arguing against its potential as PAINS.
Identification of the metabolic soft spots of SI-2.
In our previous report29, we identified SI-2 as a novel small molecular inhibitor of SRC-3 with antitumor activity in vitro and in vivo, however, SI-2 has a short plasma half-life, which limited its clinical potential. To address this issue, we performed a metabolite identification study of SI-2 in human liver microsomes (HLM). The result revealed that SI-2 was rapidly metabolized in HLM in the presence of NADPH (Fig 1C). Further metabolite identification analysis showed mono-oxidation on the pyridine ring (shown in red, Fig 1C) as the major metabolic product of SI-2. Based on these findings, we studied the structure-activity relationship (SAR) on the pyridine and benzimidazoline imine moieties and blocked the potential metabolic soft spot to develop more metabolic stable compounds.
Chemistry.
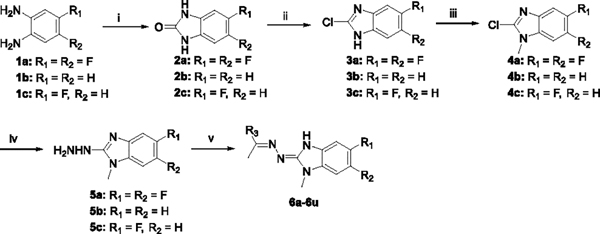
The synthesis of 6a-6u was outlined in Scheme 1. Benzimidazolones 2a-2c were prepared from commercially available o-diaminobenzenes 1a-1c in the presence of diphosgene. 2a-2c was refluxed in POCl3 to give chloro-derivatives 3a-3c. Subsequent methylation of 3a-3c afforded intermediate 4a-4c, which was further converted to hydrazine derivatives 5a-5c. Condensation of 5a-5c with various ketone derivatives produced 6a-6u.
Scheme 1. Synthesis Route of Compounds 6a−6ua.
aReagents and conditions: (i) Diphosgene, TEA, DCM, RT, 2h, 85~93%; (ii) POCl3, 100 °C, 18h, 81~88%; (iii) MeI, NaH, DMF, 0 °C~RT, 5h, 35~84%; (iv) Hydrazinium hydroxide, 100 °C, 12h, 80~89%; (v) Various ketone, AcOH, MeOH, RT, 12h, 74~92%.
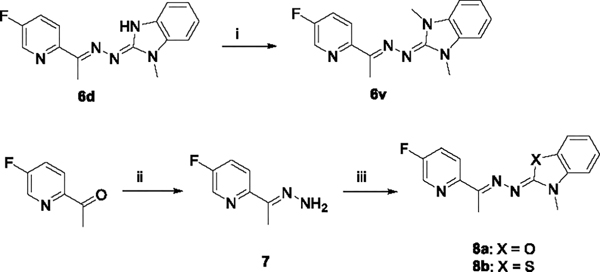
Alternatively, additional methylation of 6d gave 6v. 1-(5-fluoropyridin-2-yl)ethan-1-one reacted with hydrazine hydrate in the presence of acetic acid to afforded 7. Methylation of 3-methylbenzo[d]thiazole-2(3H)-thione or 3-methylbenzo[d]oxazole-2(3H)-thione by TfOMe followed by treatment of the resulting triflate salt with 7, afforded 8a or 8b, respectively (Scheme 2).36
Scheme 2. Synthesis Routes of Compounds 6v and 8a-8ba.
aReagents and conditions: (i) MeI, NaH, DMF, 0 °C~RT, 2h, 73%; (ii) Hydrazinium hydroxide, Acetic acid, MeOH, RT, overnight, 91%; (iii) (a) 3-methylbenzo[d]thiazole-2(3H)-thione or 3-methylbenzo[d]oxazole-2(3H)-thione, TfOMe, DCM, 0 °C~RT, 2h; (b) 7, TEA, EtOH, 80 °C, 5h, 52~61%, two steps.
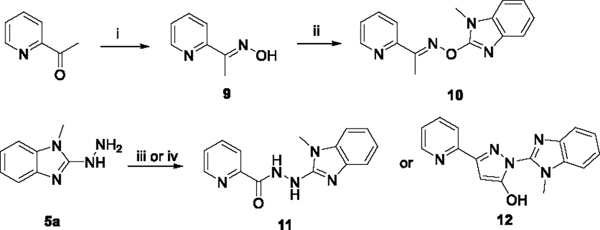
As shown in Scheme 3, (E)-1-(pyridin-2-yl)ethan-1-one oxime 9 was prepared by condensation of commercial available 1-(pyridin-2-yl)ethan-1-one. A further substitution reaction of 9 with 4b afforded 10. Compounds 11 and 12 were synthesized by amide coupling and cyclization reaction of 5a, respectively.
Scheme 3. Synthesis Routes of Compounds 10, 11 and 12a.
aReagents and conditions: (i) Hydroxylamine hydrochloride, MeOH, RT, overnight, 88%; (ii) 4b, NaH, DMF, 100 °C, 10h, 31%; (iii) Picolinic acid, HATU, DIPEA, DMF, RT, 2h, 79%; (iv) Ethyl 3-oxo-3-(pyridin-2-yl)propanoate, EtOH, 90 °C, 10h, 73%.
Structure–Activity Relationships (SARs) exploration.
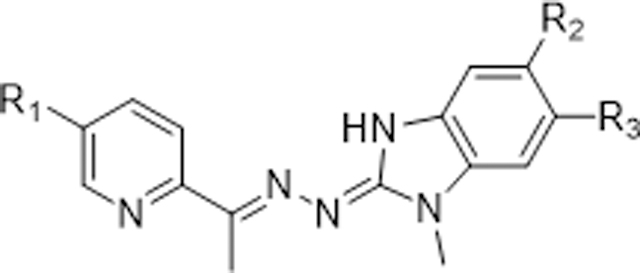
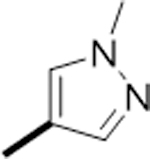
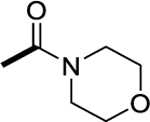
Fluorine substitution is a widely used strategy in drug design to enhance metabolic stability and/or modulate lipophilicity to improve cellular permeability.37 Due to fluorine’s higher electronegativity relative to hydrogen, replacement of a carbon-hydrogen bond with a carbon-fluorine bond typically does not cause significant steric perturbation in a molecule. As a result, fluorinated molecules often maintain similar potencies but exhibit improved metabolic stability without altering their size or potency. Based on these rationales, we designed and synthesized a series of SI-2 derivatives by substituting fluorine into the pyridine moiety or/and benzimidazoline imine moiety to decrease the electron density of the metabolic soft spot. Additionally, we incorporated various substituents into pyridine and benzimidazoline imine moieties to further fine-tune the metabolic stabilities and explore the SARs. As shown in table 1, 6a-6d with fluoride substitution displayed more potent cytotoxicity against MCF-7 cells compared to SI-2. However, derivative 6e, with two di-chloride substitutions on the benzimidazoline imine, exhibited slightly decreased inhibitory activity relative to 6a and 6c, indicating that the benzimidazoline imine moiety could only tolerate small substituents, such as fluorine. We next introduced various substituents into the pyridine ring to explore the SAR of this moiety. Derivatives 6f, 6g, and 6h, with ester, amide, or N-methyl pyrazole groups in the pyridine moiety, displayed very potent activities. However, derivatives 6l and 6m, with a carboxylic group or its bioisostere, completely lost their cytotoxicity, presumably due to their poor cellular permeability. Furthermore, introducing more steric substituents onto the pyridine ring, such as in 6i-6k, dramatically decreased the potency compared to 6c, indicating the pyridine moiety, like benzimidazoline imine moiety, prefers small substituents.
Table 1.
SAR study of substitutions on the pyridine and benzimidazoline imine
| ||||
|---|---|---|---|---|
| No. | R1 | R2 | R3 | IC50 (nM)a |
|
| ||||
| SI-2 | H | H | H | 22 |
| 6a | F | H | H | 5.4 |
| 6b | F | F | H | 2.5 |
| 6c (SI-12) | F | F | F | 3.4 |
| 6d | H | F | F | 6.3 |
| 6e | F | Cl | Cl | 18 |
| 6f | COOCH3 | F | F | 2.9 |
| 6g | CONH2 | F | F | 2.7 |
| 6h |
|
F | F | 6.7 |
| 6i |
|
F | F | 30.5 |
| 6j |
|
F | F | 44.7 |
| 6k |

|
F | F | 249 |
| 6l | COOH | F | F | >1000 |
| 6m |
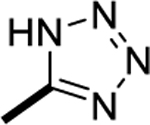
|
F | F | >1000 |
The cytotoxicity activities of individual compound to MCF7 cells were determined by the MTT assay. Data are the mean of triplicate determinations.
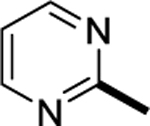
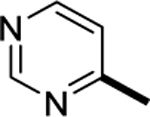
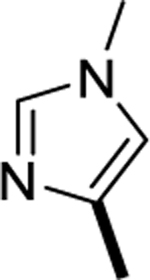
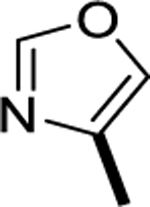
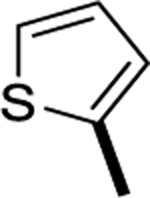
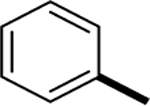
Also, we replaced the pyridine ring in SI-2 with a series of heterocycles and phenyl groups. As shown in table 2, the pyrimidine analogues 6p and 6q exhibited potent cytotoxicity activities, comparable to 6c. Interestingly, relocating the nitrogen on the pyridine ring to meta- and para-positions, as in the other pyridine substituent analogues 6n and 6o, completely abolished their inhibitory activities. Moreover, substitution of the pyridine ring with other five-membered heterocycles (6r-6t) or phenyl ring (6u) resulted in the loss of activities. These results suggest that the ortho-nitrogen of pyridine or pyrimidine is a crucial pharmacophore, potentially serving as a hydrogen bond acceptor.
Table 2.
SAR study of pyridine ring
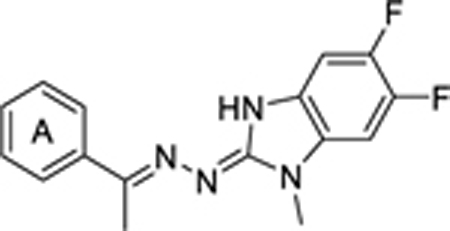
| ||
|---|---|---|
| No. | A ring | IC50 (nM)a |
|
| ||
| 6n |
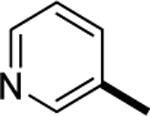
|
>1000 |
| 6o |
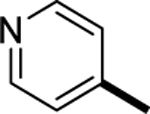
|
>1000 |
| SI-10 (6p) |
|
3.3 |
| 6q |
|
10.7 |
| 6r |
|
>1000 |
| 6s |
|
>1000 |
| 6t |
|
>1000 |
| 6u |
|
>1000 |
The cytotoxicity activities of individual compound to MCF7 cells were determined by the MTT assay. Data are the mean of triplicate determinations.
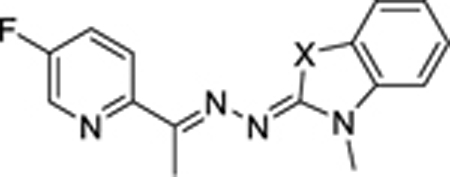
Additionally, we attempted to replace the benzimidazoline imine moieties with other scaffolds, however, these efforts resulted in decrease of activities. As depicted in table 3, analogs 6v and 8a-8b, with NCH3, O or S instead of NH in the benzimidazoline imine moiety, completely lost their activities, suggesting that the NH group of benzimidazoline imine may play a critical role as a hydrogen bond donor in binding to the target. Similarly, replacement of the conjugated imine, as exemplified by compounds 10, 11, and 12, led to significant loss of activities, highlighting the critical role of the benzimidazoline imine scaffold for biological activities.
Table3.
Scaffold hopping of benzimidazoline imine
| ||
|---|---|---|
| No. | X | IC50 (nM)a |
|
| ||
| 6v | NCH3 | >1000 |
| 8a | O | >1000 |
| 8b | S | >1000 |
| 10 |

|
>1000 |
| 11 |

|
494 |
| 12 |

|
>1000 |
The cytotoxicity activities of individual compound to MCF7 cells were determined by the MTT assay. Data are the mean of triplicate determinations.
Evaluation of in vitro metabolism and pharmacokinetic profile.
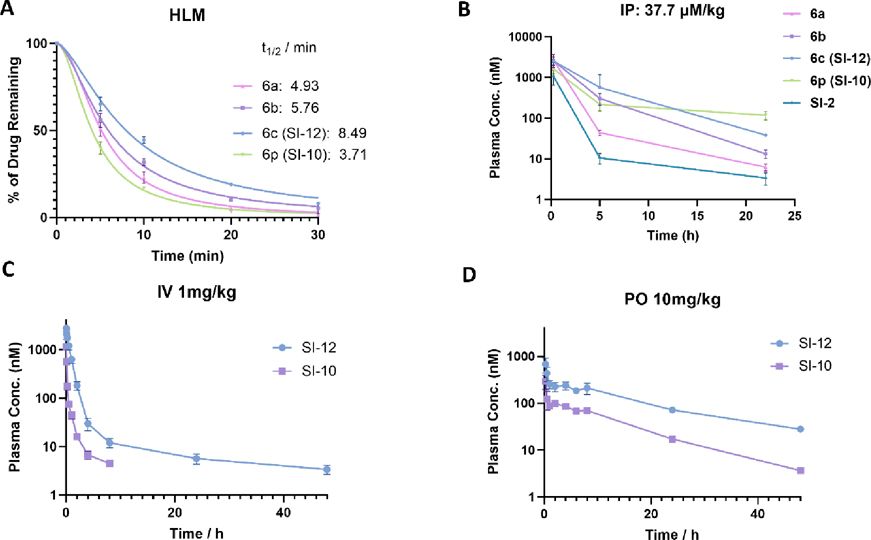
To evaluate the metabolism stability of synthesized compounds, we conducted phase I metabolism studies and determined the half-life in human liver microsome in the presence of NADPH. Our results showed that compounds 6a-6c and 6p exhibited prolonged half-life (4.93, 5.76, 8.49 and 3.71 min) (Fig 2A) compared to SI-2 (3.0 min) (Fig 1C), indicating that introducing fluorine into the pyridine moiety or replacing this pyridine moiety with pyrimidine can enhance metabolic stability. Moreover, compared the half-life of 6b and 6c with that of 6a, we found that adding fluorine to the benzimidazoline imine moiety further improved the metabolic stability.
Figure 2.
In vitro and In vivo metabolic stability of 6a-6c and 6p. (A) 6a-6c and 6p are all more stable than SI-2 in human liver microsomes. The half-life of 6a-6c and 6p is 4.93, 5.73, 8.49 and 3.71 min, respectively. (B) Pilot pharmacokinetics of 6a-6c and 6p. The same mole amounts of compounds (37.7 μmol/kg) was intraperitoneally (i.p.) administered to CD-1 mice (female, n=3). The drug concentrations in plasma were quantified using LC-MS/MS. Among them, SI-12 (6c) and SI-10 (6p) are the most stable in vivo. (C) and (D) Full pharmacokinetic profile and oral bioavailability evaluation of SI-12 (6c) and SI-10 (6p). CD-1 mice were treated with SI-12 (6c) or SI-10 (6p) via intraperitoneal administration (1mg/kg, n=3) and oral gavage (10 mg/kg, n =3) respectively. SI-12 (6c) has a very long plasma half-life (t1/2) of 22.5 h, low clearance of 22 mL/min/kg, and good oral bioavailability (F = 24.6%). SI-10 (6p) has excellent oral bioavailability (F = 54.4%).
To further assess the in vivo stability of the designed compounds, a pilot pharmacokinetics study was conducted. CD-1 mice (female, n=3) were intraperitoneally administered the same mole amounts of compounds (37.7 μmol/kg, corresponding to 10 mg/kg of SI-2). Blood samples (20 μL) were collected at 0.25, 5, and 22 hours and processed into plasma. The drug concentrations in plasma were quantified using LC-MS/MS. The pharmacokinetic profiles of the compounds (6a-6c, 6p) exhibited a similar trend as observed in the metabolic stability study, with SI-2 analogues (6a-6c, 6p) showing much higher stability than SI-2 in mice (Fig 2B). It should be noted that 6c and 6p exhibited remarkable pharmacokinetic profiles with a sustained high plasma concentration of 47 and 117 nM, respectively, even 22 hours after injection. This finding suggests a promising therapeutic potential for these two compounds, given their low nanomolar potency. In addition, both compounds displayed excellent stability in human plasma (Fig S2). Based on our findings, we conclude that 6c and 6p are the most promising compounds, exhibiting both high potency and favorable plasma stability. As such, we have identified 6c and 6p as lead compounds, now designated as SI-12 and SI-10, respectively, for further evaluation of their in vitro and in vivo efficacy and safety. It should be noted that DFT calculations also predict the conjugated imine forms of SI-10 and SI-12 are the predominant forms in both H2O and DMSO (Table S1).
SI-10 and SI-12 have a high potency against various cancer cell lines.
To assess the in vitro efficacy of SI-10 and SI-12, we chose seven human cancer cell lines known to overexpress SRC-3 including three human pancreas adenocarcinoma cell lines (Panc-1, HPAC, and Mpanc-96), three human breast cancer cell lines (MDA-MB-468, MCF-7, and BT-474), and one human prostate cancer cell line (LNCaP). After treating the cells with different concentrations of SI-12 for 72 hours, we measured the IC50 values of SI-12, which were found to be 29, 26, 28, 15, 3.4, 0.8, and 25 nM for Panc-1, HPAC, Mpanc-96, MDA-MB-468, MCF-7, BT-474, and LNCaP cell lines, respectively, using the MTT assay (Table 4). Similarly, SI-10 exhibited very potent cytotoxicity against these cell lines with IC50 values ranging from 1 to 32 nM. In contrast, we did not observe any toxicity of SI-10/SI-12 up to 1000 nM in mouse primary hepatocytes (Table 4).
Table 4.
Cytotoxicity of SI-12 (6c) and SI-10 (6p) to a panel of cancer cell lines and mouse primary hepatocytes
| Cell lines | IC50 (nM) |
|
|---|---|---|
| SI-10 | SI-12 | |
|
| ||
| Panc-1 | 8 | 29.4 |
| HPAC | NTb | 26 |
| MPanc-96 | NTb | 28 |
| MDA-MB-468 | 32 | 14.5 |
| MCF-7 | 3.3 | 3.4 |
| BT-474 | 1.0 | 0.8 |
| LNCaP | 11 | 25 |
| Hepatocytes | >1000 | >1000 |
The cytotoxicity activities of individual compound to cells were determined by the MTT assay.
Not test.
SI-12 prevents formation of a DNA-bound estrogen receptor-a (ER) SRC-3/P300 complex.
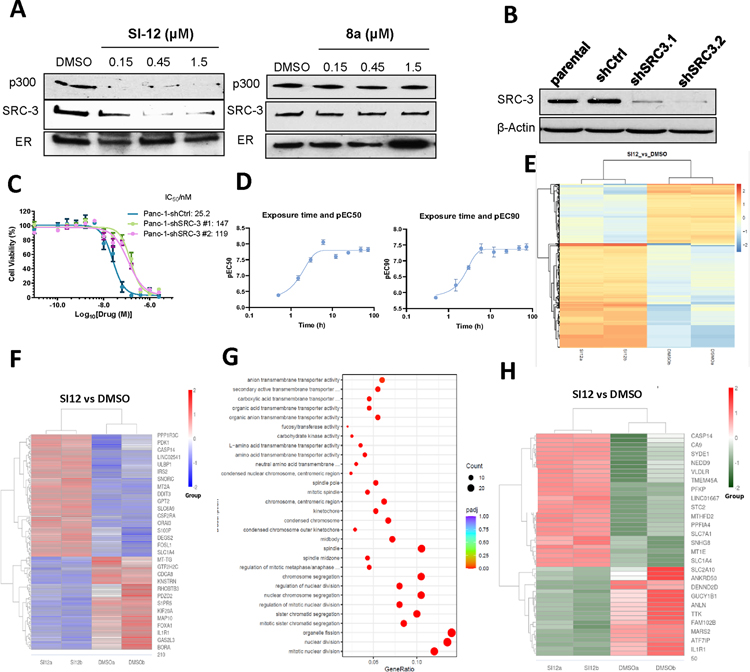
We previously reported the structural assembly of a DNA-bound ER/SRC-3/P300 complex using cryo-EM.24 To test whether SI-12 can bind with SRC-3, we performed an estrogen receptor binding element (ERE) pull-down assay. In this assay, biotinylated ERE, recombinant ER, SRC-3, and p300 proteins were incubated with varying concentrations of SI-12, followed by using magnetic streptavidin beads to pull-down the complex and Western blot analysis to quantify the amount of SRC-3 and p300. Our result showed that SI-12 significantly decreased the recruitment of SRC-3 and p300 in the ER complex at 0.15 μM, which is similar to the concentration of SRC-3 protein (0.13 μM) used in this assay. In contrast, the negative control compound 8a did not affect the ER complex even at the concentration of 1.5 μM (Fig 3A). This suggests that SI-12 can disrupt the formation of DNA-bound ER/SRC-3/P300 complex. It should be noted that the SI-12 concentration used in this assay (0.15 μM) is significantly higher than its in-cell IC50 (low nM range) because a high concentration of SRC-3 is required in this ERE pull-down assay.
Figure 3.
Target engagement and mechanism of action of SI-12. (A) Biotinylated ERE pull-down assay of SI-12 (6c) and 8a. SI-12 (6c) can decrease the recruitment of SRC-3 and p300 in the ER complex, however, the negative control 8a does not have any effect on this complex. (B) SRC-3 was stably knocked down with lentivirus-mediated shRNAs in the PANC-1 cell lines. SRC-3 level of each cell line was quantified by west-blot. (C) The viabilities of wild-type PANC-1 cells and PANC-1 shSRC-3 cells treated with SI-12 (6c) for 72 h. Compared with parental SRC-3+/+ cells, the response of PANC-1 SRC-3 knock-down cells to SI-12 (6c) treatment is reduced by 4.7 ~5.8 folds. (D) Cytotoxicity of SI-12 (6c) to MDA-MB-468 cells after wash-out. MDA-MB-468 cells were treated with SI-12 (6c) for different times, followed by washing off the drug with PBS, then extending the incubation time to a total of 72 h. EC50 and EC90 were determined by MTT assay for each time point. The viability of cells did not change after incubating with SI-12 (6c) for 3–6 h. (E) Heatmap of Peak enrichment among DMSO and SI-12 (6c) group in ATAC-seq assay. The color ranging from red to blue indicates that gene levels from large to small. (F) Heatmap of differentially expressed genes among DMSO and SI-12 (6c) group in RNA-seq assay. The color ranging from red to blue indicates that gene expression levels from large to small. (G) Gene Ontology (GO) enrichment analysis for differentially regulated genes between DMSO and SI-12 (6c) group in RNA-seq assay. The size of a point represents the number of genes annotated to a specific GO Term, and the color from red to purple represents the significant level of the enrichment. (H) Heatmap of common differentially expressed genes in ATAC-seq and RNA-seq. The color ranging from red to green indicates that gene levels from large to small.
Cytotoxicity potency of SI-12 depends on SRC-3.
To demonstrate SI-12 induced cytotoxicity through SRC-3 in cell, we performed a knock-down cell assay. SRC-3 was stably knocked down with lentivirus-mediated shRNAs in the PANC-1 cell lines that normally overexpress SRC-3 at elevated levels (Fig 3B), after treated with varying doses of SI-12 for 72 h, and the cell viability was measured with MTT assay. The IC50 values for the Panc-1-shCtrl, PANC-1-shSRC-3.1 and PANC-1-shSRC-3.2 cells were 25.2, 147 and 119 nM respectively (Fig 3C). The potency of SI-12 against SRC-3 knock-down cells was reduced by approximately 5-fold compared to that against the control cell line, which is consistent with our previously result of SI-2.29
SI-12 kills cells with a fast and sustained manner.
To investigate the kinetics of SI-12 induced cytotoxicity in cells, a washout experiment was conducted using MDA-MB-468 cells. Briefly, cells were treated with SI-12 for varying durations, after which the drug was washed out with PBS and the cells were incubated for 72 hours. Cell viability was assessed using MTT assays. The results of this experiment revealed that treatment with SI-12 for 3–6 hours was sufficient to achieve maximal cytotoxicity (Fig 3D). These findings suggest that the cytotoxic effect of SI-12 is fast and sustained, further supporting its potential as an effective anticancer agent.
SI-12 induces significant alternations in epigenome and mRNA expression.
To assess the impact of SI-12 on the epigenome and mRNA expression, we treated MDA-MB-468 cells with SI-12 for 4h and 12h, followed by ATAC-seq and RNA-seq assays, respectively. As shown in Figure 3E, 4h treatment of SI-12 induced significant alterations in chromatin accessibility in MDA-MB-468 cells, suggesting SI-12 regulated an array of transcriptional factors (Fig 3E). The RNA-seq results further confirmed that SI-12 induced significant changes in gene expression in MDA-MB-468 cells (Fig 3F). Notably, the GO enrichment analysis indicated that the enriched genes primarily relate to organelle fission, nuclear division, and chromosome segregation, suggesting that SI-12 inhibits cell proliferation by regulating these genes (Fig 3G).
To assess the correlation between alterations in epigenome identified in ATAC-seq analysis and changes in gene expression, we integrated ATAC-seq data with RNA-seq data. A total of 50 common differentially expressed genes were identified, with subsequent analysis revealing that 11 of these genes are linked to cell apoptosis, cell proliferation, cell cycle (Fig 3H, Table S2).
SI-10 and SI-12 exhibit improved pharmacokinetic profile.
The full pharmacokinetic profile of SI-10 and SI-12 were measured in CD-1 mice via intravenous administration (1mg/kg, n=3) and oral administration (10 mg/kg, n =3) respectively. 10 mL of blood were collected at each time point from dorsal metatarsal veins. The plasma concentration of drugs was quantified using liquid chromatography mass spectrometry (LC-MS). The PK parameters were estimated by non-compartmental model (Fig 2C, D). As shown in Table 5, for IV administration, SI-10 and SI-12 exhibited a plasma half-life (t1/2) of 3.25 and 22.5 h, area under the curve (AUC0~t ) of 290 and 2310 nM*h, and clearance of 176 and 22 mL/min/kg; For oral administration, SI-10 and SI-12 have a plasma half-life (t1/2) of 9.1 and 14.3 h, the maximum plasma concentration Cmax of 1135 and 2736 nM, and the time to reach the maximum plasma concentration tmax of 0.25 h. The oral bioavailability was calculated to be 54.4% and 24.6% using the AUC values obtained from the intravenous administration and oral administration, respectively.30 The superior oral bioavailability of SI-10 could be attributed to its significantly enhanced water solubility (22.8 μM vs 3.8 μM), a crucial factor for efficient drug absorption. This is particularly noteworthy given that SI-10 and SI-12 have comparable permeability, as indicated by their similar permeability coefficients (-Log Pe: 4.64 vs 4.69). Collectively, our results demonstrated that SI-10 and SI-12 had significantly improved half-lives compared to SI-2 (3.25 h, 22.5 h vs 1 h), presenting good pharmacokinetic profiles and oral bioavailability.
Table 5.
Pharmacokinetic parameters of SI-12 (6c) and SI-10 (6p) in CD-1 mice30
| Compound | Administration | T1/2 (h) | Tmax (h) | Cmax (ng/ml) | AUC0-t (ng*h/ml) | Cl (mL/min/kg) | F |
|---|---|---|---|---|---|---|---|
| SI-12 | IV (1 mg/kg) | 22.5 | 0.033 | 1066 | 737 | 22.0 | -- |
| PO (10 mg/kg) | 14.3 | 0.25 | 217 | 1719 | -- | 24.6% | |
| SI-10 | IV (1 mg/kg) | 3.25 | 0.033 | 552 | 87.6 | 176 | -- |
| PO (10 mg/kg) | 9.09 | 0.25 | 89 | 477 | -- | 54.4% |
Identification of the major human liver cytochrome P450 isoform responsible for SI-10 metabolism.
To ascertain the primary human liver cytochrome P450 isoform responsible for SI-10 metabolism, we assessed the stability of SI-10 incubated with each CYP450 isoform. Figure S3 illustrates that CYP1A2 emerges as the predominant enzyme accountable for SI-10 metabolism, leading to a remarkable 98% reduction in SI-10 levels after a 1-hour incubation. This data suggest that co-administering SI-10 with a CYP1A2 inhibitor could potentially enhance its in vivo stability.
Safety profiles of SI-10 and SI-12 in vitro and in vivo.
Off-target interactions and associated toxicity is one of the main concerns in drug development. Careful characterization and identification of pharmacology profiles of drug candidates early in the drug discovery process can help to reduce the incidence of adverse drug reactions. To identify significant off-targets interaction with SI-10 and SI-12, we employed a SafetyScreen panel against 78 targets, including GPCRs, ion channel, receptors, kinase, enzymes and transporters.38 As shown in table 6, SI-12 had only minimal interactions with seven targets (4 GPCRs, 1 ion channel, 2 non-kinase enzymes) with EC50/IC50 values ranging from 3~6 μM. Even at a concentration of 10 μM, SI-12 had minimal inter- actions with other targets. For SI-10, only two non-kinase enzymes, COX1 and COX2, were identified with IC50 values of 2.9 and 2.4 μM, respectively. Compared to the single digit nanomole potency of SI-10 and SI-12, our lead compounds exhibit high selectivity away from these off-targets, suggesting a large therapeutic window for in vivo studies.
Table 6.
Off-targets interactions of SI-12 (6c) and SI-10 (6p)a
| Compound | Target Class | Assay Name | Assay Target | Mode | RC50 (µM)b |
|---|---|---|---|---|---|
|
| |||||
| SI-12 | GPCR | Calcium Flux | EDNRA | Agonist | 6.4c |
| Calcium Flux | EDNRA | Antagonist | 4.0 | ||
| Calcium Flux | HTR2B | Antagonist | 4.1 | ||
| cAMP | OPRM1 | Antagonist | 3.1 | ||
| Ion Channel | Ion Channel | hERG | Blocker | 2.7 | |
| Non-Kinase Enzymes | Enzymatic | COX1 | Inhibitor | 3.1 | |
| Enzymatic | COX2 | Inhibitor | 3.0 | ||
|
| |||||
| SI-10 | Non-Kinase Enzymes | Enzymatic | COX1 | Inhibitor | 2.9 |
| Enzymatic | COX2 | Inhibitor | 2.4 | ||
Data was obtained by using SafetyScreen panel provided by Eurofins Discovery.
RC50 is described as IC50 unless otherwise specified.
RC50 is EC50.
In drug development, assessing the potential for lead compounds to inhibit hERG (the human ether-à-go-go–related gene), which codes for a cardiac potassium ion channel, is crucial to prevent the occurrence of cardiac arrhythmia and sudden death.39 To evaluate the inhibitory effect of our lead compounds on hERG, we utilized a manual patch-clamp system, which is considered as the gold standard for hERG assays.40 HEK293 cell line stably transfected with the hERG gene was used in this study, with Dofetilide as a positive control to ensure the quality of the assay. The results are presented in table 7, where positive control, Dofetilide, significantly inhibited hERG at 50 nM. In contrast, SI-12 exhibited moderate hERG inhibition at 10 μM. Notably, SI-10 did not show appreciable hERG inhibition even at 30 μM (Table 7, Fig S4).30
Table 7.
hERG inhibition of SI-12 (6c) and SI-10 (6p)
| Compound | IC50 (µM) |
|---|---|
|
| |
| SI-12 | 1.127 |
| SI-10 | >30a |
| Dofetilide | 0.014 |
The IC50 > 30 μM was reported if the maximum inhibition at 30 μM was lower than 50%.
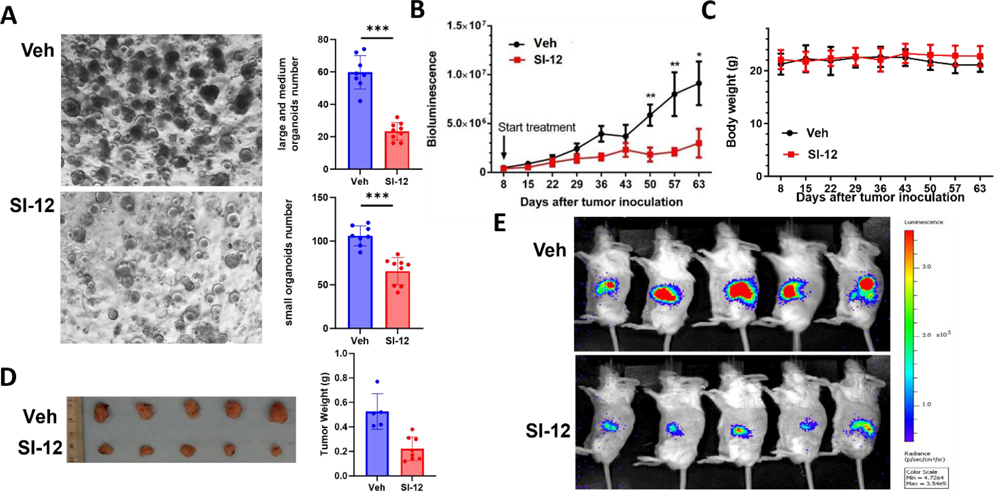
We also tested the maximum tolerated dose (MTD) of SI-10 and SI-12 in mice. Treating mice with either SI-10 or SI-12 does not cause observable acute or chronic toxicities. Specifically, oral administration of SI-10 up to 100 mg/kg (the highest dose tested) did not cause appreciable stress in mice. In addition, continuous treatment of mice with SI-10 (50 mg/kg or 100 mg/kg, once per day) for 4 weeks did not cause any loss of body weight (Fig S5). For SI-12, intraperitoneal dosing with 10 mg/kg for 8 weeks also did not cause any mice body weight change (Fig 4C). These results suggest that SI-10 has excellent safety profiles and SI-12 is well-tolerated at the doses tested.
Figure 4.
Ex vivo and in vivo efficacy of SI-12 (6c). (A) Images and quantification of prostate cancer PDX organoids treated by SI-12 (6c) and vehicle. SI-12 (6c) significantly inhibited the growth of organoids developed from prostate cancer PDX tumors. (B) Tumor volumes and (C) body weights were measured once per week in an orthotopic PDAC mouse model (n = 9). SI-12 (6c) can significantly inhibit tumor growth while not affecting mouse body weights. The treatment group was treated with SI-12 (10 mg/kg, i.p.) once per day (D) Representative images of harvested tumors and (E) Representative luciferase images after 8 weeks of treatment. Data represent mean ± SEM; *p < 0.05, **p < 0.005, ***p < 0.0005.
SI-12 represses the growth of prostate cancer PDX organoids.
Patient-derived tumor organoid models (PDOs), generated directly from patient tissue, offer a faithful representation of the genomic, morphological, and pathophysiological characteristics of the original patient tumor. These models are advantageous for drug screening and evaluation due to their ease of scalability compared to in vivo models.41 To assess the responsiveness of prostate cancer patient-derived xenograft (PDX) organoids to SI-12 treatment, we exposed the prostate cancer PDX organoids to either a vehicle control or SI-12 for a duration of 2 weeks. Notably, SI-12 treatment effectively suppressed the formation and growth of organoids of varying sizes (Fig 4A).
SI-10/SI-12 significantly inhibits tumor growth in xenograft mouse models.
The potential of SI-10 and SI-12 as therapeutic agents was further evaluated in preclinical mouse models, given their high in vitro potency, good pharmaco- kinetic properties, and favorable safety profiles. The therapeutic efficacy of SI-12 was initially tested in an orthotopic pancreatic ductal adenocarcinoma (PDAC) model, which is characterized by poor prognosis and limited therapeutic options. Panc-1-Luc cells (0.5×10⁶ cells per mouse) were orthotopically implanted into the pancreas of SCID mice. After eight days, the mice were randomly assigned into two groups based on luciferase imaging (n=5 per group) and treated with either SI-12 (10 mg/kg) or the solvent vehicle every day. Tumor volumes were measured once per week by luciferase live imaging (Fig 4B, E). After 63 days, the mice were euthanized, and tumors were harvested. The result showed that SI-12 significantly inhibited PDAC tumor growth compared to control group (0.22 g vs 0.52 g) (Fig 4D). Importantly, the mice in both the SI-12 treatment and control groups had similar body weight throughout the experiment (Fig 4C), demonstrating the low toxicity of SI-12.
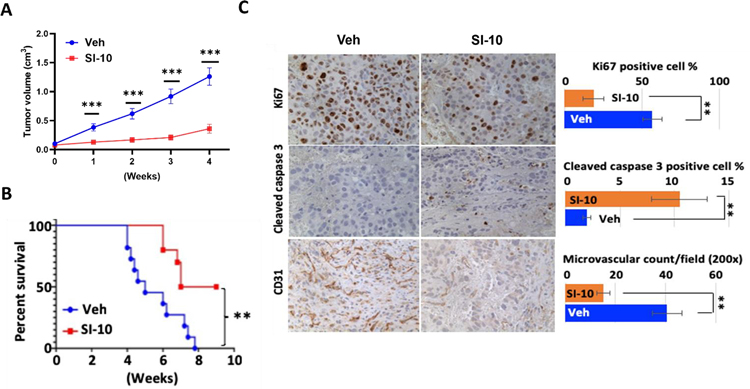
Furthermore, we evaluated the efficacy of SI-10 in a xenograft prostate cancer mouse model. Male SCID mice were subcutaneously injected with LNCaP cells (1×10⁷cells per mouse) on both sides under the back skin. 4 weeks after tumor inoculation reached 0.5 cm in diameter, mice were treated with SI-10 (10 mg/kg) or the solvent vehicle every day. Tumor volumes were measured once per week during the treatment period. Remarkably, SI-10 treatment resulted in a substantial inhibition of tumor growth after only one week of treatment. After four weeks of treatment, SI-10 exhibited a remarkable reduction in tumor growth by more than 65% compared to the vehicle treatment (Fig 5A). Mouse survival was also evaluated using a humane 3.0 cm diameter criteria as the endpoint for scoring tumor mortality. Importantly, SI-10 treatment significantly prolonged mouse survival compared to the vehicle control group (Fig. 5B).
Figure 5.
Therapeutical efficacy of SI-10 (6p) in LNCaP xenograft mice model. (A) Tumor growth curve and (B) survive curve of SCID mice with LNCaP xenograft tumors treated by SI-10 (6p). SI-10 (6p) significantly inhibits tumor growth in LNCaP xenograft model and extend survival of SCID mice. LNCaP cells (1×10⁷ cells per mouse) were inoculated into both side under the back skin of SCID mice (male, 4–5 weeks). Treatment started 4 weeks after tumor inoculation. The treatment group was treated with SI-10 (10 mg/kg, i.p.) once per day for 4 weeks (n = 10). The control group was treated with vehicle (n = 11). Tumor volumes were measured once per week. (C) IHC for Ki67, cleaved caspase 3 and CD31 was performed with LNCaP xenograft tumors collected from SI-10 (6p) or vehicle treated mice. Positive cell numbers and microvascular structures were counted and shown in the bar graph. For each marker examined, eight tumor samples from eight mice were included. At least five different areas were counted under microscope for each tumor sample. Data represent mean ± SEM; **p < 0.05, ***p < 0.005.
To investigate the effects of SI-10 on tumor cell proliferation and angiogenesis, immunostaining was performed on tumor tissue sections collected at the end of treatment. Immunostaining for Ki67, a proliferation marker, revealed that more than 50% of the tumor cells in the vehicle treated tumors exhibited Ki67 positive staining. In contrast, tumors from SI-10 treated animals displayed significantly lower numbers of Ki67 positive cells, indicating a reduction in tumor cell proliferation (Fig. 5C, upper). Immunostaining for cleaved caspase 3, an indicator of apoptosis, demonstrated a notable increase in cleaved caspase 3 positive cells in SI-10 treated tumors. Approximately 10% of the LNCaP tumor cells showed positive staining for cleaved caspase 3, which was markedly higher compared to the 2% observed in vehicle treated tumors (Fig. 5C, middle). These findings suggest that SI-10 treatment induces apoptosis in tumor cells in vivo. Furthermore, we assessed the impact of SI-10 on tumor angiogenesis by examining microvascular formation shown by immunohistochemistry against CD31, an endothelial cell marker. The analysis revealed significantly lower microvascular density in SI-10 treated tumors compared to vehicle treated tumors. A reduction of more than 50% in microvascular density (MVD) in SI-10 treated tumors was observed (Fig. 5C, bottom), indicating that SI-10 treatment can effectively inhibit tumor angiogenesis.
SI-10/SI-12 exhibits potent repression of bone metastasis in a prostate cancer PDX xenograft tumor model.
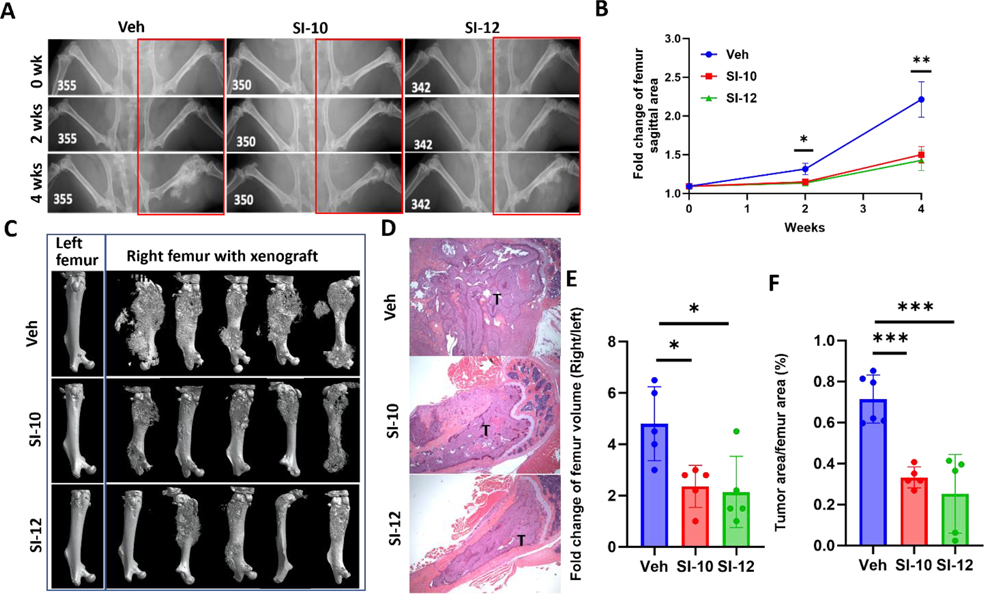
To investigate the potential impact of SI-10/SI-12 treatment on prostate cancer metastasis, we established a xenograft metastasis mouse model through intra-femoral injection of AR-PDX tumor cells 118b established from metastatic prostate cancer, as described previously.42 Two weeks post-injection, mice were treated with either SI-10, SI-12 (10 mg/kg/day), or vehicle via intraperitoneal administration. X-ray imaging at two-week intervals revealed extensive metastasis in the femurs of vehicle-treated mice, whereas SI-10 and SI-12 treatment led to suppressed bone metastasis and reduced bone damage (Fig 6A, B). After four weeks of treatment, CT imaging and H&E staining of the mice femurs demonstrated significantly reduced tumor burden in both drug-treated groups (Fig 6C, D). Quantitative analysis confirmed that SI-10 and SI-12 treatment resulted in more than a 55% reduction in femur volume compared to the vehicle group (Fig 6E). Additionally, the ratio of tumor area to femur area decreased by over 50% with drug treatment (Fig 6F). Collectively, these findings provide compelling evidence that SI-10 and SI-12 effectively suppress bone metastasis in the intra-femoral bone metastasis model of prostate cancer.
Figure 6.
In vivo efficacy of drugs in an intra-femoral bone metastasis mice model. (A) Representative X-ray images of tumor growth in mouse femur with treatment of vehicle (n = 9), SI-10 (n = 9) or SI-12 (n = 8). Both SI-10 and SI-12 significantly reduced tumor growth in mouse femur. (B) Tumor growth curve according to X-ray images. (C) Representative 3D reconstruction of mouse femurs with CT imaging and (D) Histology of mouse femur tissues. Left femur served as negative control. (E) Quantitative analysis of CT images. (F) Ratio of tumor area vs femur area. T: tumor area. Data represent mean ± SEM; * p<0.05, **p<0.005, ***p<0.0005.
Notably, it should be emphasized that in these in vivo experiments, mice were treated with SI-10 or SI-12 once per day, in contrast to SI-2, which requires twice-daily dosing. This further supports the notion that the enhanced metabolic and pharmacokinetic stability of SI-10 and SI-12 can decrease the required treatment frequency, which is critical for both drug development and patient tolerability.
DISCUSSION AND CONCLUSION
Herein, we performed an extensive structure-activity relationships (SARs) exploration and lead optimization campaign guided by in vitro/in vivo metabolism studies and PK/PD assays, to develop more potent and selective compounds with good ADMET properties for targeting SRC-3 in cancer treatment. By introducing a series of fluorines to SI-2 to block the potential metabolic soft spots, we identified SI-10 and SI-12 as lead compounds that possess more potent cytotoxicity for MCF7 cells and better drug-like properties than SI-2, as evidenced by their improved half-life and plasma concentration.
To shed light on the on-target effects of SI-10/SI-12, we conducted an in vitro target engagement assay. In the pull-down assay, the recruitment of SRC-3 and p300 in the ER complex was observed to decrease upon treatment with SI-12, while the negative control compound had no impact on the ER complex, suggesting that SI-12 specifically affects the interaction of SRC-3 and p300 within the ER complex. Of note, the wash-out experiment revealed that SI-12 achieved maximum cytotoxicity within a 6-hour treatment period, and this cytotoxic effect persisted even after removing the drug. This memory effect aligns with previous publication where MDA-MB-231 cells treated with SI-2 in vitro for three days, followed by washing to remove the compound for an additional three days, displayed significantly slower growth in vivo compared to untreated cells upon tumor injection.32 Our ATAC-seq and RNA-seq analyses demonstrated that short-term exposure to SI-12 induced substantial alterations in both the epigenome and mRNA expression in MDA-MB-468 cells. These findings suggest that this series of SRC-3 inhibitors epigenetically changed the cells to achieve the memory effects that we observed.
Despite displaying lower total drug exposure and a shorter plasma half-life in mice, SI-10 exhibited comparable efficacy to SI-12 in both prostate metastasis mice model and MDA-MB-231 xenograft tumor model.30 This comparable efficacy may be attributed to the memory effect of SRC-3 inhibition, which makes long plasma half-life unnecessary, as well as a higher percentage of free drug. Notably, SI-10 possessed superior water solubility (22.8 μM vs 3.8 μM), a higher percentage of free drug (6.6% vs 2.2%), and better oral bioavailability (54.5% vs 24.6%), rendering it more promising as an orally administered drug. Furthermore, in comparison to SI-12, SI-10 demonstrated higher selectivity against 78 off-targets and exhibited significantly weaker inhibition of hERG activity, which highlight the improved selectivity and reduced risk of cardiac adverse effects associated with SI-10. Taken together, these results strongly support the potential of SI-10 as a promising lead compound targeting SRC-3 for the treatment of cancer. Its comparable efficacy, along with better water solubility, oral bioavailability, and improved selectivity profile, positions SI-10 as a compelling candidate for further development as anticancer therapeutics.
EXPERIMENTAL SECTION
Chemistry.
All reagents and solvents employed were purchased commercially and used as received. Reagents were purified prior to use unless otherwise stated. Column chromatography was carried out on a Teledyne ISCO CombiFlash Rf 200. 1H NMR and 13C NMR spectral data were recorded in CDCl3, Acetone-d6, DMSO-d6, CD3OD on a Varian Palo Alto 400MHz NMR spectrometer and Chemical shifts (δ) were reported in parts per million (ppm), and the signals were described as brs (broad singlet), d (doublet), dd (doublet of doublet), m (multiple), q (quarter), s (singlet), and t (triplet). Coupling constants (J values) were given in Hz. Low-resolution mass spectra (ESI) was obtained using Agilent LC-MS 1200 series (6130 single quad). High-resolution mass spectra (ESI) was obtained using ThermoFisher Orbitrap Fusion Lumos Tribrid Mass Spectrometer. All final compounds had purity >95% determined by using High Pressure Liquid Chromatography (HPLC) using an Agilent Eclipse plus-C18 column eluting with a mixture of MeCN/Water (V:V = 80:20 plus 0.1% FA)
General Procedures for the preparation of Compound (5).
To a solution of 4,5-difluorobenzene-1,2-diamine 1a (1.39 g, 11.0 mmol) and triethylamine (3.26 mL, 23.2 mmol) in methylene chloride (20 mL) was added dropwise a solution of diphosgene (0.69 mL, 5.72 mmol) in methylene chloride (5 mL) at 0 to 5°C. The resulting suspension was stirred for 2 hours at room temperature and filtered. The collected white solid was washed with water and dried to give compound 2a (1.56 g, 93%). 1H NMR (400 MHz, DMSO-d6) δ 10.77 (s, 2H), 6.98 (m, 2H). MS (ESI): m/z 171.1 [M+1]+.
2-chloro-5,6-difluoro-1H-benzo[d]imidazole (3a).
A solution of 5,6-difluoro-1,3-dihydro-2H-benzo[d]imidazol-2-one 2a (1.562 g, 10.3 mmol) in POCl3 (14 mL, 154.5 mmol) was heated for 18 hours at 100°C. The reaction mixture was cooled to room temperature and excess of POCl3 was evaporated in vacuo. The residue was neutralized with saturated NaHCO3 solution (10 mL) and extracted with EtOAc (3 × 20 mL). The organic phase was washed with brine and then dried over MgSO4, filtered, and concentrated under reduced pressure to afford 3a (1.552 g, 88%). 1H NMR (400 MHz, DMSO-d6) δ 7.68 – 7.52 (m, 2H). MS (ESI): m/z 188.0 [M+1]+.
2-chloro-5,6-difluoro-1-methyl-1H-benzo[d]imidazole (4a).
To a solution of NaH (546 mg, 60% dispersion in mineral oil) in DMF (10 mL) was added 2-chloro-5,6-difluoro-1H-benzo[d]imidazole 3a (1.552 g, 9.09 mmol) in DMF (10 mL), at 0 °C. The mixture was stirred for a further 15 minutes at this temperature. Then NaI (0.74 mL, 11.8 mmol) was added and stirred for 5 hours at room temperature. When TLC showed full conversion, the mixture was poured into 60 mL water and the compound was extracted with EtOAc. The organic phase was washed with brine and then dried over MgSO4, filtered, and concentrated under reduced pressure. The residue was purified by flash chromatography to afford compound 4a (1.37 g, 82%). 1H NMR (400 MHz, DMSO-d6) δ 7.67 (dd, J = 10.4, 7.2 Hz, 1H), 7.40 (dd, J = 9.6, 6.8 Hz, 1H), 3.76 (s, 3H). MS (ESI): m/z 203.0 [M+1]+.
5,6-difluoro-2-hydrazineyl-1-methyl-1H-benzo[d]imidazole (5a).
The mixture of compound 4a (771 mg, 4.18 mmol) in hydrazine hydrate (5 mL) was heated at 100 °C in a sealed tube for 12 hours. After cooling to room temperature, the precipitate was filtered off, washed several times with water, and dried to give compound 5a (670 mg, 89%). 1H NMR (400 MHz, DMSO-d6) δ 10.52 (s, 1H), 7.72 (t, J = 8.7 Hz, 1H), 7.36 (t, J = 8.5 Hz, 1H), 3.56 (s, 3H). 13C NMR (100 MHz, DMSO-d6) δ 154.1, 146.7 (dd, J = 240.6, 16.3 Hz), 128.7 (d, J = 15.3 Hz), 126.5, 100.8 (dd, J = 149.3, 23.9 Hz). MS (ESI): m/z 199.1 [M+1]+.
Compound 5b-5c was prepared according to the procedure described above for 5a.
2-hydrazineyl-1-methyl-1H-benzo[d]imidazole (5b):
1H NMR (400 MHz, DMSO-d6) δ 7.79 (s, 1H), 7.29–7.21 (m, 1H), 7.20–7.13 (m, 1H), 7.01–6.91 (m, 1H), 4.26 (s, 2H), 3.46 (s, 3H). MS (ESI): m/z 163.1 [M+1]+.
5-fluoro-2-hydrazineyl-1-methyl-1H-benzo[d]imidazole (5c):
1H NMR (400 MHz, DMSO-d6) δ 7.79 (s, 1H), 7.29–7.21 (m, 1H), 7.20–7.13 (m, 1H), 7.01–6.91 (m, 2H), 4.26 (s, 2H), 3.46 (s, 3H). MS (ESI): m/z 181.1 [M+1]+.
General Procedures for the preparation of Compound (6).
To the mixture of the hydrazine 5 (0.2 mmol) and ketone (0.21 mmol) in methanol (2 mL) was added acetic acid (1 drop) at room temperature. The mixture was stirred for further 12 hours at room temperature. The mixture was concentrated under reduced pressure, and the crude residue was purified by flash chromatography to afford compound 6.
(E)-2-(((E)-1-(5-fluoropyridin-2-yl)ethylidene)hydrazineylidene)-1-methyl-2,3-dihydro-1H-benzo[d]imidazole (6a):
1H NMR (400 MHz, DMSO-d6) δ 11.08 (s, 1H), 8.56 – 8.50 (m, 1H), 8.47 (s, 1H), 7.69 (t, J = 8.9 Hz, 1H), 7.14 (d, J = 6.5 Hz, 1H), 7.08 (d, J = 6.6 Hz, 1H), 6.98 (dd, J = 10.1, 5.7 Hz, 2H), 3.43 (s, 3H), 2.36 (s, 3H). 13C NMR (100 MHz, DMSO-d6) δ 158.7 (d, J = 253.5 Hz), 155.4, 153.9, 151.2, 135.6 (d, J = 23.4 Hz), 132.8, 130.7, 123.0 (d, J = 18.7 Hz), 121.5 (d, J = 4.2 Hz), 120.9, 120.7, 108.6, 107.4, 27.7, 12.1. MS (ESI): m/z 284.1 [M+1]+. HRMS (ESI): m/z Calcd for (C15H15FN5) ([M+H]+): 284.1311; found: 284.1303.
(E)-5-fluoro-2-(((E)-1-(5-fluoropyridin-2-yl)ethylidene)hydrazineylidene)-1-methyl-2,3-dihydro-1H-benzo[d]imidazole (6b):
1H NMR (400 MHz, DMSO-d6) δ 11.19 (s, 1H), 8.49 (dd, J = 9.4, 5.1 Hz, 2H), 7.70 (td, J = 8.8, 2.2 Hz, 1H), 7.10 (dd, J = 8.4, 4.4 Hz, 1H), 6.89 – 6.77 (m, 2H), 3.41 (s, 3H), 2.36 (s, 3H). 13C NMR (100 MHz, DMSO-d6) δ 159.2 (d, J = 252 Hz), 158.2 (d, J = 233 Hz), 156.3, 154.2 (d, J = 3.4 Hz), 152.2, 136.1 (d, J = 23.4 Hz), 131.9 (d, J = 13.2 Hz), 129.9, 123.5 (d, J = 18.7 Hz), 121.9 (d, J = 4.3 Hz), 107.9 (d, J = 9.8 Hz), 107.1 (d, J = 24.1 Hz), 97.0 (d, J = 28.6 Hz), 28.3, 12.6. MS (ESI): m/z 302.2 [M+1]+. HRMS (ESI): m/z Calcd for (C15H14F2N5) ([M+H]+): 302.1217; found: 302.1208.
(E)-5,6-difluoro-2-(((E)-1-(5-fluoropyridin-2-yl)ethylidene)hydrazineylidene)-1-methyl-2,3-dihydro-1H-benzo[d]imidazole (6c):
1H NMR (400 MHz, DMSO-d6) δ 11.17 (s, 1H), 8.48 (dd, J = 8.4, 4.0 Hz, 2H), 7.72 (td, J = 8.7, 2.6 Hz, 1H), 7.36 (dd, J = 10.4, 7.2 Hz, 1H), 7.02 (dd, J = 9.9, 7.2 Hz, 1H), 3.40 (s, 3H), 2.36 (s, 3H). 13C NMR (100 MHz, DMSO-d6) δ 160.5, 158.0, 156.4, 154.1, 152.6, 146.3 (d, J = 237 Hz, 16 Hz), 136.1 (d, J = 23.4 Hz), 129.4, 126.9, 123.5 (d, J = 18.6 Hz), 121.9 (d, J = 4.4 Hz), 28.5, 12.6. MS (ESI): m/z 320.2 [M+1]+. HRMS (ESI): m/z Calcd for (C15H13F3N5) ([M+H]+): 320.1123; found: 320.1114.
(E)-5,6-difluoro-1-methyl-2-(((E)-1-(pyridin-2-yl)ethylidene)hydrazineylidene)-2,3-dihydro-1H-benzo[d]imidazole (6d):
1H NMR (400 MHz, CDCl3) δ 8.60 (d, J = 4.2 Hz, 1H), 7.93 (d, J = 8.0 Hz, 1H), 7.67 (t, J = 7.5 Hz, 1H), 7.22 (dd, J = 12.5, 6.4 Hz, 1H), 7.02 (s, 1H), 6.87 (t, J = 7.2 Hz, 1H), 3.67 (s, 3H), 2.49 (s, 3H), 2.12 (s, 1H). 13C NMR (100 MHz, CDCl3) δ 176.4, 155.5, 148.1, 146.9, 146.5 (dd, J = 241 Hz, 16 Hz), 137.5, 136.8, 129.6, 123.4, 122.8, 120.3, 96.7, 96.7 (d, J = 24 Hz), 21.8, 11.9. MS (ESI): m/z 302.1 [M+1]+. HRMS (ESI): m/z Calcd for (C15H14F2N5) ([M+H]+): 302.1217; found: 302.1211.
(E)-5,6-dichloro-2-(((E)-1-(5-fluoropyridin-2-yl)ethylidene)hydrazineylidene)-1-methyl-2,3-dihydro-1H-benzo[d]imidazole (6e):
1H NMR (400 MHz, DMSO-d6) δ 11.25 (s, 1H), 8.52 (s, 1H), 8.50 – 8.46 (m, 1H), 7.75 (t, J = 8.8 Hz, 1H), 7.46 (s, 1H), 7.15 (s, 1H), 3.43 (s, 3H), 2.40 (s, 3H). 13C NMR (100 MHz, DMSO-d6) δ 160.2, 157.6, 153.9 (d, J = 227 Hz), 153.5 (d, J = 3.5 Hz), 135.8 (d, J = 23.3 Hz), 133.2, 130.9, 123.2 (d, J = 18.7 Hz), 122.5 (d, J = 30.4 Hz), 121.6 (d, J = 4.4 Hz), 109.3, 108.9, 28.1, 12.2. MS (ESI): m/z 352.1 [M+1]+. HRMS (ESI): m/z Calcd for (C15H13Cl2FN5) ([M+H]+): 352.0532; found: 352.0525.
methyl 6-((E)-1-(((E)-5,6-dichloro-1-methyl-1,3-dihydro-2H-benzo[d]imidazol-2-ylidene)hydrazineylidene)ethyl)nicotinate (6f):
1H NMR (400 MHz, DMSO-d6) δ 11.33 (s, 1H), 9.01 (s, 1H), 8.52 (d, J = 8.4 Hz, 1H), 8.15 (d, J = 8.4 Hz, 1H), 7.40 (t, J = 8.7 Hz, 1H), 7.07 (t, J = 8.4 Hz, 1H), 3.86 (s, 3H), 3.43 (s, 3H), 2.38 (s, 3H). 13C NMR (100 MHz, DMSO-d6) δ 165.8, 160.9, 156.7, 152.5, 149.8, 145.5 (dd, J = 236 Hz, 19.7 Hz), 136.1, 128.0 (dd, J = 243 Hz, 11.7 Hz), 123.9, 119.92, 98.5 (d, J = 20.1 Hz), 97.9, 52.7, 28.6, 12.5. MS (ESI): m/z 360.1 [M+1]+. HRMS (ESI): m/z Calcd for (C17H16F2N5O2) ([M+H]+): 360.1272; found: 360.1265.
6-((E)-1-(((E)-5,6-dichloro-1-methyl-1,3-dihydro-2H-benzo[d]imidazol-2-ylidene)hydrazineylidene)ethyl)nicotinamide (6g):
1H NMR (400 MHz, DMSO-d6) δ 11.24 (s, 1H), 8.96 (s, 1H), 8.44 (s, 1H), 8.18 – 8.07 (m, 2H), 7.52 (s, 1H), 7.39 (t, J = 8.3 Hz, 1H), 7.05 (s, 1H), 3.14 (s, 3H), 2.38 (s, 3H). 13C NMR (100 MHz, DMSO-d6) δ 166.9, 159.3, 156.5, 152.8, 148.3, 145.6 (dd, J = 237.6, 16.2 Hz), 134.8, 128.1, 119.6, 98.2, 97.8 (d, J = 20.4 Hz), 28.6, 12.5. S (ESI): m/z 345.2 [M+1]+. HRMS (ESI): m/z Calcd for (C16H15F2N6O) ([M+H]+): 345.1275; found: 345.1267.
(E)-5,6-difluoro-1-methyl-2-(((E)-1-(5-(1-methyl-1H-pyrazol-4-yl)pyridin-2-yl)ethylidene)hydrazineylidene)-2,3-dihydro-1H-benzo[d]imidazole (6h):
1H NMR (400 MHz, DMSO-d6) δ 11.12 (s, 1H), 8.75 (s, 1H), 8.37 (d, J = 8.4 Hz, 1H), 8.24 (s, 1H), 7.96 (s, 1H), 7.89 (d, J = 8.4 Hz, 1H), 7.39 – 7.30 (m, 1H), 7.07 – 6.97 (m, 1H), 3.86 (s, 3H), 3.40 (s, 3H), 2.37 (s, 3H). 13C NMR (100 MHz, DMSO-d6) δ 156.2, 154.9, 153.6, 145.4 (dd, J = 237, 16.0 Hz), 145.2 (dd, J = 238, 17.0 Hz), 145.1, 136.7, 132.1, 129.5 (d, J = 11.6 Hz), 128.6, 127.6, 127.1 (d, J = 11.0 Hz), 120.4, 119.1, 98.1 (d, J = 23.1 Hz), 97.5 (d, J = 23.8 Hz), 28.5, 21.5, 12.6. MS (ESI): m/z 382.2 [M+1]+. HRMS (ESI): m/z Calcd for (C19H17F2N7) ([M+H]+): 382.1592; found: 382.1582.
4-(3-((6-((E)-1-(((E)-5,6-difluoro-1-methyl-1,3-dihydro-2H-benzo[d]imidazol-2-ylidene)hydrazineylidene)ethyl)pyridin-3-yl)oxy)propyl)morpholine (6i):
1H NMR (400 MHz, DMSO-d6) δ 11.02 (s, 1H), 8.33 (d, J = 8.8 Hz, 1H), 8.20 (s, 1H), 7.39 – 7.28 (m, 2H), 7.03 – 6.93 (m, 1H), 4.09 (t, J = 6.3 Hz, 2H), 3.54 (t, J = 4.3 Hz, 4H), 3.37 (s, 3H), 2.40 (t, J = 7.1 Hz, 2H), 2.34 (s, 7H), 1.87 (p, J = 6.5 Hz, 2H). 13C NMR (100 MHz, DMSO-d6) δ 156.1, 154.8, 153.6, 150.2, 143.4 (dd, J = 237, 17.0 Hz), 145.1 (dd, J = 237, 17.0 Hz), 135.6, 129.5 (d, J = 11.5 Hz), 127.1 (d, J = 11.1 Hz), 122.1, 121.2, 98.0 (d, J = 23.3 Hz), 97.3 (d, J = 24.0 Hz), 66.8, 66.6, 55.2, 53.8, 28.5, 26.30, 12.6. MS (ESI): m/z 445.2 [M+1]+. HRMS (ESI): m/z Calcd for (C22H27F2N6O2) ([M+H]+): 445.2164; found: 445.2155.
(6-((E)-1-(((E)-5,6-difluoro-1-methyl-1,3-dihydro-2H-benzo[d]imidazol-2-ylidene)hydrazineylidene)ethyl)pyridin-3-yl)(morpholino)methanone (6j):
1H NMR (400 MHz, CDCl3) δ 8.61 (s, 1H), 7.99 (d, J = 8.6 Hz, 1H), 7.76 (d, J = 8.3 Hz, 1H), 7.02 (s, 1H), 6.86 (s, 1H), 3.91 – 3.54 (m, 11H), 2.50 (s, 3H). 13C NMR (100 MHz, DMSO-d6) δ 173.3, 167.6, 157.9, 156.4, 147.1, 145.6 (dd, J = 238.2, 16.4 Hz), 135.1, 129.9, 129.4 (d, J = 10.5 Hz), 119.9, 97.7 (d, J = 23.8 Hz), 66.4, 28.8, 25.6, 12.5. MS (ESI): m/z 415.2 [M+1]+. HRMS (ESI): m/z Calcd for (C20H21F2N6O2) ([M+H]+): 415.1694; found: 415.1684.
(2E)-5,6-difluoro-2-[(2E)-2-{1-[5-(3-methanesulfonylpropoxy)pyridin-2-yl]ethylidene}hydrazin-1-ylidene]-1-methyl-2,3-dihydro-1H-1,3-benzodiazole (6k):
1H NMR (400 MHz, DMSO-d6) δ 11.02 (s, 1H), 8.35 (s, 1H), 8.22 (s, 1H), 7.37 (d, J = 8.9 Hz, 1H), 7.31 (dd, J = 10.2, 7.4 Hz, 1H), 7.02 – 6.95 (m, 1H), 4.19 (t, J = 6.0 Hz, 2H), 3.37 (s, 3H), 3.26 (d, J = 7.7 Hz, 2H), 3.00 (s, 3H), 2.34 (s, 3H), 2.19 – 2.10 (m, 2H). 13C NMR (100 MHz, DMSO-d6) δ 156.1, 154.5, 153.5, 150.5, 145.4 (dd, J = 236, 16 Hz), 145.1 (dd, J = 238, 18 Hz), 135.7, 129.5 (d, J = 10.9 Hz), 127.1 (d, J = 10.8 Hz), 122.2, 121.2, 98.0 (d, J = 23.3 Hz), 97.4(d, J = 23.9 Hz), 66.6, 50.9, 28.5, 22.4, 12.7. MS (ESI): m/z 438.1 [M+1]+. HRMS (ESI): m/z Calcd for (C19H22F2N5O3S) ([M+H]+): 438.1411; found: 438.1402.
6-((E)-1-(((E)-5,6-difluoro-1-methyl-1,3-dihydro-2H-benzo[d]imidazol-2-ylidene)hydrazineylidene)ethyl)nicotinic acid (6l):
1H NMR (400 MHz, DMSO-d6) δ 11.32 (s, 1H), 9.00 (s, 1H), 8.51 (d, J = 8.5 Hz, 1H), 8.14 (d, J = 8.1 Hz, 1H), 7.41 (s, 1H), 7.07 (s, 1H), 3.43 (s, 3H), 2.39 (s, 3H). MS (ESI): m/z 346.1 [M+1]+. HRMS (ESI): m/z Calcd for (C16H13F2N5O2) ([M+H]+): 346.1116; found: 346.1109.
6-((E)-1-(((E)-5,6-difluoro-1-methyl-1,3-dihydro-2H-benzo[d]imidazol-2-ylidene)hydrazineylidene)ethyl)-N-hydroxynicotinamide (6m):
1H NMR (400 MHz, DMSO-d6) δ 9.13 (s, 1H), 8.57 (d, J = 8.5 Hz, 1H), 8.29 (d, J = 8.7 Hz, 1H), 7.41 (t, J = 8.8 Hz, 1H), 7.08 (t, J = 8.5 Hz, 1H), 3.45 (s, 3H), 2.40 (s, 3H). MS (ESI): m/z 370.2 [M+1]+. HRMS (ESI): m/z Calcd for (C16H14F2N9) ([M+H]+): 370.1340; found: 370.1334.
(E)-5,6-difluoro-1-methyl-2-(((E)-1-(pyridin-3-yl)ethylidene)hydrazineylidene)-2,3-dihydro-1H-benzo[d]imidazole (6n):
1H NMR (400 MHz, DMSO-d6) δ 11.08 (s, 1H), 9.17 (s, 1H), 8.48 (d, J = 3.6 Hz, 1H), 8.22 (d, J = 8.1 Hz, 1H), 7.43 – 7.31 (m, 2H), 7.00 (dd, J = 10.0, 7.2 Hz, 1H), 3.40 (s, 3H), 2.36 (s, 3H). 13C NMR (100 MHz, DMSO-d6) δ 156.4, 149.9, 148.8, 147.6, 146.8, 135.1, 133.1, 128.2 (dd, J = 237.4, 13.0 Hz), 123.5, 106.9 (d, J = 19.3 Hz), 99.1 (d, J = 22.9 Hz), 98.1 (d, J = 24.1 Hz), 97.5 (d, J = 23.7 Hz), 28.5, 13.2. MS (ESI): m/z 302.1 [M+1]+. HRMS (ESI): m/z Calcd for (C15H14F2N5) ([M+H]+): 302.1217; found: 302.1207.
(E)-5,6-difluoro-1-methyl-2-(((E)-1-(pyridin-4-yl)ethylidene)hydrazineylidene)-2,3-dihydro-1H-benzo[d]imidazole (6o):
1H NMR (400 MHz, DMSO-d6) δ 11.20 (s, 1H), 8.54 (d, J = 5.8 Hz, 2H), 7.86 (d, J = 5.8 Hz, 2H), 7.40 (dd, J = 10.4, 7.3 Hz, 1H), 7.05 (dd, J = 10.0, 7.2 Hz, 1H), 3.42 (s, 3H), 2.33 (s, 3H). 13C NMR (100 MHz, DMSO-d6) δ 156.6, 149.9, 149.7, 146.7, 145.6 (dd, J = 237, 16 Hz), 129.4, 126.9, 120.2, 106.9 (d, J = 19.4 Hz), 99.1 (d, J = 23.0 Hz), 98.4 (d, J = 22.2 Hz), 97.7 (d, J = 23.9 Hz), 28.6, 12.9. MS (ESI): m/z 302.2 [M+1]+. HRMS (ESI): m/z Calcd for (C15H14F2N5) ([M+H]+): 302.1217; found: 302.1208.
(E)-5,6-difluoro-1-methyl-2-(((E)-1-(pyrimidin-2-yl)ethylidene)hydrazineylidene)-2,3-dihydro-1H-benzo[d]imidazole (6p):
1H NMR (400 MHz, DMSO-d6) δ 11.09 (s, 1H), 8.79 (d, J = 4.7 Hz, 2H), 7.36 (d, J = 8.5 Hz, 2H), 7.11 – 7.00 (m, 1H), 3.42 (s, 3H), 2.41 (s, 3H). 13C NMR (100 MHz, DMSO-d6) δ 164.3, 157.4, 156.6, 152.3, 145.5 (dd, J = 237, 17 Hz), 145.3 (dd, J = 240, 19 Hz), 129.2 (d, J = 10.9 Hz), 127.0 (d, J = 11.0 Hz), 119.9, 98.8 (d, J = 23.6 Hz), 97.7 (d, J = 24.2 Hz), 28.6, 14.1. MS (ESI): m/z 303.1 [M+1]+. HRMS (ESI): m/z Calcd for (C14H13F2N6) ([M+H]+): 303.1170; found: 303.1166.
(E)-5,6-difluoro-1-methyl-2-(((E)-1-(pyrimidin-4-yl)ethylidene)hydrazineylidene)-2,3-dihydro-1H-benzo[d]imidazole (6q):
1H NMR (400 MHz, DMSO-d6) δ 11.47 (s, 1H), 9.12 (s, 1H), 8.71 (d, J = 5.2 Hz, 1H), 8.41 (s, 1H), 7.48 (t, J = 8.8 Hz, 1H), 7.13 (t, J = 8.0 Hz, 1H), 3.49 (s, 3H), 2.36 (s, 3H). 13C NMR (100 MHz, DMSO-d6) δ 163.7, 158.7, 156.9, 155.9, 151.0, 145.6 (td, J = 238, 15 Hz), 127.9 (d, J = 246.2 Hz), 116.6, 98.7 (d, J = 13.3 Hz), 98.2 (dd, J = 16.6, 8.2 Hz), 28.7, 11.8. MS (ESI): m/z 303.2 [M+1]+. HRMS (ESI): m/z Calcd for (C14H13F2N6) ([M+H]+): 303.1170; found: 303.1163.
(E)-5,6-difluoro-1-methyl-2-(((E)-1-(1-methyl-1H-imidazol-4-yl)ethylidene)hydrazineylidene)-2,3-dihydro-1H-benzo[d]imidazole (6r):
1H NMR (400 MHz, DMSO-d6) δ 10.71 (s, 1H), 7.51 (d, J = 11.9 Hz, 2H), 7.25 – 7.18 (m, 1H), 6.91 (s, 1H), 3.65 (s, 3H), 3.32 – 3.29 (m, 3H), 2.23 (s, 3H). 13C NMR (100 MHz, DMSO-d6) δ 154.8, 149.9, 142.3, 137.6 (d, J = 43.6 Hz), 136.6, 130.1 (d, J = 262.9 Hz), 122.9, 117.9, 103.3 (d, J = 19.7 Hz), 97.6, 96.4 (d, J = 23.6 Hz), 33.1, 27.9, 13.4. MS (ESI): m/z 305.2 [M+1]+. HRMS (ESI): m/z Calcd for (C14H15F2N6) ([M+H]+): 305.1326; found: 305.1317.
4-((E)-1-(((E)-5,6-difluoro-1-methyl-1,3-dihydro-2H-benzo[d]imidazol-2-ylidene)hydrazineylidene)ethyl)oxazole (6s):
1H NMR (400 MHz, CD3OD) δ 8.26 (s, 1H), 8.17 (s, 1H), 7.04 (dd, J = 10.1, 7.0 Hz, 1H), 6.98 – 6.88 (m, 1H), 3.43 (s, 3H), 2.26 (s, 3H). 13C NMR (100 MHz, CD3OD) δ 152.2, 147.2, 145.9 (d, J = 223.9 Hz), 144.7, 144.4, 140.5, 137.0, 128.8, 97.9 (d, J = 24.3 Hz), 96.6 (d, J = 24.0 Hz), 27.6, 12.8. MS (ESI): m/z 292.1 [M+1]+. HRMS (ESI): m/z Calcd for (C13H12F2N5O) ([M+H]+): 292.1010; found: 292.1001.
(E)-5,6-difluoro-1-methyl-2-(((E)-1-(thiophen-2-yl)ethylidene)hydrazineylidene)-2,3-dihydro-1H-benzo[d]imidazole (6t):
1H NMR (400 MHz, DMSO-d6) δ 10.64 (s, 1H), 7.45 – 7.39 (m, 1H), 7.28 (t, J = 8.6 Hz, 2H), 7.06 – 6.97 (m, 2H), 3.35 (s, 3H), 2.32 (s, 3H). 13C NMR (100 MHz, DMSO-d6) δ 154.7, 148.7, 145.5, 144.5, 134.3, 130.2, 127.4, 127.3, 126.2, 124.9, 97.4 (dd, J = 77 Hz, 23 Hz), 97.3 (dd, J = 115 Hz, 23 Hz), 28.5, 14.0. MS (ESI): m/z 307.1 [M+1]+. HRMS (ESI): m/z Calcd for (C14H13F2N4S) ([M+H]+): 307.0829; found: 307.0820.
(E)-5,6-difluoro-1-methyl-2-(((E)-1-phenylethylidene)hydrazineylidene)-2,3-dihydro-1H-benzo[d]imidazole (6u):
1H NMR (400 MHz, CDCl3) δ 7.75 (d, J = 6.8 Hz, 2H), 7.34 (d, J = 7.4 Hz, 3H), 6.94 (s, 1H), 6.82 (s, 1H), 3.61 (s, 3H), 2.39 (s, 3H). 13C NMR (100 MHz, CDCl3) δ 154.3, 152.6, 146. 4 (dt, J = 242 Hz, 18.5 Hz), 138.6, 129.2 (dd, J = 100 Hz, 18.5 Hz), 128.6, 128.1, 125.8, 100.94, 96.7 (d, J = 23.6 Hz), 29.8, 13.4. MS (ESI): m/z 301.2 [M+1]+. HRMS (ESI): m/z Calcd for (C16H15F2N4) ([M+H]+): 301.1265; found: 301.1256.
General Procedures for the preparation of (E)-2-((1-(5-fluoropyridin-2-yl)ethylidene)hydrazineylidene)-1,3-dimethyl-2,3-dihydro-1H-benzo[d]imidazole (6v).
To a solution of 6d (50 mg, 0.17 mmol) in DMF (10 mL) was added NaH (8.2 mg, 60% dispersion in mineral oil) at 0 °C. The mixture was stirred for a further 15 minutes at this temperature. Then methyl iodide (12.7 μL, 0.20 mmol) was added and stirring was continued for additional 1 hours. When TLC showed full conversion, the mixture was poured into 10 mL water and the compound was extracted with EtOAc. The organic phase was washed with brine and then dried over MgSO4, filtered, and concentrated under reduced pressure. The residue was purified by flash chromatography to afford compound 6v (36.8 mg, 73%). 1H NMR (400 MHz, CDCl3) δ 8.43 (d, J = 2.8 Hz, 1H), 8.04 (dd, J = 8.9, 4.7 Hz, 1H), 7.36 (td, J = 8.5, 2.9 Hz, 1H), 7.07 (dt, J = 7.3, 3.7 Hz, 2H), 6.96 (dd, J = 5.4, 3.4 Hz, 2H), 3.78 (s, 6H), 2.52 (s, 3H). MS (ESI): m/z 298.0 [M+1]+. HRMS (ESI): m/z Calcd for (C16H17FN5) ([M+H]+): 297.1390; found: 297.1382.
General Procedures for the preparation of compound (8).
To a solution of 1-(5-fluoropyridin-2-yl)ethan-1-one (1.4 g, 10 mmol) in MeOH (20 mL) was added hydrazine hydrate (0.64 ml, 20 mmol) and added acetic acid (5 drop) at room temperature. The mixture was stirred overnight at room temperature. When TLC showed full conversion, the mixture was filtered and the residue was not purified further as a white powder 7 (1.37 g, 91%). 1H NMR (400 MHz, CDCl3) δ 8.37 (d, J = 2.6 Hz, 1H), 7.95 (dd, J = 8.9, 4.6 Hz, 1H), 7.35 (td, J = 8.6, 2.8 Hz, 1H), 5.50 (s, 2H), 2.23 (s, 3H). MS (ESI): m/z 154.0 [M+1]+.
(E)-2-(2-(1-(5-fluoropyridin-2-yl)ethylidene)hydrazineyl)-3-methyl-2,3-dihydrobenzo[d]oxazole (8a):
To a solution of 3-Methylbenzo[d]oxazole-2(3H)-thione (50 mg, 0.30 mmol) in methylene chloride (10 mL) was added TfOMe (50 μL, 0.45 mmol) dropwise at 0 °C. The mixture was stirred for 2 hours at this temperature. Then the reaction solution was concentrated under reduced pressure. The crude residue was dissolved in EtOH (10 mL) and 7 (46.2 mg, 0.3 mmol), triethylamine (65 μL, 0.45 mmol) were added to the mixture. The reaction solution was refluxed for an additional 5 hours. When TLC showed full conversion, the mixture was cooled to room temperature and concentrated under reduced pressure. The residue was purified by flash chromatography to afford compound 8a (44.6 mg, 52%). 1H NMR (400 MHz, CDCl3) δ 8.44 (d, J = 2.8 Hz, 1H), 8.27 (dd, J = 8.9, 4.7 Hz, 1H), 7.41 (td, J = 8.5, 2.8 Hz, 1H), 7.23 (s, 1H), 7.16 (t, J = 7.7 Hz, 1H), 7.02 (t, J = 7.7 Hz, 1H), 6.93 (d, J = 7.7 Hz, 1H), 3.48 (s, 3H), 2.55 (s, 3H). 13C NMR (100 MHz, DMSO-d6) δ 159.6 (d, J = 255.0 Hz), 158.0, 156.3, 153.4 (d, J = 3.6 Hz), 145.2, 136.6 (d, J = 23.6 Hz), 133.2, 124.7, 122.6, 122.0 (d, J = 4.8 Hz), 121.7, 109.7, 108.8, 29.1, 13.1. MS (ESI): m/z 285.1 [M+1]+. HRMS (ESI): m/z Calcd for (C15H14FN4O) ([M+H]+): 285.1152; found: 285.1145.
(E)-2-(2-(1-(5-fluoropyridin-2-yl)ethylidene)hydrazineyl)-3-methyl-2,3-dihydrobenzo[d]thiazole (8b):
The title compound was obtained starting from 7 and 3-Methylbenzo[d]thiazole-2(3H)-thione (51 mg, 61%). 1H NMR (400 MHz, CDCl3) δ 8.44 (d, J = 2.8 Hz, 1H), 8.27 (dd, J = 8.9, 4.7 Hz, 1H), 7.41 (td, J = 8.5, 2.8 Hz, 1H), 7.23 (s, 1H), 7.16 (t, J = 7.7 Hz, 1H), 7.02 (t, J = 7.7 Hz, 1H), 6.93 (d, J = 7.7 Hz, 1H), 3.48 (s, 3H), 2.55 (s, 3H). 13C NMR (100 MHz, DMSO-d6) δ 167.5, 159.7 (d, J = 255.4 Hz), 156.7, 152.8 (d, J = 3.6 Hz), 141.3, 136.8 (d, J = 23.7 Hz), 126.9, 124.2, 124.0, 122.8, 122.3, 121.9 (d, J = 4.8 Hz), 110.7, 31.5, 13.8. MS (ESI): m/z 301.1 [M+1]+. HRMS (ESI): m/z Calcd for (C15H14FN4S) ([M+H]+): 301.0923; found: 301.0916.
General Procedures for the preparation of (E)-1-(pyridin-2-yl)ethan-1-one O-(1-methyl-1H-benzo[d]imidazol-2-yl) oxime (10).
To a solution of 1-(pyridin-2-yl)ethan-1-one (1.2 g, 10 mmol) in MeOH (20 mL) was added hydroxylamine hydrochloride (1.4 g, 20 mmol) at room temperature. The mixture was stirred overnight at room temperature. When TLC showed full conversion, the mixture was filtered and the residue was not purified further as a white powder (1.19 g, 88%). MS (ESI): m/z 137.0 [M+1]+.
To a solution of 9 (200 mg, 1.4 mmol) in DMF (10 mL) was added NaH (88 mg, 60% dispersion in mineral oil) at 0 °C. The mixture was stirred for a further 15 minutes at this temperature. Then 4a (116 mg, 0.70 mmol) was added and stirring was continued for an additional 10 hours at 100 °C. When TLC showed full conversion, the mixture was poured into 10 mL water and the compound was extracted with EtOAc. The organic phase was washed with brine and then dried over MgSO4, filtered, and concentrated under reduced pressure. The residue was purified by flash chromatography to afford compound 10 (57.7 mg, 31%). 1H NMR (400 MHz, DMSO-d6) δ 8.60 – 8.52 (m, 1H), 8.10 (d, J = 8.0 Hz, 1H), 7.80 (t, J = 7.7 Hz, 1H), 7.59 (d, J = 7.8 Hz, 1H), 7.38 – 7.32 (m, 1H), 7.29 (t, J = 8.0 Hz, 2H), 7.07 (t, J = 7.1 Hz, 1H), 3.59 (s, 3H), 2.46 (s, 3H). 13C NMR (100 MHz, DMSO-d6) δ 167.4, 157.8, 156.1, 149.1, 141.3, 136.7, 126.9, 124.1, 122.8, 122.3, 120.3, 110.6, 31.5, 13.8. MS (ESI): m/z 267.1 [M+1]+. HRMS (ESI): m/z Calcd for (C15H15N4O) ([M+H]+): 267.1246; found: 267.1239.
General Procedures for the preparation of N’-(1-methyl-1H-benzo[d]imidazol-2-yl)picolinohydrazide (11).
picolinic acid (100 mg, 0.81 mmol), HATU (370 mg, 0.97 mmol) and triethylamine (0.7 mL, 4.85 mmol) were dissolved in methylene chloride (20 mL). The solution was then added 5a (131 mg, 0.81 mmol) and the mixture was stirred at room temperature for 2 hours. Then mixture was concentrated under reduced pressure. The residue was purified by flash chromatography to afford compound 11 (171 mg, 79%). 1H NMR (400 MHz, DMSO-d6) δ 10.63 (s, 1H), 9.06 (s, 1H), 8.68 (s, 1H), 8.01 (d, J = 7.8 Hz, 2H), 7.62 (s, 1H), 7.20 (s, 2H), 6.96 (s, 2H), 3.59 (s, 3H). 13C NMR (100 MHz, DMSO-d6) δ 154.8, 149.0, 138.2, 127.3, 122.7, 120.9, 119.7, 108.2, 29.1. MS (ESI): m/z 268.1 [M+1]+. HRMS (ESI): m/z Calcd for (C14H14N5O) ([M+H]+): 268.1198; found: 268.1190.
General Procedures for the preparation of 1-(1-methyl-1H-benzo[d]imidazol-2-yl)-3-(pyridin-2-yl)-1H-pyrazol-5-ol (12).
To a solution of 5a (50 mg, 0.31 mmol) in EtOH (10 mL) was added ethyl 3-oxo-3-(pyridin-2-yl)propanoate (65 mg, 0.34 mmol). The mixture was refluxed for 10 hours. When TLC showed full conversion, the mixture was concentrated under reduced pressure. The residue was purified by flash chromatography to afford compound 12 (66 mg, 73%). %). 1H NMR (400 MHz, DMSO-d6) δ 8.60 (s, 1H), 7.95 (d, J = 7.1 Hz, 1H), 7.83 (s, 1H), 7.66 (dd, J = 19.1, 7.2 Hz, 2H), 7.43 – 7.23 (m, 3H), 6.14 (s, 1H), 3.76 (s, 3H). 13C NMR (100 MHz, DMSO-d6) δ 153.4, 151.7, 149.7, 143.9, 140.3, 137.3, 134.9, 123.9, 123.7, 123.0, 119.7, 119.6, 111.2, 85.4, 30.9. MS (ESI): m/z 292.1 [M+1]+. HRMS (ESI): m/z Calcd for (C16H14N5O) ([M+H]+): 292.1198; found: 292.1190.
Metabolic stability in human liver microsomes.
Mix the 210 uL of Phosphate buffer (100 mM) and 12.5 uL of Microsomes (20 mg/ml) with 25 uL of NADPH (10 mM) or 25 μL of 100 mM Phosphate buffer. The final concentration of microsomes was 1 mg/mL. The mixture was pre-warmed at 37°C for 10 minutes.
The reaction was started with the addition of 2.5 μL of 100 μM control compound or test compound solutions. Verapamil was used as positive control in this study. The final concentration of control compound and test compounds were 1 μM. The incubation solution was incubated in water batch at 37°C.
For samples with NADPH, aliquots of 25 μL were taken from the reaction solution at 0, 5, 10, 20 and 30 minutes. For samples without NADPH, aliquots of 25 μL were taken from the reaction solution at 0 and 30 minutes. The reaction was stopped by the addition of 5 volumes of cold acetonitrile with IS (100 nM alprazolam, 200 nM caffeine and 100 nM tolbutamide). Samples were centrifuged at 3,220 g for 30 minutes. Aliquot of 100 μL of the supernatant was mixed with 100 μL of ultra-pure H2O and then used for LC-MS/MS analysis. All calculations were carried out using GraphPad Prism 7.00.
Pharmacokinetics assay.
For IV injection, drug (Formulation: 0.5 mg/mL in cosolvent which content 20% of DMSO, 16% of PEG, 4% of Dextrose in PBS; Dosing: 1 mg/kg) were injected into ICR male mice (n = 3, 6-weeks, the Jackson laboratory). 10 μL of blood was collected via the tail vein at 2, 5, 15, 30 min, and 1, 2, 4, 8, 24 and 48 h.
The desired serial concentrations of working solutions were achieved by diluting stock solution of analyte with 100% acetonitrile solution. 5 μL of working solutions (1, 2, 4, 10, 20, 100, 200, 1000, 2000 ng/mL) were added to 10 μL of the blank ICR mouse plasma to achieve calibration standards of 0.5~1000 ng/mL ( 0.5, 1, 2, 5, 10, 50, 100, 500, 1000 ng/mL) in a total volume of 15 μL. Four quality control samples at 1 ng/mL, 2 ng/mL, 50 ng/mL and 800 ng/mL for plasma were prepared independently of those used for the calibration curves. These QC samples were prepared on the day of analysis in the same way as calibration standards.
15 μL standards and 15 μL QC samples and 15 μL unknown samples(10 μL plasma with 5 μL blank solution)were added to 200 μL of acetonitrile containing IS mixture for precipitating protein respectively. Then the samples were vortexed for 30 s. After centrifugation at 4°C, 3900 rpm for 15 min, the supernatant was diluted 3 times with MeCN. 5 μL of supernatant was injected into the LC/MS/MS system for quantitative analysis.
The pharmacokinetic parameters of drug were analyzed using PK Solver Excel® Add-in. The PK trace was fitted into a non-compartmental extravascular model.
For oral gavage, drug (Formulation: 1 mg/mL in cosolvent which content 20% of DMSO, 16% of PEG, 4% of Dextrose in PBS; Dosing: 10 mg/kg) was administered ICR male mice (n=3) via oral gavage. 10 μL of blood was collected via the tail vein at 15, 30 min, and 1, 2, 4, 8, 24 and 48 h. The calibration and quantification of drug is the same as described above for i.v. administration. The pharmacokinetic parameters were also analyzed using the PK Solver Excel® Add-in. The PK trace was fitted into a non-compartmental extravascular model.
Measurement of physical interactions between drugs and SRC-3 by pull-down assay.
Recombinant His-SRC-3-flag and His-p300 proteins were expressed in baculovirus and purified via affinity purifications as described previously.24,43 Different concentrations of drug or vehicle control were incubated with 0.1 μg of purified recombinant SRC-3 protein for 30 minutes on ice. The reaction mixture was then incubated with 0.1 μg of recombinant ERα and p300 proteins, and an ERE containing DNA oligo in the presence of 1 μM 17-β estradiol for 1 hour on ice. The total reaction volume is 20 μL. The ER-associated proteins were then co-immunoprecipitated using an anti-ER alpha-specific antibody (Santa Cruz #sc-8002) followed by western blot analysis.
Cell culture.
Breast cancer cell lines MCF-7, MDA-MB-468, BT-20, BT-474, SUM-159PT were obtained from ATCC. LM3–3 cell line was isolated from a lung metastasis which is derived from an MDA-MB-231-LM2 xenograft tumor in the mammary fat pad of a SCID mouse. MCF-7, LM3–3, BT-20 and BT-474 cell lines were grown in DMEM medium supplemented with 10% FBS. MDA-MB-468 was grown in RPMI 1640 supplemented with 5% FBS. SUM159PT was grown in Ham’s F-12 medium plus 5% FBS, 5ug/mL of insulin, and 1ug/mL of hydrocortisone. All cell lines were maintained in a humidified incubator filled with 5% CO2 at 37°C. Primary hepatocytes were isolated from an adult female CD-1 mouse through collagenase perfusion as described previously and maintained in M199 medium with 10% FBS.
Cell Cytotoxicity Assays.
Breast cancer cells (4000 to 7000 cells per well) were seeded into 96-well plates containing 100 uL of medium supplemented with 10% FBS. On the next day, when cells reached 70% to 80% confluence, 6b was added to achieve a series of titrations (0.2, 0.5, 1, 2, 5, 10, 20, 50, 100, 500 and 1000 nM). After 72 hours of drug treatment, cell viability was measured by MTT assay. For statistical significance, 6 parallel repeats were tested in each drug titration. Relative cell viabilities, referred to untreated control cells, were plotted using Graphpad Prism. The IC50 values, reflecting drug cytotoxicity, were calculated, based on a Hill-Slope model.
Wash-out experiment in MDA-MB-468 cell line.
MDA-MB-468 cells were treated with drug for different time, followed by washing off the drug with PBS, then extend the incubation time to a total of 72 h. Cell viability was measured using MTT assays.
Inhibition assay of drug in PDX organoids.
Tumors were isolated from SCID mice and digested with collagenase I and III to obtain single cells. 20000 cells were re-suspended in 40ul of collagen gel and medium and seeded to 24-well plate. After incubation of plate at 37°C for 20 minutes, culture medium was added to each well and cells were continued to culture overnight at 37°C with 5% CO2. SI-12 was applied at the indicated concentration and vehicle treated group served as the control. For each treatment dosage, at least 5 wells were included. Cells were cultured for 14 days. Images of organoids were taken at day 14 and organoid number was counted. Student t test was applied to compare the difference of organoid number between treated and untreated groups.
Therapeutic efficacy of drug in an orthotopic Panc-1 mouse model.
To establish an orthotopic PDAC model, Panc-1-Luc cells (0.5×10⁶ cells per mouse) were orthotopically implanted in pancreas in SCID mice (male, 8-weeks, the Jackson laboratory). The mice were randomized into two groups based on luciferase imaging (n=5 per group). At day 8 after tumor inoculation, mice were treated with drugs (10 mg/kg) or the solvent vehicle every day. Tumor volumes were measured once per week by luciferase live imaging. The mice body weight were measured every week. At day 63, the mice were euthanized, and tumors were harvested. Tumor lengths and widths were measured once per week. Tumor sizes were calculated by: length × width × width/2. The mice body weight were measured every week.
Therapeutic efficacy of drug in a LNCaP xenograft mouse model.
LNCaP cells (1×10⁷ cells per mouse) were implanted into on both side under the back skin of male SCID mice (8-weeks, the Jackson laboratory). After 4 weeks after tumor inoculation, mice (n = 14 per group) were treated with drugs (10 mg/kg) or the solvent vehicle every day. Tumor lengths and widths were measured once per week. Tumor sizes were calculated by: length × width × width/2. Mice were euthanized day when total tumor size reached more than 3 cm in diameter.
Therapeutic efficacy of drug in an Intra-femoral bone metastasis mice model.
Prostate cancer bone metastasis model was established and used for testing by intra-femoral artery injection of AR- PDX tumor cells 118b established from metastatic prostate cancer. Briefly, 1 × 10⁵ of PDX tumor cells were injected through the intra-femoral artery into male SCID mice at 8–9 weeks of age (the Jackson laboratory). Two weeks after injection, mice were divided into three groups (n = 9 per group) and treated with either vehicle or 10 mg/kg/day of drugs for 4 weeks. Metastatic growth was monitored bi-weekly by x-ray imaging. At the end of treatment, intra-femoral bone tissues with tumor were collected. CT images were taken with 5 mouse femur tissues from each treatment group and tumor size was calculated according to 3D reconstruction of mouse femur.
Computation Method.
All density functional theory (DFT) calculations were carried out with Gaussian 16 software.44 Geometry optimizations and vibrational frequency calculations were performed using the M06–2X functional in gas phase with the 6–311g (d,p) basis set. The single-point energy calculations were performed using M06–2X functional in H2O or DMSO with the Def2-TZVP basis set and the PCM solvation model.
Supplementary Material
ACKNOWLEDGMENT
This work was supported by funding from the National Institutes of Health (HD08818 and HD07857) to BWO and (R01-CA207701 and R01-CA250503) to JW and the Adrienne Helis Malvin Foundation to DML.
ABBREVIATIONS
- 2D NMR
two-dimensional nuclear magnetic resonance spectroscopy
- AcOH
Acetic acid
- cryo-EM
cryogenic electron microscopy
- DCM
dichloromethane
- DIPEA
N,N-Diisopropylethylamine
- DMF
N,N-Dimethylformamide
- EtOH
ethanol
- FA
formic acid
- GO
Gene Ontology
- HATU
2-(7-Aza-1H-benzotriazole-1-yl)-1,1,3,3-tetraMethyluroniuM hexafluorophosphate
- IHC
immunohistochemistry
- IV
intravenous
- MeI
Iodomethane
- MeOH
methanol
- MTT
2-(7-Aza-1H-benzotriazole-1-yl)-1,1,3,3-tetraMethyluroniuM hexafluorophosphate
- NADPH
nicotinamide adenine dinucleotide phosphate
- NaH
sodium hydride
- PD
pharmacodynamics
- PK
pharmacokinetics
- POCl3
phosphorus oxychloride
- RT
room temperature
- TEA
trimethylamine
- TfOMe
methyl trifluoromethanesulfonate
Footnotes
D.M.L., and B.W.O. are cofounders of Coregen Inc. J.W. is cofounder of Chemical Biology Probes LLC. BWO, JW and DML all hold stock in CoRegen, Inc. that has licensed intellectual properties associated with SRC-3 inhibitors from Baylor College of Medicine.
ASSOCIATED CONTENT
Supporting Information
Supporting Information is available free of charge via the Internet at http://pubs.acs.org.
Figure S1-S5, Table S1-S3, spectra and purity (PDF)
Molecular formula strings (CSV).
CCDC 2287362 contains the supplementary crystallographic data for this paper. The data can be obtained free of charge via www.ccdc.cam.ac.uk
Research involving animals was performed in accordance with institutional guidelines as defined by Institutional Animal Care and Use Committee.
REFERENCES
- (1).Lonard DM; O’Malley BW Nuclear Receptor Coregulators: Modulators of Pathology and Therapeutic Targets. Nat Rev Endocrinol 2012, 8 (10), 598–604. 10.1038/nrendo.2012.100. [DOI] [PMC free article] [PubMed] [Google Scholar]
- (2).Lonard DM; O’Malley BW The Expanding Cosmos of Nuclear Receptor Coactivators. Cell 2006, 125 (3), 411–414. 10.1016/j.cell.2006.04.021. [DOI] [PubMed] [Google Scholar]
- (3).Bulynko YA; O’Malley BW Nuclear Receptor Coactivators: Structural and Functional Biochemistry. Biochemistry 2011, 50 (3), 313–328. 10.1021/bi101762x. [DOI] [PMC free article] [PubMed] [Google Scholar]
- (4).Hoberg JE; Popko AE; Ramsey CS; Mayo MW IκB Kinase α-Mediated Derepression of SMRT Potentiates Acetylation of RelA/P65 by P300. Mol Cell Biol 2006, 26 (2), 457–471. 10.1128/MCB.26.2.457-471.2006. [DOI] [PMC free article] [PubMed] [Google Scholar]
- (5).Arimura A; van Peer M; Schröder AJ; Rothman PB The Transcriptional Co-Activator p/CIP (NCoA-3) Is Up-Regulated by STAT6 and Serves as a Positive Regulator of Transcriptional Activation by STAT6. Journal of Biological Chemistry 2004, 279 (30), 31105–31112. 10.1074/jbc.M404428200. [DOI] [PubMed] [Google Scholar]
- (6).Wang L; Lonard DM; O’Malley BW The Role of Steroid Receptor Coactivators in Hormone Dependent Cancers and Their Potential as Therapeutic Targets. HORM CANC 2016, 7 (4), 229–235. 10.1007/s12672-016-0261-6. [DOI] [PMC free article] [PubMed] [Google Scholar]
- (7).Xu J; Wu R-C; O’Malley BW Normal and Cancer-Related Functions of the P160 Steroid Receptor Co-Activator (SRC) Family. Nat Rev Cancer 2009, 9 (9), 615–630. 10.1038/nrc2695. [DOI] [PMC free article] [PubMed] [Google Scholar]
- (8).Dasgupta S; Lonard DM; O’Malley BW Nuclear Receptor Coactivators: Master Regulators of Human Health and Disease. Annu. Rev. Med. 2014, 65 (1), 279–292. 10.1146/annurev-med-051812-145316. [DOI] [PMC free article] [PubMed] [Google Scholar]
- (9).Lonard DM; Kumar R; O’Malley BW Minireview: The SRC Family of Coactivators: An Entrée to Understanding a Subset of Polygenic Diseases? Molecular Endocrinology 2010, 24 (2), 279–285. 10.1210/me.2009-0276. [DOI] [PMC free article] [PubMed] [Google Scholar]
- (10).Li L; Deng C-X; Chen Q SRC-3, a Steroid Receptor Coactivator: Implication in Cancer. IJMS 2021, 22 (9), 4760. 10.3390/ijms22094760. [DOI] [PMC free article] [PubMed] [Google Scholar]
- (11).Seifert L; Miller G Molecular Pathways: The Necrosome—A Target for Cancer Therapy. Clin Cancer Res 2017, 23 (5), 1132–1136. 10.1158/1078-0432.CCR-16-0968. [DOI] [PMC free article] [PubMed] [Google Scholar]
- (12).Ma G; Ren Y; Wang K; He J SRC-3 Has a Role in Cancer Other Than as a Nuclear Receptor Coactivator. Int. J. Biol. Sci. 2011, 7 (5), 664–672. 10.7150/ijbs.7.664. [DOI] [PMC free article] [PubMed] [Google Scholar]
- (13).Wang H; Zhang D; Wu W; Zhang J; Guo D; Wang Q; Jing T; Xu C; Bian X; Yang K Overexpression and Gender-Specific Differences of SRC-3 (SRC-3/AIB1) Immunoreactivity in Human Non-Small Cell Lung Cancer: An In Vivo Study. J Histochem Cytochem. 2010, 58 (12), 1121–1127. 10.1369/jhc.2010.956979. [DOI] [PMC free article] [PubMed] [Google Scholar]
- (14).Xu J; Liao L; Ning G; Yoshida-Komiya H; Deng C; O’Malley BW The Steroid Receptor Coactivator SRC-3 (p/CIP/RAC3/AIB1/ACTR/TRAM-1) Is Required for Normal Growth, Puberty, Female Reproductive Function, and Mammary Gland Development. Proc. Natl. Acad. Sci. U.S.A. 2000, 97 (12), 6379–6384. 10.1073/pnas.120166297. [DOI] [PMC free article] [PubMed] [Google Scholar]
- (15).Song X; Chen H; Zhang C; Yu Y; Chen Z; Liang H; Van Buren G; McElhany AL; Fisher WE; Lonard DM; O’Malley BW; Wang J SRC-3 Inhibition Blocks Tumor Growth of Pancreatic Ductal Adenocarcinoma. Cancer Letters 2019, 442, 310–319. 10.1016/j.canlet.2018.11.012. [DOI] [PMC free article] [PubMed] [Google Scholar]
- (16).Nikolai BC; Lanz RB; York B; Dasgupta S; Mitsiades N; Creighton CJ; Tsimelzon A; Hilsenbeck SG; Lonard DM; Smith CL; O’Malley BW HER2 Signaling Drives DNA Anabolism and Proliferation through SRC-3 Phosphorylation and E2F1-Regulated Genes. Cancer Research 2016, 76 (6), 1463–1475. 10.1158/0008-5472.CAN-15-2383. [DOI] [PMC free article] [PubMed] [Google Scholar]
- (17).Gojis O; Rudraraju B; Gudi M; Hogben K; Sousha S; Coombes CR; Cleator S; Palmieri C The Role of SRC-3 in Human Breast Cancer. Nat Rev Clin Oncol 2010, 7 (2), 83–89. 10.1038/nrclinonc.2009.219. [DOI] [PubMed] [Google Scholar]
- (18).Torres-Arzayus MI; de Mora JF; Yuan J; Vazquez F; Bronson R; Rue M; Sellers WR; Brown M High Tumor Incidence and Activation of the PI3K/AKT Pathway in Transgenic Mice Define AIB1 as an Oncogene. Cancer Cell 2004, 6 (3), 263–274. 10.1016/j.ccr.2004.06.027. [DOI] [PubMed] [Google Scholar]
- (19).Lydon JP; O’Malley BW Minireview: Steroid Receptor Coactivator-3: A Multifarious Coregulator in Mammary Gland Metastasis. Endocrinology 2011, 152 (1), 19–25. 10.1210/en.2010-1012. [DOI] [PMC free article] [PubMed] [Google Scholar]
- (20).Long W; Foulds CE; Qin J; Liu J; Ding C; Lonard DM; Solis LM; Wistuba II; Qin J; Tsai SY; Tsai M-J; O’Malley BW ERK3 Signals through SRC-3 Coactivator to Promote Human Lung Cancer Cell Invasion. J. Clin. Invest. 2012, 122 (5), 1869–1880. 10.1172/JCI61492. [DOI] [PMC free article] [PubMed] [Google Scholar]
- (21).Qin L; Liao L; Redmond A; Young L; Yuan Y; Chen H; O’Malley BW; Xu J The AIB1 Oncogene Promotes Breast Cancer Metastasis by Activation of PEA3-Mediated Matrix Metalloproteinase 2 (MMP2) and MMP9 Expression. Mol Cell Biol 2008, 28 (19), 5937–5950. 10.1128/MCB.00579-08. [DOI] [PMC free article] [PubMed] [Google Scholar]
- (22).Fereshteh MP; Tilli MT; Kim SE; Xu J; O’Malley BW; Wellstein A; Furth PA; Riegel AT The Nuclear Receptor Coactivator Amplified in Breast Cancer-1 Is Required for Neu (ErbB2/HER2) Activation, Signaling, and Mammary Tumorigenesis in Mice. Cancer Research 2008, 68 (10), 3697–3706. 10.1158/0008-5472.CAN-07-6702. [DOI] [PMC free article] [PubMed] [Google Scholar]
- (23).Nikolai BC; Jain P; Cardenas DL; York B; Feng Q; McKenna NJ; Dasgupta S; Lonard DM; O’Malley BW Steroid Receptor Coactivator 3 (SRC-3/AIB1) Is Enriched and Functional in Mouse and Human Tregs. Sci Rep 2021, 11 (1), 3441. 10.1038/s41598-021-82945-3. [DOI] [PMC free article] [PubMed] [Google Scholar]
- (24).Yi P; Wang Z; Feng Q; Pintilie GD; Foulds CE; Lanz RB; Ludtke SJ; Schmid MF; Chiu W; O’Malley BW Structure of a Biologically Active Estrogen Receptor-Coactivator Complex on DNA. Molecular Cell 2015, 57 (6), 1047–1058. 10.1016/j.molcel.2015.01.025. [DOI] [PMC free article] [PubMed] [Google Scholar]
- (25).Yu X; Yi P; Hamilton RA; Shen H; Chen M; Foulds CE; Mancini MA; Ludtke SJ; Wang Z; O’Malley BW Structural Insights of Transcriptionally Active, Full-Length Androgen Receptor Coactivator Complexes. Molecular Cell 2020, 79 (5), 812–823.e4. 10.1016/j.molcel.2020.06.031. [DOI] [PMC free article] [PubMed] [Google Scholar]
- (26).Yan F; Yu Y; Chow D-C; Palzkill T; Madoux F; Hodder P; Chase P; Griffin PR; O’Malley BW; Lonard DM Identification of Verrucarin A as a Potent and Selective Steroid Receptor Coactivator-3 Small Molecule Inhibitor. PLoS ONE 2014, 9 (4), e95243. 10.1371/journal.pone.0095243. [DOI] [PMC free article] [PubMed] [Google Scholar]
- (27).Wang Y; Lonard DM; Yu Y; Chow D-C; Palzkill TG; Wang J; Qi R; Matzuk AJ; Song X; Madoux F; Hodder P; Chase P; Griffin PR; Zhou S; Liao L; Xu J; O’Malley BW Bufalin Is a Potent Small-Molecule Inhibitor of the Steroid Receptor Coactivators SRC-3 and SRC-1. Cancer Research 2014, 74 (5), 1506–1517. 10.1158/0008-5472.CAN-13-2939. [DOI] [PMC free article] [PubMed] [Google Scholar]
- (28).Wang Y; Lonard DM; Yu Y; Chow D-C; Palzkill TG; O’Malley BW Small Molecule Inhibition of the Steroid Receptor Coactivators, SRC-3 and SRC-1. Molecular Endocrinology 2011, 25 (12), 2041–2053. 10.1210/me.2011-1222. [DOI] [PMC free article] [PubMed] [Google Scholar]
- (29).Song X; Chen J; Zhao M; Zhang C; Yu Y; Lonard DM; Chow D-C; Palzkill T; Xu J; O’Malley BW; Wang J Development of Potent Small-Molecule Inhibitors to Drug the Undruggable Steroid Receptor Coactivator-3. Proc. Natl. Acad. Sci. U.S.A. 2016, 113 (18), 4970–4975. 10.1073/pnas.1604274113. [DOI] [PMC free article] [PubMed] [Google Scholar]
- (30).Qin L; Chen J; Lu D; Jain P; Yu Y; Cardenas D; Peng X; Yu X; Xu J; Wang J; O’Malley BW; Lonard DM Development of Improved SRC-3 Inhibitors as Breast Cancer Therapeutic Agents. Endocrine-Related Cancer 2021, 28 (10), 657–670. 10.1530/ERC-20-0402. [DOI] [PMC free article] [PubMed] [Google Scholar]
- (31).Rohira AD; Yan F; Wang L; Wang J; Zhou S; Lu A; Yu Y; Xu J; Lonard DM; O’Malley BW Targeting SRC Coactivators Blocks the Tumor-Initiating Capacity of Cancer Stem-like Cells. Cancer Research 2017, 77 (16), 4293–4304. 10.1158/0008-5472.CAN-16-2982. [DOI] [PMC free article] [PubMed] [Google Scholar]
- (32).Gilad Y; Eliaz Y; Yu Y; Dean AM; Han SJ; Qin L; O’Malley BW; Lonard DM A Genome-Scale CRISPR Cas9 Dropout Screen Identifies Synthetically Lethal Targets in SRC-3 Inhibited Cancer Cells. Commun Biol 2021, 4 (1), 399. 10.1038/s42003-021-01929-1. [DOI] [PMC free article] [PubMed] [Google Scholar]
- (33).Urick ME; Bell DW In Vitro Effects of FBXW7 Mutation in Serous Endometrial Cancer: Increased Levels of Potentially Druggable Proteins and Sensitivity to SI-2 and Dinaciclib. Molecular Carcinogenesis 2018, 57 (11), 1445–1457. 10.1002/mc.22867. [DOI] [PMC free article] [PubMed] [Google Scholar]
- (34).Song X; Zhang C; Zhao M; Chen H; Liu X; Chen J; Lonard DM; Qin L; Xu J; Wang X; Li F; O’Malley BW; Wang J Steroid Receptor Coactivator-3 (SRC-3/AIB1) as a Novel Therapeutic Target in Triple Negative Breast Cancer and Its Inhibition with a Phospho-Bufalin Prodrug. PLoS ONE 2015, 10 (10), e0140011. 10.1371/journal.pone.0140011. [DOI] [PMC free article] [PubMed] [Google Scholar]
- (35).Liu J; Xie Y; Guo J; Li X; Wang J; Jiang H; Peng Z; Wang J; Wang S; Li Q; Ye L; Zhong Y; Zhang Q; Liu X; Lonard DM; Wang J; O’Malley BW; Liu Z Targeting NSD2-Mediated SRC-3 Liquid–Liquid Phase Separation Sensitizes Bortezomib Treatment in Multiple Myeloma. Nat Commun 2021, 12 (1), 1022. 10.1038/s41467-021-21386-y. [DOI] [PMC free article] [PubMed] [Google Scholar]
- (36).Fritch PC; McNaughton-Smith G; Amato GS; Burns JF; Eargle CW; Roeloffs R; Harrison W; Jones L; Wickenden AD Novel KCNQ2/Q3 Agonists as Potential Therapeutics for Epilepsy and Neuropathic Pain. J. Med. Chem. 2010, 53 (2), 887–896. 10.1021/jm901497b. [DOI] [PubMed] [Google Scholar]
- (37).Johnson BM; Shu Y-Z; Zhuo X; Meanwell NA Metabolic and Pharmaceutical Aspects of Fluorinated Compounds. J. Med. Chem. 2020, 63 (12), 6315–6386. 10.1021/acs.jmedchem.9b01877. [DOI] [PubMed] [Google Scholar]
- (38).Bowes J; Brown AJ; Hamon J; Jarolimek W; Sridhar A; Waldron G; Whitebread S Reducing Safety-Related Drug Attrition: The Use of in Vitro Pharmacological Profiling. Nat Rev Drug Discov 2012, 11 (12), 909–922. 10.1038/nrd3845. [DOI] [PubMed] [Google Scholar]
- (39).Bowlby MR; Peri R; Zhang H; Dunlop J hERG (KCNH2 or Kv11.1) K+ Channels: Screening for Cardiac Arrhythmia Risk. Curr Drug Metab 2008, 9 (9), 965–970. [DOI] [PubMed] [Google Scholar]
- (40).Chen X-L; Kang J; Rampe D Manual Whole-Cell Patch-Clamping of the HERG Cardiac K+ Channel. In Drug Safety Evaluation; Gautier J-C., Ed.; Methods in Molecular Biology; Humana Press: Totowa, NJ, 2011; Vol. 691, pp 151–163. 10.1007/978-1-60761-849-2_9. [DOI] [PubMed] [Google Scholar]
- (41).Huang L; Bockorny B; Paul I; Akshinthala D; Frappart P-O; Gandarilla O; Bose A; Sanchez-Gonzalez V; Rouse EE; Lehoux SD; Pandell N; Lim CM; Clohessy JG; Grossman J; Gonzalez R; Del Pino SP; Daaboul G; Sawhney MS; Freedman SD; Kleger A; Cummings RD; Emili A; Muthuswamy LB; Hidalgo M; Muthuswamy SK PDX-Derived Organoids Model in Vivo Drug Response and Secrete Biomarkers. JCI Insight 2020, 5 (21), e135544. 10.1172/jci.insight.135544. [DOI] [PMC free article] [PubMed] [Google Scholar]
- (42).Li ZG; Mathew P; Yang J; Starbuck MW; Zurita AJ; Liu J; Sikes C; Multani AS; Efstathiou E; Lopez A; Wang J; Fanning TV; Prieto VG; Kundra V; Vazquez ES; Troncoso P; Raymond AK; Logothetis CJ; Lin S-H; Maity S; Navone NM Androgen Receptor–Negative Human Prostate Cancer Cells Induce Osteogenesis in Mice through FGF9-Mediated Mechanisms. J. Clin. Invest. 2008, JCI33093. 10.1172/JCI33093. [DOI] [PMC free article] [PubMed] [Google Scholar]
- (43).Yi P; Wang Z; Feng Q; Chou C-K; Pintilie GD; Shen H; Foulds CE; Fan G; Serysheva I; Ludtke SJ; Schmid MF; Hung M-C; Chiu W; O’Malley BW Structural and Functional Impacts of ER Coactivator Sequential Recruitment. Molecular Cell 2017, 67 (5), 733–743.e4. 10.1016/j.molcel.2017.07.026. [DOI] [PMC free article] [PubMed] [Google Scholar]
- (44).Gaussian 16, Revision C.01, Frisch MJ, Trucks GW, Schlegel HB, Scuseria GE, Robb MA, Cheeseman JR, Scalmani G, Barone V, Petersson GA, Nakatsuji H, Li X, Caricato M, Marenich AV, Bloino J, Janesko BG, Gomperts R, Mennucci B, Hratchian HP, Ortiz JV, Izmaylov AF, Sonnenberg JL, Williams-Young D, Ding F, Lipparini F, Egidi F, Goings J, Peng B, Petrone A, Henderson T, Ranasinghe D, Zakrzewski VG, Gao J, Rega N, Zheng G, Liang W, Hada M, Ehara M, Toyota K, Fukuda R, Hasegawa J, Ishida M, Nakajima T, Honda Y, Kitao O, Nakai H, Vreven T, Throssell K, Montgomery JA Jr., Peralta JE, Ogliaro F, Bearpark MJ, Heyd JJ, Brothers EN, Kudin KN, Staroverov VN, Keith TA, Kobayashi R, Normand J, Raghavachari K, Rendell AP, Burant JC, Iyengar SS, Tomasi J, Cossi M, Millam JM, Klene M, Adamo C, Cammi R, Ochterski JW, Martin RL, Morokuma K, Farkas O, Foresman JB, and Fox DJ, Gaussian, Inc., Wallingford CT, 2016. [Google Scholar]
Associated Data
This section collects any data citations, data availability statements, or supplementary materials included in this article.


