

Abstract
The relationship between animal dispersal and conspecific density has been explored in various study systems but results in terms of both the magnitude and the direction of density dependence are inconsistent. We conducted a thorough review of the literature (2000–2023) and found k = 97 empirical studies of birds, fishes, herpetofauna (amphibians and reptiles), invertebrates, or mammals that had tested for a correlation between conspecific density and animal dispersal. We extracted categorical variables for taxonomic group, sex, age, migratory behavior, study design, dispersal metric, density metric and variable type, as well as temporal and spatial scale, to test each of their correlation with the effect of density on dispersal (Pearson’s r) using linear regressions and multilevel mixed-effect modelling. We found certain biases in the published literature, highlighting that the impact of conspecific density on dispersal is not as widespread as it is thought to be. We also found no predominant trend for density-dependent dispersal across taxonomic groups. Instead, results show that the scale and metrics of empirical observations significantly affected analytical results, and heterogeneity measures were high within taxonomic groups. Therefore, the direction and magnitude of the interaction between density and dispersal in empirical studies could partially be attributed to the data collection method involved. We suggest that the contradictory observations for density-dependent dispersal could be explained by dispersal-dependent density, where density is driven by movement instead, and urge researchers to either test this interaction when applicable or consider this perspective when reporting results.
Supplementary Information
The online version contains supplementary material available at 10.1186/s40462-024-00478-6.
Keywords: Conspecific density, Data methodology, Empirical observations, Heterogeneity, Meta-analysis, Migration
Introduction
Animal dispersal has long been considered to be impacted by population density [13, 45, 53, 94] especially in the context of colonization and range expansion (Azandémè-Hounmalon et al. 4, Sullivan et al. 2017). Empirical observations for the effect of conspecific density on dispersal, though, have been inconsistent in terms of both the magnitude and the direction of the presumed interaction [61], and difficulty in consistently measuring density and dispersal across study systems may render results unreliable. In theoretical terms, meanwhile, animal dispersal in relation to density has often been modelled mathematically as though a process of diffusion (e.g., [25, 52, 88]) analogous to the diffusion of molecules in gasses and liquids. Yet animals do not move like molecules; they do not disperse by colliding and bouncing off one another, and they can exhibit movements towards areas with higher densities [83, 125]. Therefore, the extent to which animal dispersal and density are correlated, and the nature of this relationship, remain up to question.
It is easy to see that strictly dispersive movements of organisms away from areas of concentration will correlate with a reduction in the density of those organisms. But the direction of causality is not so easily seen, that is, whether initial density is driving the organisms’ movements, or their movements are altering density, or both. Aggregative behaviours performed by animals, such as schooling or herding, increase density, whereas disaggregative behaviors, such as random walk foraging, or spacing behaviours, such as territoriality, decrease density [38]. Numerous species of migrating animals, such as salmon [42] and salamanders [122], will alternate between movement away from a breeding site and aggregation as they return to it, with correlated changes in their density. Alternatively, density may have no perceivable effect on dispersive movements (e.g., [51]), or its effect on dispersal may vary according to a density ‘threshold’ (e.g., [7, 33, 78]) or even appear to be temporary (e.g., [17]). Individual assemblages may therefore be linked to different types of density-dependent dispersal: positive, negative, neutral, and even non-linear [41].
The correlation between density and dispersal may depend on whether there are benefits to living in a group. On one hand, conspecific density may lead to varying levels of intraspecific competition, notably among kin [6, 11, 23, 84], which may in turn favor dispersal and therefore result in positive density-dependence [26, 67, 77, 92, 99, 138]. On the other hand, certain species rely on group living for optimal defense against predators and/or improved foraging efficiency [8, 19, 21, 29, 34, 36, 60, 65], thus leading to a negative correlation between conspecific density and dispersal. In addition, a myriad of behavioral personalities may exist within a group, and individuals may respond to density differently depending on their personality traits. For example, a non-aggressive and shy individual may only approach or settle in a patch that has already been colonized by aggressive and bold conspecifics [30, 39]. Individual characteristics, including behavioral traits, may therefore modulate density-dependent dispersal responses. Nonetheless, empirical studies more commonly focus on the correlation between density and dispersal at the population level.
Dispersal is notoriously difficult to measure in the field as it is often derived from indirect measures that are associated with large uncertainties and potential biases [46]. It can be measured as propensity (the probability that an individual will emigrate), rate (movement distance per unit time), or distance moved. Although these metrics are often used interchangeably in dispersal studies, their relationship with density may differ; high local density might increase individual emigration distances but lead to lower dispersal propensities [79] and, conversely, higher dispersal propensities at higher densities could lead to slower movement rates [2]. Similarly, density can be measured at different life history stages; for example, natal density can be the number of birds in a nest while breeding density the number of nests [14]. Studies have also used proxy measures for density, such as habitat carrying capacity [55], patch area [100], nearest-neighbor distance [51], and even habitat quality [49, 57, 64] on the assumption that higher habitat quality should equate to higher population density [12, 14, 16, 20]. The different density and dispersal metrics therefore could result in incomparable outcomes when it comes to the relationship between density and dispersal.
To assess whether dispersal is density-dependent across study systems and test the impact of methodology on this relationship, we conducted a systematic review of available literature on the effects of conspecific density on dispersal. If density and dispersal are correlated among animals, as would be expected of density-dependent dispersal as a rule, then meta-analytical results should show a convergence among studies toward a strongly supported, weighted mean effect size. However, there is potential for disparities among the results of different studies to be induced by taxonomic and/or methodological differences. Therefore, and unlike existing reviews on density-dependent dispersal [11, 41, 61, 85], we particularly examined the extent to which several categories of study methodology, within and across taxonomic groups, impacted empirical results for the effect of density on dispersal. We explicitly considered heterogeneity and potential reporting of analytical biases, and tested whether reports of density-dependent dispersal were related to taxonomic group, sex, age, migratory behavior, study design, dispersal metric, density metric and variable type, and scales of space and time. We reasoned that if effect size was significantly correlated with one or more of these variables, then the recognition of density-dependent dispersal could be linked to the nature of the study and/or the associated methods employed.
Methods
Literature search and data compilation
We conducted a thorough review of the literature (peer-reviewed articles only, no preprints) using the Google Scholar database with the keywords “density” and “dispersal” or “emigration” in articles published from January 1st, 2000, through October 1st, 2023, excluding citations (Fig. 1A). We only retained studies that referred to conspecific density rather than heterospecific or interspecific density, measured animal density at the starting point of dispersal rather than at the end point of dispersal, reported a statistical effect specifically of density on dispersal, and reported results from empirical observations and not from simulations or theoretical models. Studies that had prominent confounding variables (such as an effect of body size or patch quality) were also excluded. Finally, certain articles reported results for more than one study. Thus, this search yielded 97 studies in 68 articles that fit our criteria of inclusion (Appendix 1).
Fig. 1.

(a) Articles included in this review (n = 68) categorized by year of publication (2000–2023) and associated studies (k = 97) categorized by (b) the reported effect of density on dispersal (negative, positive, or no effect) and (c) the study design (natural or manipulated), grouped per taxon (Birds, Fishes, Invertebrates, Mammals, and Herpetofauna)
Data extraction and effect size calculation
To derive comparable effect sizes, we extracted the correlation coefficient, Pearson’s r, from all studies of density in relation to dispersal where it was available. We used linear correlation results in our analyses, since only a few studies reported a potential non-linear relationship between density and dispersal, and to simplify analyses using a single value of Pearson’s r per study. Where not available, we calculated r with the information provided [27]. We applied Fisher’s Z-transform to linearize r values [28], then weighted each value by the reciprocal of its sampling variance [10]. The resulting weighted effect sizes were used in subsequent analyses, where a positive value indicates conspecific dispersion (i.e., higher dispersal with increasing density) and a negative value indicates conspecific aggregation (i.e., lower dispersal with increasing density).
Publication bias
We evaluated publication bias among studies using a funnel plot of weighted effect sizes versus standard error and an Egger’s test for funnel plot asymmetry [32], for all studies individually and within categories. We also applied a trim-and-fill analysis to identify and correct for funnel plot asymmetry [31, 91]. In addition, we assessed publication bias using the Luis Furuyama–Kanamori (LFK) index, as this method is suggested to be more sensitive to potential bias when pooling studies [37]. We did not choose one method over the other as they are both prevalent in the literature and we valued obtaining comparative results. We recalculated the two-tailed probability estimate (P) for all studies using sample size (n) and Pearson’s r to compare statistical significance across studies consistently, with = 0.05. The ratio of significant to non-significant studies was tested to further identify potential biases resulting from use of differing methodologies.
Meta-analysis
We defined four categorical variables descriptive of the individual animals involved in the study—Taxonomic Group, Sex, Age, and Migratory Behavior—and five categorical variables descriptive of the study methodology—Study Design, Density Metric, Dispersal Metric, Spatial Scale, and Temporal Scale. We recognized five categories of Taxonomic Group: Birds (k = 25), Fishes (k = 8), Herpetofauna (k = 10, consisting of both amphibians and reptiles), Invertebrates (k = 28, consisting of insects and arachnids), and Mammals (k = 26). The variable, Sex, consisted of three levels: males (k = 20), females (k = 23), and males + females (k = 54, studies that reported grouped results for the two sexes), as the ecological determinant of dispersal is often expected to vary between males and females (e.g., in damselflies: [9]). Age consisted of two levels: adults (k = 63) and juveniles (k = 34) and was included as a variable because some animals are thought to disperse more at specific life history stages (e.g., in amphibians: [141], in sparrows: [3]). Migratory Behavior described whether the animals were ‘migratory’ (k = 40), i.e., if they performed long-distance migratory movements as part of their life history, such as for breeding, mating, or hibernation, or were ‘non-migratory’ (k = 57) if they did not perform these movements. This variable was either extracted from the article when reported or assessed through further research on the study species. It was added in this analysis because migratory movements, whether they are performed in groups or not, affect movement tendency and therefore may be confounded with results on dispersal (e.g., migrants disperse farther than residents; [76]).
Among the methodology variables, Study Design had two levels: ‘manipulated’ (k = 35), including all experimental studies that employed artificial enclosures, microcosms, mesocosms, or laboratory set-ups, and ‘natural’ (k = 62) consisting of studies of wild populations in nature. The variable Dispersal Metric had three levels: ‘propensity’ (k = 36) for studies assessing the probability or frequency of emigration, ‘rate’ (k = 20) for studies measuring movement distance per unit time, or ‘distance’ (k = 41) for studies recording either average or net distance moved by an animal between two points. Although dispersal is typically defined as any movement that could lead to the consequences of gene flow [84], dispersal is often considered to be composed of three sequential stages—departure, transit, and settlement [5, 11, 24, 62]—which relate to our three Dispersal Metric levels, respectively. Density Metric also had three levels: ‘natal’ (k = 30) for studies measuring density at a birth or developmental site, ‘breeding’ (k = 22) for studies measuring density at a breeding site, and ‘population’ (k = 45) for studies that assessed abundance of individuals in the whole population. Density Variable consequently had two levels: ‘discrete’ (k = 71), where density was measured at one time point regardless of spatial and temporal scale, and ‘continuous’ (k = 26), where density was measured at multiple time points throughout the temporal period of the study. Studies were also divided based on two levels of Spatial Scale: ‘between patches’ (k = 48) whereby the start and end point at each patch was recorded, and ‘out of a patch’ (k = 49) whereby the starting point of the displacement was recorded in the study, but the settlement point was not. Finally, we categorized Temporal Scale of dispersal observations recorded within a year (or less) as ‘intra-annual’ (k = 51), between years as ‘inter-annual’ (k = 34), and in short-term experimental studies as ‘per trial’ (k = 12). Although there are other factors that may have an impact on dispersal, such as sociality and territoriality, we chose to focus on variables relevant to our research question on the effect of methodology on density-dependent dispersal observations.
We tested for significant difference from = 0 across and within taxonomic groups, assuming that each study has its own mean estimate and therefore does not assume homogeneity [70]. Next, to examine the impact of each categorical variable, Sex, Age, Migratory Behavior, Study design, Density Metric, Density Variable, Dispersal Metric, Temporal Scale, and Spatial Scale on we used a meta-analytical approach, a multilevel mixed-effects model with those variables added as fixed effects. The model was fitted via restricted maximum likelihood estimation, with Taxonomic Group and Article added as random effect variables to account for potential taxa-specific trends and any potential biases for studies extracted from the same article. We used 95% confidence intervals to determine significant differences in effect sizes from zero.
Heterogeneity testing
We tested for possible sources of heterogeneity, the measure of incompatibility among studies in a meta-analysis. Since a wide variation in density-dependence across studies leads to excessive heterogeneity, we can test what impacts this variation by estimating heterogeneity in different pools of studies [89]. Accordingly, we sorted the studies into pools for analytical purposes, based on all individual and methodology categorical variables, to identify incompatibilities in the results and return lower levels of heterogeneity. Heterogeneity measures τ 2 (between-study variance or variance of true effects), I 2 (residual heterogeneity), H 2 (sampling variability) and Q (total residual heterogeneity) were estimated through restricted maximum likelihood. As I 2 can be compared for studies with different types of outcome data, it was chosen as the preferred measure of heterogeneity [43]. I 2 values were categorized as low (0–30%), moderate (30–75%), and high (75–100%). Thus, if studies are too different to compare within the created groups, then we expect to find high heterogeneity measures, particularly I 2 values, signifying a difficulty in comparing study outcomes.
All statistical analyses and visualizations were done in R version 4.2.3 [81] and using packages ‘metafor’ [98] and ‘metasens’ [87].
Results
Literature review
Our review of the recent literature on density-dependent dispersal indicates that empirical evidence of the existence of density-dependent dispersal is, at best, equivocal. In 40 of the 97 studies we examined, conspecifics attracted each other (i.e., negative density dependence), in 32 other studies, they repelled each other (i.e., positive density dependence), and in the remaining 25 studies, there was no significant density-dependent effect on individual dispersal at all (Fig. 1b). Although more studies report significant results, we found no differences between studies in the proportion of significant versus non-significant results, neither per taxa nor per study category (Appendix 2). In addition, there is no trend between number of articles and the year of publication (Fig. 1a), but there is a clear lack of studies on density-dependent dispersal for Fishes and Herpetofauna relative to other taxonomic groups (Fig. 1b).
Although 26% of studies included in this analysis reported a sex bias, over half of studies, 56%, reported the effect of density on dispersal observed for both male and female individuals together, adding to the difficulty in detecting a potential sex bias. In addition, the effect of density on dispersal was more often explored in females than males due to the relevance of dispersing genes (24% of studies on female dispersal, 21% on male dispersal), especially in invertebrates (e.g., [107, 116]). The direction of the effect of density on dispersal (e.g., fruit flies show female-biased density-dependence at low densities and male-biased at high densities, [66]) or linearity (e.g., linear effect in female leopards and non-linear, quadrative effect in males, [33]) also differed between sexes, although not enough studies observed or reported this difference to explore it further. As for age differences in dispersal results, 10% of studies reported an age-bias but only 35% of studies tested the effect of density on dispersal in juveniles alone.
There was no mention of migratory behavior in most articles, which may have led to a bias in the definition of different movement types, including dispersal, in the associated studies. We therefore added the categorical variable for Migratory Behavior based on further research on each species in question. We did not find a significant correlation between Migratory Behavior and Taxonomic Group ( = 7.357, df = 4, P = 0.118), but instead found that across groups over half of species studied, 59%, do not perform migratory movements during their life history, while the opposite was true for Birds (60% are migratory).
As for extracted categorical variables related to study methodology, there was a bias in the measurement of both density and dispersal within taxonomic groups. There was a significant correlation between Study Design and Taxonomic Group ( = 32.814, df = 4, P < 0.001), where studies were more likely to use a manipulated setup in Fishes and Invertebrates, probably due to the difficulties associated with finding and tracking species in these groups, and a natural setup was more commonly used in Birds, Herpetofauna, and Mammals (Fig. 1c). Consequently, Study Design significantly impacted effect size across groups ( = 12.194, df = 2, P = 0.002).
Studies significantly differed in their Density Metric ( = 42.125, df = 8, P < 0.001), Dispersal Metric ( = 30.058, df = 8, P < 0.001) and Temporal Scale of observations ( = 39.790, df = 8, P < 0.001) based on Taxonomic Group (Fig. 2). This was not the case for the remaining categorical variables for study methodology Density Variable ( = 4.476, df = 4, P = 0.345) and Spatial Scale ( = 7.356, df = 4, P = 0.118) (Appendix 2). However, only Density Metric significantly impacted effect size across groups ( = 12.381, df = 4, P = 0.015), where studies measuring breeding density reported generally stronger and negative density-dependence effects while studies measuring natal or population density reported slightly positive density-dependence effects when averaging effect size, , across groups (Fig. 4).
Fig. 2.

Studies (k = 97) grouped per taxon (Birds, Fishes, Invertebrates, Mammals, and Herpetofauna) and categorized by (a) density metric (breeding, natal, population), (b) dispersal metric (distance, propensity, rate), and (c) temporal scale (inter-annual, intra-annual, per trial)
Fig. 4.

Forest plots for density-dependent dispersal mean effect sizes () for individual and methodology categorical variables, per taxonomic group (left to right: All groups, Birds, Fishes, Herpetofauna, Invertebrates, Mammals). 95% Confidence Intervals are plotted
Publication bias
Funnel plot analysis provided evidence for slight publication bias due to an underreporting of negative density-dependence (Suppl. Figure S1). Trim-and-fill estimation indicated that deviation from symmetry was slightly skewed toward lower, negative effect sizes and returned a corrected mean value of = − 0.149 compared to the actual value of − 0.022 0.047 (Appendix 2). The distribution of weighted effect sizes did not significantly deviate from symmetry when all 97 studies were considered (Egger’s test: t = 1.76, P = 0.08), although some study variables were found to contribute some asymmetry (Tables 1, 2). Furthermore, the high sensitivity of the LFK method detected asymmetry within more categories than with Egger’s test (Table 2), where an across-studies LFK index of 1.05 suggests minor yet significant asymmetry across categorical variables.
Table 1.
Results for multilevel mixed-effects meta-analysis for effect size with Taxonomic Group and Article as random effects, and all remaining study categories as fixed effects
| Study category | Multilevel mixed-effect model | ||
|---|---|---|---|
| Estimate ± SE | z-value | P | |
| Intercept | – 0.613 ± 0.180 | -3.408 | < 0.001*** |
| Sex | |||
| Males + Females | – | – | – |
| Males | – 0.071 ± 0.092 | – 0.765 | 0.444 |
| Females | – 0.141 ± 0.094 | – 1.499 | 0.134 |
| Age | |||
| Adults | – | – | – |
| Juveniles | 0.034 ± 0.090 | 0.383 | 0.701 |
| Migratory behavior | |||
| Migratory | – | – | – |
| Non-migratory | 0.225 ± 0.103 | 2.159 | 0.031* |
| Study design | |||
| Natural | – | – | – |
| Manipulated | 0.174 ± 0.125 | 1.384 | 0.166 |
| Density metric | |||
| Breeding | – | – | – |
| Natal | 0.321 ± 0.146 | 2.205 | 0.028* |
| Population | 0.323 ± 0.141 | 2.280 | 0.022* |
| Density variable | |||
| Continuous | – | – | – |
| Discrete | 0.146 ± 0.120 | 1.220 | 0.223 |
| Dispersal metric | |||
| Propensity | – | – | – |
| Distance | 0.200 ± 0.103 | 1.932 | 0.050* |
| Rate | 0.071 ± 0.125 | 0.565 | 0.572 |
| Temporal scale | |||
| Intra-annual | – | – | – |
| Inter-annual | 0.340 ± 0.116 | 2.934 | 0.003** |
| Per trial | – 0.040 ± 0.161 | – 0.246 | 0.805 |
| Spatial scale | |||
| Between patches | – | – | – |
| Out of patch | – 0.033 ± 0.101 | – 0.326 | 0.745 |
* P significant difference at = 0.05; ** P significant difference at = 0.01; *** P significant difference at = 0.001
Table 2.
Results from Egger’s test and LFK test for publication bias (asymmetry) for all study categories
| Study category | Egger's test | LFK test | |
|---|---|---|---|
| t | P | index | |
| Taxonomic group | |||
| Birds | – 0.32 | 0.752 | – 0.26 |
| Fishes | 3.00 | 0.024* | 8.6** |
| Herpetofauna | – 0.96 | 0.367 | – 1.15* |
| Invertebrates | 0.25 | 0.807 | 0.72 |
| Mammals | 0.1 | 0.923 | – 0.58 |
| Sex | |||
| Males | – 0.22 | 0.829 | 0.31 |
| Females | 1.26 | 0.221 | 1.72* |
| Males + Females | 0.40 | 0.688 | 0.80 |
| Age | |||
| Adults | 1.64 | 0.107 | 1.41* |
| Juveniles | – 2.14 | 0.040 | – 1.82* |
| Migratory behavior | |||
| Migratory | – 1.07 | 0.290 | – 0.84 |
| Non-migratory | 2.54 | 0.014* | 2.49** |
| Study design | |||
| Natural | – 0.81 | 0.418 | – 0.88 |
| Manipulated | 3.84 | < 0.001*** | 6.24** |
| Density metric | |||
| Breeding | – 1.64 | 0.116 | – 1.39* |
| Natal | – 0.92 | 0.365 | – 1.06* |
| Population | 2.54 | 0.015* | 2.13** |
| Density variable | |||
| Discrete | – 1.03 | 0.309 | – 0.20 |
| Continuous | 1.56 | 0.133 | – 0.12 |
| Dispersal metric | |||
| Distance | 0.75 | 0.460 | 0.63 |
| Propensity | 2.03 | 0.05* | 2.88** |
| Rate | – 2.00 | 0.061 | – 1.44* |
| Temporal scale | |||
| Inter-annual | 0.17 | 0.870 | 0.33 |
| Intra-annual | 0.97 | 0.339 | 0.73 |
| Per trial | 3.03 | 0.013* | 5.62** |
| Spatial scale | |||
| Between patches | 1.59 | 0.118 | 1.49* |
| Out of patch | – 0.25 | 0.805 | – 0.37 |
Egger’s test: * P significant at = 0.05; ** P significant at = 0.01; *** P significant difference at = 0.001
LFK test index: * minor asymmetry (|index|> 1); ** major asymmetry (|index|> 2)
Effect sizes and meta-analysis
Variation in the mean effect size of density on dispersal varied largely in both sign and magnitude within and between Taxonomic Groups (Fig. 3; Appendix 2). The mean effect size was positive in Birds, Fishes, and Invertebrates, while negative in Herpetofauna and Mammals. However, this interaction was not significant within any taxonomic group, indicating a difficulty in obtaining a clear density-dependence signal, if any, without taking into consideration other variables.
Fig. 3.
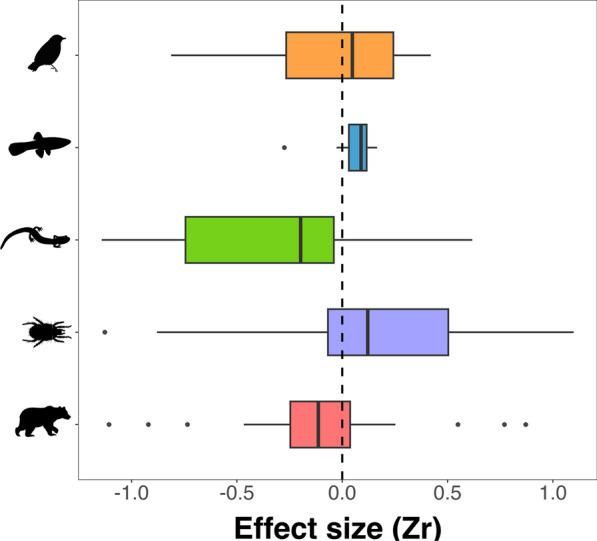
Forest plot for density-dependent dispersal effect sizes () per taxonomic group
Results from the multilevel mixed-effect model further showed that Migratory Behavior, Density Metric, Dispersal Metric, and Temporal Scale were all significant predictors of , with Taxonomic Group and Article considered as random effect variables (Table 1). Migratory animals were more likely to exhibit negative density-dependence and vice versa for non-migratory animals, particularly in Birds, Herpetofauna, and Invertebrates (Fig. 4). Sex and Age were not significant predictors of , neither across nor within groups, but breeding and natal densities had opposite effects on dispersal—breeding density was negatively correlated with dispersal in Birds, Herpetofauna, and Invertebrates, while natal density was positively correlated with dispersal in Birds, Fishes, Herpetofauna, and Invertebrates (Fig. 4). Nonetheless, values were not significantly different from zero (Appendix 2).
Heterogeneity testing
Heterogeneity estimates obtained for variables across all Taxonomic Groups at once were moderate (I 2 ≈ 65%, H 2 ≈ 3) yet significant (P-value for Q < 0.05) (Appendix 2). Heterogeneity varied between Taxonomic Groups, but was generally low (I 2 < 50%, H 2 < 2.0) and not significant (P-value for Q > 0.05) across categorical variables within groups, with low variance of true effects (τ 2 < 0.1) (Appendix 2). The only exception was for Invertebrates, where the significantly high heterogeneity across variables (I 2 > 78%, H 2 > 2.5, P-value for Q < 0.05, τ 2 > 0.1) was probably due to the widely different families included in this taxonomic group for this study.
Discussion
Our systematic review and associated analyses show that there is no empirical consensus on whether conspecific density is correlated with dispersal, neither positively nor negatively, emphasized by the high heterogeneity obtained across taxonomic groups. As for results within taxonomic groups, effect sizes varied greatly in magnitude and direction, but heterogeneity estimates were lower than across groups. The metrics chosen to measure density and dispersal, along with the temporal scale of observations were especially found to be significant predictors of the effect of density on dispersal. Our findings are therefore consistent with the hypothesis that the perceived interaction between conspecific density and dispersal can be, at least partially, the result of study methodology.
The process of animal dispersal spans a wide range of spatial and temporal scales [72] and density patterns are spatially variable [68]. However, temporal and spatial scale of displacements are generally acknowledged as the main difficulties in obtaining a unified concept in movement ecology [44]. The settlement point following emigration may often be unknown due to the relatively large scale of the movement path [71]. Logically, animals should be able to disperse farther if allowed more time to do so, but movement paths can be more intricate, with a certain degree of directional variation, at large time scales [80]. We found that measurements of dispersive movements between years were generally reported as positively density dependent as opposed to movements within a year. We also found that significant and positive effects of density on dispersal were more likely for studies with manipulated population parameters. Hence, there may simply be a higher probability for dispersal to occur with increasing time elapsed between encounters, and/or under non-natural density conditions.
Our results also highlight that empirical observations may result from density being movement-dependent rather than movement being density-dependent. Similar to how social organizations can shift throughout an organism’s life history, we found that breeding density, typically requiring aggregation, decreased dispersive tendency, whereas natal density, often followed by disaggregation, increased dispersive tendency. This corroborates with the physical principle of phase separation, or movement-driven self-organization, where the net movement of a species switches between aggregation and disaggregation as a function of its own local density (Cahn and Hillard 18). Aggregation by individual movement is a widely described phenomenon [97] and some species move in groups according to a specific ‘leading point’ [74]. In addition, as the costs associated to dispersal could affect its relationship with density [95], density dependence may only truly be tested in populations where density fluctuates and meets a specific threshold. Nonetheless, too few studies included in our study measured density over a continuous scale, and even fewer reported a density threshold where effects go from negative to positive or vice versa (e.g., [7, 33]) to explore the potential shift in the correlation between dispersal and density over space and/or time. More studies should measure the opposite interaction, the effect of dispersal on density (e.g., Jeong and Kim [1, 47]), to better understand how the two are correlated in different systems.
Migration is a different process from dispersal and we only included studies on dispersive movements in this analysis, but species that typically migrate as part of their life history could move differently in response to conspecific density levels. Migratory tendency can vary within taxonomic group and even within species, but migratory movements generally occur as a response to seasonality and/or for breeding [22, 73]. Migratory species of birds and insects generally undertake relatively large seasonal movements, in groups, often as the entire population [40, 86]. Our results comply with this, as migratory species in those taxa were found to exhibit negative density dependence, while non-migratory species exhibited positive density dependence. However, the opposite was true for fishes and mammals, where migratory animals exhibited positive density dependence. As fishes generally migrate for maturation (e.g., Salmo salar, [93], and Argyrosomus japonicus, [92]), and many mammals migrate individually for hibernation [59], these animals may be conditioned to seek lower densities.
Comparable to a recent review conducted on density-dependent dispersal in small mammals [85], we find that the reported observations on the effect of density on dispersal are limited and do not allow for the comparison or generalization of dispersal behavior across systems, even within taxonomic group. Another recent review reported that during 2009–2018, most studies on animal movement were in relation to external factors, but of those, only 38% were on movement in relation with other animals, conspecific or heterospecific [50]. Thus, the actual proportion of studies testing the impact of conspecific density on dispersal is relatively low, although we found enough studies between 2000–2023 to test the potential impact of study methodology on density-dependent dispersal observations. However, the relatively low number of empirical evidence for density-dependence leads theoretical studies to either assume different density-dependence scenarios as dispersal strategies (e.g., [69]) or, as seen in many founding theoretical studies on dispersal, assume density-independence [54, 75].
Studies often refer to density to explain other findings related to movement without having actual density measurements to test the direct correlation between density and dispersive movements (e.g., [15, 48, 82]). Similarly, certain studies also use dispersal to justify their results for density or abundance, again without obtaining measurements for dispersive movements (e.g., [63]). Therefore, although density-dependent dispersal is considered a widespread strategy, many studies could not be included in this systematic review as their conclusions are not based on statistical results for the impact of density on dispersal.
Conclusion
In this systematic review of literature testing the effect of density on dispersal (2000–2023), we show that empirical observations for density-dependent dispersal may be impacted by more than just the characteristics of the population and system under study. We suggest that the contradictory observations for density-dependent dispersal could be explained by dispersal-dependent density in addition to study methodology. As movement occurs as part of the animals’ daily lives regardless, movements within or between patches could impact population density measures. Empirical studies should make sure to place their results within the context of their study system and consider the two-way interaction between movement and density when discussing findings.
Supplementary Information
Acknowledgements
We thank Gabrielle Pellegrin for help conducting the literature search.
Appendix 1: Study species and data sources used in systematic review.
| Taxon | Study species | K | Article reference(s) | |
|---|---|---|---|---|
| Scientific name | Common name | |||
| Amphibians | Ambystoma annulatum | Ringed Salamander | 1 | Ousterhout and Semlitsch 138 |
| Amphibians | Anaxyrus fowleri | Fowler’s Toad | 1 | Jreidini and Green 51 |
| Amphibians | Triturus cristatus | Northern Crested Newt | 2 | Cayuela et al. 21 |
| Birds | Athene cunicularia | Burrowing Owl | 1 | Luna et al. 130 |
| Birds | Ciconia ciconia | White Stork | 1 | Itonaga et al. 124 |
| Birds | Hirundo rustica | Barn Swallow | 2 | Scandolara et al. 145 |
| Birds | Junco hyemalis | Dark-eyed Junco | 1 | Liebgold et al. 128 |
| Birds | Lagopus lagopus | Willow Ptarmigan | 2 | Brøseth et al. 14 |
| Birds | Milvus migrans | Black Kite | 2 | Forero et al. 34 |
| Birds | Neophron percnopterus | Egyptian Vulture | 3 | Serrano et al. 144 |
| Birds | Parus major | Great Tit | 1 | Nicolaus et al. 135 |
| Birds | Passer domesticus | House Sparrow | 1 | Pärn et al. 77 |
| Birds | Petroica traversi | Black Robin | 2 | Paris et al. 139 |
| Birds | Pica pica | Eurasian Magpie | 2 | Molina-Morales et al. 67 |
| Birds | Picoides borealis | Red-cockaded Woodpecker | 1 | Pasinelli and Walters 140 |
| Birds | Setophaga ruticilla | American Redstart | 2 | McKellar et al. 65 |
| Birds | Somateria mollissima | Common Eider | 1 | Öst et al. 137 |
| Birds | Sturnus unicolor | Spotless Startling | 1 | Fuentes et al. 36 |
| Birds | Sula nebouxii | Blue-footed Booby | 2 | Kim et al. 125 |
| Fishes | Argyrosomus japonicus | Mulloway | 1 | Taylor et al. 92 |
| Fishes | Oncorhynchus tshawytscha | Chinook Salmon | 1 | Connor et al. 26 |
| Fishes | Poecilia reticulata | Guppy | 4 | De Bona et al. 113 |
| Fishes | Salmo salar | Atlantic Salmon | 2 | Einum et al. 117, Teichert et al. 93 |
| Mammals | Capreolus capreolus | Roe Deer | 1 | Gaillard et al. 120 |
| Mammals | Castor fiber | Eurasian Beaver | 1 | Mayer et al. 133 |
| Mammals | Cervus elaphus | Red Deer | 1 | Loe et al. 129 |
| Mammals | Equus ferus caballus | Horse | 1 | Marjamäki et al. 132 |
| Mammals | Giraffa camelopardalis tippelskirchi | Masai Giraffe | 1 | Bond et al. 108 |
| Mammals | Lepus europaeus | European Hare | 2 | Avril et al. 104, Bray et al. 12 |
| Mammals | Lynx lynx | Eurasian Lynx | 1 | Zimmermann et al. 147 |
| Mammals | Martes pennanti | Fisher | 1 | Carr et al. 20 |
| Mammals | Microtus oeconomus | Tundra Vole | 3 | Aars and Ims 101 , Andreassen and Ims 103 , Ims and Andreassen 123 |
| Mammals | Mustela furo | Ferret | 1 | Caley and Morriss 110 |
| Mammals | Odocoileus virginianus | White-tailed Deer | 1 | Lutz et al. 58 |
| Mammals | Panthera pardus | Leopard | 2 | Fattebert et al. 33 |
| Mammals | Peromyscus boylii | Brush Mouse | 2 | Mabry 60 |
| Mammals | Peromyscus maniculatus | Deer Mouse | 1 | Denomme-Brown et al. 29 |
| Mammals | Suricata suricatta | Meerkat | 1 | Maag et al. 131 |
| Mammals | Ursus americanus | American Black Bear | 3 | Kopsala et al. 126 |
| Mammals | Ursus arctos | Brown Bear | 2 | Støen et al. 146 |
| Reptiles | Anolis sagrei | Brown Anole | 2 | Calsbeek 19 |
| Reptiles | Lacerta vivipara | Viviparous Lizard | 1 | Cote and Clobert 112 |
| Reptiles | Podarcis sicula | Italian Wall Lizard | 1 | Vignoli et al. 99 |
| Invertebrates | Anoplophora glabripennis | Asian Long-horned Beetle | 1 | Bancroft and Smith 105 |
| Invertebrates | Bembidion atrocaeruleum | Ground Beetle | 1 | Bates et al. 106 |
| Invertebrates | Calopteryx splendens | Banded Demoiselle | 1 | Chaput-Bardy et al. 111 |
| Invertebrates | Carpetania matritensis | Earthworm sp. | 1 | Navarro et al. (2022) |
| Invertebrates | Coenagrion mercuriale | Southern Damselfly | 1 | Rouquette and Thompson 143 |
| Invertebrates | Corbicula fluminea | Asian Clam | 1 | Pernecker et al. 78 |
| Invertebrates | Drosophila melanogaster | Common Fruit Fly | 1 | Betini et al. 8 |
| Invertebrates | Erigone atra | Dwarf Spider | 3 | De Meester and Bonte 114 |
| Invertebrates | Maculinea teleius | Scarce Large Blue | 2 | Nowicki and Vrabec 136 |
| Invertebrates | Melitaea cinxia | Glanville Fritillary | 3 | Enfjäll and Leimar 119, DiLeo et al. 116 |
| Invertebrates | Metrioptera brachyptera | Bog Bush-cricket | 2 | Brunzel 109 |
| Invertebrates | Notonecta undulata | Grousewinged Backswimmer | 1 | Baines et al. 7 |
| Invertebrates | Pacifastacus leniusculus | Signal Crayfish | 1 | Galib et al. 121 |
| Invertebrates | Pardosa purbeckensis | Saltmarsh Wolf Spider | 2 | Puzin et al. 142 |
| Invertebrates | Parnassius mnemosyne | Clouded Apollo | 1 | Kuussaari et al. 127 |
| Invertebrates | Paroxyna plantaginis | Fruit Fly | 2 | Albrectsen and Nachman 102 |
| Invertebrates | Tetranychus sp. | Spider Mite | 3 | Azandeme-Hounmalon et al. 4, Bitume et al. 107, De Roissart et al. 115 |
| Invertebrates | Tribolium castaneum | Red Flour Beetle | 1 | Endriss et al. (2019) |
Appendix 2: Summary of results across and within all taxonomic groups (All groups, Birds, Fishes, Herpetofauna, Invertebrates, Mammals) for equality of proportions analysis, effect sizes, and heterogeneity of weighted effect sizes () obtained from random effect meta-analysis.
| Study category | No. studies (k) | Total sample size (n) | No. probability estimates | Equality of proportions | Effect size | Heterogeneity | ||||||
|---|---|---|---|---|---|---|---|---|---|---|---|---|
| Sig. | Not Sig. | X2 | P | ± SE | τ2 | I2 (%) | H2 | Q | ||||
| All groups | ||||||||||||
| 97 | 68390 | 72 | 25 | – 0.017 | – 0.022 ± 0.047 | 0.12 | 68.72 | 3.20 | 276a | |||
| Taxonomic Group: | 1.920 | 0.75 | 0.11 | 65.16 | 2.87 | 247a | ||||||
| Birds | 25 | 8359 | 16 | 9 | – 0.039 | – 0.051 ± 0.071 | ||||||
| Fishes | 8 | 31150 | 6 | 2 | 0.043 | 0.042 ± 0.050 | ||||||
| Herpetofauna | 10 | 2618 | 8 | 2 | – 0.260 | – 0.326 ± 0.170 | ||||||
| Invertebrates | 28 | 10815 | 22 | 6 | 0.141 | 0.166 ± 0.104 | ||||||
| Mammals | 26 | 15448 | 20 | 6 | – 0.089 | – 0.101 ± 0.086 | ||||||
| Sex: | 2.560 | 0.28 | 0.12 | 68.24 | 3.15 | 267a | ||||||
| Males | 20 | 14814 | 14 | 6 | – 0.030 | 0.041 ± 0.117 | ||||||
| Females | 23 | 25264 | 20 | 3 | – 0.114 | – 0.128 ± 0.100 | ||||||
| Males + Females | 54 | 28312 | 38 | 16 | 0.030 | 0.029 ± 0.060 | ||||||
| Age: | 3.260 | 0.07 | 0.12 | 69.06 | 3.23 | 275a | ||||||
| Adults | 63 | 59124 | 37 | 14 | 0.004 | 0.002 ± 0.065 | ||||||
| Juveniles | 34 | 9266 | 15 | 15 | – 0.055 | – 0.068 ± 0.062 | ||||||
| Migratory Behavior: | 0.008 | 0.93 | 0.11 | 66.23 | 2.96 | 262a | ||||||
| Migratory | 40 | 22833 | 29 | 11 | – 0.143 | – 0.171 ± 0.065 | ||||||
| Non-migratory | 57 | 45557 | 43 | 14 | 0.072 | 0.082 ± 0.063 | ||||||
| Study Design: | 0.063 | 0.801 | 0.12 | 68.22 | 3.15 | 274a | ||||||
| Natural | 62 | 30113 | 45 | 17 | – 0.091 | – 0.106 ± 0.063 | ||||||
| Manipulated | 35 | 38277 | 27 | 8 | 0.115 | 0.126 ± 0.062 | ||||||
| Density Metric: | 2.609 | 0.271 | 0.10 | 63.72 | 2.76 | 247a | ||||||
| Breeding | 22 | 7859 | 19 | 3 | – 0.226 | – 0.271 ± 0.093 | ||||||
| Natal | 30 | 6197 | 20 | 10 | 0.019 | 0.016 ± 0.071 | ||||||
| Population | 45 | 54334 | 33 | 12 | 0.062 | 0.074 ± 0.074 | ||||||
| Density Variable: | 1.331 | 0.249 | 0.12 | 68.76 | 3.2 | 271a | ||||||
| Discrete | 71 | 20486 | 50 | 21 | 0.014 | 0.008 ± 0.055 | ||||||
| Continuous | 26 | 47904 | 22 | 4 | – 0.100 | – 0.107 ± 0.094 | ||||||
| Dispersal Metric: | 1.979 | 0.372 | 0.12 | 69.17 | 3.24 | 274a | ||||||
| Distance | 41 | 19433 | 28 | 13 | – 0.004 | – 0.002 ± 0.062 | ||||||
| Propensity | 36 | 43539 | 27 | 9 | – 0.019 | – 0.021 ± 0.070 | ||||||
| Rate | 20 | 5418 | 17 | 3 | – 0.038 | – 0.068 ± 0.148 | ||||||
| Temporal Scale: | 3.218 | 0.200 | 0.11 | 67.23 | 3.05 | 261a | ||||||
| Inter-annual | 34 | 20033 | 28 | 6 | 0.036 | 0.048 ± 0.090 | ||||||
| Intra-annual | 51 | 44807 | 34 | 17 | – 0.103 | – 0.130 ± 0.057 | ||||||
| Per trial | 12 | 3550 | 10 | 2 | 0.204 | 0.232 ± 0.120 | ||||||
| Spatial Scale: | 0.755 | 0.385 | 0.12 | 60.95 | 3.22 | 276a | ||||||
| Between patches | 48 | 55798 | 38 | 10 | – 0.004 | 0.005 ± 0.070 | ||||||
| Out of patch | 49 | 12592 | 34 | 15 | – 0.029 | – 0.040 ± 0.064 | ||||||
| Birds | ||||||||||||
| 25 | 8359 | 16 | 9 | – 0.039 | – 0.051 ± 0.071 | 0.02 | 23.36 | 1.30 | 30 | |||
| Sex: | 0.35 | 0.838 | 0.03 | 28.99 | 1.41 | 30 | ||||||
| Males | 7 | 2442 | 5 | 2 | – 0.103 | – 0.128 ± 0.162 | ||||||
| Females | 6 | 1038 | 4 | 2 | – 0.081 | – 0.085 ± 0.127 | ||||||
| Males + Females | 12 | 4879 | 7 | 5 | 0.020 | 0.010 ± 0.100 | ||||||
| Age: | < 0.001 | 1 | 0.03 | 26.58 | 1.36 | 30 | ||||||
| Adults | 12 | 5625 | 8 | 4 | 0.012 | 0.004 ± 0.096 | ||||||
| Juveniles | 13 | 2734 | 8 | 5 | – 0.086 | – 0.102 ± 0.105 | ||||||
| Migratory Behavior: | 0.01 | 0.932 | 0.01 | 8.19 | 1.09 | 21 | ||||||
| Migratory | 15 | 5081 | 9 | 6 | – 0.183 | – 0.208 ± 0.091 | ||||||
| Non-migratory | 10 | 3278 | 7 | 3 | 0.177 | 0.183 ± 0.064 | ||||||
| Study Design: | < 0.001 | 1 | 0.03 | 26.27 | 1.36 | 30 | ||||||
| Natural | 22 | 8111 | 14 | 8 | – 0.061 | – 0.076 ± 0.075 | ||||||
| Manipulated | 3 | 248 | 2 | 1 | 0.124 | 0.130 ± 0.202 | ||||||
| Density Metric: | 0.70 | 0.704 | 0.01 | 13.44 | 1.16 | 25 | ||||||
| Breeding | 11 | 5083 | 8 | 3 | – 0.107 | – 0.118 ± 0.097 | ||||||
| Natal | 12 | 2038 | 4 | 5 | – 0.014 | – 0.031 ± 0.116 | ||||||
| Population | 2 | 1238 | 1 | 1 | 0.184 | 0.190 ± 0.142 | ||||||
| Density Variable: | 0.098 | 0.755 | 0.02 | 25.00 | 1.33 | 27 | ||||||
| Discrete | 20 | 7424 | 12 | 8 | 0.049 | 0.047 ± 0.067 | ||||||
| Continuous | 5 | 935 | 4 | 1 | – 0.392 | – 0.443 ± 0.135 | ||||||
| Dispersal Metric: | 5.54 | 0.060 | 0.02 | 22.09 | 1.28 | 26 | ||||||
| Distance | 19 | 6549 | 14 | 5 | – 0.110 | – 0.28 ± 0.085 | ||||||
| Propensity | 5 | 1726 | 1 | 4 | 0.160 | 0.162 ± 0.046 | ||||||
| Rate | 1 | 84 | 1 | 0 | 0.320 | 0.332 | ||||||
| Temporal Scale: | < 0.001 | 1 | 0.02 | 25.38 | 1.34 | 30 | ||||||
| Inter-annual | 18 | 7976 | 12 | 6 | 0.013 | 0.009 ± 0.070 | ||||||
| Intra-annual | 7 | 383 | 4 | 3 | – 0.173 | 0.207 ± 0.174 | ||||||
| Per trial | 0 | 0 | 0 | 0 | – | – | ||||||
| Spatial Scale: | 0.31 | 0.580 | 0.03 | 28.25 | 1.39 | 30 | ||||||
| Between patches | 17 | 6902 | 12 | 5 | 0.045 | 0.042 ± 0.074 | ||||||
| Out of patch | 8 | 1457 | 4 | 4 | – 0.218 | – 0.250 ± 0.136 | ||||||
| Fishes | ||||||||||||
| 8 | 31150 | 6 | 2 | 0.043 | 0.042 ± 0.050 | 0.02 | 40.99 | 1.69 | 11 | |||
| Sex: | 2.67 | 0.264 | 0.01 | 23.98 | 1.32 | 5 | ||||||
| Males | 2 | 8738 | 2 | 0 | 0.021 | 0.021 ± 0.048 | ||||||
| Females | 2 | 20106 | 2 | 0 | – 0.068 | – 0.071 ± 0.204 | ||||||
| Males + Females | 4 | 2306 | 2 | 2 | 0.108 | 0.109 ± 0.023 | ||||||
| Age: | < 0.001 | 1 | 0.01 | 18.23 | 1.22 | 4 | ||||||
| Adults | 2 | 26342 | 2 | 0 | – 0.148 | – 0.151 ± 0.124 | ||||||
| Juveniles | 6 | 4808 | 4 | 2 | 0.106 | 0.106 ± 0.017 | ||||||
| Migratory Behavior: | 0.67 | 0.414 | 0.01 | 34.11 | 1.52 | 8 | ||||||
| Migratory | 4 | 2306 | 2 | 2 | 0.108 | 0.109 ± 0.023 | ||||||
| Non-migratory | 4 | 28844 | 4 | 0 | – 0.024 | – 0.025 ± 0.090 | ||||||
| Study Design: | – | – | – | – | – | – | ||||||
| Natural | 0 | 0 | 0 | 0 | – | – | ||||||
| Manipulated | 8 | 311150 | 6 | 2 | 0.043 | 0.042 ± 0.040 | ||||||
| Density Metric: | < 0.001 | 1 | 0.01 | 39.18 | 1.64 | 9 | ||||||
| Breeding | 0 | 0 | 0 | 0 | – | – | ||||||
| Natal | 2 | 1474 | 2 | 0 | 0.137 | 0.138 ± 0.028 | ||||||
| Population | 6 | 29675 | 4 | 2 | 0.011 | 0.010 ± 0.061 | ||||||
| Density Variable: | 0.667 | 0.414 | 0.01 | 34.11 | 1.52 | 8 | ||||||
| Discrete | 4 | 2306 | 2 | 2 | − 0.108 | − 0.109 ± 0.023 | ||||||
| Continuous | 4 | 28844 | 4 | 0 | − 0.024 | − 0.025 ± 0.090 | ||||||
| Dispersal Metric: | 5.333 | 0.0695 | 0.02 | 45.40 | 1.83 | 9 | ||||||
| Distance | 1 | 286 | 0 | 1 | 0.109 | 0.109 | ||||||
| Propensity | 5 | 29135 | 5 | 0 | 0.014 | 0.013 ± 0.079 | ||||||
| Rate | 2 | 1729 | 1 | 1 | 0.081 | 0.081 ± 0.030 | ||||||
| Temporal Scale: | < 0.001 | 1 | 0.02 | 43.04 | 1.76 | 10 | ||||||
| Inter-annual | 1 | 1183 | 1 | 0 | 0.110 | 0.110 | ||||||
| Intra-annual | 7 | 29967 | 5 | 2 | 0.033 | 0.032 ± 0.056 | ||||||
| Per trial | 0 | 0 | 0 | 0 | – | – | ||||||
| Spatial Scale: | 0.667 | 0.414 | 0.01 | 34.11 | 1.52 | 8 | ||||||
| Between patches | 4 | 28844 | 4 | 0 | − 0.024 | − 0.025 ± 0.090 | ||||||
| Out of patch | 4 | 2306 | 2 | 2 | 0.108 | 0.109 ± 0.234 | ||||||
| Herpetofauna | ||||||||||||
| 10 | 2618 | 8 | 2 | − 0.260 | − 0.326 ± 0.170 | 0.20 | 73.24 | 3.74 | 34a | |||
| Sex: | 3.750 | 0.153 | 0.07 | 45.11 | 1.82 | 13 | ||||||
| Males | 3 | 504 | 3 | 0 | − 0.554 | − 0.706 ± 0.276 | ||||||
| Females | 3 | 485 | 3 | 0 | − 0.489 | − 0.578 ± 0.212 | ||||||
| Males + Females | 4 | 1629 | 2 | 2 | 0.132 | 0.148 ± 0.173 | ||||||
| Age: | 0.039 | 0.843 | 0.20 | 73.66 | 3.80 | 31b | ||||||
| Adults | 8 | 2425 | 7 | 1 | − 0.321 | − 0.403 ± 0.203 | ||||||
| Juveniles | 2 | 193 | 1 | 1 | − 0.016 | − 0.016 ± 0.184 | ||||||
| Migratory Behavior: | 0.625 | 0.429 | 0.09 | 53.89 | 2.17 | 17 | ||||||
| Migratory | 5 | 849 | 5 | 0 | − 0.517 | − 0.660 ± 0.223 | ||||||
| Non-migratory | 5 | 1769 | 3 | 2 | − 0.003 | 0.009 ± 0.157 | ||||||
| Study Design: | < 0.001 | 1 | 0.01 | 62.96 | 2.70 | 24 | ||||||
| Natural | 7 | 2354 | 6 | 1 | − 0.446 | − 0.549 ± 0.163 | ||||||
| Manipulated | 3 | 264 | 2 | 1 | 0.173 | 0.195 ± 0.236 | ||||||
| Density Metric: | 3.750 | 0.153 | 0.07 | 46.16 | 1.86 | 13 | ||||||
| Breeding | 6 | 989 | 6 | 0 | − 0.522 | − 0.642 ± 0.158 | ||||||
| Natal | 2 | 193 | 1 | 1 | − 0.016 | − 0.016 ± 0.184 | ||||||
| Population | 2 | 1436 | 1 | 1 | 0.279 | 0.313 | ||||||
| Density Variable: | 0.625 | 0.429 | 0.22 | 71.30 | 3.48 | 28a | ||||||
| Discrete | 9 | 1253 | 8 | 1 | 0.009 | 0.009 | ||||||
| Continuous | 1 | 1365 | 0 | 1 | − 0.290 | − 0.363 ± 0.186 | ||||||
| Dispersal Metric: | 3.213 | 0.070 | 0.02 | 65.10 | 2.87 | 12a | ||||||
| Distance | 1 | 1365 | 0 | 1 | 0.009 | 0.009 | ||||||
| Propensity | 4 | 474 | 3 | 1 | − 0.102 | − 0.104 ± 0.090 | ||||||
| Rate | 5 | 779 | 5 | 0 | − 0.440 | − 0.571 ± 0.309 | ||||||
| Temporal Scale: | 1.071 | 0.585 | 0.15 | 68.04 | 3.13 | 23a | ||||||
| Inter-annual | 2 | 240 | 2 | 0 | − 0.606 | − 0.706 ± 0.076 | ||||||
| Intra-annual | 7 | 2307 | 5 | 2 | − 0.277 | − 0.352 ± 0.184 | ||||||
| Per trial | 1 | 71 | 1 | 0 | 0.549 | 0.617 | ||||||
| Spatial Scale: | < 0.001 | 1 | 0.14 | 64.24 | 2.8 | 21a | ||||||
| Between patches | 6 | 831 | 5 | 1 | − 0.400 | 0.509 ± 0.259 | ||||||
| Out of patch | 4 | 1787 | 3 | 1 | − 0.051 | − 0.052 ± 0.087 | ||||||
| Invertebrates | ||||||||||||
| 28 | 10815 | 22 | 6 | 0.141 | 0.166 ± 0.104 | 0.23 | 78.9 | 5.74 | 130a | |||
| Sex: | 3.893 | 0.143 | 0.24 | 79.36 | 4.82 | 122a | ||||||
| Males | 4 | 494 | 2 | 2 | 0.384 | 0.478 ± 0.248 | ||||||
| Females | 7 | 1522 | 7 | 0 | 0.144 | 0.185 ± 0.211 | ||||||
| Males + Females | 17 | 8799 | 13 | 4 | 0.082 | 0.085 ± 0.137 | ||||||
| Age: | < 0.001 | 1 | 0.23 | 78.59 | 4.67 | 124a | ||||||
| Adults | 27 | 10635 | 21 | 6 | 0.163 | 0.191 ± 0.105 | ||||||
| Juveniles | 1 | 180 | 1 | 0 | − 0.470 | − 0.510 | ||||||
| Migratory Behavior: | 0.318 | 0.573 | 0.21 | 76.34 | 4.23 | 108a | ||||||
| Migratory | 9 | 5489 | 6 | 3 | − 0.083 | − 0.105 ± 0.130 | ||||||
| Non-migratory | 19 | 5326 | 16 | 3 | 0.246 | 0.295 ± 0.133 | ||||||
| Study Design: | 0.520 | 0.470 | 0.24 | 79.48 | 4.87 | 128a | ||||||
| Natural | 11 | 5442 | 8 | 3 | 0.073 | 0.109 ± 0.210 | ||||||
| Manipulated | 17 | 5373 | 14 | 4 | 0.184 | 0.203 ± 0.111 | ||||||
| Density Metric: | 1.768 | 0.413 | 0.22 | 78.04 | 4.55 | 116a | ||||||
| Breeding | 5 | 1787 | 5 | 0 | − 0.133 | − 0.164 ± 0.231 | ||||||
| Natal | 3 | 320 | 2 | 1 | 0.198 | 0.202 ± 0.056 | ||||||
| Population | 20 | 8708 | 15 | 5 | 0.200 | 0.243 ± 0.131 | ||||||
| Density Variable: | 0.048 | 0.827 | 0.24 | 79.02 | 4.77 | 124a | ||||||
| Discrete | 20 | 5712 | 15 | 5 | 0.186 | 0.215 ± 0.108 | ||||||
| Continuous | 8 | 5103 | 7 | 1 | 0.026 | 0.044 ± 0.254 | ||||||
| Dispersal Metric: | 0.28 | 0.868 | 0.20 | 75.25 | 4.04 | 95a | ||||||
| Distance | 6 | 2424 | 2 | 1 | 0.244 | 0.276 ± 0.141 | ||||||
| Propensity | 16 | 6757 | 12 | 4 | − 0.022 | − 0.023 ± 0.150 | ||||||
| Rate | 6 | 1634 | 5 | 1 | 0.470 | 0.561 ± 0.148 | ||||||
| Temporal Scale: | 1.075 | 0.584 | 0.10 | 60.00 | 2.50 | 60a | ||||||
| Inter-annual | 3 | 1899 | 3 | 0 | 0.772 | 1.03 ± 0.042 | ||||||
| Intra-annual | 15 | 5788 | 11 | 4 | − 0.035 | − 0.057 ± 0.132 | ||||||
| Per trial | 5 | 3128 | 8 | 2 | 0.215 | 0.241 ± 0.130 | ||||||
| Spatial Scale: | 0.179 | 0.673 | 0.23 | 78.18 | 4.58 | 121a | ||||||
| Between patches | 9 | 5936 | 8 | 1 | 0.238 | 0.293 ± 0.239 | ||||||
| Out of patch | 19 | 4879 | 14 | 5 | 0.094 | 0.106 ± 0.107 | ||||||
| Mammals | ||||||||||||
| 26 | 15448 | 20 | 6 | − 0.089 | − 0.101 ± 0.086 | 0.03 | 34.90 | 1.54 | 42a | |||
| Sex: | 1.942 | 0.379 | 0.05 | 44.95 | 1.82 | 42a | ||||||
| Males | 4 | 2636 | 2 | 2 | 0.049 | 0.060 ± 0.173 | ||||||
| Females | 5 | 2113 | 4 | 1 | − 0.308 | − 0.369 ± 0.198 | ||||||
| Males + Females | 17 | 10699 | 14 | 3 | − 0.057 | − 0.060 ± 0.109 | ||||||
| Age: | 2.612 | 0.11 | 0.37 | 39.53 | 1.65 | 42a | ||||||
| Adults | 14 | 14097 | 13 | 1 | − 0.101 | − 0.111 ± 0.122 | ||||||
| Juveniles | 12 | 1351 | 7 | 5 | − 0.074 | − 0.090 ± 0.127 | ||||||
| Migratory behavior | 1.370 | 0.242 | 0.04 | 38.16 | 1.62 | 41a | ||||||
| Migratory | 7 | 9108 | 7 | 0 | − 0.010 | 0.013 ± 0.145 | ||||||
| Non-migratory | 19 | 6340 | 13 | 6 | − 0.118 | − 0.143 ± 0.106 | ||||||
| Study Design: | < 0.001 | 1 | 0.04 | 40.28 | 1.67 | 42a | ||||||
| Natural | 22 | 14206 | 17 | 5 | − 0.089 | − 0.103 ± 0.101 | ||||||
| Manipulated | 4 | 1242 | 3 | 1 | − 0.087 | − 0.090 ± 0.106 | ||||||
| Density Metric: | < 0.001 | 1 | ||||||||||
| Breeding | 0 | 0 | 0 | 0 | – | – | 0.03 | 33.61 | 1.51 | 40a | ||
| Natal | 11 | 2172 | 8 | 3 | − 0.008 | − 0.001 ± 0.148 | ||||||
| Population | 15 | 13736 | 12 | 3 | − 0.148 | − 0.175 ± 0.103 | ||||||
| Density Variable: | 0.122 | 0.727 | 0.04 | 40.36 | 1.68 | 42a | ||||||
| Discrete | 18 | 3791 | 13 | 5 | − 0.086 | − 0.100 ± 0.114 | ||||||
| Continuous | 8 | 11657 | 7 | 1 | − 0.095 | − 0.103 ± 0.125 | ||||||
| Dispersal Metric: | 3.198 | 0.202 | 0.04 | 38.39 | 1.62 | 39a | ||||||
| Distance | 14 | 8809 | 9 | 5 | 0.026 | 0.042 ± 0.116 | ||||||
| Propensity | 6 | 5447 | 6 | 0 | − 0.136 | − 0.142 ± 0.098 | ||||||
| Rate | 6 | 1192 | 5 | 1 | − 0.309 | − 0.394 ± 0.208 | ||||||
| Temporal Scale: | 5.720 | 0.057 | 0.04 | 42.10 | 1.73 | 41a | ||||||
| Inter-annual | 10 | 8735 | 10 | 0 | − 0.024 | 0.031 ± 0.198 | ||||||
| Intra-annual | 15 | 6362 | 9 | 6 | − 0.122 | − 0.138 ± 0.077 | ||||||
| Per trial | 1 | 351 | 1 | 0 | − 0.242 | − 0.247 | ||||||
| Spatial Scale: | < 0.001 | 1 | 0.03 | 35.13 | 1.54 | 41a | ||||||
| Between patches | 12 | 13285 | 9 | 3 | − 0.049 | − 0.037 ± 0.090 | ||||||
| Out of patch | 14 | 2163 | 11 | 3 | − 0.123 | − 0.156 ± 0.142 | ||||||
*P significant at= 0.05; **P significant at= 0.01
aQ significant at= 0.05
Author contributions
N.J. conceived the ideas, extracted the data, conducted the analyses, prepared the figures, and wrote the manuscript with input from D.M.G. Both authors contributed critically to the drafts and gave final approval for publication.
Funding
This research was funded by grants from the Fonds de Recherche du Québec—Nature et technologies (FRQNT) to N.J. and the Natural Sciences and Engineering Research Council (NSERC) of Canada to D.M.G.
Data availability
The dataset used in this study is available on the Dryad Data Repository (https://doi.org/10.5061/dryad.cz8w9gj6c).
Declarations
Competing interests
The authors declare no competing interests.
Footnotes
Publisher's Note
Springer Nature remains neutral with regard to jurisdictional claims in published maps and institutional affiliations.
References
- 1.Addis BR, Lowe WH. Environmentally associated variation in dispersal distance affects inbreeding risk in a stream salamander. Am Nat. 2022;200(6):802–814. doi: 10.1086/721763. [DOI] [PubMed] [Google Scholar]
- 2.Altwegg R, Collingham YC, Erni B, Huntley B. Density-dependent dispersal and the speed of range expansions. Divers Distribut. 2013;19(1):60–68. doi: 10.1111/j.1472-4642.2012.00943.x. [DOI] [Google Scholar]
- 3.Altwegg R, Ringsby TH, Sæther BE. Phenotypic correlates and consequences of dispersal in a metapopulation of house sparrows Passer domesticus. J Anim Ecol. 2000;69(5):762–770. doi: 10.1046/j.1365-2656.2000.00431.x. [DOI] [PubMed] [Google Scholar]
- 4.Azandèmè-Hounmalon GY, Fellous S, Kreiter S, Fiaboe KK, Subramanian S, Kungu M, Martin T. Dispersal behavior of Tetranychus evansi and T. urticae on tomato at several spatial scales and densities: implications for integrated pest management. PloS one. 2014;9(4):e95071. doi: 10.1371/journal.pone.0095071. [DOI] [PMC free article] [PubMed] [Google Scholar]
- 5.Baguette M, Van Dyck H. Landscape connectivity and animal behavior: functional grain as a key determinant for dispersal. Landscape Ecol. 2007;22:1117–1129. doi: 10.1007/s10980-007-9108-4. [DOI] [Google Scholar]
- 6.Baguette M, Clobert J, Schtickzelle N. Metapopulation dynamics of the bog fritillary butterfly: experimental changes in habitat quality induced negative density-dependent dispersal. Ecography. 2011;34(1):170–176. doi: 10.1111/j.1600-0587.2010.06212.x. [DOI] [Google Scholar]
- 7.Baines CB, McCauley SJ, Rowe L. The interactive effects of competition and predation risk on dispersal in an insect. Biol Let. 2014;10(6):20140287. doi: 10.1098/rsbl.2014.0287. [DOI] [PMC free article] [PubMed] [Google Scholar]
- 8.Betini GS, Pardy A, Griswold CK, Norris DR. The role of seasonality and non-lethal carry-over effects on density-dependent dispersal. Ecosphere. 2015;6(12):1–9. doi: 10.1890/ES15-00257.1. [DOI] [Google Scholar]
- 9.Beirinckx K, VanGossum HJ, Lajeunesse MR, Forbes M. Sex biases in dispersal and philopatry: Insights from a meta-analysis based on capture–mark–recapture studies of damselflies. Oikos. 2006;113(3):539–547. doi: 10.1111/j.2006.0030-1299.14391.x. [DOI] [Google Scholar]
- 10.Borenstein M, Hedges LV, Higgins JP, Rothstein HR. Introduction to meta-analysis. John Wiley & Sons; 2021. [Google Scholar]
- 11.Bowler DE, Benton TG. Causes and consequences of animal dispersal strategies: relating individual behaviour to spatial dynamics. Biol Rev. 2005;80(2):205–225. doi: 10.1017/S1464793104006645. [DOI] [PubMed] [Google Scholar]
- 12.Bray Y, Devillard S, Marboutin E, Mauvy B, Peroux R. Natal dispersal of European hare in France. J Zool. 2007;273(4):426–434. doi: 10.1111/j.1469-7998.2007.00348.x. [DOI] [Google Scholar]
- 13.Brook BW, Bradshaw CJ. Strength of evidence for density dependence in abundance time series of 1198 species. Ecology. 2006;87(6):1445–1451. doi: 10.1890/0012-9658(2006)87[1445:SOEFDD]2.0.CO;2. [DOI] [PubMed] [Google Scholar]
- 14.Brøseth H, Tufto J, Pedersen HC, Steen H, Kastdalen L. Dispersal patterns in a harvested willow ptarmigan population. J Appl Ecol. 2005;42(3):453–459. doi: 10.1111/j.1365-2664.2005.01031.x. [DOI] [Google Scholar]
- 15.Burgess SC, Bode M, Leis JM, Mason LB. Individual variation in marine larval-fish swimming speed and the emergence of dispersal kernels. Oikos. 2022;2022(3):e08896. doi: 10.1111/oik.08896. [DOI] [Google Scholar]
- 16.Burgess SC, Treml EA, Marshall DJ. How do dispersal costs and habitat selection influence realized population connectivity? Ecology. 2012;93(6):1378–1387. doi: 10.1890/11-1656.1. [DOI] [PubMed] [Google Scholar]
- 17.Burte V, Cointe M, Perez G, Mailleret L, Calcagno V. When complex movement yields simple dispersal: behavioural heterogeneity, spatial spread and parasitism in groups of micro-wasps. Mov Ecol. 2023;11(1):13. doi: 10.1186/s40462-023-00371-8. [DOI] [PMC free article] [PubMed] [Google Scholar]
- 18.Cahn JW, Hilliard JE. Free energy of a nonuniform system. I. Interfacial free energy. J Chem Phys. 1958;28(2):258–267. doi: 10.1063/1.1744102. [DOI] [Google Scholar]
- 19.Calsbeek R. Sex-specific adult dispersal and its selective consequences in the brown anole, Anolis sagrei. J Anim Ecol. 2009;78(3):617–624. doi: 10.1111/j.1365-2656.2009.01527.x. [DOI] [PubMed] [Google Scholar]
- 20.Carr D, Bowman J, Wilson P. Density-dependent dispersal suggests a genetic measure of habitat suitability. Oikos. 2007;116(4):629–635. [Google Scholar]
- 21.Cayuela H, Schmidt BR, Weinbach A, Besnard A, Joly P. Multiple density-dependent processes shape the dynamics of a spatially structured amphibian population. J Anim Ecol. 2019;88(1):164–177. doi: 10.1111/1365-2656.12906. [DOI] [PubMed] [Google Scholar]
- 22.Chowdhury S, Fuller RA, Dingle HWJW, Zalucki MP. Migration in butterflies: a global overview. Biol Rev. 2021;96(4):1462–1483. doi: 10.1111/brv.12714. [DOI] [PubMed] [Google Scholar]
- 23.Clobert J, Ims RA, Rousset F. Causes, mechanisms and consequences of dispersal. In: Ecology, genetics and evolution of metapopulations (pp. 307–335). Academic Press (2004).
- 24.Clobert J, Le Galliard JF, Cote J, Meylan S, Massot M. Informed dispersal, heterogeneity in animal dispersal syndromes and the dynamics of spatially structured populations. Ecol Lett. 2009;12(3):197–209. doi: 10.1111/j.1461-0248.2008.01267.x. [DOI] [PubMed] [Google Scholar]
- 25.Cohen DS, Murray JD. A generalized diffusion model for growth and dispersal in a population. J Math Biol. 1981;12(2):237–249. doi: 10.1007/BF00276132. [DOI] [Google Scholar]
- 26.Connor WP, Tiffan KF, Plumb JM, Moffitt CM. Evidence for density-dependent changes in growth, downstream movement, and size of Chinook Salmon subyearlings in a large-river landscape. Trans Am Fish Soc. 2013;142(5):1453–1468. doi: 10.1080/00028487.2013.806953. [DOI] [Google Scholar]
- 27.Cook TD, Cooper H, Cordray DS, Hartmann H, Hedges LV, Light RJ, editors. Meta-analysis for explanation: A casebook. London: Russell Sage Foundation; 1992. [Google Scholar]
- 28.Corey DM, Dunlap WP, Burke MJ. Averaging correlations: Expected values and bias in combined Pearson rs and Fisher's z transformations. J Gen Psychol. 1998;125(3):245–261. doi: 10.1080/00221309809595548. [DOI] [Google Scholar]
- 29.Denomme-Brown ST, Cottenie K, Falls JB, Falls E, Brooks RJ, McAdam AG. Variation in space and time: a long-term examination of density-dependent dispersal in a woodland rodent. Oecologia. 2020;193(4):903–912. doi: 10.1007/s00442-020-04728-3. [DOI] [PubMed] [Google Scholar]
- 30.Duckworth RA. Adaptive dispersal strategies and the dynamics of a range expansion. Am Nat. 2008;172(S1):S4–S17. doi: 10.1086/588289. [DOI] [PubMed] [Google Scholar]
- 31.Duval S, Tweedie R. Trim and fill: a simple funnel-plot–based method of testing and adjusting for publication bias in meta-analysis. Biometrics. 2000;56(2):455–463. doi: 10.1111/j.0006-341X.2000.00455.x. [DOI] [PubMed] [Google Scholar]
- 32.Egger M, Smith GD, Schneider M, Minder C. Bias in meta-analysis detected by a simple, graphical test. BMJ. 1997;315(7109):629–634. doi: 10.1136/bmj.315.7109.629. [DOI] [PMC free article] [PubMed] [Google Scholar]
- 33.Fattebert J, Balme G, Dickerson T, Slotow R, Hunter L. Density-dependent natal dispersal patterns in a leopard population recovering from over-harvest. PLoS ONE. 2015;10(4):e0122355. doi: 10.1371/journal.pone.0122355. [DOI] [PMC free article] [PubMed] [Google Scholar]
- 34.Forero MG, Donázar JA, Hiraldo F. Causes and fitness consequences of natal dispersal in a population of black kites. Ecology. 2002;83(3):858–872. doi: 10.1890/0012-9658(2002)083[0858:CAFCON]2.0.CO;2. [DOI] [Google Scholar]
- 35.Fronhofer EA, Gut S, Altermatt F. Evolution of density-dependent movement during experimental range expansions. J Evol Biol. 2017;30(12):2165–2176. doi: 10.1111/jeb.13182. [DOI] [PubMed] [Google Scholar]
- 36.Fuentes D, Rubalcaba JG, Veiga JP, Polo V. Long-term fitness consequences of breeding density in starling colonies: an observational approach. J Ornithol. 2019;160(4):1035–1042. doi: 10.1007/s10336-019-01674-7. [DOI] [Google Scholar]
- 37.Furuya-Kanamori L, Barendregt JJ, Doi SA. A new improved graphical and quantitative method for detecting bias in meta-analysis. JBI Evid Implement. 2018;16(4):195–203. doi: 10.1097/XEB.0000000000000141. [DOI] [PubMed] [Google Scholar]
- 38.Giuggioli L, Kenkre VM. Consequences of animal interactions on their dynamics: emergence of home ranges and territoriality. Mov Ecol. 2014;2(1):1–22. doi: 10.1186/s40462-014-0020-7. [DOI] [PMC free article] [PubMed] [Google Scholar]
- 39.Gonzalez-Bernal E, Brown GP, Shine R. Invasive cane toads: social facilitation depends upon an individual’s personality. PLoS ONE. 2014;9(7):e102880. doi: 10.1371/journal.pone.0102880. [DOI] [PMC free article] [PubMed] [Google Scholar]
- 40.Gu H, Fitt GP, Baker GH. Invertebrate pests of canola and their management in Australia: a review. Aust J Entomol. 2007;46(3):231–243. doi: 10.1111/j.1440-6055.2007.00594.x. [DOI] [Google Scholar]
- 41.Harman RR, Goddard J, Shivaji R, Cronin JT. Frequency of occurrence and population-dynamic consequences of different forms of density-dependent emigration. Am Nat. 2020;195(5):851–867. doi: 10.1086/708156. [DOI] [PubMed] [Google Scholar]
- 42.Hendry AP, Castric V, Kinnison MT, Quinn TP, Hendry A, Stearns S. The evolution of philopatry and dispersal. Evol Illumin Salmon Relat, 52–91 (2004).
- 43.Higgins JP, Thompson SG, Deeks JJ, Altman DG. Measuring inconsistency in meta-analyses. Bmj. 2003;327(7414):557–560. doi: 10.1136/bmj.327.7414.557. [DOI] [PMC free article] [PubMed] [Google Scholar]
- 44.Holyoak M, Casagrandi R, Nathan R, Revilla E, Spiegel O. Trends and missing parts in the study of movement ecology. Proc Natl Acad Sci. 2008;105(49):19060–19065. doi: 10.1073/pnas.0800483105. [DOI] [PMC free article] [PubMed] [Google Scholar]
- 45.Howard WE (1960) Innate and environmental dispersal of individual vertebrates. Am Midland Natl, 152–161.
- 46.Ims RA, Yoccoz NG (1997) Studying transfer processes in metapopulations: emigration, migration, and colonization. In: Metapopulation biology (pp. 247–265). Academic Press
- 47.Jeong SY, Kim TG. Effects of dispersal on species distribution, abundance, diversity and interaction in a bacterial biofilm metacommunity. J Appl Microbiol. 2022;132(1):459–469. doi: 10.1111/jam.15194. [DOI] [PubMed] [Google Scholar]
- 48.Jiao L, Zhang P, Zhang H, Shao D, Yang W, Sun T. Density-dependent dispersal strategy of pollinator moderates the adverse effect of habitat loss on plant reproduction: An integrated model based on pollinators' behavioural response. Funct Ecol. 2023;37(3):732–747. doi: 10.1111/1365-2435.14252. [DOI] [Google Scholar]
- 49.Johst K, Brandl R. Evolution of dispersal: the importance of the temporal order of reproduction and dispersal. Proc R Soc Lond Ser B Biol Sci. 1997;264(1378):23–30. doi: 10.1098/rspb.1997.0004. [DOI] [Google Scholar]
- 50.Joo R, Picardi S, Boone ME, Clay TA, Patrick SC, Romero-Romero VS, Basille M. Recent trends in movement ecology of animals and human mobility. Mov Ecol. 2022;10(1):1–20. doi: 10.1186/s40462-022-00322-9. [DOI] [PMC free article] [PubMed] [Google Scholar]
- 51.Jreidini N, Green DM. Dispersal without drivers: Intrinsic and extrinsic variables have no impact on movement distances in a terrestrial amphibian. Ecol Evol. 2022;12(10):e9368. doi: 10.1002/ece3.9368. [DOI] [PMC free article] [PubMed] [Google Scholar]
- 52.Kareiva PM. Local movement in herbivorous insects: applying a passive diffusion model to mark-recapture field experiments. Oecologia. 1983;57(3):322–327. doi: 10.1007/BF00377175. [DOI] [PubMed] [Google Scholar]
- 53.Lambin X, Aars J, Piertnet SB, et al. Dispersal, intraspecific competition, kin competition and kin facilitation: a review of the empirical evidence. In: Clobert J, et al., editors. Dispersal ecology and evolution. Oxford: Oxford University Press; 2001. pp. 26–272. [Google Scholar]
- 54.Levin SA. Dispersion and population interactions. Am Nat. 1974;108(960):207–228. doi: 10.1086/282900. [DOI] [Google Scholar]
- 55.Lin YTK, Batzli GO. The influence of habitat quality on dispersal, demography, and population dynamics of voles. Ecol Monogr. 2001;71(2):245–275. doi: 10.1890/0012-9615(2001)071[0245:TIOHQO]2.0.CO;2. [DOI] [Google Scholar]
- 56.Lou Y, Martínez S. Evolution of cross-diffusion and self-diffusion. J Biol Dyn. 2009;3(4):410–429. doi: 10.1080/17513750802491849. [DOI] [PubMed] [Google Scholar]
- 57.Lowe WH. What drives long-distance dispersal? A test of theoretical predictions. Ecology. 2009;90(6):1456–1462. doi: 10.1890/08-1903.1. [DOI] [PubMed] [Google Scholar]
- 58.Lutz CL, Diefenbach DR, Rosenberry CS. Population density influences dispersal in female white-tailed deer. J Mammal. 2015;96(3):494–501. doi: 10.1093/jmammal/gyv054. [DOI] [Google Scholar]
- 59.Lyman CP. Hibernation in mammals and birds. Am Sci. 1963;51(2):127–138. [Google Scholar]
- 60.Mabry KE. Effects of sex and population density on dispersal and spatial genetic structure in brush mice. J Mammal. 2014;95(5):981–991. doi: 10.1644/14-MAMM-A-008. [DOI] [Google Scholar]
- 61.Matthysen E. Density-dependent dispersal in birds and mammals. Ecography. 2005;28(3):403–416. doi: 10.1111/j.0906-7590.2005.04073.x. [DOI] [Google Scholar]
- 62.Matthysen E, et al. Multicausality of dispersal: a review. In: Clobert J, et al., editors. Dispersal Ecology and Evolution. Oxford: Oxford University Press; 2012. pp. 3–18. [Google Scholar]
- 63.McIntosh AR, Greig HS, Howard S. Regulation of open populations of a stream insect through larval density dependence. J Anim Ecol. 2022;91(8):1582–1595. doi: 10.1111/1365-2656.13696. [DOI] [PMC free article] [PubMed] [Google Scholar]
- 64.McPeek MA, Holt RD. The evolution of dispersal in spatially and temporally varying environments. Am Nat. 1992;140(6):1010–1027. doi: 10.1086/285453. [DOI] [Google Scholar]
- 65.McKellar AE, Reudink MW, Marra PP, Ratcliffe LM, Wilson S. Climate and density influence annual survival and movement in a migratory songbird. Ecol Evol. 2015;5(24):5892–5904. doi: 10.1002/ece3.1854. [DOI] [PMC free article] [PubMed] [Google Scholar]
- 66.Mishra A, Tung S, Sruti VS, Sadiq MA, Srivathsa S, Dey S. Pre-dispersal context and presence of opposite sex modulate density dependence and sex bias of dispersal. Oikos. 2018;127(11):1596–1604. doi: 10.1111/oik.04902. [DOI] [Google Scholar]
- 67.Molina-Morales M, Martínez JG, Avilés JM. Factors affecting natal and breeding magpie dispersal in a population parasitized by the great spotted cuckoo. Anim Behav. 2012;83(3):671–680. doi: 10.1016/j.anbehav.2011.12.011. [DOI] [Google Scholar]
- 68.Morton ER, McGrady MJ, Newton I, Rollie CJ, Smith GD, Mearns R, Oli MK. Dispersal: a matter of scale. Ecology. 2018;99(4):938–946. doi: 10.1002/ecy.2172. [DOI] [PubMed] [Google Scholar]
- 69.Narang A, Dutta PS. Climate warming and dispersal strategies determine species persistence in a metacommunity. Thyroid Res. 2022;15(1):81–92. [Google Scholar]
- 70.Nakagawa S, Lagisz M, Jennions MD, Koricheva J, Noble DW, Parker TH, O'Dea RE. Methods for testing publication bias in ecological and evolutionary meta-analyses. Methods Ecol Evol. 2022;13(1):4–21. doi: 10.1111/2041-210X.13724. [DOI] [Google Scholar]
- 71.Nams VO. Using animal movement paths to measure response to spatial scale. Oecologia. 2005;143(2):179–188. doi: 10.1007/s00442-004-1804-z. [DOI] [PubMed] [Google Scholar]
- 72.Nathan R, Klein E, Robledo-Arnuncio JJ, Revilla E, et al. Dispersal kernels. In: Clobert J, et al., editors. Dispersal ecology and evolution. Oxford: Oxford University Press; 2012. pp. 187–210. [Google Scholar]
- 73.Newton I. Advances in the study of irruptive migration. Ardea. 2006;94(3):433. [Google Scholar]
- 74.Niu M, Blackwell PG, Skarin A. Modeling interdependent animal movement in continuous time. Biometrics. 2016;72(2):315–324. doi: 10.1111/biom.12454. [DOI] [PubMed] [Google Scholar]
- 75.Pacala SW, Roughgarden J. Spatial heterogeneity and interspecific competition. Theor Popul Biol. 1982;21(1):92–113. doi: 10.1016/0040-5809(82)90008-9. [DOI] [Google Scholar]
- 76.Paradis E, Baillie SR, Sutherland WJ, Gregory RD. Patterns of natal and breeding dispersal in birds. J Anim Ecol. 1998;67(4):518–536. doi: 10.1046/j.1365-2656.1998.00215.x. [DOI] [Google Scholar]
- 77.Pärn H, Ringsby TH, Jensen H, Sæther BE. Spatial heterogeneity in the effects of climate and density-dependence on dispersal in a house sparrow metapopulation. Proc R Soc B Biol Sci. 2012;279(1726):144–152. doi: 10.1098/rspb.2011.0673. [DOI] [PMC free article] [PubMed] [Google Scholar]
- 78.Pernecker B, Czirok A, Mauchart P, Boda P, Móra A, Csabai Z. No experimental evidence for vector-free, long-range, upstream dispersal of adult Asian clams [Corbicula fluminea (Müller, 1774)] Biol Invasions. 2021;23:1393–1404. doi: 10.1007/s10530-020-02446-8. [DOI] [Google Scholar]
- 79.Poethke HJ, Gros A, Hovestadt T. The ability of individuals to assess population density influences the evolution of emigration propensity and dispersal distance. J Theor Biol. 2011;282(1):93–99. doi: 10.1016/j.jtbi.2011.05.012. [DOI] [PubMed] [Google Scholar]
- 80.Postlethwaite CM, Brown P, Dennis TE. A new multi-scale measure for analysing animal movement data. J Theor Biol. 2013;317:175–185. doi: 10.1016/j.jtbi.2012.10.007. [DOI] [PubMed] [Google Scholar]
- 81.R Core Team. 2021. R: A language and environment for statistical computing. R Foundation for Statistical Computing, Vienna, Austria. https://www.R-project.org/.
- 82.Revilla E, Wiegand T. Individual movement behavior, matrix heterogeneity, and the dynamics of spatially structured populations. Proc Natl Acad Sci. 2008;105(49):19120–19125. doi: 10.1073/pnas.0801725105. [DOI] [PMC free article] [PubMed] [Google Scholar]
- 83.Rodrigues AM, Johnstone RA. Evolution of positive and negative density-dependent dispersal. Proc R Soc B Biol Sci. 2014;281(1791):20141226. doi: 10.1098/rspb.2014.1226. [DOI] [PMC free article] [PubMed] [Google Scholar]
- 84.Ronce O. How does it feel to be like a rolling stone? Ten questions about dispersal evolution. Annu Rev Ecol Evol Syst. 2007;38:231–253. doi: 10.1146/annurev.ecolsys.38.091206.095611. [DOI] [Google Scholar]
- 85.Rutherford KL, Cottenie K, Denomme-Brown ST. To go or not to go: variable density-dependent dispersal in small mammals. J Mammal. 2023;104(4):783–791. doi: 10.1093/jmammal/gyac117. [DOI] [Google Scholar]
- 86.Salewski V, Bruderer B. The evolution of bird migration—a synthesis. Naturwissenschaften. 2007;94(4):268–279. doi: 10.1007/s00114-006-0186-y. [DOI] [PubMed] [Google Scholar]
- 87.Schwarzer, G., Carpenter, J. R., Rücker, G., & Schwarzer, M. G. (2023). metasens: Statistical Sensitivity Analysis in Meta-Analysis. R package version 1.5.2. https://CRAN.R-project.org/package=metasens
- 88.Skalski GT, Gilliam JF. A diffusion-based theory of organism dispersal in heterogeneous populations. Am Nat. 2003;161(3):441–458. doi: 10.1086/367592. [DOI] [PubMed] [Google Scholar]
- 89.Song F, Sheldon TA, Sutton AJ, Abrams KR, Jones DR. Methods for exploring heterogeneity in meta-analysis. Eval Health Prof. 2001;24(2):126–151. doi: 10.1177/016327870102400203. [DOI] [PubMed] [Google Scholar]
- 90.Stenseth NC. Causes and consequences of dispersal in small mammals. In: Swingland IR, Greenwood PJ, editors. The ecology of animal movement. Oxford: Clarendon Press; 1983. pp. 63–101. [Google Scholar]
- 91.Sterne JA, Egger M. Funnel plots for detecting bias in meta-analysis: guidelines on choice of axis. J Clin Epidemiol. 2001;54(10):1046–1055. doi: 10.1016/S0895-4356(01)00377-8. [DOI] [PubMed] [Google Scholar]
- 92.Taylor MD, Fairfax AV, Suthers IM. The race for space: Using acoustic telemetry to understand density-dependent emigration and habitat selection in a released predatory fish. Rev Fish Sci. 2013;21(3–4):276–285. doi: 10.1080/10641262.2013.796813. [DOI] [Google Scholar]
- 93.Teichert MA, Foldvik A, Einum S, Finstad AG, Forseth T, Ugedal O. Interactions between local population density and limited habitat resources determine movements of juvenile Atlantic salmon. Can J Fish Aquat Sci. 2017;74(12):2153–2160. doi: 10.1139/cjfas-2016-0047. [DOI] [Google Scholar]
- 94.Travis JM, French DR. Dispersal functions and spatial models: expanding our dispersal toolbox. Ecol Lett. 2000;3(3):163–165. doi: 10.1046/j.1461-0248.2000.00141.x. [DOI] [Google Scholar]
- 95.Travis JM, Murrell DJ, Dytham C. The evolution of density–dependent dispersal. Proc R Soc Lond Ser B Biol Sci. 1999;266(1431):1837–1842. doi: 10.1098/rspb.1999.0854. [DOI] [Google Scholar]
- 96.Van Hezewijk B, Wertman D, Stewart D, Béliveau C, Cusson M. Environmental and genetic influences on the dispersal propensity of spruce budworm (Choristoneura fumiferana) Agric For Entomol. 2018;20(3):433–441. doi: 10.1111/afe.12275. [DOI] [Google Scholar]
- 97.Vicsek T, Zafeiris A. Collective motion. Phys Rep. 2012;517(3–4):71–140. doi: 10.1016/j.physrep.2012.03.004. [DOI] [Google Scholar]
- 98.Viechtbauer W. Conducting meta-analyses in R with the metafor package. J Stat Softw. 2010;36:1–48. doi: 10.18637/jss.v036.i03. [DOI] [Google Scholar]
- 99.Vignoli L, Vuerich V, Bologna MA. Experimental study of dispersal behaviour in a wall lizard species (Podarcis sicula) (Sauria Lacertidae) Ethol Ecol Evol. 2012;24(3):244–256. doi: 10.1080/03949370.2011.643922. [DOI] [Google Scholar]
- 100.Wang S, Altermatt F. Metapopulations revisited: the area-dependence of dispersal matters. Ecology. 2019;100(9):e02792. doi: 10.1002/ecy.2792. [DOI] [PubMed] [Google Scholar]
Additional references cited only in the Appendices
- 101.Aars J, Ims RA. Population dynamic and genetic consequences of spatial density-dependent dispersal in patchy populations. Am Nat. 2000;155(2):252–265. doi: 10.1086/303317. [DOI] [PubMed] [Google Scholar]
- 102.Albrectsen B, Nachman G. Female-biased density-dependent dispersal of a tephritid fly in a fragmented habitat and its implications for population regulation. Oikos. 2001;94(2):263–272. doi: 10.1034/j.1600-0706.2001.940206.x. [DOI] [Google Scholar]
- 103.Andreassen HP, Ims RA. Dispersal in patchy vole populations: role of patch configuration, density dependence, and demography. Ecology. 2001;82(10):2911–2926. doi: 10.1890/0012-9658(2001)082[2911:DIPVPR]2.0.CO;2. [DOI] [Google Scholar]
- 104.Avril A, Léonard Y, Letty J, Péroux R, Guitton JS, Pontier D. Natal dispersal of European hare in a high-density population. Mamm Biol. 2011;76(2):148–156. doi: 10.1016/j.mambio.2010.07.001. [DOI] [Google Scholar]
- 105.Bancroft JS, Smith MT. Dispersal and influences on movement for Anoplophora glabripennis calculated from individual mark-recapture. Entomol Exp Appl. 2005;116(2):83–92. doi: 10.1111/j.1570-7458.2005.00320.x. [DOI] [Google Scholar]
- 106.Bates AJ, Sadler JP, Fowles AP. Condition-dependent dispersal of a patchily distributed riparian ground beetle in response to disturbance. Oecologia. 2006;150(1):50–60. doi: 10.1007/s00442-006-0508-y. [DOI] [PubMed] [Google Scholar]
- 107.Bitume EV, Bonte D, Ronce O, Bach F, Flaven E, Olivieri I, Nieberding CM. Density and genetic relatedness increase dispersal distance in a subsocial organism. Ecol Lett. 2013;16(4):430–437. doi: 10.1111/ele.12057. [DOI] [PubMed] [Google Scholar]
- 108.Bond ML, Lee DE, Ozgul A, Farine DR, König B. Leaving by staying: Social dispersal in giraffes. J Anim Ecol. 2021;90(12):2755–2766. doi: 10.1111/1365-2656.13582. [DOI] [Google Scholar]
- 109.Brunzel S. Increased dispersal rates and distances in density-stressed bush crickets Metriophera brachyptera. Beiträge zur Entomologie Contrib Entomol. 2002;52(1):241–253. doi: 10.21248/contrib.entomol.52.1.241-253. [DOI] [Google Scholar]
- 110.Caley P, Morriss G. Summer/autumn movements, mortality rates and density of feral ferrets (Mustela furo) at a farmland site in North Canterbury New Zealand. New Zeal J Ecol. 2001;25:53–60. [Google Scholar]
- 111.Chaput-Bardy A, Grégoire A, Baguette M, Pagano A, Secondi J. Condition and phenotype-dependent dispersal in a damselfly Calopteryx splendens. PloS one. 2010;5(5):e10694. doi: 10.1371/journal.pone.0010694. [DOI] [PMC free article] [PubMed] [Google Scholar]
- 112.Cote J, Clobert J. Social personalities influence natal dispersal in a lizard. Proc R Soc B Biol Sci. 2007;274(1608):383–390. doi: 10.1098/rspb.2006.3734. [DOI] [PMC free article] [PubMed] [Google Scholar]
- 113.De Bona S, Bruneaux M, Lee AE, Reznick DN, Bentzen P, López-Sepulcre A. Spatio-temporal dynamics of density-dependent dispersal during a population colonisation. Ecol Lett. 2019;22(4):634–644. doi: 10.1111/ele.13205. [DOI] [PubMed] [Google Scholar]
- 114.De Meester N, Bonte D. Information use and density-dependent emigration in an agrobiont spider. Behav Ecol. 2010;21(5):992–998. doi: 10.1093/beheco/arq088. [DOI] [Google Scholar]
- 115.De Roissart A, Wang S, Bonte D. Spatial and spatiotemporal variation in metapopulation structure affects population dynamics in a passively dispersing arthropod. J Anim Ecol. 2015;84(6):1565–1574. doi: 10.1111/1365-2656.12400. [DOI] [PubMed] [Google Scholar]
- 116.DiLeo MF, Nonaka E, Husby A, Saastamoinen M. Effects of environment and genotype on dispersal differ across departure, transfer and settlement in a butterfly metapopulation. Proc R Soc B. 2022;289(1976):20220322. doi: 10.1098/rspb.2022.0322. [DOI] [PMC free article] [PubMed] [Google Scholar]
- 117.Einum S, Sundt-Hansen LH, Nislow K. The partitioning of density-dependent dispersal, growth and survival throughout ontogeny in a highly fecund organism. Oikos. 2006;113(3):489–496. doi: 10.1111/j.2006.0030-1299.14806.x. [DOI] [Google Scholar]
- 118.Endriss SB, Vahsen ML, Bitume EV, Grey Monroe J, Turner KG, Norton AP, Hufbauer RA. The importance of growing up: juvenile environment influences dispersal of individuals and their neighbours. Ecol Lett. 2019;22(1):45–55. doi: 10.1111/ele.13166. [DOI] [PubMed] [Google Scholar]
- 119.Enfjäll K, Leimar O. Density-dependent dispersal in the Glanville fritillary. Melitaea cinxia Oikos. 2005;108(3):465–472. doi: 10.1111/j.0030-1299.2005.13261.x. [DOI] [Google Scholar]
- 120.Gaillard JM, Hewison AJM, Kjellander P, Pettorelli N, Bonenfant C, Van Moorter B, Vanpé C. Population density and sex do not influence fine-scale natal dispersal in roe deer. Proc R Soc B Biol Sci. 2008;275(1646):2025–2030. doi: 10.1098/rspb.2008.0393. [DOI] [PMC free article] [PubMed] [Google Scholar]
- 121.Galib SM, Sun J, Twiss SD, Lucas MC. Personality, density and habitat drive the dispersal of invasive crayfish. Sci Rep. 2022;12(1):1114. doi: 10.1038/s41598-021-04228-1. [DOI] [PMC free article] [PubMed] [Google Scholar]
- 122.Gamble LR, McGarigal K, Compton BW. Fidelity and dispersal in the pond-breeding amphibian, Ambystoma opacum: implications for spatio-temporal population dynamics and conservation. Biol Cons. 2007;139(3–4):247–257. doi: 10.1016/j.biocon.2007.07.001. [DOI] [Google Scholar]
- 123.Ims RA, Andreassen HP. Density-dependent dispersal and spatial population dynamics. Proc R Soc B Biol Sci. 2005;272(1566):913–918. doi: 10.1098/rspb.2004.3025. [DOI] [PMC free article] [PubMed] [Google Scholar]
- 124.Itonaga N, Ulrich K, Plath M, Wallschlaeger D. Declines in breeding site fidelity in an increasing population of White Storks Ciconia ciconia. Ibis. 2011;153(3):636–639. doi: 10.1111/j.1474-919X.2011.01131.x. [DOI] [Google Scholar]
- 125.Kim SY, Torres R, Drummond H. Simultaneous positive and negative density-dependent dispersal in a colonial bird species. Ecology. 2009;90(1):230–239. doi: 10.1890/08-0133.1. [DOI] [PubMed] [Google Scholar]
- 126.Kopsala E, Kyle C, Howe E, Potter D, Beauclerc K, Northrup JM. Broad-scale genetic monitoring suggests density-dependent dispersal in a large carnivore. Oikos. 2023;7:e09442. doi: 10.1111/oik.09442. [DOI] [Google Scholar]
- 127.Kuussaari M, Rytteri S, Heikkinen RK, Heliölä J, von Bagh P. Weather explains high annual variation in butterfly dispersal. Proc R Soc B: Biol Sci. 2016;283(1835):20160413. doi: 10.1098/rspb.2016.0413. [DOI] [PMC free article] [PubMed] [Google Scholar]
- 128.Liebgold EB, Gerlach NM, Ketterson ED. Density-dependent fitness, not dispersal movements, drives temporal variation in spatial genetic structure in dark-eyed juncos (Junco hyemalis) Mol Ecol. 2019;28(5):968–979. doi: 10.1111/mec.15040. [DOI] [PubMed] [Google Scholar]
- 129.Loe LE, Mysterud A, Veiberg V, Langvatn R. Negative density-dependent emigration of males in an increasing red deer population. Proc R Soc B Biol Sci. 2009;276(1667):2581–2587. doi: 10.1098/rspb.2009.0224. [DOI] [PMC free article] [PubMed] [Google Scholar]
- 130.Luna Á, Palma A, Sanz-Aguilar A, Tella JL, Carrete M. Sex, personality and conspecific density influence natal dispersal with lifetime fitness consequences in urban and rural burrowing owls. PLoS ONE. 2020;15(2):e0226089. doi: 10.1371/journal.pone.0226089. [DOI] [PMC free article] [PubMed] [Google Scholar]
- 131.Maag N, Cozzi G, Clutton-Brock T, Ozgul A. Density-dependent dispersal strategies in a cooperative breeder. Ecology. 2018;99(9):1932–1941. doi: 10.1002/ecy.2433. [DOI] [PubMed] [Google Scholar]
- 132.Marjamäki PH, Contasti AL, Coulson TN, McLoughlin PD. Local density and group size interacts with age and sex to determine direction and rate of social dispersal in a polygynous mammal. Ecol Evol. 2013;3(9):3073–3082. doi: 10.1002/ece3.694. [DOI] [PMC free article] [PubMed] [Google Scholar]
- 133.Mayer M, Zedrosser A, Rosell F. When to leave: the timing of natal dispersal in a large, monogamous rodent, the Eurasian beaver. Anim Behav. 2017;123:375–382. doi: 10.1016/j.anbehav.2016.11.020. [DOI] [Google Scholar]
- 134.Navarro AM, Marchán DF, Trigo D. Reasons to move far away: studying the drivers of Carpetania matritensis (Hormogastridae: Crassiclitelatta) dispersal behaviour. Pedobiologia. 2022;95:150841. doi: 10.1016/j.pedobi.2022.150841. [DOI] [Google Scholar]
- 135.Nicolaus M, Michler SP, Jalvingh KM, Ubels R, van der Velde M, Komdeur J, Tinbergen JM. Social environment affects juvenile dispersal in great tits (Parus major) J Anim Ecol. 2012;81(4):827–837. doi: 10.1111/j.1365-2656.2012.01959.x. [DOI] [PubMed] [Google Scholar]
- 136.Nowicki P, Vrabec V. Evidence for positive density-dependent emigration in butterfly metapopulations. Oecologia. 2011;167(3):657–665. doi: 10.1007/s00442-011-2025-x. [DOI] [PMC free article] [PubMed] [Google Scholar]
- 137.Öst M, Lehikoinen A, Jaatinen K, Kilpi M. Causes and consequences of fine-scale breeding dispersal in a female-philopatric species. Oecologia. 2011;166(2):327–336. doi: 10.1007/s00442-010-1855-2. [DOI] [PubMed] [Google Scholar]
- 138.Ousterhout BH, Semlitsch RD. Effects of conditionally expressed phenotypes and environment on amphibian dispersal in nature. Oikos. 2018;127(8):1142–1151. doi: 10.1111/oik.05276. [DOI] [Google Scholar]
- 139.Paris D, Nicholls AO, Hall A, Harvey A, Massaro M. Female-biased dispersal in a spatially restricted endemic island bird. Behav Ecol Sociobiol. 2016;70(12):2061–2069. doi: 10.1007/s00265-016-2210-3. [DOI] [Google Scholar]
- 140.Pasinelli G, Walters JR. Social and environmental factors affect natal dispersal and philopatry of male red-cockaded woodpeckers. Ecology. 2002;83(8):2229–2239. doi: 10.1890/0012-9658(2002)083[2229:SAEFAN]2.0.CO;2. [DOI] [Google Scholar]
- 141.Pittman SE, Osbourn MS, Semlitsch RD. Movement ecology of amphibians: a missing component for understanding population declines. Biol Cons. 2014;169:44–53. doi: 10.1016/j.biocon.2013.10.020. [DOI] [Google Scholar]
- 142.Puzin C, Bonte D, Pétillon J. Influence of individual density and habitat availability on long-distance dispersal in a salt-marsh spider. Ethol Ecol Evol. 2019;31(1):28–37. doi: 10.1080/03949370.2018.1486888. [DOI] [Google Scholar]
- 143.Rouquette JR, Thompson DJ. Patterns of movement and dispersal in an endangered damselfly and the consequences for its management. J Appl Ecol. 2007;44(3):692–701. doi: 10.1111/j.1365-2664.2007.01284.x. [DOI] [Google Scholar]
- 144.Serrano D, Cortés-Avizanda A, Zuberogoitia I, Blanco G, Benítez JR, Ponchon C, Donázar JA. Phenotypic and environmental correlates of natal dispersal in a long-lived territorial vulture. Sci Rep. 2021;11(1):5424. doi: 10.1038/s41598-021-84811-8. [DOI] [PMC free article] [PubMed] [Google Scholar]
- 145.Scandolara C, Lardelli R, Sgarbi G, Caprioli M, Ambrosini R, Rubolini D, Saino N. Context-, phenotype-, and kin-dependent natal dispersal of barn swallows (Hirundo rustica) Behav Ecol. 2014;25(1):180–190. doi: 10.1093/beheco/art103. [DOI] [Google Scholar]
- 146.Støen OG, Zedrosser A, Sæbø S, Swenson JE. Inversely density-dependent natal dispersal in brown bears Ursus arctos. Oecologia. 2006;148(2):356–364. doi: 10.1007/s00442-006-0384-5. [DOI] [PubMed] [Google Scholar]
- 147.Zimmermann F, Breitenmoser-Würsten C, Breitenmoser U. Natal dispersal of Eurasian lynx (Lynx lynx) in Switzerland. J Zool. 2005;267(4):381–395. doi: 10.1017/S0952836905007545. [DOI] [Google Scholar]
Associated Data
This section collects any data citations, data availability statements, or supplementary materials included in this article.
Supplementary Materials
Data Availability Statement
The dataset used in this study is available on the Dryad Data Repository (https://doi.org/10.5061/dryad.cz8w9gj6c).