Abstract
Background
The FXYD domain-containing ion transport regulator 5 (FXYD5) gene is a cancer promoter. However, evidence for an association between FXYD5 and various types of cancer is still lacking. Using multi-omics bioinformatics, our study aimed to reveal the expression distribution, prognostic value, immune infiltration correlation, and molecular functions of FXYD5.
Methods
Using pan-cancer multi-omics data (including The Cancer Genome Atlas, PrognoScan, Gene Expression Profiling Interactive Analysis, cBioPortal, Gene Expression Omnibus, TIMER and scTIME Portal), we assessed the differences in the expression and prognostic value of FXYD5 in malignant tumors. Furthermore, at the single-cell level, we analyze the expression distribution of FXYD5 across different cell types within the tumor microenvironment, and its relationship with the immune microenvironment. Finally, focusing on ovarian cancer, we conducted preliminary validation of the above findings using cell and molecular biology techniques.
Results
Our results indicated that FXYD5 was up-regulated in various tumor types and was positively associated with tumor progression. We also revealed that FXYD5 was ubiquitously expressed in microenvironmental cells at the single-cell level, and its upregulation was associated with enhanced immune infiltration, cancer-associated fibroblast infiltration, and dysfunction of tumor-infiltrating cytotoxic T lymphocyte. Additionally, its expression was positively correlated with immune checkpoint genes, DNA mismatch repair genes, MSI (microsatellite instability) and TMB (tumor mutational burden) across various cancers. Its higher expression in cytotoxic T lymphocytes attenuated its ability to predict patient survival with PD-L1 (programmed death-ligand 1) blockade therapy, and FXYD5 was found to be a potential regulator of tumor immune escape and resistance to cancer immunotherapies. Based on GSEA (gene set enrichment analysis) and experimental verification, FXYD5 activated TGF‐β/SMAD signaling and drove EMT (epithelial-mesenchymal transition) to promote ovarian cancer progression.
Conclusion
In summary, our study revealed that FXYD5-TGFβ axis may coregulate the interaction between tumors, CAFs (carcinoma-associated fibroblasts) and immune cells to reshape the tumor immune microenvironment and promote tumorigenesis and tumor progression. Thus, FXYD5 could be used as an immune-related biomarker for diagnosing and predicting the prognosis of multiple cancer types. Therefore, our findings suggest that targeting FXYD5 in TME (tumor microenvironment) may be a promising therapeutic strategy.
Keywords: FXYD5, Pan-cancer, Prognosis, Tumor immunity, Tumor immune microenvironment
Graphical abstract
1. Introduction
Globally, malignant tumors are a major cause of death, have a significant impact on public health and have attracted much attention. Given the complexity of tumorigenesis and the continued poor prognosis and survival rate, pan-cancer expression analysis is essential for exploring potential biomarkers and evaluating their associations with survival prognosis and molecular functions.
Enhanced TGFβ signaling potentiates cancer metastasis, stem cell properties, and anticancer drug resistance. Released by malignant cells, carcinoma-associated fibroblasts (CAFs), and other cells in the tumor microenvironment (TME), TGF-β is a crucial enforcer of tumor progression by reshaping the tumor microarchitecture and repressing the tumor killing effect of immune cells. Currently, TGFβ signaling blockade is being evaluated in multiple clinical trials to improve the efficacy of cancer immunotherapies based on immune checkpoint blockade (ICB) [1].
Our previous research indicated that, in ovarian cancer, by interacting with TGF-β/SMAD signaling, FXYD5 drives EMT and further promotes tumor progression [2].
FXYD5 (FXYD domain-containing ion transport regulator 5) is a single-span membrane-penetrating protein that functions as a Na+/K + -ATPase subunit [3,4]. It has been identified as a tumor promoter protein that inactivates E-cadherin or a novel E-cadherin-independent mechanism to enhance tumor progression and metastasis [5].
Although the up-regulation of FXYD5 has been demonstrated in several cancer types and correlated with worse prognosis [[6], [7], [8]], there is still no comprehensive evidence on the association between FXYD5 expression and pan-cancer based on large-scale data mining of medical cases. Gaining better insight into the regulatory functions of FXYD5 distribution and its molecular functions may aid in identifying new potential therapeutic targets and evaluating cancer prognosis.
This study systematically evaluated FXYD5 expression, genetic alterations, and the prognostic landscape across cancers at the single-cell and bulk tumor levels, using multiple datasets, including TCGA, UALCAN (the University of ALabama at Birmingham CANcer data analysis Portal), GEPIA, PrognoScan, Kaplan‒Meier Plotter, cBioPortal, GEO and the HPA (the Human Protein Atlas). We then examined the potential correlations between FXYD5 expression levels and tumor immune infiltration, immune checkpoint genes, TMB and MSI. We also investigated the molecular function and pathways of FXYD5 in ovarian cancer using KEGG (the Kyoto Encyclopedia of Genes and Genomes), GSVA (Gene Set Variation Analysis) and GSEA. We found that FXYD5 was over-expressed in most tumor types, and was correlated with worse overall survival in various tumors, including ovarian cancer. FXYD5 upregulation was positively correlated with increased infiltration of immune cells, immune checkpoint genes, and other components of the TME. The poor prognosis of FXYD5 may be attributed to its vital role in promoting an immunosuppressive tumor microenvironment. In addition, the scTIME Portal and TIDE (Tumor Immune Dysfunction and Exclusion) database were used to evaluate the distribution of FXYD5 expression in various cell types in the TME across cancer types and its correlation with immunotherapy effects. Finally, we provided novel understanding of the molecular functions of FXYD5 in ovarian cancer.
2. Materials and methods
2.1. Data collection
Pan-cancer transcriptome data with clinical features were obtained from the publicly available TCGA database (https://portal.gdc.cancer.gov/) and the corresponding normal tissue information from GTEx (the Genotype-Tissue Expression) database (https://gtexportal.org/) was downloaded. The “expression DIY” module in GEPIA (http://gepia.cancer-pku.cn/) was used to compare the expression differences of FXYD5 across pan-cancer and normal tissues, with or without GTEx data. A TNMplot (https://tnmplot.com/analysis/) was used to plot FXYD5 differential expression in normal, primary and metastatic tumor tissues. We normalized the expression data using log2 (FPKM+1) z-scores to exclude bias.
2.2. Protein level analysis
We examined the protein expression levels of FXYD5 in pan-cancer tissues and corresponding normal tissues by using the HPA database (https://www.proteinatlas.org).The HPA is a Swedish-based program initiated in 2003 to map all the human proteins in cells, tissues, and organs using an integration of various omics technologies, including antibody-based imaging, mass spectrometry-based proteomics, transcriptomics, and systems biology, of which the “Pathology” section contains pathology information based on mRNA and protein expression data from 17 different forms of human cancer, together with millions of in-house generated immunohistochemically stained tissue sections images and Kaplan-Meier plots showing the correlation between mRNA expression of each human protein gene and cancer patient survival [9]. We input “FXYD5” in the search box and then click on the pathology section to obtain the expression status of FXYD5 protein in pan-cancer types based on the IHC (immunohistochemistry) technique. The STRING database (https://string-db.org/) was used to display PPI (Protein-Protein Interaction) networks, and similarly, by entering “FXYD5” in the search box and clicking search, to obtain the FXYD5 protein interaction network.
2.3. Survival analysis
We performed Univariate Cox regression analysis to investigate the association between FXYD5 expression and PFS (progression free survival), DFS (disease free survival), OS (overall survival) and DSS (disease-specific survival) across pan-cancer, of which the results were visualized using the “Forest plot” R package. In addition, Kaplan–Meier curves were constructed using PrognoScan (http://dna00.bio.kyutech.ac.jp/PrognoScan/index.html) and GEPIA (http://gepia.cancer-pku.cn/) [10]. The methods for using the above two data platforms are the same: typing “FXYD5” into the search box to access its survival prognosis information across various cancer types. Statistical significance was set at P < 0.05.
2.4. Genetic alteration analysis
We employed the cBioPortal (https://www.cbioportal.org/) platform to characterize genetic variants, such as genomic alteration frequency, mutation types, and copy number alterations of FXYD5 at the pan-cancer levels [11]. Thereafter, Kaplan Meier survival curves were designed to explore the OS, DSS, PFS and DFS differences with or without FXYD5 genetic alteration across pan-cancer. We enter “FXYD5” in the search box to query its gene mutation and expression status at the pan-cancer level (https://docs.cbioportal.org/user-guide/overview/).
2.5. Enrichment analysis
In this study, we downloaded gene sets from the Molecular Signatures Database, and performed a comprehensive score analysis for each gene set using the GSVA algorithm to assess the changes in the function of biomolecules across various samples. RNA sequencing expression (level 3) profiles and the corresponding clinical information for FXYD5 were downloaded from the TCGA dataset(https://portal.gdc.com). R software GSVA package was used to analyze, choosing parameter as method = 'ssgsea'. The correlation between genes and pathway scores was analyzed using Spearman's correlation [12,13].
GSEA is a robust method for analyzing molecular profiling data. To evaluate the biological pathways involved in FXYD5 expression, tumor samples were divided into high and low FXYD5 subgroups. The enrichment score (ES) of KEGG pathways and hallmarks of cancer were calculated using GSEA software (version 4.1.0). KEGG gene sets and hallmark gene sets were curated from the Molecular Signature Database (MSigDB; version 3.0; http://www.broadinstitute.org/msigdb) which offers the most extensive gene sets for GSEA. The significance level of the ES was estimated using an empirical phenotype-based permutation test. The estimated significance was corrected using multiple hypothesis testing. ES was normalized for each gene set to yield a normalized enrichment score (NES). The false discovery rate corresponding to each NES was determined by comparing of the tails of the investigated and null distributions for the NES.
All analysis methods and R packages were implemented in R version 4.0.3. Statistical significance was set at P < 0.05.
2.6. Immune infiltration and immune modulator genes analysis
Using TISIDB (http://cis.hku.hk/TISIDB/index.php), the transcriptional expression correlation between FXYD5 and immune-related genes was also investigated pan-cancer, including genes encoding chemokines, chemokine receptors, and immunosuppressive and major histocompatibility complex proteins [14]. The ESTIMATE algorithm was also used to assess stromal, immune, and estimate scores.
The immune infiltration algorithm is provided by the R package “estimate” and uses internally provided markers to calculate the stromal and immune scores of transcriptomes or expression array data. The algorithm calculates the scores of immune cells in tissues to determine the composition of immune cells within the tissues [15].
By use of TIMER 2.0 (http://timer.cistrome.org/), the Gene module allows users to select any gene of interest and visualize the correlation of its expression with immune and stromal cell infiltration levels across all TCGA tumors [16].Furthermore, a R software package (immuneeconv) incorporating six latest algorithms (TIMER, CIBERSORT, MCP-counter, xCell, EPIC, and quanTIseq) was used to evaluate the reliability of the immune cells infiltration score subtypes based on FXYD5 expression. These algorithms were benchmarked, and each had a unique advantage.
2.7. Single cell level analysis
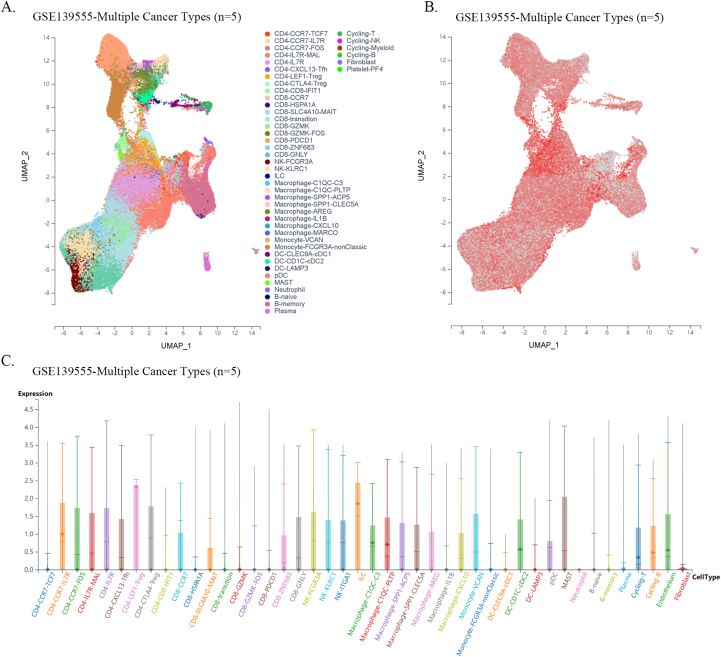
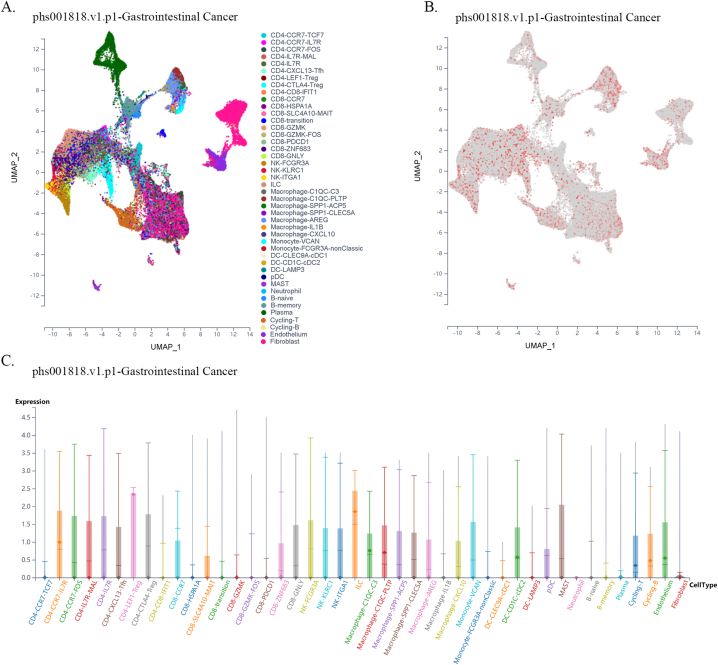
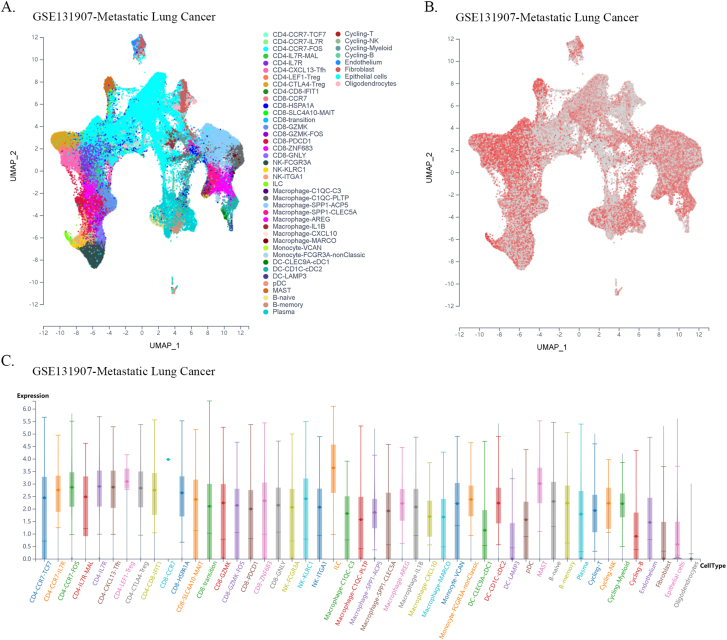
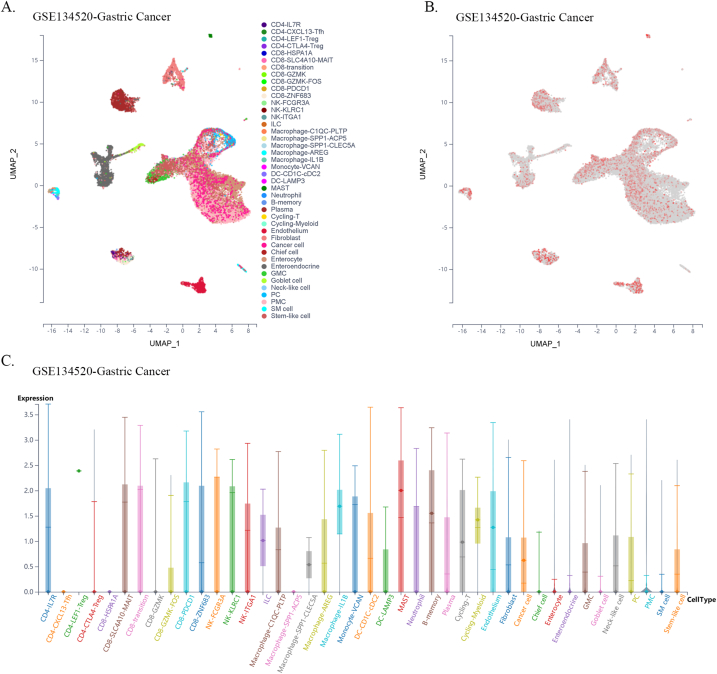
Single-cell transcriptomes of the tumor immune microenvironment (TIME) across all cancers were stored and accessed using the scTIME Portal (http://sctime.sklehabc.com/#/search) [17]. The portal implemented tumor immune microenvironment specific analysis modules to allow data exploration. A violin plot of FXYD5 expression across different cell clusters per tumor type was used to evaluate cell expression distribution. FXYD5 expression in specific cell type and other cell composition correlations were also explored.
2.8. Immune checkpoint blockade (ICB) therapy response prediction
The TIDE (Tumor Immune Dysfunction and Exclusion, http://tide.dfci.harvard.edu) [18] algorithm was used to predict the potential ICB response and to estimate the role of FXYD5 expression in the dysfunction of tumor-infiltrating cytotoxic T lymphocyte (CTL).
2.9. TMB, MSI and DNA repair genes analysis
The relationship between FXYD5 expression and five MMR (mis-match repair) genes (including EPCAM, PMS2, MLH1, MSH2, and MSH6), TMB and MSI was evaluated using transcriptome data from TCGA and performed using Spearman's method. RNA sequencing expression (level 3) profiles and the corresponding clinical information were downloaded from the TCGA dataset (https://portal.gdc.com). Spearman's correlation analysis was used to describe the correlation between quantitative variables without a normal distribution. P values less than 0.05 were considered statistically significant (*P < 0.05) [19].
2.9.1. Cell culture
OVCAR5, an ovarian cancer cell line, was purchased from the ATCC (American Type Culture Collection). The cell culture was performed in an incubator at 37 °C with 5 % CO2 and maintained in RPMI 1640 with 10 % FBS.
2.10. Plasmids and short hairpin RNA (shRNA)
Human FXYD5 shRNA and the negative control, which were expressed in the GV248 backbone, were obtained from GeneChem, Inc. Among five identified shRNAs, the two most effective were used for further experiments, and the target sequences are presented in Supplementary Table 1.
2.11. Western Blotting analysis
Briefly, we extracted protein by use of RIPA lysis buffer containing protease and phosphatase inhibitors. By use of a bicinchoninic acid (BCA) assay reagent kit, we measured protein concentration of the supernatants and then the total proteins were separated by SDS-PAGE (8.12 % gel), and then reacted on PVDF membranes 0.22 or 0.45 mm in diameter. By use of 5 % BSA or 5 % milk, the membranes were blocked at 4 °C overnight, followed by incubated with primary antibodies at 4 °C for 12 h. Then, after incubating with the secondary antibody at RT for 2 h, ECL Western Blotting was used to identify the membranes. The antibodies used in this study are detailed in Supplementary Table 2.
2.12. Transwell assays
Briefly, for migration assays, 4 × 10⁴ cells were planted in the upper side of chamber without Matrigel coated membrane, and for invasion tests, chamber was planted with Matrigel. DMEM supplemented with 20 % FBS in the lower side of chamber was used as a chemo‐attractant. Following incubation for 8–24 h at 37 °C, the remaining cells in the upper side of chamber were removed with a sterile cotton swab, whereas the penetrated cells on the lower side of the membrane were fixed and stained with methanol containing 0.1 % crystal violet. Finally, the number of migrating and invading cells was counted in five randomly selected fields, and the average number of cells was calculated.
2.13. Statistical analyses
A Student's t-test was applied to identify the FXYD5 expression levels in different datasets. We also used Kruskal-Wallis Test to research the correlation of FXYD5 expression with clinical and pathological characteristics. For survival analysis, we used univariate Cox regression analysis to calculated the HR and p value. Also, we compared the OS between FXYD5 groups with higher and lower expression levels using Kaplan-Meier curves and log-rank tests. The correlation between variables was assessed using Spearman's correlation coefficient. A difference was considered significant if P values were less than 0.05.
3. Result
3.1. Pan-cancer expression landscape of FXYD5
To explore the possible role of FXYD5 in tumorigenesis, we first analyzed FXYD5 expression in tumor and adjacent normal tissues across 33 cancer types in TCGA. As shown in Fig. S1A, compared with adjacent normal tissues, FXYD5 displayed markedly increased expression in 12 tumor types, including CHOL, ESCA, COAD, HNSC, GBM, KIRC, KIRP, LIHC, READ, PCPG, THCA, and STAD, and was markedly downregulated in 4 tumor types, including LUSC, KICH, PRAD and UCEC (Supplementary Fig. S1A). A combination of TCGA and GTEx data was used to evaluate the expression of FXYD5 in tumors and normal tissues. As shown in Fig. 1A, FXYD5 expression in BLCA, COAD, CHOL, ESCA, HNSC, GBM, KIRP, KIRC, LGG, LAML, LIHC, PAAD, OV, READ, STAD, SKCM, THCA and TGCT was significantly up-regulated compared with that in the corresponding normal controls. In contrast, FXYD5 expression was downregulated in KICH, LUSC, LUAD, THYM, PRAD, UCS and UCEC. Further evaluation of FXYD5 protein expression using the HPA database and IHC staining demonstrated that FXYD5 protein expression was significantly upregulated in stomach cancer, colorectal cancer, melanoma, pancreatic cancer, testis cancer, urothelial cancer, lymphoma, cervical cancer, lung cancer, head and neck cancer and ovarian cancer (Fig. 1B, Supplementary Fig. S1B).
Fig. 1.
FXYD5 expression profiles in pan-cancer. (A)FXYD5 transcriptional level in tumor and normal tissues across pan-cancer data of TCGA and GTEx data. (B) The protein level of FXYD5 in HPA database. (C) FXYD5 transcriptional level between different clinical stages. (D) FXYD5 transcriptional level in normal, tumor and metastatic tissues in TCGA database. Data were shown as mean +− SD. *P < 0.05, **P < 0.01, ***P < 0.001, ****P < 0.0001.
We also employed the “Pathological Stage Plot” module to evaluate trends in FXYD5 mRNA expression across multiple cancer stages and observed an increasing tendency as the tumor progressed in KIRC, TGCT and THCA. However, there was a downward trend in FXYD5 expression in DLBC and KICH (Fig. 1C).
To determine the role of FXYD5 in tumor metastasis, we compared the differential expression among normal, primary tumor and metastatic tissues using data from the TNMplot. According to our findings, higher levels of FXYD5 were associated with metastasis in BRCA, COAD, THCA, and SKCM (Fig. 1D). Although higher than that in normal tissue, there was no elevated expression of FYXD5 in metastatic tissues compared with that in the corresponding primary tumor tissues in OV, PAAD, LUAD/LUSC, and KIRC/KIRP (Supplementary Fig. S1C).
These results indicate that FXYD5 is upregulated in many malignant tumor types and potentially plays a pivotal role in promoting tumor progression.
3.2. Pan-cancer analysis of the prognostic significance of FXYD5
Using TCGA and GEO datasets, we assessed the prognostic significance of FXYD5 expression. Survival metrics were DSS, DFS, OS, PFS and distant metastasis-free survival (DMFS). Survival data from TCGA were first analyzed using Cox regression analysis (P > 0.05), and Kaplan-Meier plots were created using the Kaplan-Meier plotter tool (Fig. 2 and Supplementary Fig. S2). For OS, higher FXYD5 expression was remarkably correlated with poor OS among seven tumor types, including GBM (HR = 1.40, P = 0.04, n = 162), LGG (HR = 1.8, P = 0.0014, n = 514), LUAD (HR = 1.4, P = 0.018, n = 478), LUSC (HR = 1.4, P = 0.024, n = 482), MESO (HR = 2.0, P = 0.0037, n = 82), UVM (HR = 6.7, P = 0.0001, n = 78) and OV (HR = 1.3, P = 0.025, n = 424) in TCGA database (Fig. 2A). For DFS, increased expression of FXYD5 indicated adverse outcomes in three cancer types: COAD (HR = 1.6, P = 0.041, n = 270), HNSC (HR = 1.5, P = 0.012, n = 518), and LGG (HR = 1.6, P = 0.0017, n = 514) (Fig. 2B). Regarding PFS, FXYD5 up-regulation was significantly associated with poor OS in KIRC (HR = 1.9, P = 0.0001, n = 516), LGG (HR = 1.7, P = 0.0005, n = 514), MESO (HR = 1.8, P = 0.036, n = 82) and READ (HR = 2.0, P = 0.039, n = 92) (Supplementary Fig. S2A). DSS revealed a correlation between FXYD5 and the prognosis of HNSC (HR = 1.7, P = 0.005, n = 518), KIRC (HR = 2.5, P = 0.0001, n = 516), LGG (HR = 1.8, P = 0.0023, n = 514), OV (HR = 1.4, P = 0.02, n = 424), READ (HR = 3.3, P = 0.048, n = 92) and UVM (HR = 3.3, P = 0.015, n = 78) (Supplementary Fig. S2B).
Fig. 2.
Prognosis value of FXYD5 across pan-cancer. (A) Kaplan–Meier analysis of FXYD5 expression for patient OS in TCGA database. (B) Kaplan–Meier analysis of FXYD5 expression for patient DFS in TCGA database.
Using the PrognoScan database, mostly from the GEO database, we further assessed FXYD5-related survival. FXYD5 expression was remarkably associated with the survival of five tumor types: BRCA, COAD, glioma, LUAD and OV. As shown in Fig. 3, FXYD5 had a detrimental role in four tumor types, including COAD (DFS, HR = 2.65, P = 0.018532, n = 87), glioma (OS, HR = 2.18, P = 0.000663, n = 54), LUAD (OS, HR = 2.40, P = 0.013409, n = 204; RFS, HR = 2.12, P = 0.018630, n = 204), and OV (OS, HR = 1.38, P = 0.012615, n = 278). FXYD5 played a protective role against BRCA when associated with OS (HR = 0.68, P = 0.017968), RFS (HR = 0.55, P = 0.001577), and DMFS (Distant Metastasis-Free Survival) (HR = 0.32, P = 0.003708).
Fig. 3.
The prognosis value of FXYD5 in pan-cancer in GEO database. (A–H) Kaplan–Meier analysis of FXYD5 expression for prognosis in various tumor types. FXYD5 expression was grouped by the median. Meaningless results were omitted.
Finally, these results indicate that higher expression of FXYD5 predicts poor prognosis for most malignant tumors, suggesting its potential application in predicting patient prognosis. It is particularly important to note that in predicting patient survival based on the level of FXYD5 expression, we grouped patients according to the median expression of FXYD5. However, if we were to select the FXYD5 expression threshold for patient grouping based on the best prognostic differentiation outcome, additional tumor types could be included where high FXYD5 expression is predictive of a poor prognosis.
3.3. Pan-cancer analysis of the genetic alteration and its prognosis value of FXYD5
We investigated the genetic alteration frequencies and types of FXYD5 across cancers using the cBioPortal database (ICGC/TCGA, Nature 2020, Pan-Cancer Atlas, n = 2922). As shown in Fig. 4, amplification was the most common genetic alteration type of FXYD5, which was much higher than the mutations and deep deletion types (Fig. 4A). The amplification frequency was the highest (>15 %) among ovarian, endometrial, cervical, and pancreatic cancer cases (Fig. 4A). Additionally, as shown in Fig. 4B, amplification of FXYD5 significantly increased its mRNA expression. The FXYD5 mutation types, sites, and numbers of cases across cancers are shown in Fig. 4C. We discovered that missense mutations (n = 14 out of 16 total mutation cases) in FXYD5 were the main genetic alteration pattern. Additionally, we examined the prognostic value of FXYD5 genetic alterations across pan-cancer. The results demonstrated that patients with tumors with genetic alterations (mainly amplification) of FXYD5 had worse OS (P = 7.798e-3), DSS (P = 0.0755), DFS (P = 0.0193) and PFS (P = 7.145e-3) than patients without alterations, even though the P value of DSS was not less than 0.05 (Fig. 4D).
Fig. 4.
The genomic alteration character of FXYD5 across pan-cancer of TCGA. We deployed cBioPortal tool to plot the mutation feature of FXYD5 across pan-cancer. (A) Alteration frequency of FXYD5 alteration types across pan-cancer. (B) The correlation of FXYD5 mRNA expression and genomic alteration patterns. (C) The different patterns and their distributions of FXYD5 mutations were displayed. (D) Kaplan–Meier plots of difference in OS, DFS, PFS, and DSS between cancer cohorts with and without FXYD5 genomic alteration.
These results indicate that at the DNA level, FXYD5 is also amplified in most malignant tumor types, and patients with FXYD5 amplification have worse survival.
3.4. Pan-cancer analysis of the correlation between FXYD5 and stroma in the TME
The TIME has been shown to play a pivotal role in tumor progression. To further examine the function of FXYD5 in the TIME, scatter diagrams were plotted to show the stromal, immune, and estimate scores of FXYD5 across pan-cancer (Fig. 5A). We showed that FXYD5 expression had a remarkable relationship with stromal, immune and ESTIMATE scores in most tumor types, and we selected GBM, LGG, LUAD, LUSC, MESO and OV to display in Fig. 5B.
Fig. 5.
Scatter diagrams showing stromal, immune, and Estimate scores. (A) Coefficient of correlation and −log10(P-value) of FXYD5 expression and stromal scores, immune scores and Estimate scores are displayed. The circles represent different types of tumors in the TCGA dataset. Blue circles mean positive correlation. Yellow circles mean no correlation. (B) Correlation analysis plots of FXYD5 expression with relevant stromal scores, immune scores, and Estimate scores in GBM, LGG, LUAD, LUSC, MESO, and OV.
As a critical TME components, CAFs have diverse functions in the course of concomitant malignant tumor growth, invasion, metastasis, and treatment response through widespread reciprocal and crosstalk signal interactions with tumors and infiltrating immune cells. Especially, CAFs can influence the composition of immune cells, by secreting chemokines or immunosuppressive factors such as TGF-β and PD-L1, promoting the establishment of an immunosuppressive environment and reducing effective antitumor immune responses. Our study used four different algorithms to detect the association between FXYD5 expression and CAFs infiltration level across pan-cancer in TCGA (http://timer.cistrome.org) (Fig. 6A). Only cancer types with coincident correlation directions in at least three algorithms were regarded as meaningfully related to CAFs infiltration. After adjusting for tumor purity, a statistically significant correlation was observed between FXYD5 expression and the estimated CAFs infiltration value in BLCA, BRCA, BRCA-LumA/B, BRCA-Her2, COAD, KIRC, HNSC, HNSC-HPV+, KIRP, LGG, LUAD, LUSC, LIHC, OV, PRAD, PCGP, TGCT and THCA. The scatterplot data for a portion of the above tumor types produced using one algorithm are shown as examples in Fig. 6B.
Fig. 6.
FXYD5 expression correlated with CAFs infiltration. (A–B) Various algorithms were used to investigate the relationship between FXYD5 gene expression and the level of CAFs infiltration across cancers in TCGA.
As shown above, FXYD5 expression and CAF infiltration are positively correlated.
3.5. Pan-cancer analysis of the immune aspects of FXYD5 in the TME
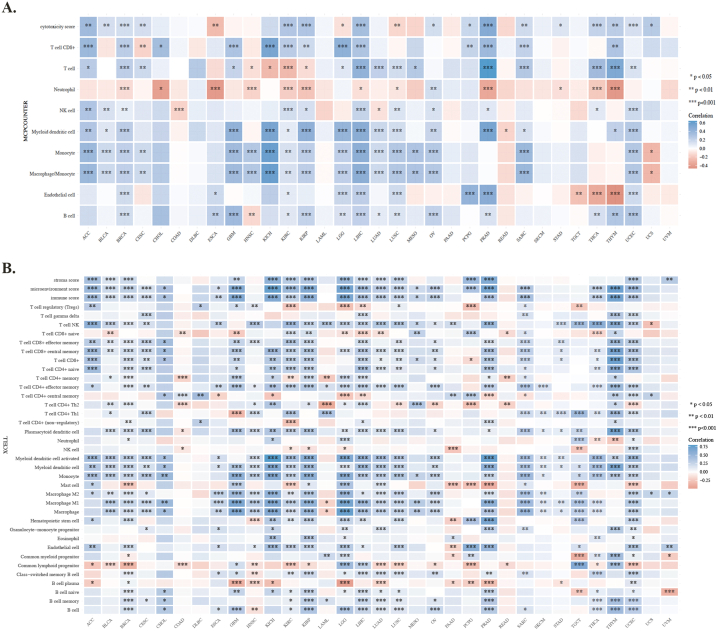
To better understand the immune properties, we analyzed the association between the expression of FXYD5 and immune infiltration, immune checkpoint genes, immune modulator genes, MSI and TMB across cancers. To clarify this association, we used six algorithms to quantify immune cells: TIMER, quanTIseq, CIBERSORT (Fig. 7A–C), MCP-counter and xCell (Supplementary Figs. S3A–B). A significant positive correlation was observed between high FXYD5 expression and B cells, CD4+ T cells, CD8+ T cells, neutrophils, macrophages and DCs (Dendritic Cells) in GBM, KIRP, LIHC, SARC, and UCEC (Fig. 7A). Using the quanTIseq, CIBERSORT and XCELL databases, we found that the up-regulated expression of FXYD5 was positively correlated to T-cell regulatory (Tregs) in BRCA, ESCA, KIRP, KIRC, LUAD, LUSC, LIHC and PRAD (Fig. 7B and C, Supplementary Fig. S3B). We also found that FXYD5 higher expression was closely related to M2 macrophages in BLCA, ACC, LGG, KICH, LIHC, KIRP, LUAD, OV and SARC (Fig. 7B and C, Supplementary Fig. S3B).
Fig. 7.
Using the R package immunedeconv in the TME, FXYD5 levels and immune cell infiltration were analyzed. (A) Analysis of FXYD5 correlation with immune cell infiltration with TIMER. (B) An analysis of FXYD5 and immune cell infiltration using QuanTIseq algorithms. (C) Analysis of FXYD5 with immune cell infiltration using CIBERSORT. *p < 0.05, **p < 0.01, ***p < 0.001.
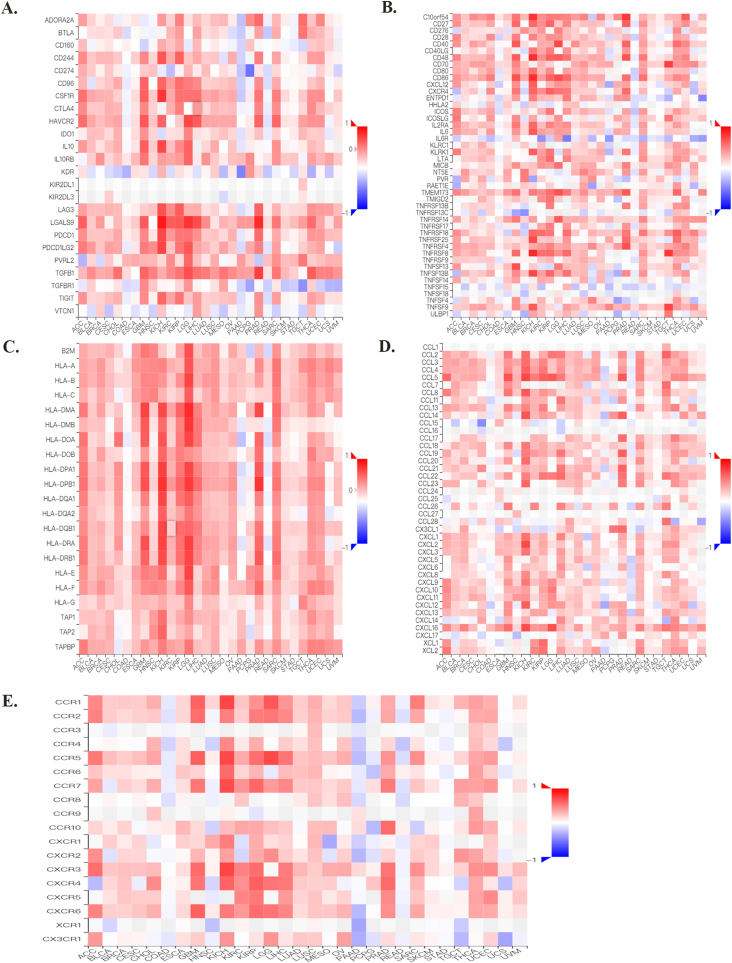
Moreover, upon evaluating the relationship between F expression and classic immune checkpoint genes, we found that most of these genes were positively correlated with FXYD5 in BRCA, BLCA, GBM, KIRC, KICH, KIRP, LUAD, LIHC, LGG, PRAD, OV, THCA and SARC (Fig. 8A, Supplementary Fig. S4).
Fig. 8.
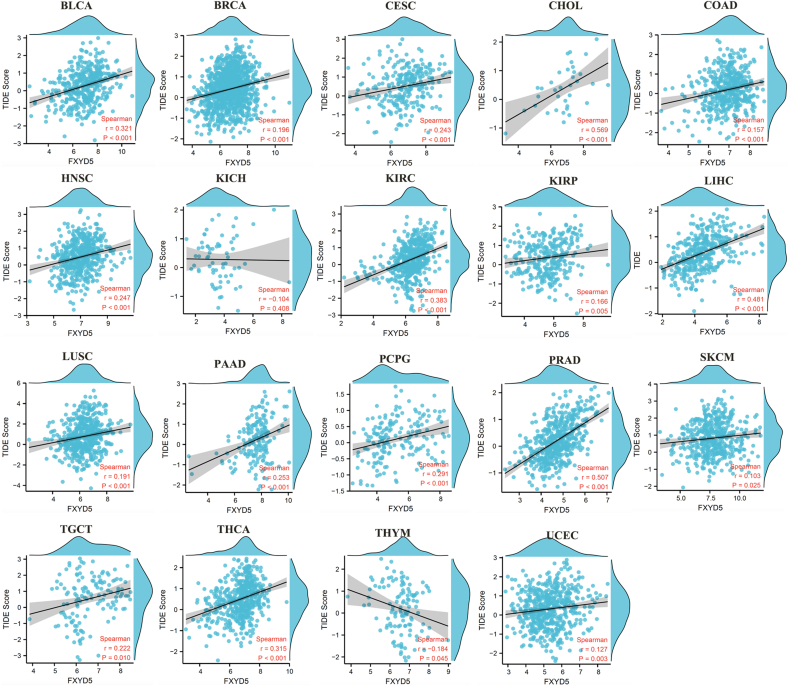
An analysis of the correlation between FXYD5 expression and immune checkpoint genes, TIDE Score, TMB, MSI, and DNA repair genes in pan-cancer. (A) FXYD5 expression correlates with immune checkpoints in pan-cancer cells. The deeper the color, the stronger the correlation; red represents positive correlation, blue represents negative correlation. Data were shown as mean +− SD. (B) Correlation of TIDE scores with FXYD5 expression in pan-cancer. (C). A radar chart shows the association between FXYD5 and TMB for each cancer type. (D) A radar chart shows the association between FXYD5 and MSI across pan-cancer. (E) An analysis of DNA mismatch repair genes (MLH1, MSH2, MSH6, PMS2, and EPCAM) associated with FXYD5 across cancers. The * is P < 0.05, ** is P < 0.01 and *** is P < 0.001.
A set of gene expression signatures can be used in TIDE to examine two common tumor immune escape mechanisms, including CTL (Cytotoxic T Lymphocyte) rejection by immune suppressors and tumor-infiltrating CTL dysfunction. The TIDE score is currently one of the most promising predictive markers of ICB therapy response: the higher the TIDE score, the poorer the efficacy of ICB and the lower the survival rate after ICB treatment. A remarkably positive relationship between FXYD5 expression and TIDE score was observed across most tumor types in TCGA data (Fig. 8B, Supplementary Fig. S5).
As an indications for predictive immunotherapy, the tumor cell genomic mutation number can be mirrored using the TMB. The relationship between FXYD5 expression and TMB was detected across pan-cancer in TCGA, and we found that FXYD5 expression was conspicuously linked to TMB in DLBC (P = 0.002), ESCA (P = 0.007), LGG (P = 0.0009), LIHC (P = 4.7e-5), LUSC (P = 0.02) and PAAD (P = 0.006) (Fig. 8C). Additionally, the analysis outcomes revealed that FXYD5 expression correlated remarkably with MSI in KIRC (P = 0.002), LGG (P = 0.03), LUSC (P = 0.04), SKCM (P = 0.03) and THCA (P = 0.03) (Fig. 8D).
To elucidate the latent mechanism of FXYD5 expression, we assessed the relationship between FXYD5 levels and mutations in five DNA repair genes (EPCAM, PMS2, MLH1, MSH2, and MSH6). The data indicated that FXYD5 expression was associated withMLH1, MSH2, MSH6, PMS2 and EPCAM in CESC and UCEC; with MLH1, MSH2, MSH6, and PMS2 in GBM and SARC; with MSH2, MSH6, PMS2, and EPCAM in LUSC; and with MLH1, MSH2, MSH6, and EPCAM in OV (Fig. 8E).
These results suggest a potential role for FXYD5 expression in immunotherapy and drug resistance.
3.6. FXYD5 might participate in the process of infiltrating CTL dysfunction
Previous reports have shown that CTLs are direct effector cells of tumor killing, and one of the most important mechanisms of tumor immune tolerance or immunotherapy resistance is to disable CTLs [20]. To investigate whether FXYD5 functions in CTL dysfunction and immunotherapy resistance, we examined the effect of FXYD5 expression in tumor tissues on the prognostic value of CTLs in predicting the survival of patients treated with PD1 or CTLA4 inhibitors using the TIDE database (http://tide.dfci.harvard.edu) [18,21]. There was a positive correlation between the expression levels of FXYD5 and the proportion of CTLs in our results, and in the FXYD5 higher expression group, increased CTLs predicted poor prognosis in lung cancer (r = 0.42, P = 1.18e-12; Continuous z = 3.89, P = 0.000102), melanoma (r = 0.429, P = 0.0144; Continuous z = 3.04, P = 0.00238), liver cancer (r = 0.0.238, P = 7.53e-6; Continuous z = 2.33, P = 0.0199), glioma (r = 0.301, P = 0.000209; Continuous z = 2.21, P = 0.0272), breast cancer (r = 0.295, P = 1.93e-6; Continuous z = 2.32, P = 0.0203) and ovarian cancer (r = 0.297, P = 0.00599; Continuous z = 2.16, P = 0.0311) (Fig. 9A–F). More importantly, from single-cell data, we found that higher expression of FXYD5 in CD8-PDCD1+ T cells was specifically related to higher tumor infiltration in intrahepatic CHOL (R = −0.831, P = 0.02), kidney tumors (R = −0.845, P = 0.00027), and HNSC (R = −0.656, P = 0.07, no statistical significance) (Fig. 9G–I).
Fig. 9.
FXYD5 might participated in the process of infiltrated CTLs dysfunction and analysis of FXYD5 expression across cell distribution in single cell level. (A–F) An analysis of the correlation between FXYD5 expression and CTL infiltration is shown on the left and Kaplan-Meier plots of the OS for patients with CTLs based on the top and bottom TIDE prediction scores (on the right). (G–I) The expression of FXYD5 in CD8-PDCD1+ T cells correlates with the fraction of CD8-PDCD1+ T cells in intrahepatic cholangiocarcinoma, kidney tumor, head and neck squamous cell carcinoma.
These results indicated that FXYD5 may participate in the process of infiltrating CTL dysfunction to suppress the anticancer immune response.
3.7. Pan-cancer analysis of FXYD5 expression across tumor, CAF and immune cells at the single-cell level
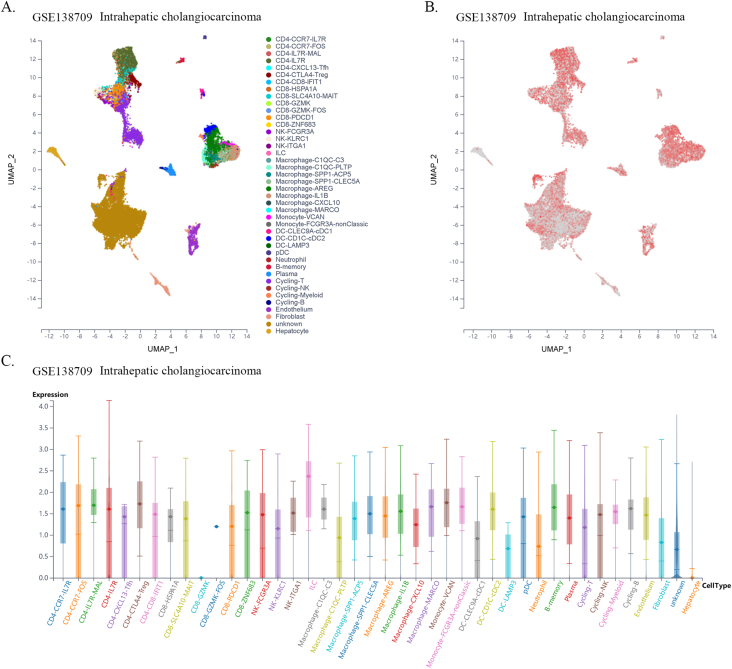
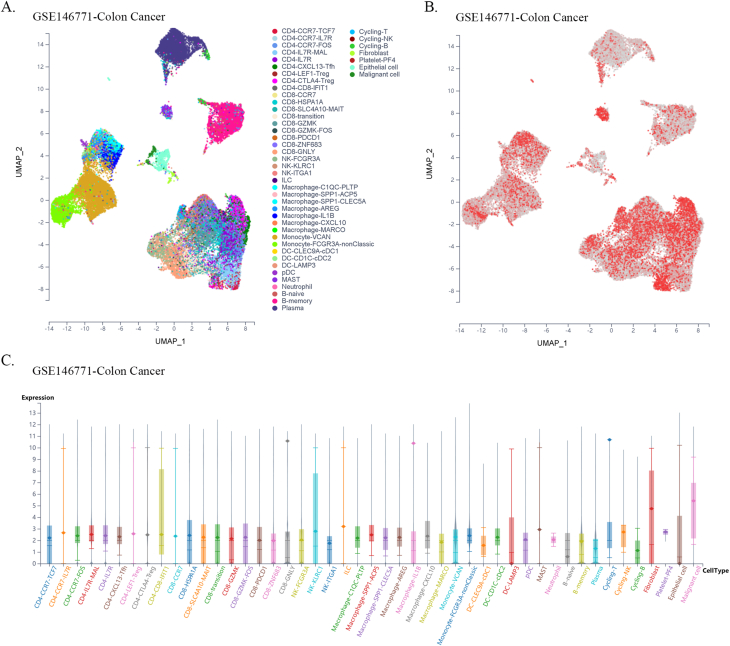
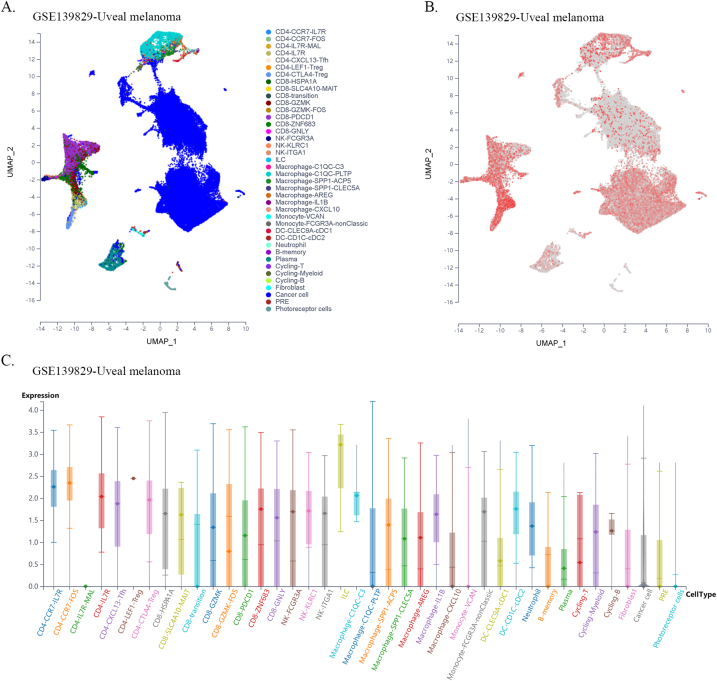
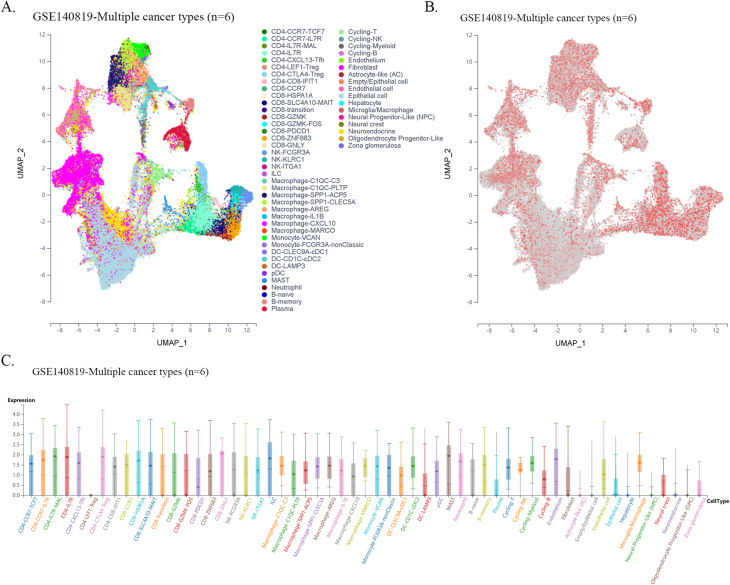
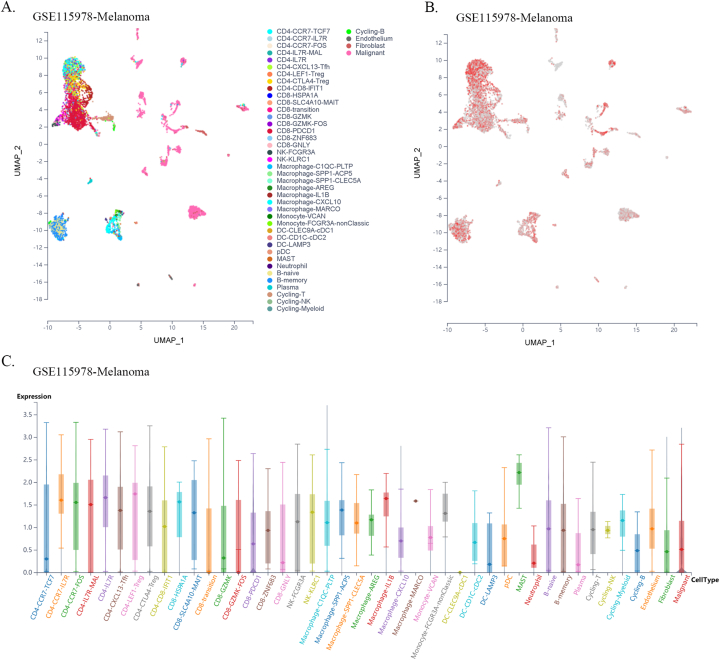
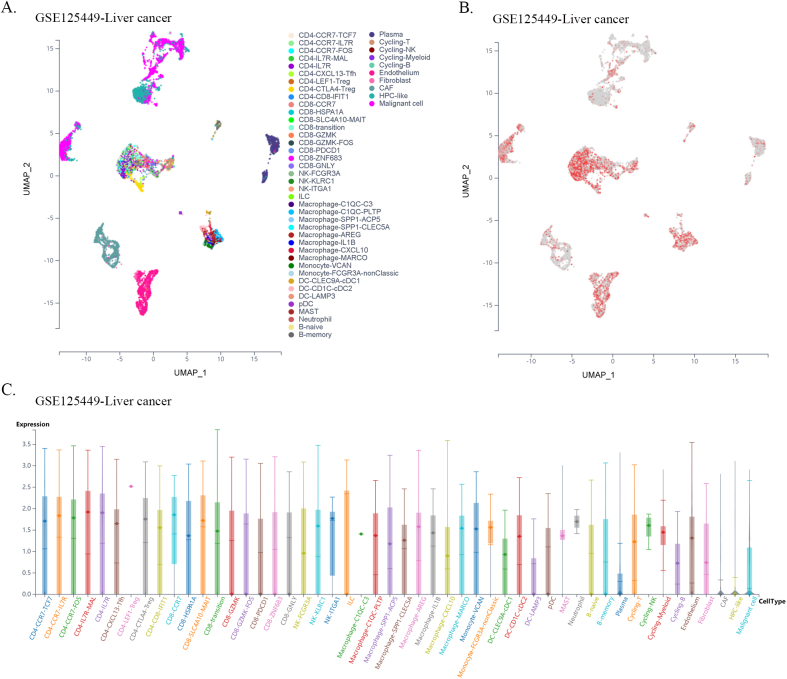
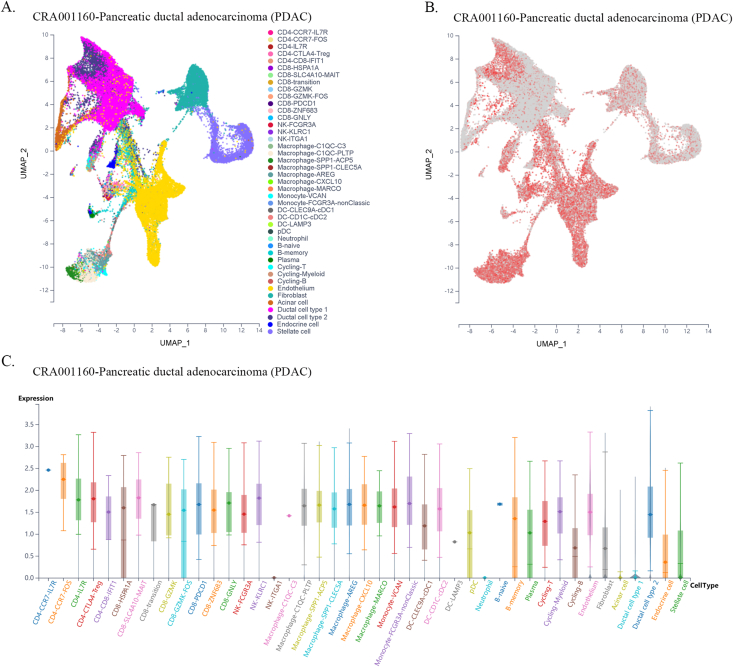
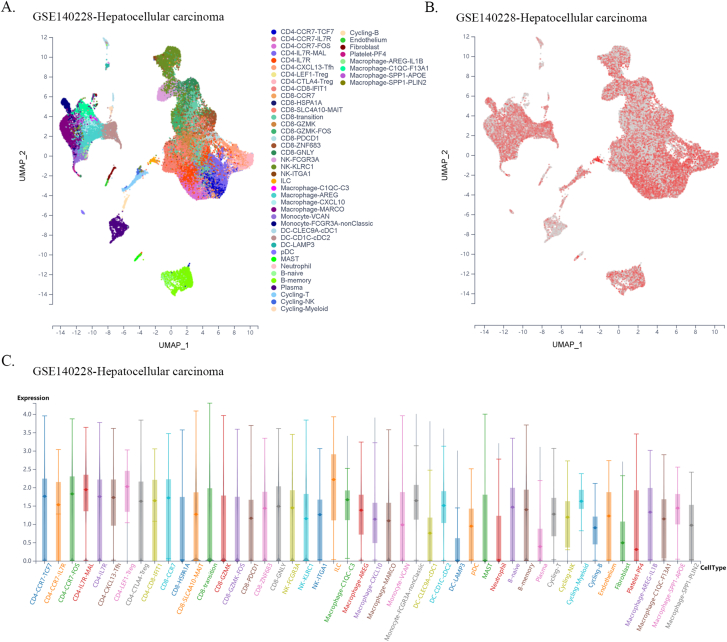
Furthermore, using single-cell sequencing data from a public database of various cancer types, we found that FXYD5 was widely expressed in tumor, stromal, and immune cells in most tumor types. In particular, FXYD5 expression is relatively high in innate lymphoid cells (ILCs) and immunosuppressive cells, such as CD4-Tregs (Figs. S6–S21). ILCs interact with the surrounding environment of epithelial, stromal, nerve, adaptive immune, and myeloid cells; coordinate signals in the microenvironment and are widely involved in various biological processes such as resistance to pathogen infection, inflammation, organ formation, tissue repair, and tumorigenesis. Tissue-resident innate lymphocytes are also present in human solid tumors. However, further investigation is required to determine whether these ILCs suppress or promote tumor colonization and immune escape. However, their extensive regulatory roles in TME cell interactions are undeniable [[22], [23], [24]].
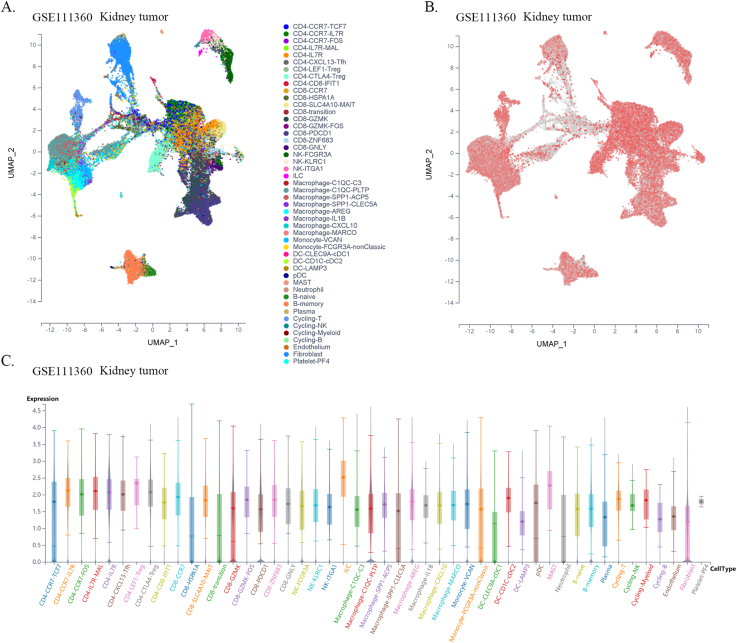
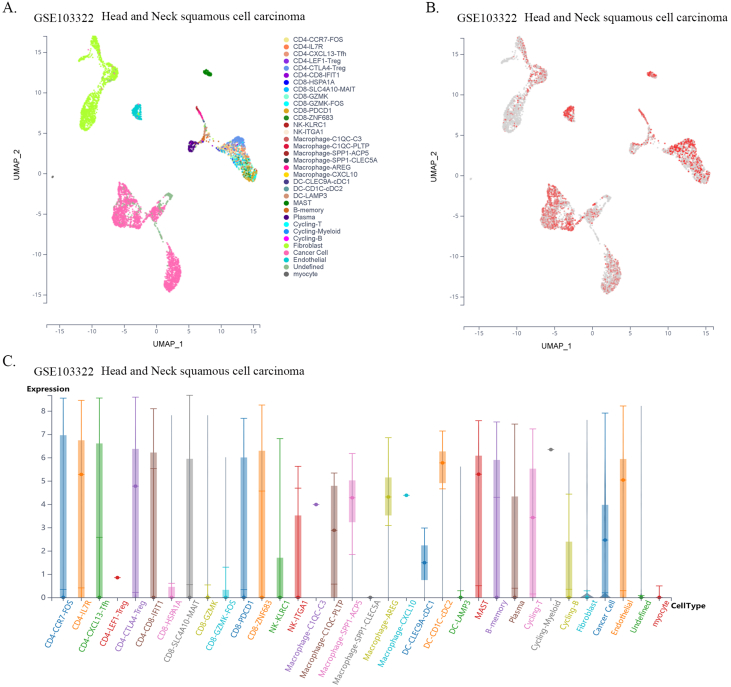
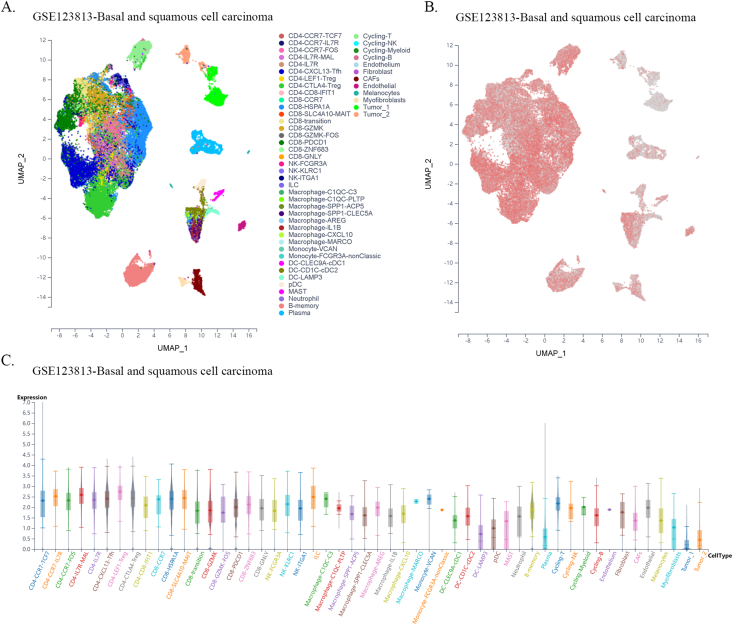
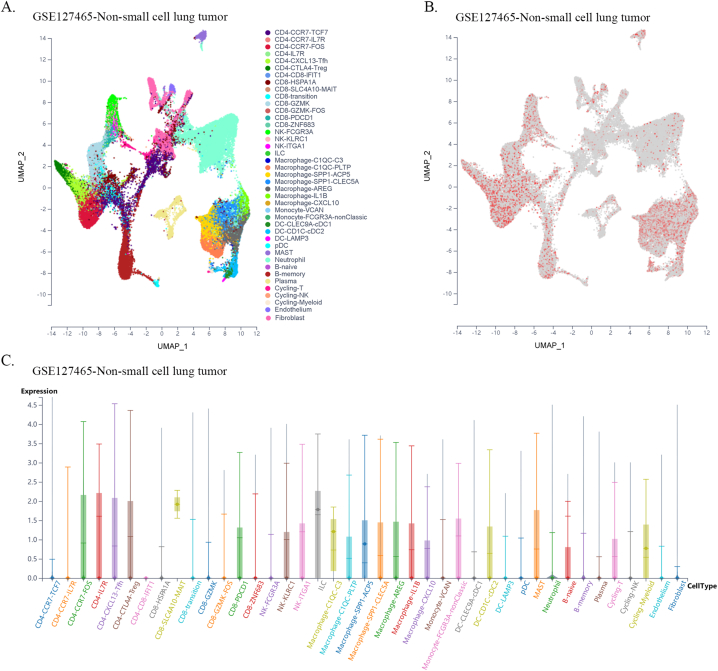
Given the dependence on cellular communication and the interaction between the tumor and TME cells in reshaping the microenvironment suitable for tumor survival and colonization, we next investigated the effect of FXYD5 expression in tumor cells and CAFs on immune cell infiltration in various tumor types in the scTIME portal. We found that FXYD5 expression in both tumor cells and CAFs significantly affected immune cell infiltration. When determining whether the expression of FXYD5 promoted or inhibited immune infiltration across different tumor types, we found that it exhibited heterogeneity, whereas in the same tumor type, it exhibited consistency among different immune cells. First, in pancreatic ductal adenocarcinoma (CRA001160), UVM (GSE139829), and LIHC (GSE140228), high expression of FXYD5 in tumors or CAFs promoted the infiltration of all immune cell types. Additionally, in intrahepatic cholangiocarcinoma (GSE138709), kidney tumor (GSE111360), HNSC (GSE103322), basal cell objective cancer (GSE123813), gastrointestinal cancer (PHS001818.V1. P1), and liver cancer, the high expression of FXYD5 in GSE125449 tumor or CAFs promoted the infiltration of most immune cell types and inhibited the infiltration of a few immune cell types. In contrast, in non-small cell lung tumors (GSE127465) and SKCM (GSE115978), high expression of FXYD5 in tumors or CAFs inhibited most immune cell infiltration and promoted the invasion of a few immune cell types. Specifically, in COAD (GSE146771), LUAD (GSE131907) and non-small cell lung tumors (GSE127465), high expression of FXYD5 in tumors or CAFs inhibited only the infiltration of all macrophage cell types. Moreover, high expression of FXYD5 in basal cell carcinoma tumor cells (GSE123813) significantly inhibited CAFs and promoted immune cell infiltration, while in basal cell carcinoma tumor cells (GSE146771), high expression of FXYD5 significantly promoted CAFs and inhibited immune cell infiltration (Supplementary Table 3).
These results suggest that FXYD5 may play a role in the interaction between tumor cells, CAFs, and immune cells during the remodeling of the TIME and that FXYD5 expression in tumor cells may promote or inhibit the recruitment of CAFs and immune cells for chemotaxis. However, these phenomena and speculations requires further verification through additional cellular and molecular functional experiments.
3.8. Functional analysis based on FXYD5 expression in ovarian cancer
Focusing on ovarian cancer, we investigated the function of FXYD5 in malignant tumor cells. The expression of FXYD5 was strongly correlated with the levels of infiltration of most immune cells, such as cytotoxic cells, dendritic cells, and macrophages (Fig. 10A). Furthermore, using GSVA and GSEA, we analyzed the FXYD5-involved signaling pathways. In Fig. 10B, in patients with higher FXYD5 expression, FXYD5 was positively associated with myogenesis, TGF-β signaling, IL6-JAK-STAT3 signaling, EMT and TNFα signaling via NF-kB. In patients with lower FXYD5 expression, FXYD5 was negatively associated with the G2/M checkpoint, E2F targets, and MYC targets. Furthermore, our GSEA results demonstrated that the five positively enriched pathways were antigen processing and presentation, cell adhesion molecules, chemokine, ECM receptor interaction, and TGF-β signaling pathway based on the KEGG terms (Fig. 10C). Baed on the GO (Gene Ontology) terms, antigen bending, Fc receptor-mediated stimulatory signaling pathway, humoral immune response mediated circulating immunoglobulin, immunoglobulin complex and T-cell receptor complex were the five positively enriched pathways (Fig. 10D). According to the above findings, FXYD5 primarily functions in immune-related pathways, indicating its immune sensitivity.
Fig. 10.
Functional analysis based on FXYD5 expression in OV. (A) An analysis of the correlation between FXYD5 expression and immune infiltration cells in OV. (B) GSVA algorithm enrichment pathway for FXYD5. (C) Results of GSEA show FXYD5-high expression patients have differential enrichment of genes in KEGG. (D) Results of GSEA show FXYD5-high expression patients have differential enrichment of genes in GO. (E) FXYD5-binding proteins determined by STRING. (F) The FXYD5 co-expressed genes based on GeneMANIA database.
Furthermore, using the STRING database, we constructed a PPI network of FXYD5-associated proteins, such as CCBE1 and IGTA7 (Fig. 10E). Gene MANIA database analysis showed that FXYD5 was co-expressed with TGFB1, PFKL, IL27RA, PLP2, TAPBP and other proteins (Fig. 10F).
In conclusion, in ovarian cancer, TGF-β signaling was enriched by FXYD5 according to both GSVA and GSEA, which suggests that FXYD5 may regulate ovarian cancer progression and immune evasion by regulating the TGF-β signaling pathway.
3.9. Knockdown of FXYD5 affected ovarian cancer metastasis by influencing EMT and TGF‐β/SMAD signaling
Finally, we confirmed our bioinformatics results in ovarian cancer cells through in vitro experiments. As shown in Fig. 11A and B, we knocked down FXYD5 expression in OVCAR5 cells using two FXYD5 shRNAs and verified that FXYD5 could significantly promote the invasion ability of tumor cells, which was consistent with its oncogenic role in ovarian cancer. The biological pathway analysis demonstrates a positive correlation between FXYD5 and TGF-β signaling and EMT (Fig. 10B). GSEA also showed that FXYD5 was significantly correlated with TGF‐β signaling. Typically, EMT can be triggered by the TGF‐β signaling pathway, which is a critical regulator of metastasis in advanced stages of tumor progression [25,26]. Therefore, based on the previous results [2], our findings shown in Fig. 11C, D, and 11E further demonstrated some of the underlying mechanism by which FXYD5 could positively regulate TGF‐β/SMAD signaling activities and drive EMT in the process of ovarian cancer progression.
Fig. 11.
The FXYD5 promotes ovarian cancer metastasis and induces EMT via TGF‐β/SMADs signaling in vitro. (A). FXYD5 knockdown efficiency in OVCAR5 cells. (B) In vitro migration and invasion were evaluated in OVCAR5 cells using Transwell assays. In the upper panel, images of representative fields of invasive cells are shown. Magnification, ×10. Scale bar, 10 μm. In the lower panel, results are presented as histograms. **P < 0.01; ***P < 0.001. (C) A wound healing assay was used to assess the migration ability of OVCAR5 cells. (D) Using Western blotting to detect epithelial and mesenchymal markers in OVCAR5 cells that loss of FXYD5 promotes EMT. (E) FXYD5, TGF-β receptors and SMAD proteins were detected by Western blotting in cells silenced for FXYD5.
4. Discussion
By comparing cancer samples with normal samples and adjacent normal controls, we found that the expression of FXYD5 was higher in cancer samples, indicating that FXYD5 likely acts as an oncogene and is closely correlated with poor patient survival. Subsequently, FXYD5 upregulation significantly correlated with poor survival outcomes in LGG, GBM, LUAD, LUSC, MESO, and OV based on the Cox proportional hazards model and Kaplan-Meier survival analyses. According to our results, FXYD5 is potentially cancer-promoting in various tumor types, including ovarian cancer. In a previous study, we performed a series of experiments to confirm its oncogenic role in OV. Taken together, these results highlight the prognostic value of FXYD5 in various cancer types.
Tumor progression occurs through an intricate network of interactions among tumor cells, infiltrating stromal cells (adipocytes, endothelial cells, pericytes, fibroblasts, etc.) and immune cells (including B cells, CD4+ T cells, CD8+ T cells, NK cells and macrophages) [27]. Highly immuno-suppressive cells, TAMs and Tregs play central roles in malignant tumor progression by suppressing antitumor immunity. Our study systematically examined FXYD5 as a potential immunotherapeutic target for 33 tumor types. Similar to previous results [27,28], we found that FXYD5 was significantly and positively correlated with TAMs, especially M2-like macrophages, in the ACC, BLCA, KICH, KIRP, LIHC, LGG, LUAD, OV, and SARC, and that elevated FXYD5 expression was positively correlated with Tregs in BRCA, ESCA, KIRP, KIRC, LIHC, LUAD, LUSC and PRAD. Contrary to the antitumor role of M1 macrophages [29], the M2 subtype functions in tumor promotion by repressing tumor immune killing effects by expressing inhibitory immune checkpoints or secreting immunosuppressive cytokines, such as TGF-β1 [30]. Owing to their highly plastic characteristics, both M1 and M2 macrophage subtypes can change into one another when the tumor microenvironment or a therapeutic intervention change [31,32]. These results indicate that FXYD5 may be a potential drug target to hinder Treg cell infiltration and reshape macrophage polarization. By reversing tumor-specific T-cell dysfunction, ICB (immune checkpoint blockade) targeting CTLA-4and PD-1/PDL1 stimulates antitumor immunity and has been permitted for first- or second-line treatment in various cancer types [33]. The successful clinical application of immune checkpoint inhibitors has emphasized the pivotal role of antitumor immunity. PD-L1 protein levels, MSI, TMB, and TIDE score have been recognized as predictive markers for ICB therapy [[34], [35], [36]]. TMB acts as a useful signature for estimating tumor neoantigen load, which is likely to be recognized and attacked by T cells [35]. MSI refers to a DNA mismatch repair deficiency, which can benefit from ICB and can be used as a genetic instability of a tumor detection index [37].
In our study, FXYD5 expression was positively correlated with the expression levels of specific immune checkpoint genes in most tumors, including PDCD1, CD274 and CTLA4, as well as TMB, MSI and TIDE scores, suggesting that higher FXYD5 expression might be correlated with better ICB efficacy. The DNA mismatch repair system can repair DNA base mismatches in human cells, which is beneficial for maintaining genomic integrity and stability. The present study examined five DNA repair genes (including EPCAM, PMS2, MLH1, MSH2, and MSH6) in detail. The results showed that a remarkable positive correlation between FXYD5 expression and DNA repair genes in most tumor types. Most importantly, our results indicate that FXYD5 might participate in the process of infiltrating CTL dysfunction to suppress the anticancer immune response. The potential application of FXYD5 as a target for combined immunotherapy is highlighted.
Among all stromal cells that compose the TME, CAFs are known to be the most abundant and critical component, which can affect tumor initiation, progression, immune escape, and metastasis by secreting extracellular matrix proteins, cytokines, and inflammatory ligands, and eventually have an impact on immunotherapy response and clinical outcomes [38,39]. Numerous studies have demonstrated that high levels of CAF infiltration are closely linked to poor patient prognosis [[40], [41], [42]]. In the present study, a significant positive association was observed between FXYD5 expression and CAF infiltration in BRCA-Her2, BRCA-LumB, KIRP, LIHC, LGG, LUAD, LUSC, TGCT, PRAD, and THCA. Hence, combining the above prognostic data, our results indicate that higher FXYD5 levels lead to adverse outcomes, which may be related to high CAFs infiltration in the TME. CAFs represent a new direction for exploring tumor immune escape mechanisms.
In ovarian cancer, our GSEA and GSVA findings showed that numerous immune-related pathways have been linked to FXYD5, including TGF-β signaling, IL6-JAK-STAT3 signaling, TNFα signaling via NFKB and allograft rejection, indicating the key role of FXYD5 in regulating tumor immunology in ovarian cancer. In addition, through functional experiments, we also confirmed that FXYD5 enhanced the migration and invasion ability of ovarian cancer by activating the TGF-β signaling pathway. However, FXYD5 regulation of immune escape remains to be confirmed by further cellular and molecular functional experiments.
TGF-β secreted by tumor cells, CAFs and immune cells in the TME promotes the progression of malignant tumors by remodeling the tumor architecture and inhibiting immune cell antitumor activity, resulting in an immunosuppressive microenvironment that inhibits or weaken the efficacy of antitumor immunotherapies [13]. Using digital pathology, transcriptome analysis, and scRNA-seq analysis of a large ovarian tumor cohort, Hornburg et al. dissected the composition of three T-cell infiltration patterns (infiltrated, excluded, and desert) of ovarian tumors and proposed that the TGFβ+ CAF-mediated reactive stroma created a dense matrix that could contribute to the loss of antigen presentation on tumor cells and the exclusion of immune cells [43,44]. Mariathasan et al. demonstrated that in patients with metastatic urothelial cancer, collagen-rich peritumoral stroma formed by TGF-β-activated fibroblasts excluded CD8+ T cells from the tumor parenchyma, further attenuating the tumor response to PD-L1 blockade [45].
Combined with the results of this study, the above literature reports, and our previous findings that FXYD5 and TGF-β form a positive feedback loop to promote the progression and metastasis of ovarian cancer [2], we propose that FXYD5-TGF-β may coregulate the interaction between tumors, CAFs and immune cells to reshape the tumor microenvironment and promote tumorigenesis and progression (Cover Figure).
In summary, our study revealed that FXYD5 could be used as an immune-related biomarker for diagnosing and predicting the prognosis of multiple cancer types. Therefore, our findings suggest that targeting FXYD5 in the TME may be a promising therapeutic strategy.
However, this study had some limitations. First, most conclusions are merely speculated via bioinformatics analysis, and limited data have been validated for ovarian cancer. Further biological experiments are necessary to demonstrate the molecular functions and regulatory mechanisms of FXYD5 in other types of tumors. Second, the discrepant FXYD5 expression levels or functions in particular cancer species across different databases may be due to data collection bias, tumor heterogeneity, and molecular functional diversity.
5. Conclusion
The present study is the first to analyze the association between FXYD5 expression and clinical prognosis, genetic alterations, immune cell infiltration, immunotherapeutic markers and other components of the tumor microenvironment at the pan-cancer level, facilitating an understanding of how FXYD5 contributes to tumorigenesis and the development new treatment strategies.
Data availability statement
Data included in article/supp. material/referenced in article.
Funding
This study is sponsored by grants from National Natural Science Foundation of China (Grant Nos. 82072877) and (Grant Nos. 82203769)
CRediT authorship contribution statement
Yang Bai: Writing – original draft, Methodology, Formal analysis, Data curation. Liangdong Li: Methodology, Formal analysis, Data curation. Jun Li: Writing – review & editing, Supervision, Resources. Xin Lu: Writing – review & editing, Supervision, Funding acquisition.
Declaration of competing interest
The authors declare that they have no known competing financial interests or personal relationships that could have appeared to influence the work reported in this paper.
Acknowledgements
Not applicable.
Footnotes
Supplementary data to this article can be found online at https://doi.org/10.1016/j.heliyon.2024.e30727.
Appendix A. Supplementary data
The following are the Supplementary data to this article:
figs1.
figs2.
figs3.
figs4.
figs5.
figs6.
figs7.
figs8.
figs9.
figs10.
figs11.
figs12.
figs13.
figs14.
figs15.
figs16.
figs17.
figs18.
figs19.
figs20.
figs21.
References
- 1.Batlle E., Massague J. Transforming growth factor-beta signaling in immunity and cancer. Immunity. 2019;50(4):924–940. doi: 10.1016/j.immuni.2019.03.024. [DOI] [PMC free article] [PubMed] [Google Scholar]
- 2.Bai Y., Li L.D., Li J., Chen R.F., Yu H.L., Sun H.F., Wang J.Y., Lu X. A FXYD5/TGFbeta/SMAD positive feedback loop drives epithelialtomesenchymal transition and promotes tumor growth and metastasis in ovarian cancer. Int. J. Oncol. 2020;56(1):301–314. doi: 10.3892/ijo.2019.4911. [DOI] [PubMed] [Google Scholar]
- 3.Lubarski Gotliv I. FXYD5: Na(+)/K(+)-ATPase regulator in health and disease. Front. Cell Dev. Biol. 2016;4:26. doi: 10.3389/fcell.2016.00026. [DOI] [PMC free article] [PubMed] [Google Scholar]
- 4.Lubarski I., Karlish S.J., Garty H. Structural and functional interactions between FXYD5 and the Na+-K+-ATPase. Am J Physiol Renal Physiol. 2007;293(6):F1818–F1826. doi: 10.1152/ajprenal.00367.2007. [DOI] [PubMed] [Google Scholar]
- 5.Ino Y., Gotoh M., Sakamoto M., Tsukagoshi K., Hirohashi S. Dysadherin, a cancer-associated cell membrane glycoprotein, down-regulates E-cadherin and promotes metastasis. Proc Natl Acad Sci U S A. 2002;99(1):365–370. doi: 10.1073/pnas.012425299. [DOI] [PMC free article] [PubMed] [Google Scholar]
- 6.Tassi R.A., Gambino A., Ardighieri L., Bignotti E., Todeschini P., Romani C., Zanotti L., Bugatti M., Borella F., Katsaros D., et al. FXYD5 (Dysadherin) upregulation predicts shorter survival and reveals platinum resistance in high-grade serous ovarian cancer patients. Br. J. Cancer. 2019;121(7):584–592. doi: 10.1038/s41416-019-0553-z. [DOI] [PMC free article] [PubMed] [Google Scholar]
- 7.Lubarski-Gotliv I., Dey K., Kuznetsov Y., Kalchenco V., Asher C., Garty H. FXYD5 (dysadherin) may mediate metastatic progression through regulation of the beta-Na(+)-K(+)-ATPase subunit in the 4T1 mouse breast cancer model. Am J Physiol Cell Physiol. 2017;313(1):C108–C117. doi: 10.1152/ajpcell.00206.2016. [DOI] [PubMed] [Google Scholar]
- 8.Besso M.J., Rosso M., Lapyckyj L., Moiola C.P., Matos M.L., Mercogliano M.F., Schillaci R., Reventos J., Colas E., Gil-Moreno A., et al. FXYD5/Dysadherin, a biomarker of endometrial cancer myometrial invasion and aggressiveness: its relationship with TGF-beta1 and NF-kappaB pathways. Front. Oncol. 2019;9:1306. doi: 10.3389/fonc.2019.01306. [DOI] [PMC free article] [PubMed] [Google Scholar]
- 9.Uhlen M., Fagerberg L., Hallstrom B.M., Lindskog C., Oksvold P., Mardinoglu A., Sivertsson A., Kampf C., Sjostedt E., Asplund A., et al. Proteomics. Tissue-based map of the human proteome. Science. 2015;347(6220) doi: 10.1126/science.1260419. [DOI] [PubMed] [Google Scholar]
- 10.Tang Z., Li C., Kang B., Gao G., Li C., Zhang Z. GEPIA: a web server for cancer and normal gene expression profiling and interactive analyses. Nucleic Acids Res. 2017;45(W1):W98–W102. doi: 10.1093/nar/gkx247. [DOI] [PMC free article] [PubMed] [Google Scholar]
- 11.Cerami E., Gao J., Dogrusoz U., Gross B.E., Sumer S.O., Aksoy B.A., Jacobsen A., Byrne C.J., Heuer M.L., Larsson E., et al. The cBio cancer genomics portal: an open platform for exploring multidimensional cancer genomics data. Cancer Discov. 2012;2(5):401–404. doi: 10.1158/2159-8290.CD-12-0095. [DOI] [PMC free article] [PubMed] [Google Scholar]
- 12.Hanzelmann S., Castelo R., Guinney J. GSVA: gene set variation analysis for microarray and RNA-seq data. BMC Bioinf. 2013;14:7. doi: 10.1186/1471-2105-14-7. [DOI] [PMC free article] [PubMed] [Google Scholar]
- 13.Derynck R., Turley S.J., Akhurst R.J. TGFbeta biology in cancer progression and immunotherapy. Nat. Rev. Clin. Oncol. 2021;18(1):9–34. doi: 10.1038/s41571-020-0403-1. [DOI] [PMC free article] [PubMed] [Google Scholar]
- 14.Ru B., Wong C.N., Tong Y., Zhong J.Y., Zhong S.S.W., Wu W.C., Chu K.C., Wong C.Y., Lau C.Y., Chen I., et al. TISIDB: an integrated repository portal for tumor-immune system interactions. Bioinformatics. 2019;35(20):4200–4202. doi: 10.1093/bioinformatics/btz210. [DOI] [PubMed] [Google Scholar]
- 15.Yoshihara K., Shahmoradgoli M., Martinez E., Vegesna R., Kim H., Torres-Garcia W., Trevino V., Shen H., Laird P.W., Levine D.A., et al. Inferring tumour purity and stromal and immune cell admixture from expression data. Nat. Commun. 2013;4:2612. doi: 10.1038/ncomms3612. [DOI] [PMC free article] [PubMed] [Google Scholar]
- 16.Li T., Fu J., Zeng Z., Cohen D., Li J., Chen Q., Li B., Liu X.S. TIMER2.0 for analysis of tumor-infiltrating immune cells. Nucleic Acids Res. 2020;48(W1):W509–W514. doi: 10.1093/nar/gkaa407. [DOI] [PMC free article] [PubMed] [Google Scholar]
- 17.Hong F., Meng Q., Zhang W., Zheng R., Li X., Cheng T., Hu D., Gao X. Single-cell analysis of the pan-cancer immune microenvironment and scTIME portal. Cancer Immunol. Res. 2021;9(8):939–951. doi: 10.1158/2326-6066.CIR-20-1026. [DOI] [PubMed] [Google Scholar]
- 18.Jiang P., Gu S., Pan D., Fu J., Sahu A., Hu X., Li Z., Traugh N., Bu X., Li B., et al. Signatures of T cell dysfunction and exclusion predict cancer immunotherapy response. Nat Med. 2018;24(10):1550–1558. doi: 10.1038/s41591-018-0136-1. [DOI] [PMC free article] [PubMed] [Google Scholar]
- 19.Chen F., Fan Y., Cao P., Liu B., Hou J., Zhang B., Tan K. Pan-cancer analysis of the prognostic and immunological role of HSF1: a potential target for survival and immunotherapy. Oxid. Med. Cell. Longev. 2021;2021 doi: 10.1155/2021/5551036. [DOI] [PMC free article] [PubMed] [Google Scholar]
- 20.Wherry E.J., Kurachi M. Molecular and cellular insights into T cell exhaustion. Nat. Rev. Immunol. 2015;15(8):486–499. doi: 10.1038/nri3862. [DOI] [PMC free article] [PubMed] [Google Scholar]
- 21.Fu J., Li K., Zhang W., Wan C., Zhang J., Jiang P., Liu X.S. Large-scale public data reuse to model immunotherapy response and resistance. Genome Med. 2020;12(1):21. doi: 10.1186/s13073-020-0721-z. [DOI] [PMC free article] [PubMed] [Google Scholar]
- 22.Qi J., Crinier A., Escaliere B., Ye Y., Wang Z., Zhang T., Batista L., Liu H., Hong L., Wu N., et al. Single-cell transcriptomic landscape reveals tumor specific innate lymphoid cells associated with colorectal cancer progression. Cell Rep Med. 2021;2(8) doi: 10.1016/j.xcrm.2021.100353. [DOI] [PMC free article] [PubMed] [Google Scholar]
- 23.Chiossone L., Dumas P.Y., Vienne M., Vivier E. Natural killer cells and other innate lymphoid cells in cancer. Nat. Rev. Immunol. 2018;18(11):671–688. doi: 10.1038/s41577-018-0061-z. [DOI] [PubMed] [Google Scholar]
- 24.Li M.O., Wolf N., Raulet D.H., Akkari L., Pittet M.J., Rodriguez P.C., Kaplan R.N., Munitz A., Zhang Z., Cheng S., et al. Innate immune cells in the tumor microenvironment. Cancer Cell. 2021;39(6):725–729. doi: 10.1016/j.ccell.2021.05.016. [DOI] [PubMed] [Google Scholar]
- 25.Qiu X., Cheng J.-C., Zhao J., Chang H.-M., Leung P.C.K. Transforming growth factor-β stimulates human ovarian cancer cell migration by up-regulating connexin43 expression via Smad2/3 signaling. Cell. Signal. 2015;27(10):1956–1962. doi: 10.1016/j.cellsig.2015.07.010. [DOI] [PubMed] [Google Scholar]
- 26.Matsumura N., Huang Z., Mori S., Baba T., Fujii S., Konishi I., Iversen E.S., Berchuck A., Murphy S.K. Epigenetic suppression of the TGF-beta pathway revealed by transcriptome profiling in ovarian cancer. Genome Res. 2011;21(1):74–82. doi: 10.1101/gr.108803.110. [DOI] [PMC free article] [PubMed] [Google Scholar]
- 27.Fridman W.H., Pages F., Sautes-Fridman C., Galon J. The immune contexture in human tumours: impact on clinical outcome. Nat. Rev. Cancer. 2012;12(4):298–306. doi: 10.1038/nrc3245. [DOI] [PubMed] [Google Scholar]
- 28.Nishikawa H., Sakaguchi S. Regulatory T cells in cancer immunotherapy. Curr. Opin. Immunol. 2014;27:1–7. doi: 10.1016/j.coi.2013.12.005. [DOI] [PubMed] [Google Scholar]
- 29.Pan Y., Yu Y., Wang X., Zhang T. Tumor-associated macrophages in tumor immunity. Front. Immunol. 2020;11 doi: 10.3389/fimmu.2020.583084. [DOI] [PMC free article] [PubMed] [Google Scholar]
- 30.Cheng Y., Song S., Wu P., Lyu B., Qin M., Sun Y., Sun A., Mu L., Xu F., Zhang L., et al. Tumor associated macrophages and TAMs-based anti-tumor nanomedicines. Adv Healthc Mater. 2021;10(18) doi: 10.1002/adhm.202100590. [DOI] [PubMed] [Google Scholar]
- 31.Shapouri-Moghaddam A., Mohammadian S., Vazini H., Taghadosi M., Esmaeili S.A., Mardani F., Seifi B., Mohammadi A., Afshari J.T., Sahebkar A. Macrophage plasticity, polarization, and function in health and disease. J. Cell. Physiol. 2018;233(9):6425–6440. doi: 10.1002/jcp.26429. [DOI] [PubMed] [Google Scholar]
- 32.Yunna C., Mengru H., Lei W., Weidong C. Macrophage M1/M2 polarization. Eur. J. Pharmacol. 2020;877 doi: 10.1016/j.ejphar.2020.173090. [DOI] [PubMed] [Google Scholar]
- 33.Liu X., Hogg G.D., DeNardo D.G. Rethinking immune checkpoint blockade: 'Beyond the T cell'. J Immunother Cancer. 2021;9(1) doi: 10.1136/jitc-2020-001460. [DOI] [PMC free article] [PubMed] [Google Scholar]
- 34.Wei S.C., Duffy C.R., Allison J.P. Fundamental mechanisms of immune checkpoint blockade therapy. Cancer Discov. 2018;8(9):1069–1086. doi: 10.1158/2159-8290.CD-18-0367. [DOI] [PubMed] [Google Scholar]
- 35.Chan T.A., Yarchoan M., Jaffee E., Swanton C., Quezada S.A., Stenzinger A., Peters S. Development of tumor mutation burden as an immunotherapy biomarker: utility for the oncology clinic. Ann. Oncol. 2019;30(1):44–56. doi: 10.1093/annonc/mdy495. [DOI] [PMC free article] [PubMed] [Google Scholar]
- 36.Cristescu R., Mogg R., Ayers M., Albright A., Murphy E., Yearley J., Sher X., Liu X.Q., Lu H., Nebozhyn M., et al. Pan-tumor genomic biomarkers for PD-1 checkpoint blockade-based immunotherapy. Science. 2018;362(6411) doi: 10.1126/science.aar3593. [DOI] [PMC free article] [PubMed] [Google Scholar]
- 37.Baretti M., Le D.T. DNA mismatch repair in cancer. Pharmacol. Ther. 2018;189:45–62. doi: 10.1016/j.pharmthera.2018.04.004. [DOI] [PubMed] [Google Scholar]
- 38.Chen X., Song E. Turning foes to friends: targeting cancer-associated fibroblasts. Nat. Rev. Drug Discov. 2019;18(2):99–115. doi: 10.1038/s41573-018-0004-1. [DOI] [PubMed] [Google Scholar]
- 39.Biffi G., Tuveson D.A. Diversity and biology of cancer-associated fibroblasts. Physiol. Rev. 2021;101(1):147–176. doi: 10.1152/physrev.00048.2019. [DOI] [PMC free article] [PubMed] [Google Scholar]
- 40.Chen Y., McAndrews K.M., Kalluri R. Clinical and therapeutic relevance of cancer-associated fibroblasts. Nat. Rev. Clin. Oncol. 2021;18(12):792–804. doi: 10.1038/s41571-021-00546-5. [DOI] [PMC free article] [PubMed] [Google Scholar]
- 41.Kubo N., Araki K., Kuwano H., Shirabe K. Cancer-associated fibroblasts in hepatocellular carcinoma. World J. Gastroenterol. 2016;22(30):6841–6850. doi: 10.3748/wjg.v22.i30.6841. [DOI] [PMC free article] [PubMed] [Google Scholar]
- 42.Liao Z., Tan Z.W., Zhu P., Tan N.S. Cancer-associated fibroblasts in tumor microenvironment - accomplices in tumor malignancy. Cell. Immunol. 2019;343 doi: 10.1016/j.cellimm.2017.12.003. [DOI] [PubMed] [Google Scholar]
- 43.Hornburg M., Desbois M., Lu S., Guan Y., Lo A.A., Kaufman S., Elrod A., Lotstein A., DesRochers T.M., Munoz-Rodriguez J.L., et al. Single-cell dissection of cellular components and interactions shaping the tumor immune phenotypes in ovarian cancer. Cancer Cell. 2021;39(7):928–944 e926. doi: 10.1016/j.ccell.2021.04.004. [DOI] [PubMed] [Google Scholar]
- 44.Desbois M., Udyavar A.R., Ryner L., Kozlowski C., Guan Y., Durrbaum M., Lu S., Fortin J.P., Koeppen H., Ziai J., et al. Integrated digital pathology and transcriptome analysis identifies molecular mediators of T-cell exclusion in ovarian cancer. Nat. Commun. 2020;11(1):5583. doi: 10.1038/s41467-020-19408-2. [DOI] [PMC free article] [PubMed] [Google Scholar]
- 45.Mariathasan S., Turley S.J., Nickles D., Castiglioni A., Yuen K., Wang Y., Kadel E.E., III, Koeppen H., Astarita J.L., Cubas R., et al. TGFbeta attenuates tumour response to PD-L1 blockade by contributing to exclusion of T cells. Nature. 2018;554(7693):544–548. doi: 10.1038/nature25501. [DOI] [PMC free article] [PubMed] [Google Scholar]
Associated Data
This section collects any data citations, data availability statements, or supplementary materials included in this article.
Supplementary Materials
Data Availability Statement
Data included in article/supp. material/referenced in article.


