Abstract
Chlorothiazide sodium for injection, USP, is a diuretic and antihypertensive medication in the form of a white or practically white, sterile, lyophilized powder. Each vial contains 500 mg of chlorothiazide sodium, equivalent to 500 mg of chlorothiazide, and 250 mg of mannitol as an inactive ingredient. The pH is adjusted with sodium hydroxide. Chlorothiazide sodium has a molecular weight of 317.71 amu.
Since 2020 there have been multiple national shortages of chlorothiazide. Recent studies target chlorothiazide’s low bioavailability, aiming to enhance it through nanoparticle production via a supercritical method. The drug’s solubility in supercritical carbon dioxide (scCO2) is vital, with measurements ranging from 0.417×10⁻⁵ to 1.012×10⁻⁵ mole fraction under specific conditions. Adding co-solvents, like ethanol, DMSO, and acetone, to scCO2 boosts solubility, with ethanol proving most effective, enhancing solubility by 2.02–11.75 times.
Intra-lot variability was discovered in a sample of a lot of chlorothiazide sodium by the University of Kentucky Drug Quality Task Force. Two vials of six screened in one lot were displaced from the center of the lot by 4.0 and 4.2 SDs, respectively. Inter-lot variability was confirmed in the near-IR spectra of 204 vials obtained from 28 different lots of chlorothiazide sodium. Using full spectrum BEST analysis 13 vials (6.4%) were outliers.
Introduction
The University of Kentucky’s (UK) Drug Quality Task Force (DQTF) was established in August of 2019 to engage in consumer-level quality assurance screening for drugs used within UK HealthCare’s pharmacies (Isaacs, 2023a). The DQTF currently screens medications using Fourier transform near-infrared spectrometry (FTNIR) and Raman spectrometry for potential quality defects indicated by variability in absorbance peak intensities and locations. Through years of continuous monitoring, DQTF has assembled a spectral library containing medications typically used in a health system setting. Statistical analyses using the DQTF spectral library are performed to identify potential intra-lot and inter-lot variability in medications under review. Using Medwatch and publications in the scientific literature, the DQTF reports its findings in an effort to hold manufacturers accountable for GMP requirements and to improve patient outcomes by providing information on quality to augment the information on price that is already available. The increasing transparency is designed to improve the pharmaceutical supply chain.
Drug Product
Chlorothiazide Sodium for Injection, USP is a diuretic and antihypertensive with a molecular weight of 317.71 amu (DailyMed, 2024). Chlorothiazide is a sterile lyophilized white powder and is supplied in a vial containing: chlorothiazide sodium equivalent to chlorothiazide 500 mg, and the inactive ingredient mannitol 250 mg with sodium hydroxide to adjust pH. It is a white, or practically white, crystalline powder.
Figure 1 is a photo of the drug product from lot G2590039. The white powder is visible beneath the label on the vial.
Figure 1.
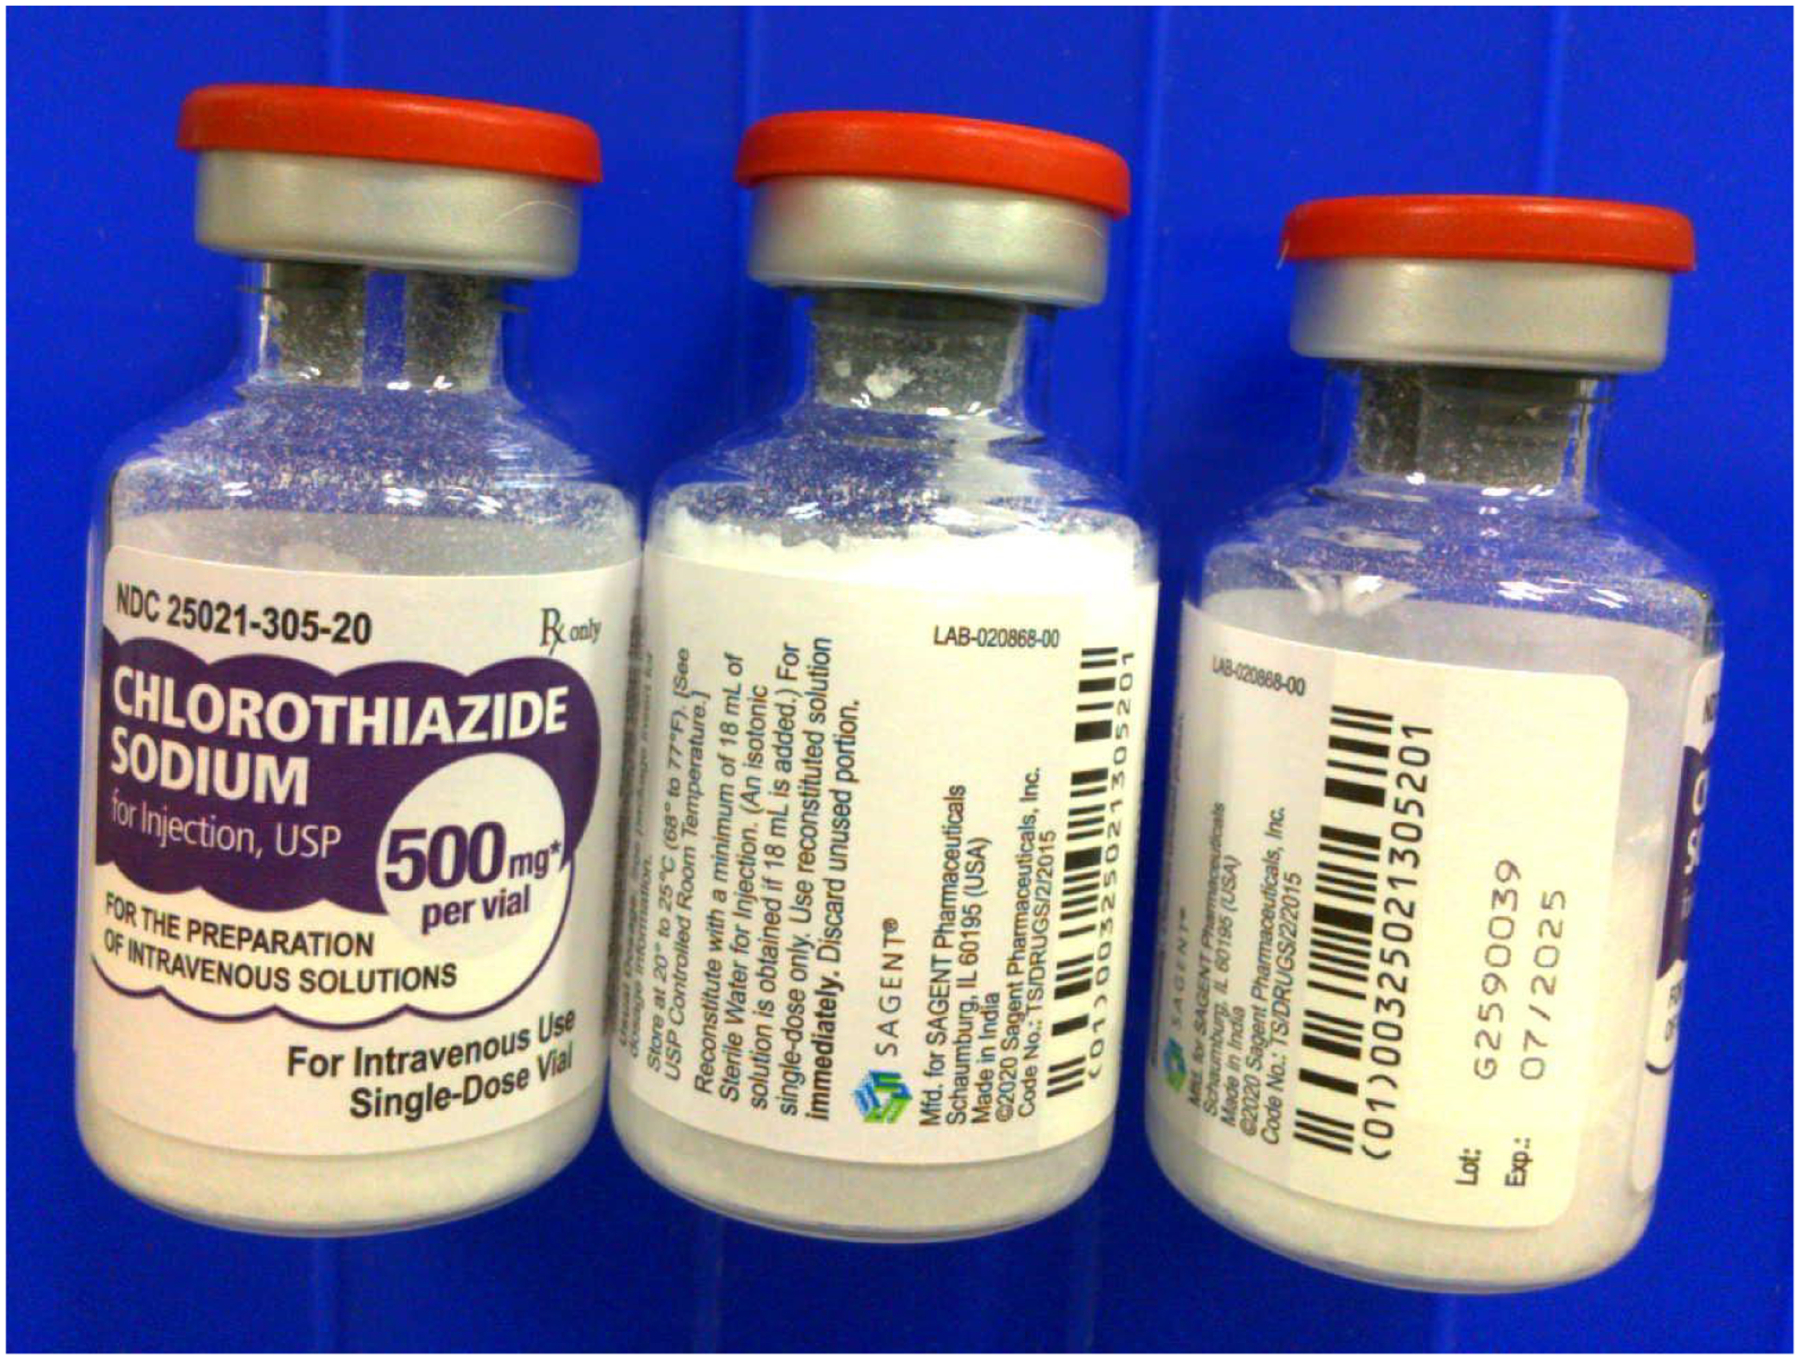
Vials of chlorothiazide sodium from lot G2590039.
The lot numbers making up the spectral library were 230102, 230106, 230110, 230111, 230116, 230122, 230124, 230126, 230128, 230203, 230219, 461085A, 491971,496860, DB020, DB022, DB106, DB107, DB202, DB206, DB210, G2590002, G2590005, G2590018, G2590021, G2590033, G2590034, G2590039.
Background
Chlorothiazide, a drug that suffers from low bioavailability due to its poor solubility and permeability, is a target of recent formulation research (Obaidullah, 2023). Nanoparticles of the drug can be produced using a supercritical method to improve its therapeutic value. The solubility of chlorothiazide in supercritical carbon dioxide (scCO2) is crucial for this process and was found to be between 0.417×10⁻⁵ to 1.012×10⁻⁵ mole fraction at temperatures of 308–338 K and pressures of 130–290 bar. The solubility can be increased by adding a small amount of a polar co-solvent to the scCO2. In the study, the solubility of chlorothiazide in scCO2 was measured with the addition of co-solvents such as ethanol, DMSO, and acetone. The presence of these co-solvents improved the solubility of chlorothiazide, with ethanol having the most significant effect, increasing solubility by 2.02–11.75 times. This research is the first to investigate the impact of these three different co-solvents on the solubility of chlorothiazide in scCO2 both experimentally and theoretically.
Shortages
In 2020, there was a shortage of chlorothiazide sodium for injection. The shortage affected both the oral suspension and injectable forms of the medication. Various pharmaceutical companies that manufactured chlorothiazide faced supply issues, but not all of them disclosed the reasons for the shortage. Shortages of chlorothiazide were also recorded in drug shortage databases in 2017 and in 2022 (ASHP, 2024).
For instance, Mylan, one of the manufacturers, discontinued its chlorothiazide injection in May 2020. Other companies like Sagent Pharmaceuticals cited manufacturing delays as the cause for their inability to meet the market demand. Akorn allocated chlorothiazide due to increased demand, which suggests that there might have been a spike in the need for the medication that outpaced the supply (ASHP, 2021).
The shortage of chlorothiazide was significant enough to be updated and monitored by drug shortage specialists and was listed in drug shortage databases (ASHP, 2024). These databases track the availability of medications and provide updates on current supply issues. The shortages can have a considerable impact on patient care, as they may require healthcare providers to seek alternative treatments that may not be as effective or may have different side effect profiles.
The chlorothiazide shortage was part of a larger issue of drug shortages faced in 2020. The FDA identified 43 new drug and biological product shortages that year, with 86 ongoing shortages from previous years (American Hospital Association, 2021). These shortages posed a significant challenge to public health, especially when they involved critical drugs for treating serious medical conditions. The pharmaceutical supply chain was greatly affected by the COVID-19 pandemic, with increased demand for many drug products.
FDA Medwatch
An FDA Form 3500 Medwatch describing the findings of this Rapid Communication was filed.
Methods
FTNIR (Fourier Transform Near-Infrared) Spectrometry
Using nondestructive analytical techniques, FTNIR spectra were collected from inventory as part of routine medication quality screening. A representative sample of individual vials were selected for screening and noted to be stored under the conditions required by the manufacturer in their original packaging. FTNIR spectra were collected noninvasively and nondestructively through the bottom of the vials using a Thermo Scientific Antaris II FTNIR Analyzer (Waltham, MA, USA)(Isaacs, 2023b).
Smoothing
Data smoothing is a technique used to remove noise from data. This can be done by fitting a smooth curve to the data, such as a cubic spline. Cubic splines are piecewise cubic polynomials that are continuous and have continuous first and second derivatives. This makes them very smooth and resistant to noise. Cubic splines can be easily fitted to data using least squares (Matlab, 2023)(Pollock, 1998).
Multiplicative Scatter Correction (MSC)
Multiplicative scatter correction (MSC) is a widely used spectrometric normalization technique. Its purpose is to correct spectra in such a way that they are as close as possible to a reference spectrum, generally the mean of the data set, by changing the scale and the offset of the spectra (Isaksson, 1988).
BEST (Bootstrap Error-Adjusted Single-sample Technique)
The BEST calculates distances in multidimensional, asymmetric, nonparametric central 68% confidence intervals in spectral hyperspace (roughly equivalent to standard deviations, or SDs)(Dempsey, 1996). The BEST metric can be thought of as a “rubber yardstick” with a nail at the center (the mean). The stretch of the yardstick in one direction is therefore independent of the stretch in the other direction. This independence enables the BEST metric to describe odd shapes in spectral hyperspace (spectral point clusters that are not multivariate normal, such as the calibration spectra of many biological systems). BEST distances can be correlated to sample composition to produce a quantitative calibration, or simply used to identify similar regions in a spectral image. The BEST automatically detects samples and situations unlike any encountered in the original calibration, making it more accurate in chemical investigation than typical regression approaches to near-IR analysis. The BEST produces accurate distances even when the number of calibration samples is less than the number of wavelengths used in calibration, in contrast to other metrics that require matrix factorization. The BEST is much faster to calculate as well (O(n) instead of the O(n3) required by matrix factorization.
Principal Components (PCs)
Principal component analysis is the process of computing the principal components of a dataset and using them to execute a change of basis (change of coordinate system) on the data, usually employing only the first few principal components and disregarding the rest (Joliffe, 2016). PCA is used in exploratory data analysis and in constructing predictive models. PCA is commonly utilized for dimensionality reduction by projecting each data point onto only the first few principal components to obtain lower-dimensional data while preserving as much of the original variation in the data as possible. The first principal component is the direction that maximizes the variance of the projected data. The second principal component is the direction of the largest variance orthogonal to the first principal component. Decomposition of the variance typically continues orthogonally in this manner until some residual variance criterion is met. Plots of PC scores help reveal underlying structure in data.
Subcluster Detection
In typical near-infrared multivariate statistical analyses, samples with similar spectra produce points that cluster in a certain region of spectral hyperspace. These dusters can vary significantly in shape and size due to variation in sample packings, particle-size distributions, component concentrations, and drift with time. These factors, when combined with discriminant analysis using simple distance metrics, produce a test in which a result that places a particular point inside a particular cluster does not necessarily mean that the point is actually a member of the cluster. Instead, the point may be a member of a new, slightly different cluster that overlaps the first. A new cluster can be created by factors like low-level contamination, moisture uptake, or instrumental drift. An extension added to part of the BEST, called FSOB (Fast Son of BEST) can be used to set nonparametric probability-density contours inside spectral clusters as well as outside (Isaacs, 2023c)(Lodder, 1988), and when multiple points begin to appear in a certain region of cluster-hyperspace the perturbation of these density contours can be detected at an assigned significance level using r values, and visualized using quantile-quantile (QQ) plots. The detection of unusual samples both within and beyond 3 SDs of the center of the training set is possible with this method. Within the ordinary 3 SD limit, however, multiple instances are needed to detect unusual samples with statistical significance.
Artificial Intelligence Tools
Artificial intelligence (AI) tools, principally used for background information, include Gemini (Google LLC) and GPT-4 (OpenAI). AI can be used in a variety of ways, including to brainstorm, organize thoughts, develop arguments, and edit.
Results and Discussion
Intralot analysis
Smoothed spectra graphs of six vials of Sagent chlorothiazide sodium from lot 230111 appear in Figure 2. The most obvious variations in the spectra appear between 6000 and 7000 cm−1.
Figure 2.
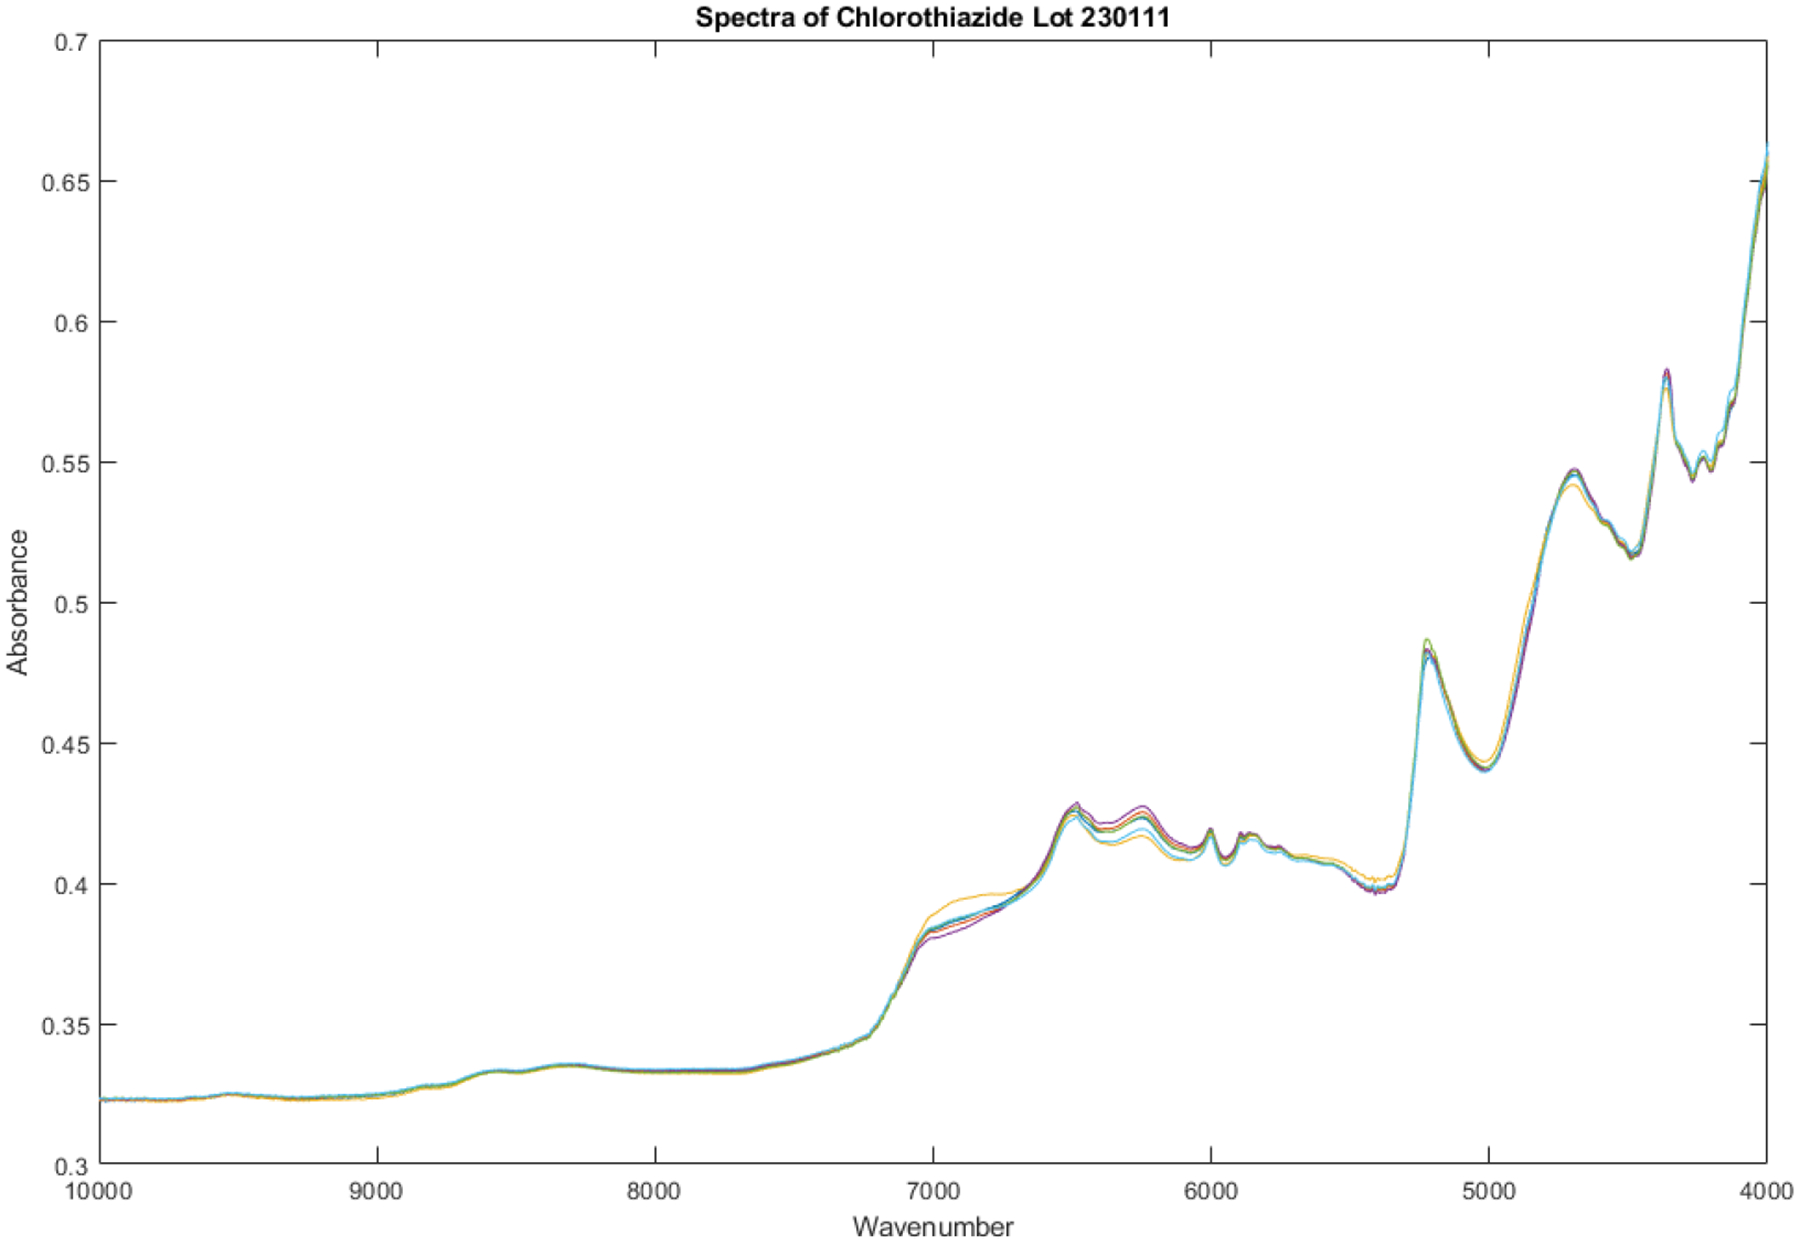
Spectra obtained from 6 vials of Sagent chlorothiazide sodium from lot 230111.The yellow line represents vial 3 in the set and is 4.2 SDs from the remaining vials in the set of 6.
A principal component score plot of these spectra appears in Figure 3. Vial number 6 stands out from the group formed by the other five vials. Vial numbers 3 (4.2 SDs, yellow line) and 6 (4.0 SDs, turquoise line) appear to be outliers when measured back to the center of the other five vials.
Figure 3.
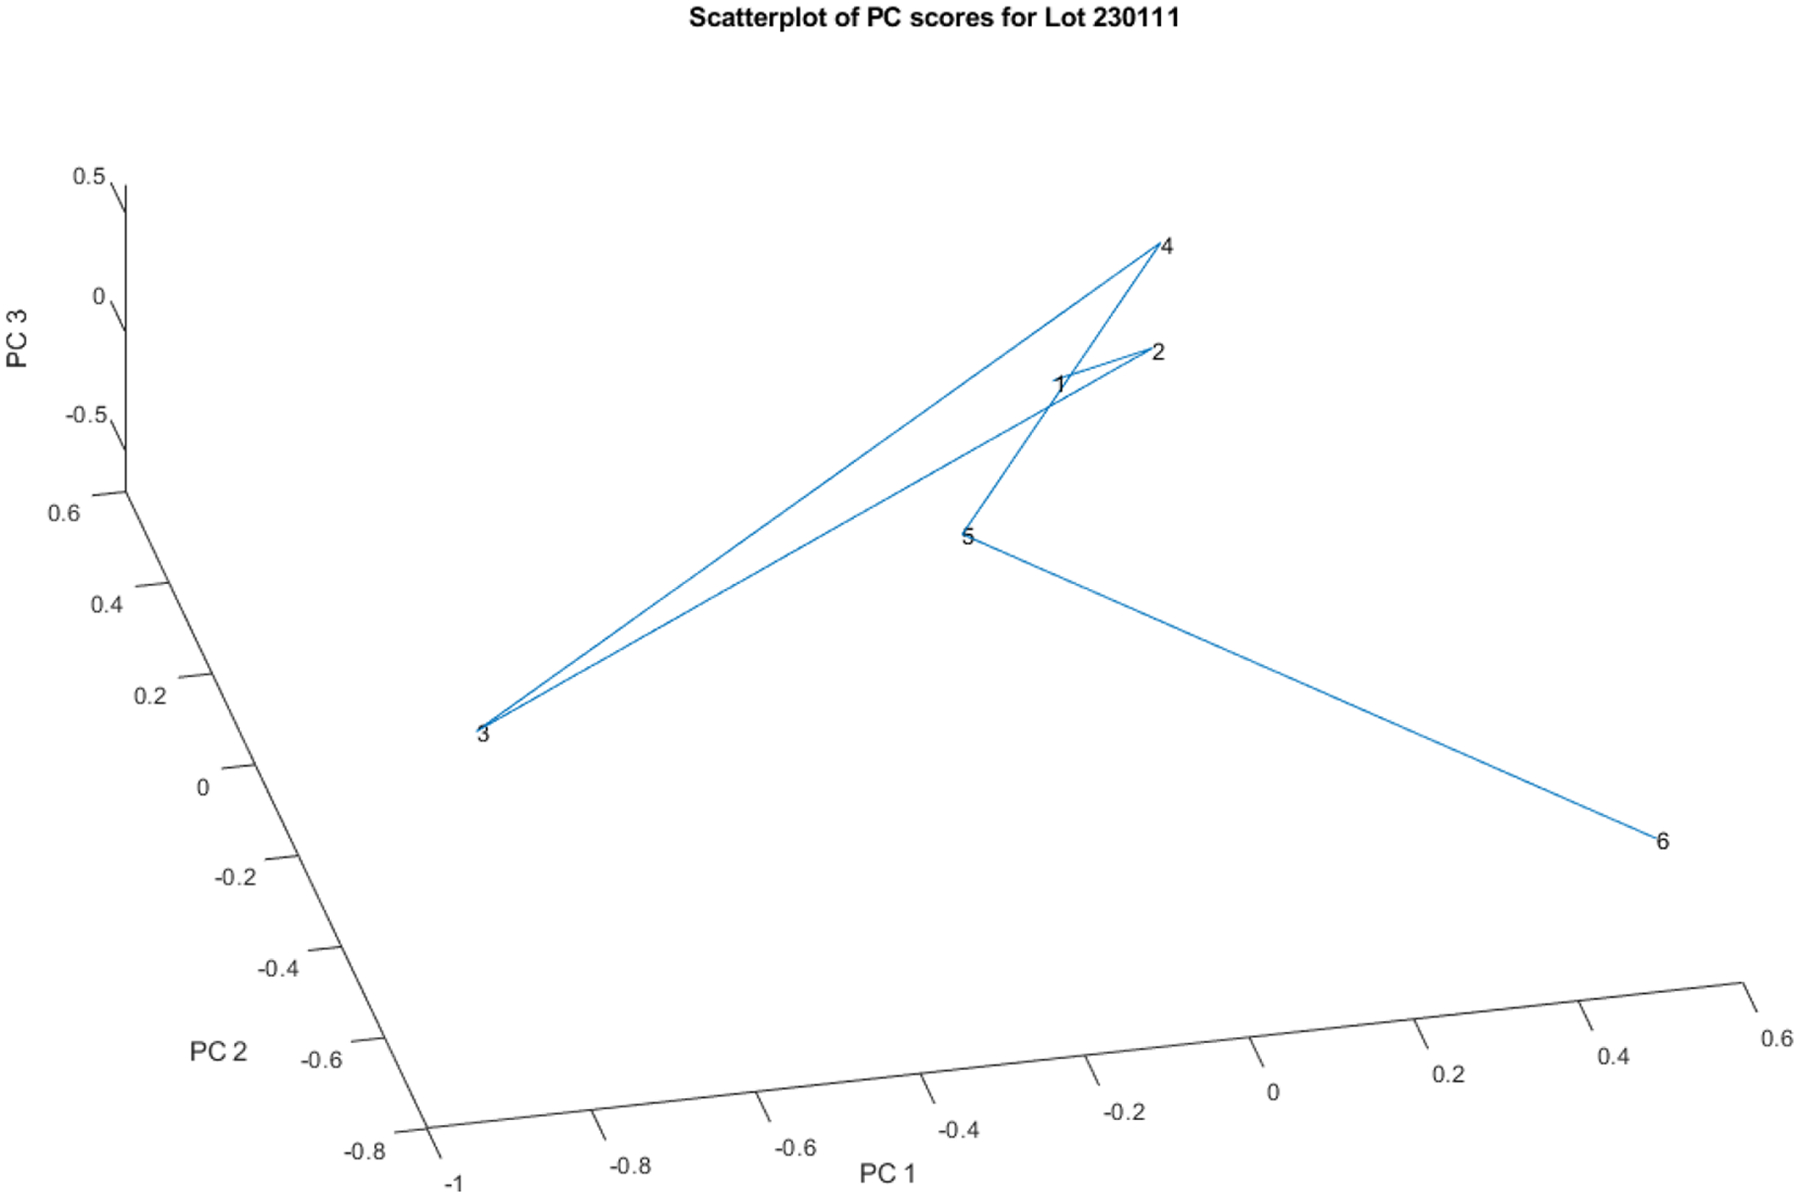
Principal components scores of the near-IR spectra shown in Figure 2. Vial numbers 3 and 6 appear to be outliers when measured back to the center of the other five vials.
Table 1 presents the variation accounted for by each of the principal components of the spectra in lot 230111, as well as the cumulative variation by PC. The first couple of PCs capture less variation than is typical for a drug manufactured in a well-controlled production process.
Table 1:
Variation accounted for by each of the principal components of the spectra
| PC Number | Variation in this PC | Cumulative PC Variation |
|---|---|---|
| 1 | 0.5198 | 0.5198 |
| 2 | 0.3292 | 0.8489 |
| 3 | 0.1284 | 0.9773 |
| 4 | 0.0125 | 0.9899 |
| 5 | 0.0101 | 1.0000 |
PC Plot
Interlot analysis
Smoothed spectra graphs of the library of 204 near infrared spectra of chlorothiazide sodium are shown in Figure 4. The spectra were obtained from 28 different lot numbers. Thirteen spectra are outliers (> 3 SDs) using a full spectrum BEST metric. These 13 outliers represent approximately 6% of the vials. The 13 outliers ranged in distance from 3.1 SDs to 6.9 SDs from the center of the library.
Figure 4.
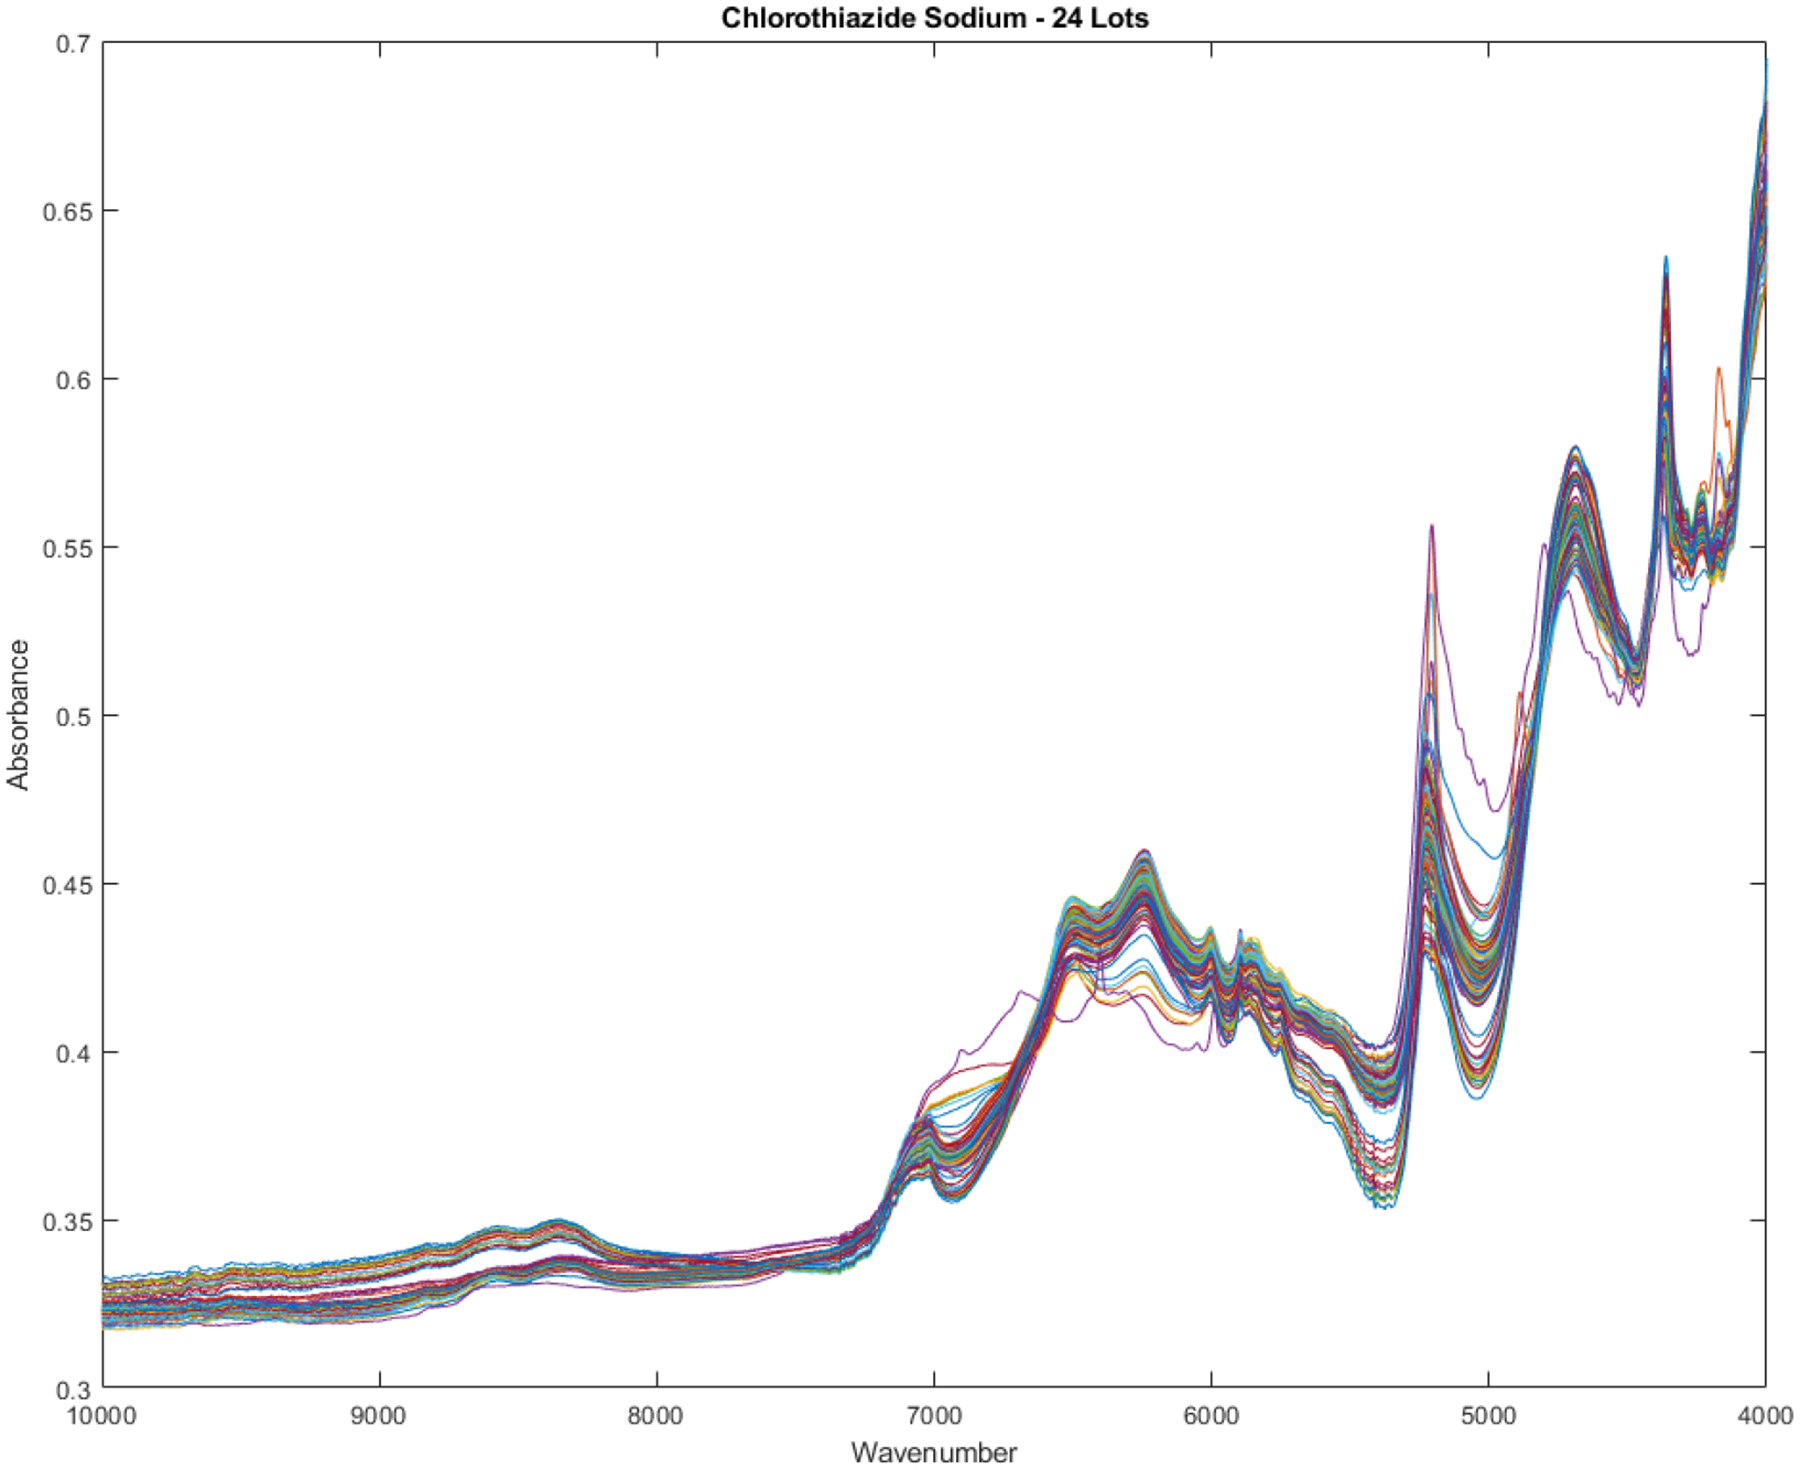
Spectra of 204 vials of chlorothiazide sodium obtained from 28 different lots. Thirteen spectra are outliers using a full spectrum BEST from the library of 28 lots.
The outliers are fairly apparent in Figure 4. The outliers are the spectra that cause more spread in the data at certain wavenumbers, such as the regions at 4300, 5150, 5500, and 6950 cm−1.
The scatterplot in Figure 5 displays the first three principal components of the 204 vials in the library. There is evidence of at least one small subcluster in the data. Additionally, there might be two subclusters in close proximity. Each of the outliers in the subclusters originated from a distinct lot number, as evidenced by the consecutive numbering of the vials that constitute the subclusters.
Figure 5.
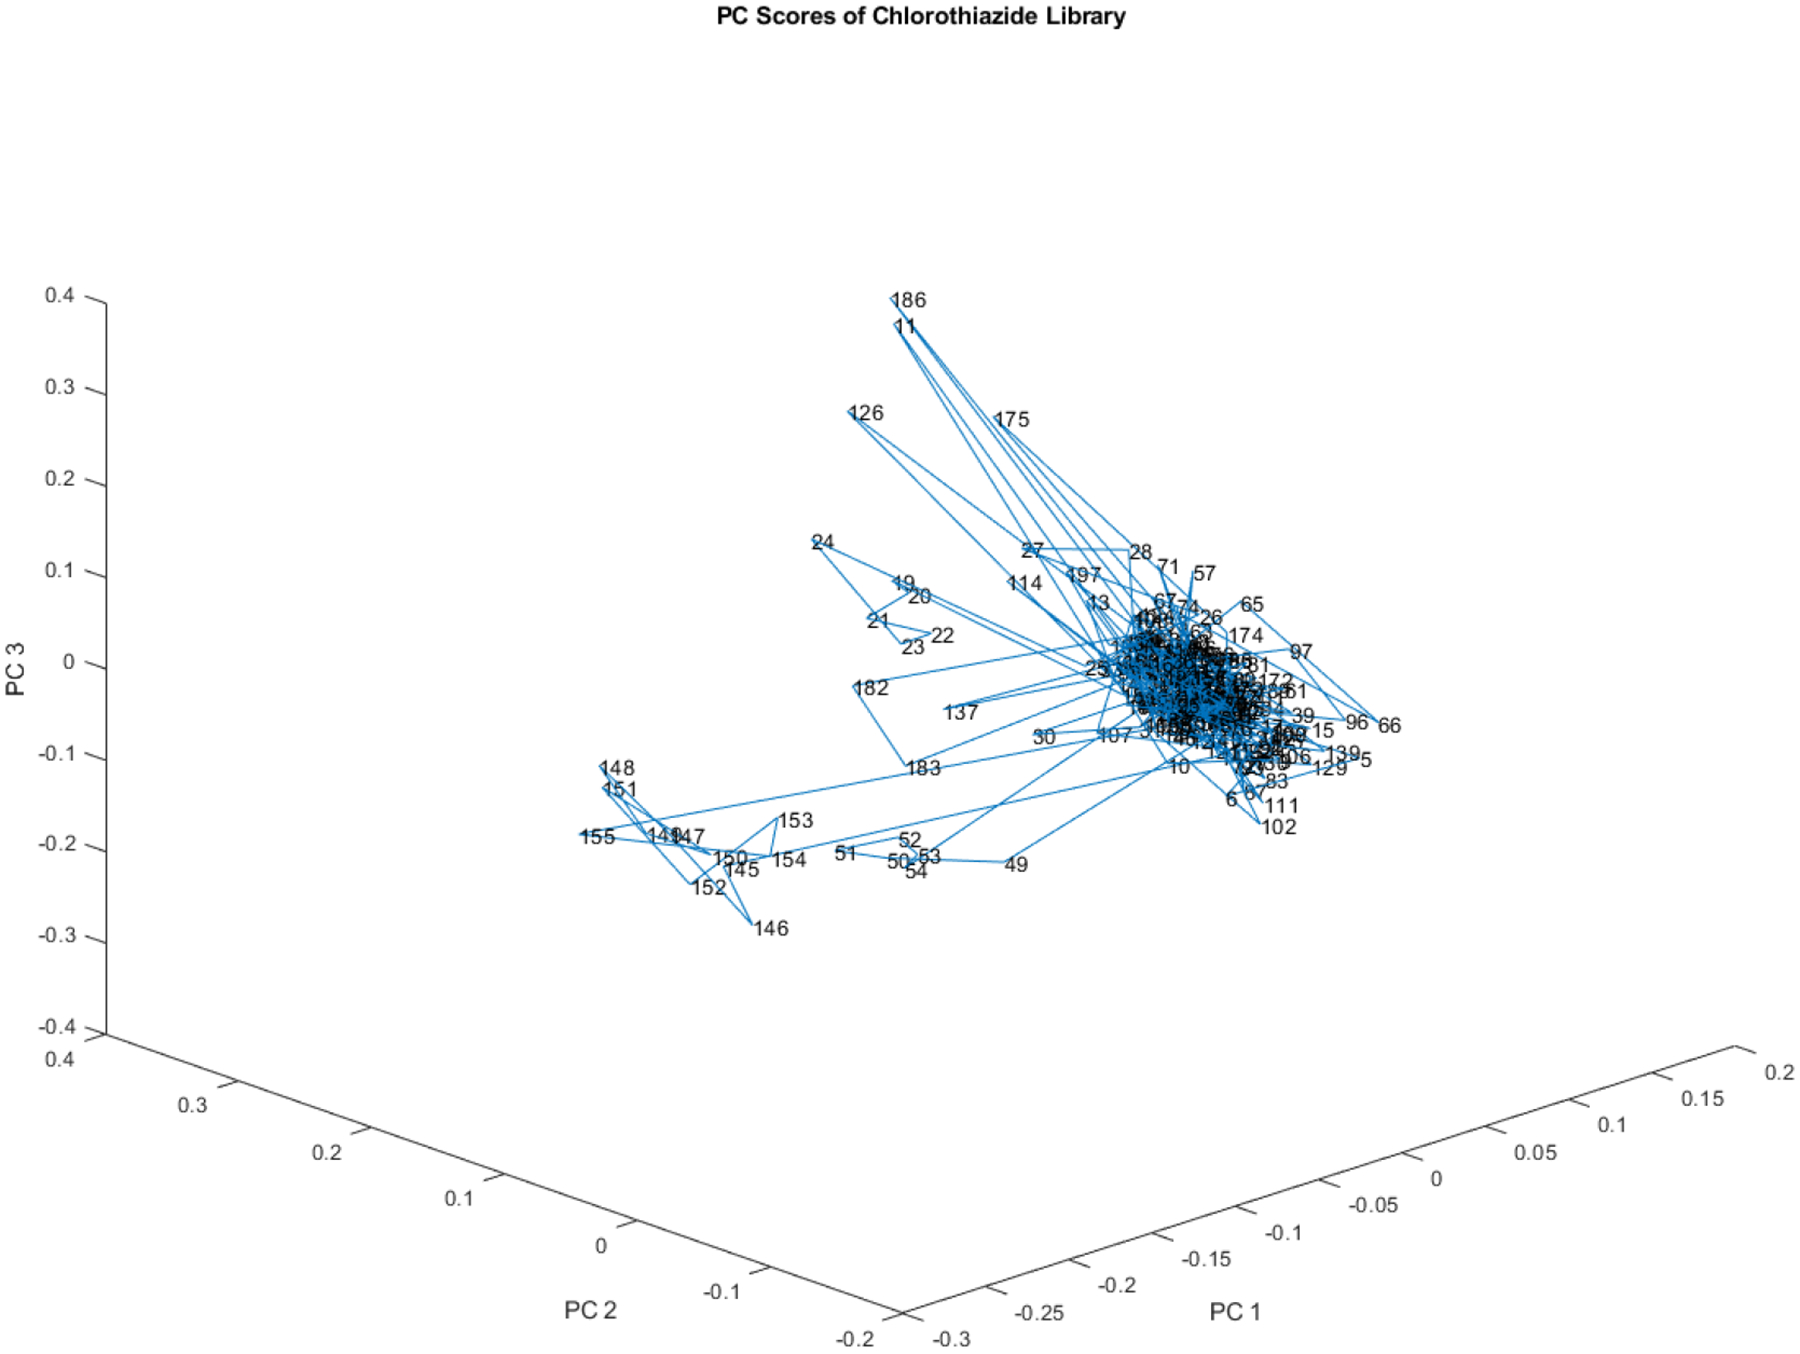
Principal component scores of the 204 vial spectra shown in Figure 4. At least one small subcluster appears to the left of the majority of the library.
PC Scatterplots
Figure 6 displays a scatterplot derived from the same data used in Figure 5, which represented 204 vials. Figure 6, however, employs a distinct rotation of the first three principal components. This altered rotation reveals other distinct groupings and outliers within the data, providing a different perspective from the one presented in Figure 5. The group of outliers from vials 140 to 160 is hidden and the group from 19 to 24 is more easily visible.The outliers in vials 140 to 160 are not readily apparent, whereas the group from 19 to 24 is more conspicuous. In this projection, vial 137 exhibits a unique characteristic: it is isolated in space, distinct from the spectral patterns of the other vials.
Figure 6.
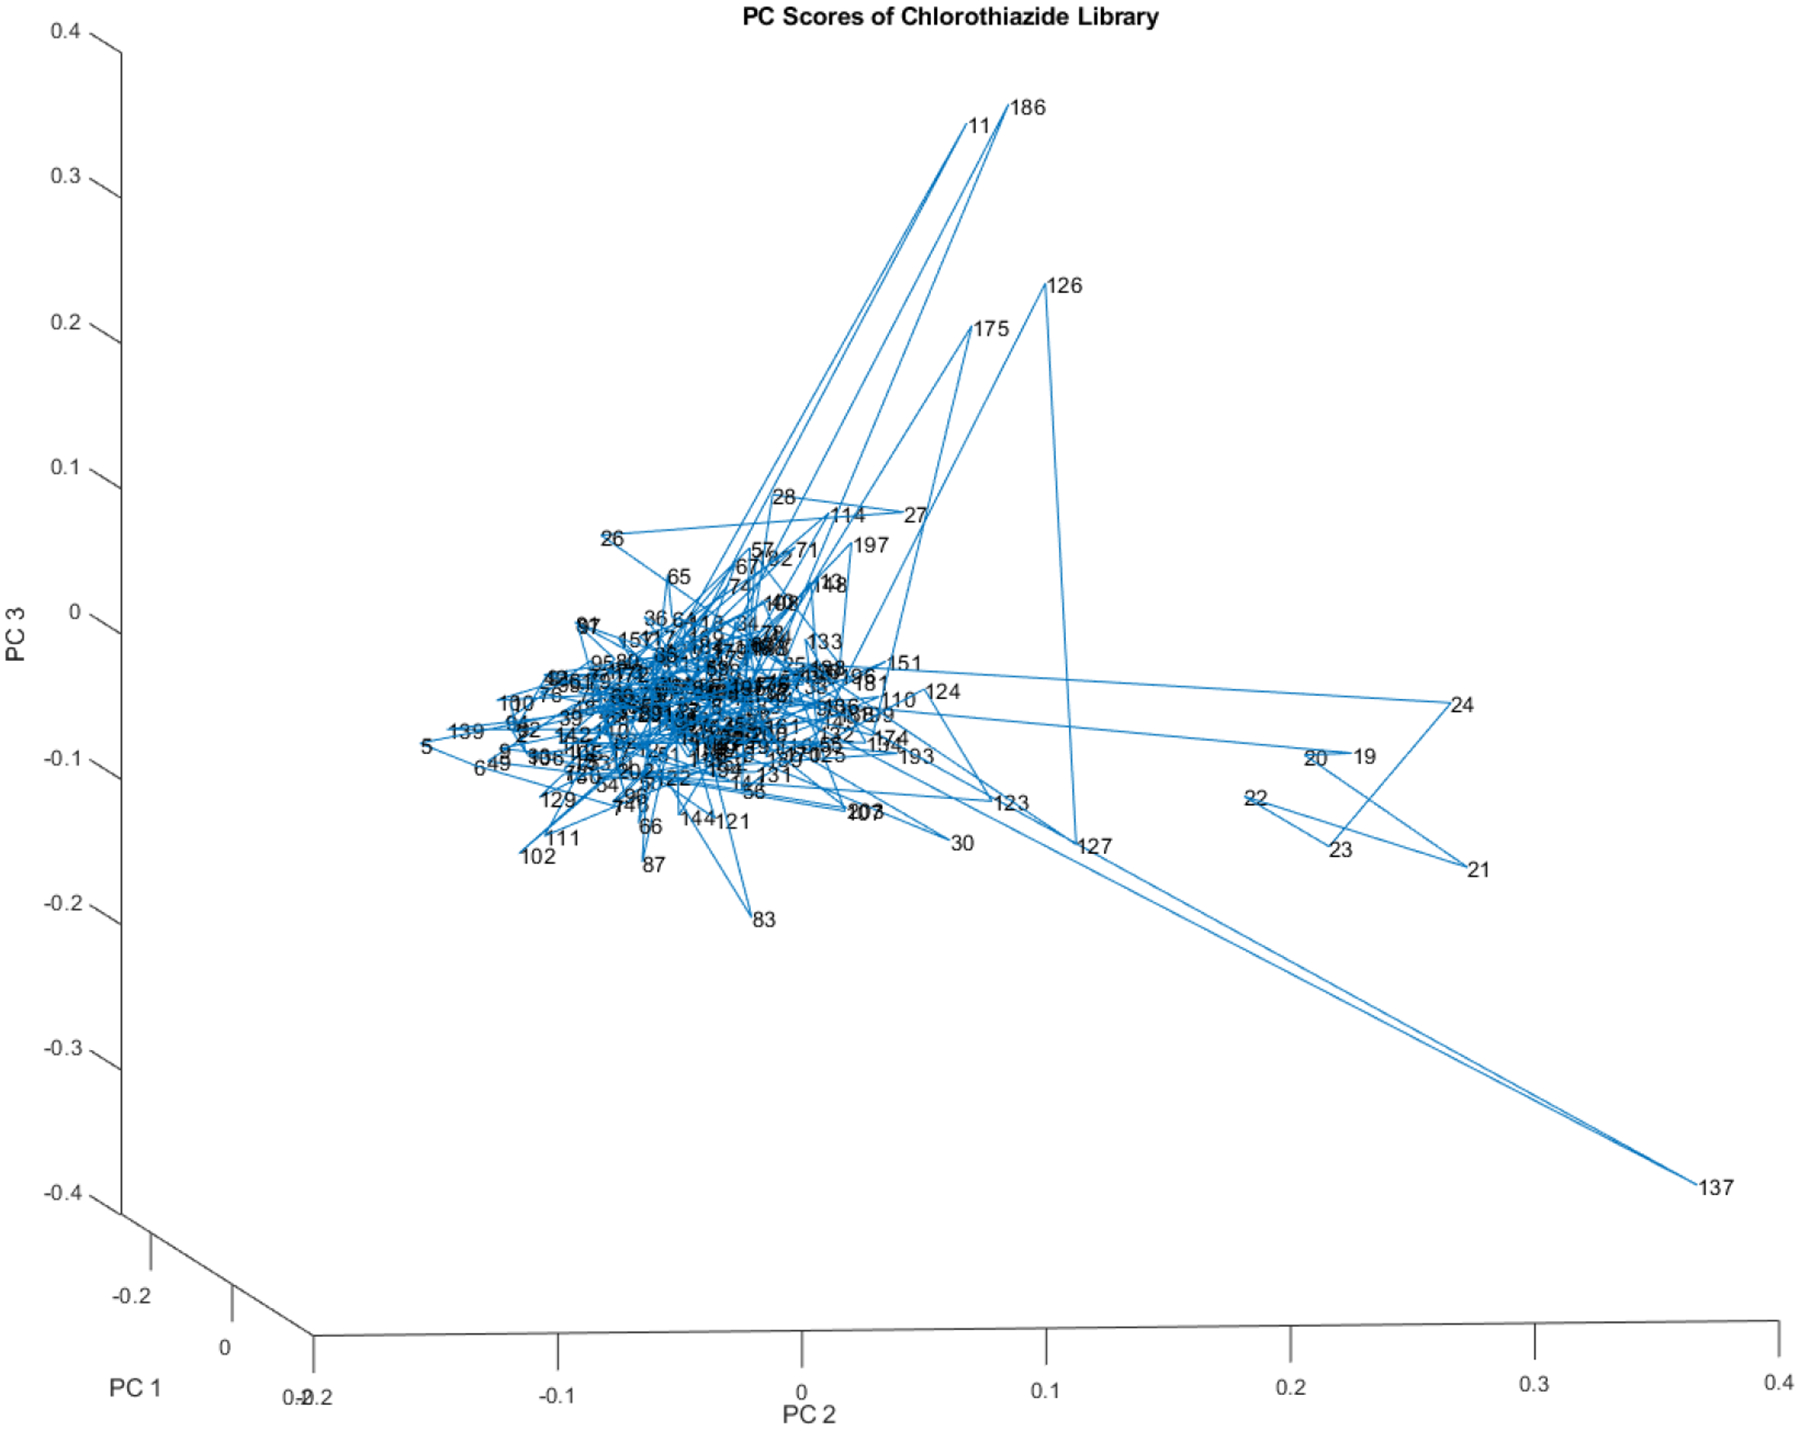
Another rotated view of the principal component scores of the 204 vial spectra shown in Figure 4. At least one small subcluster appears to the right of the majority of the library.
Figure 7 is yet another rotation of the 204 vials in the library in the space defined by PCs 1, 2, and 3. In Figure 7, two of the subclusters visible in Figure 5 are visible again. One small subcluster appears to the right of the majority of the library and another slightly larger subcluster is visible to the left. The two different subclusters derive from different lots. Figure 7 displays a further rotation of the 204 vials in the library within the volume delineated by principal components 1, 2, and 3. Notably, two subclusters previously visible in Figure 5 are again evident in Figure 7. One, a relatively small subcluster, is located to the right of the majority of the library, while the other, a slightly larger subcluster, is positioned to the left. These two distinct subclusters originate from different lots.
Figure 7.
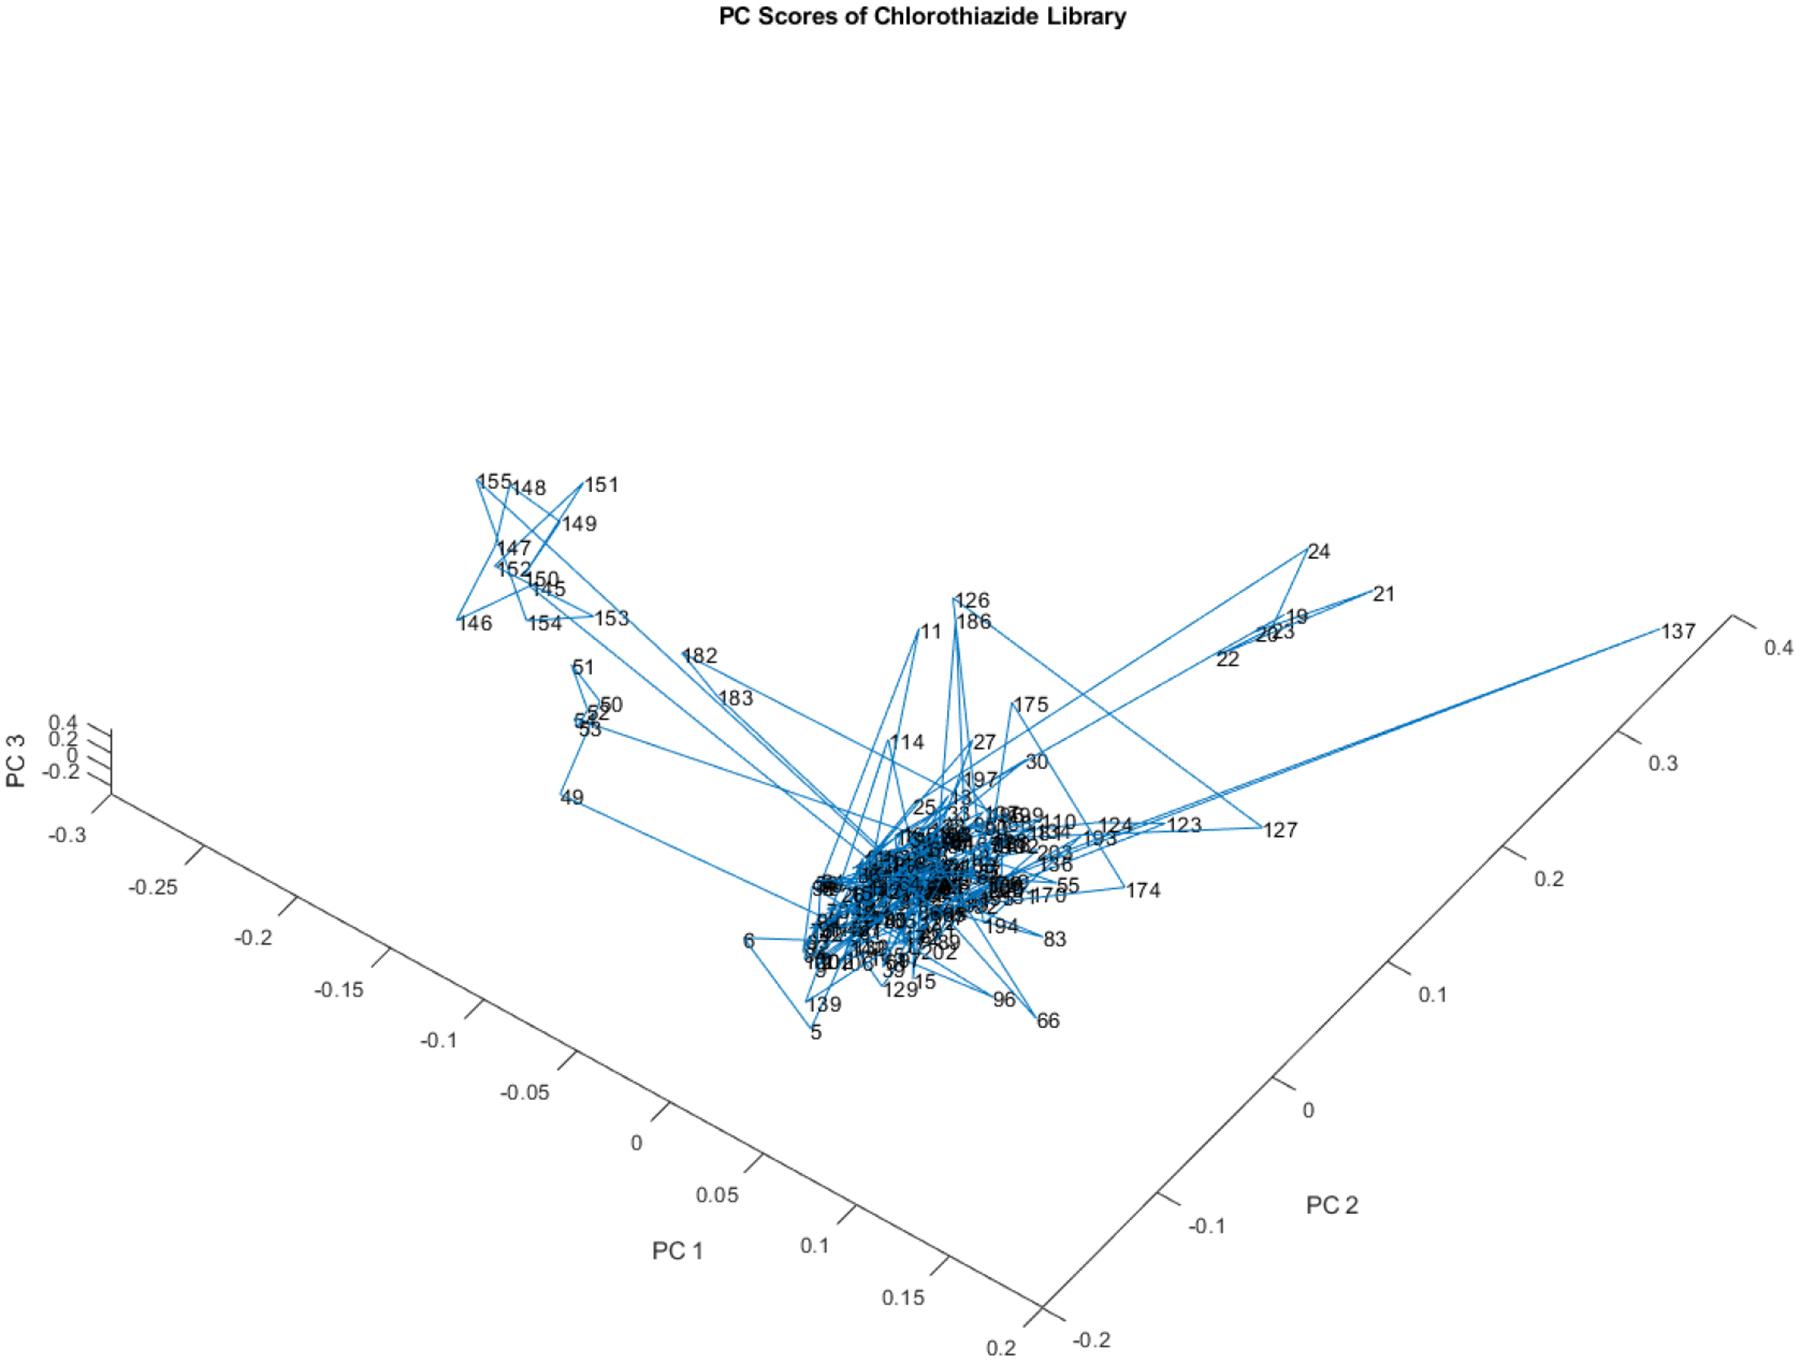
Another rotated view of the principal component scores of the 204 vial spectra shown in Figure 4. One small subcluster appears to the right of the majority of the library and another slightly larger subcluster to the left. The two different subclusters derive from different lots.
Figure 8 is one more rotation in the space defined by principal axes 1, 2, and 3. A different grouping of sub clusters and outliers appears. Figure 8 displays an additional rotation in the space defined by principal axes 1, 2, and 3. This rotation results in a different grouping of subclusters and outliers compared to previous rotations.
Figure 8.
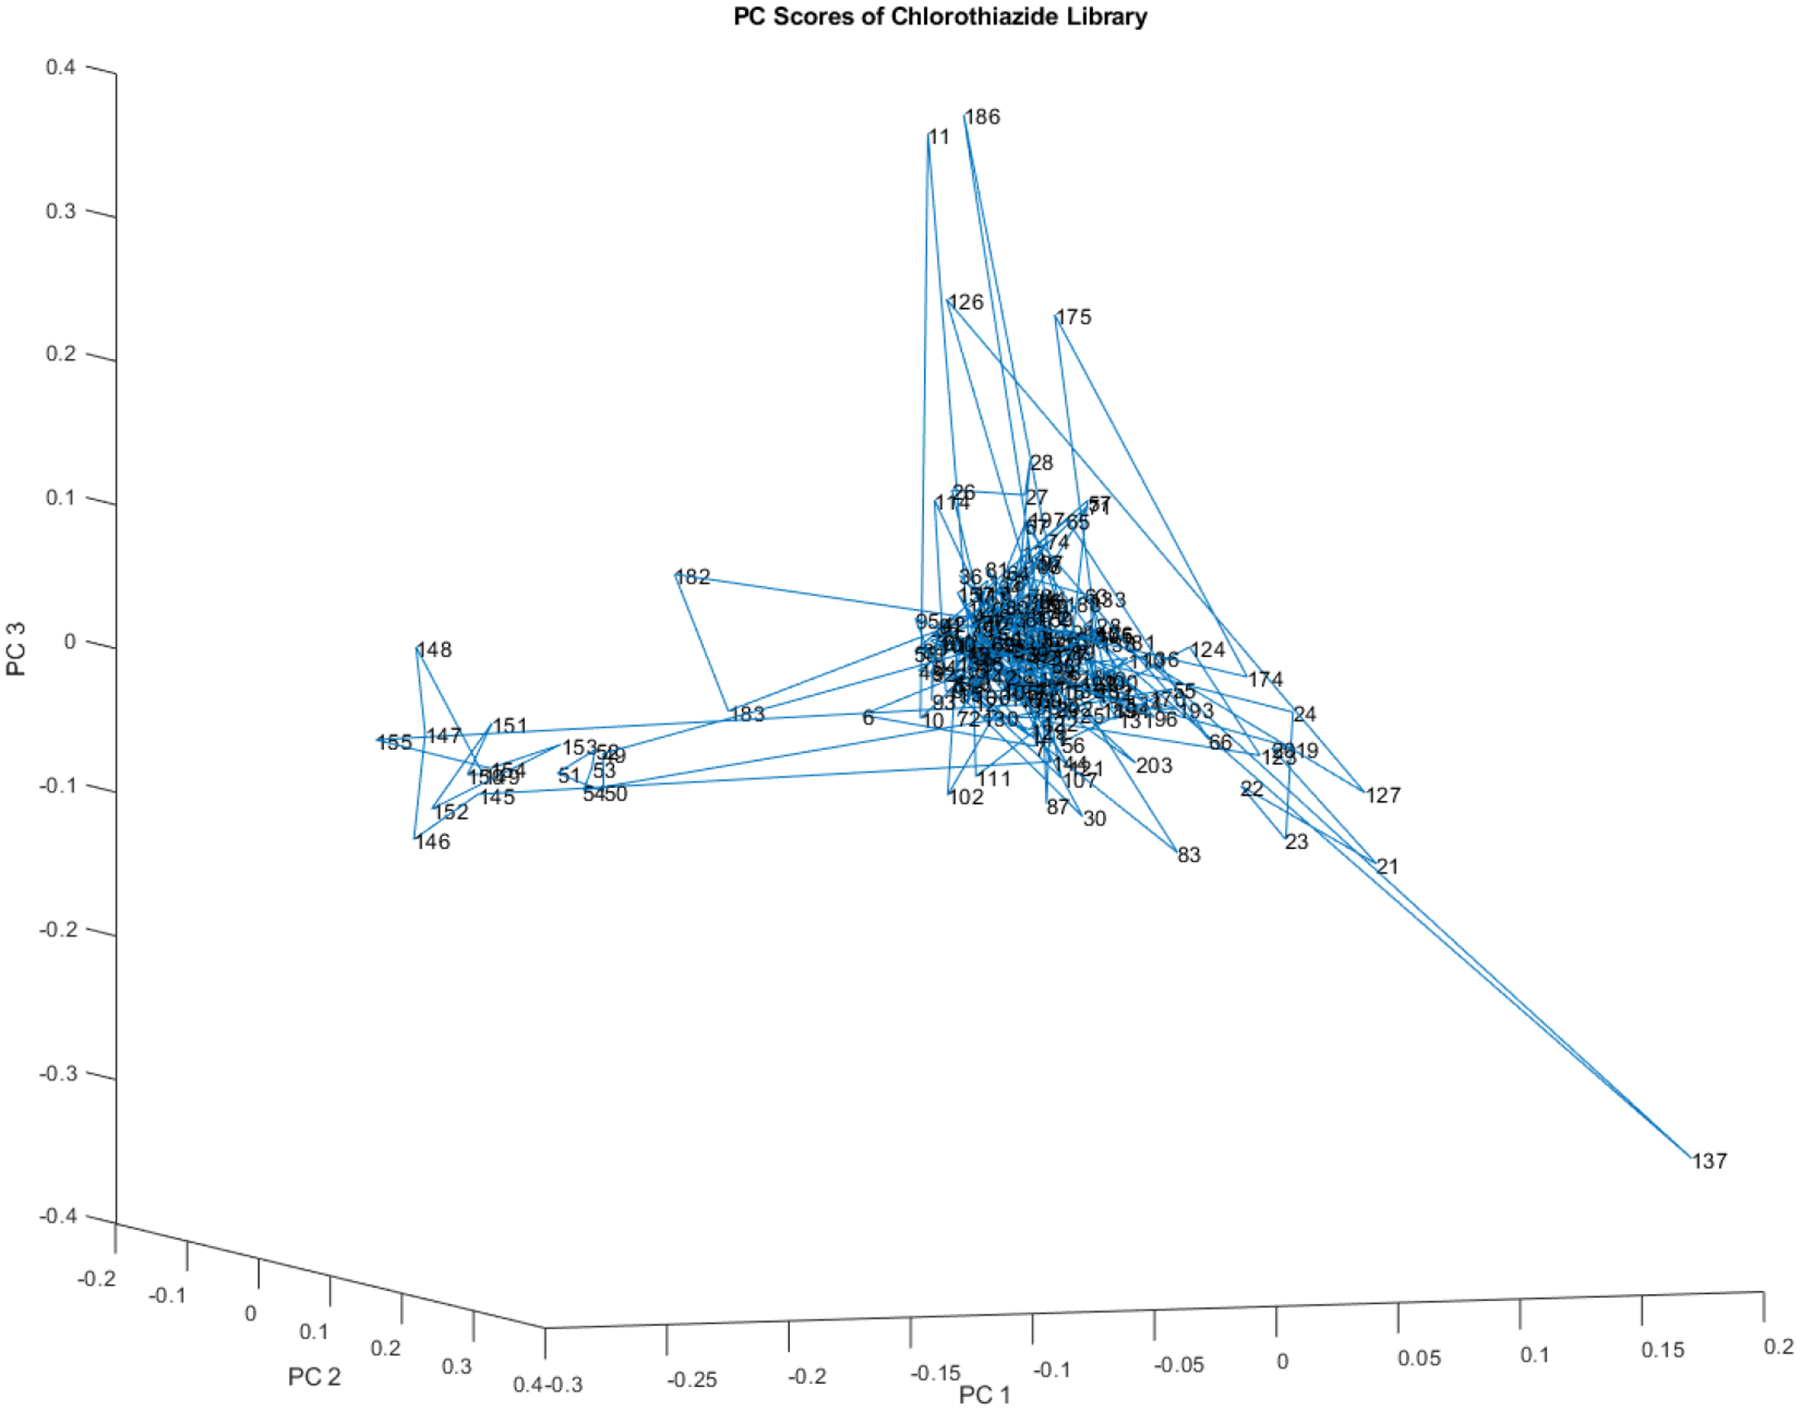
Another rotation of the principal component scores of the 204 vial spectra shown in Figure 4. At least one small subcluster appears to the left of the majority of the library.
Figure 9 shifts to the subspace described by principal components (PCs) 4, 5, and 6. The 204 vial spectra comprising the library are still chiefly dominated by a central cluster, and individual outliers as well as sub-clusters emerge. Notably, the sub-cluster that appeared in PCs 1, 2, and 3 with vials in the twenties persists in PCs 4, 5, and 6.
Figure 9.
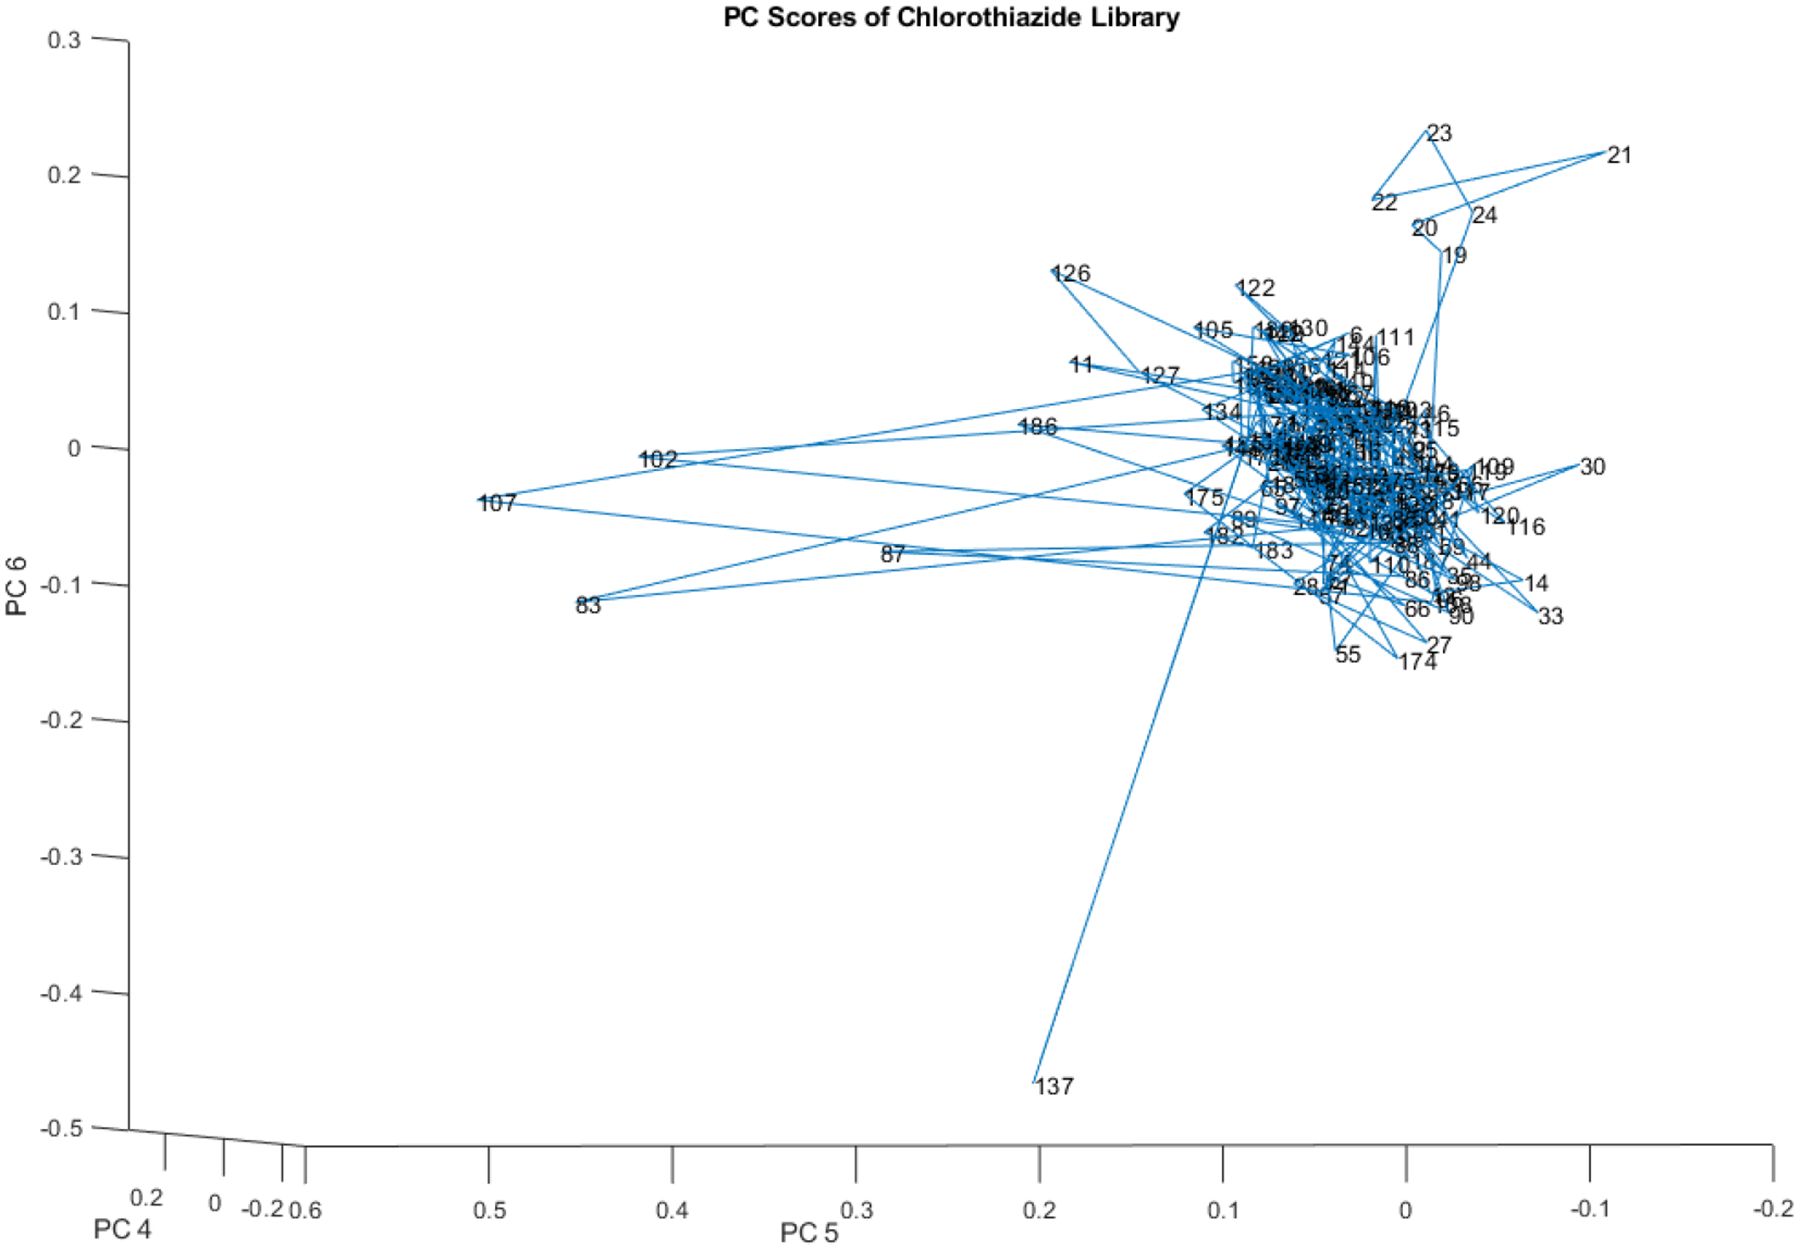
Principal component scores (PCs 4, 5, and 6) of the 204 vial spectra shown in Figure 4. At least one small subcluster appears above and to the right of the majority of the library.
Principal component scores (PCs 7, 8, and 9) of the 204 vial spectra are presented in Figure 10. Compared to PCs 1, 2, and 3, there is noticeably more noise in PCs 7, 8, and 9. As a result, the subclusters are no longer discernible, although individual outliers remain visible.
Figure 10.
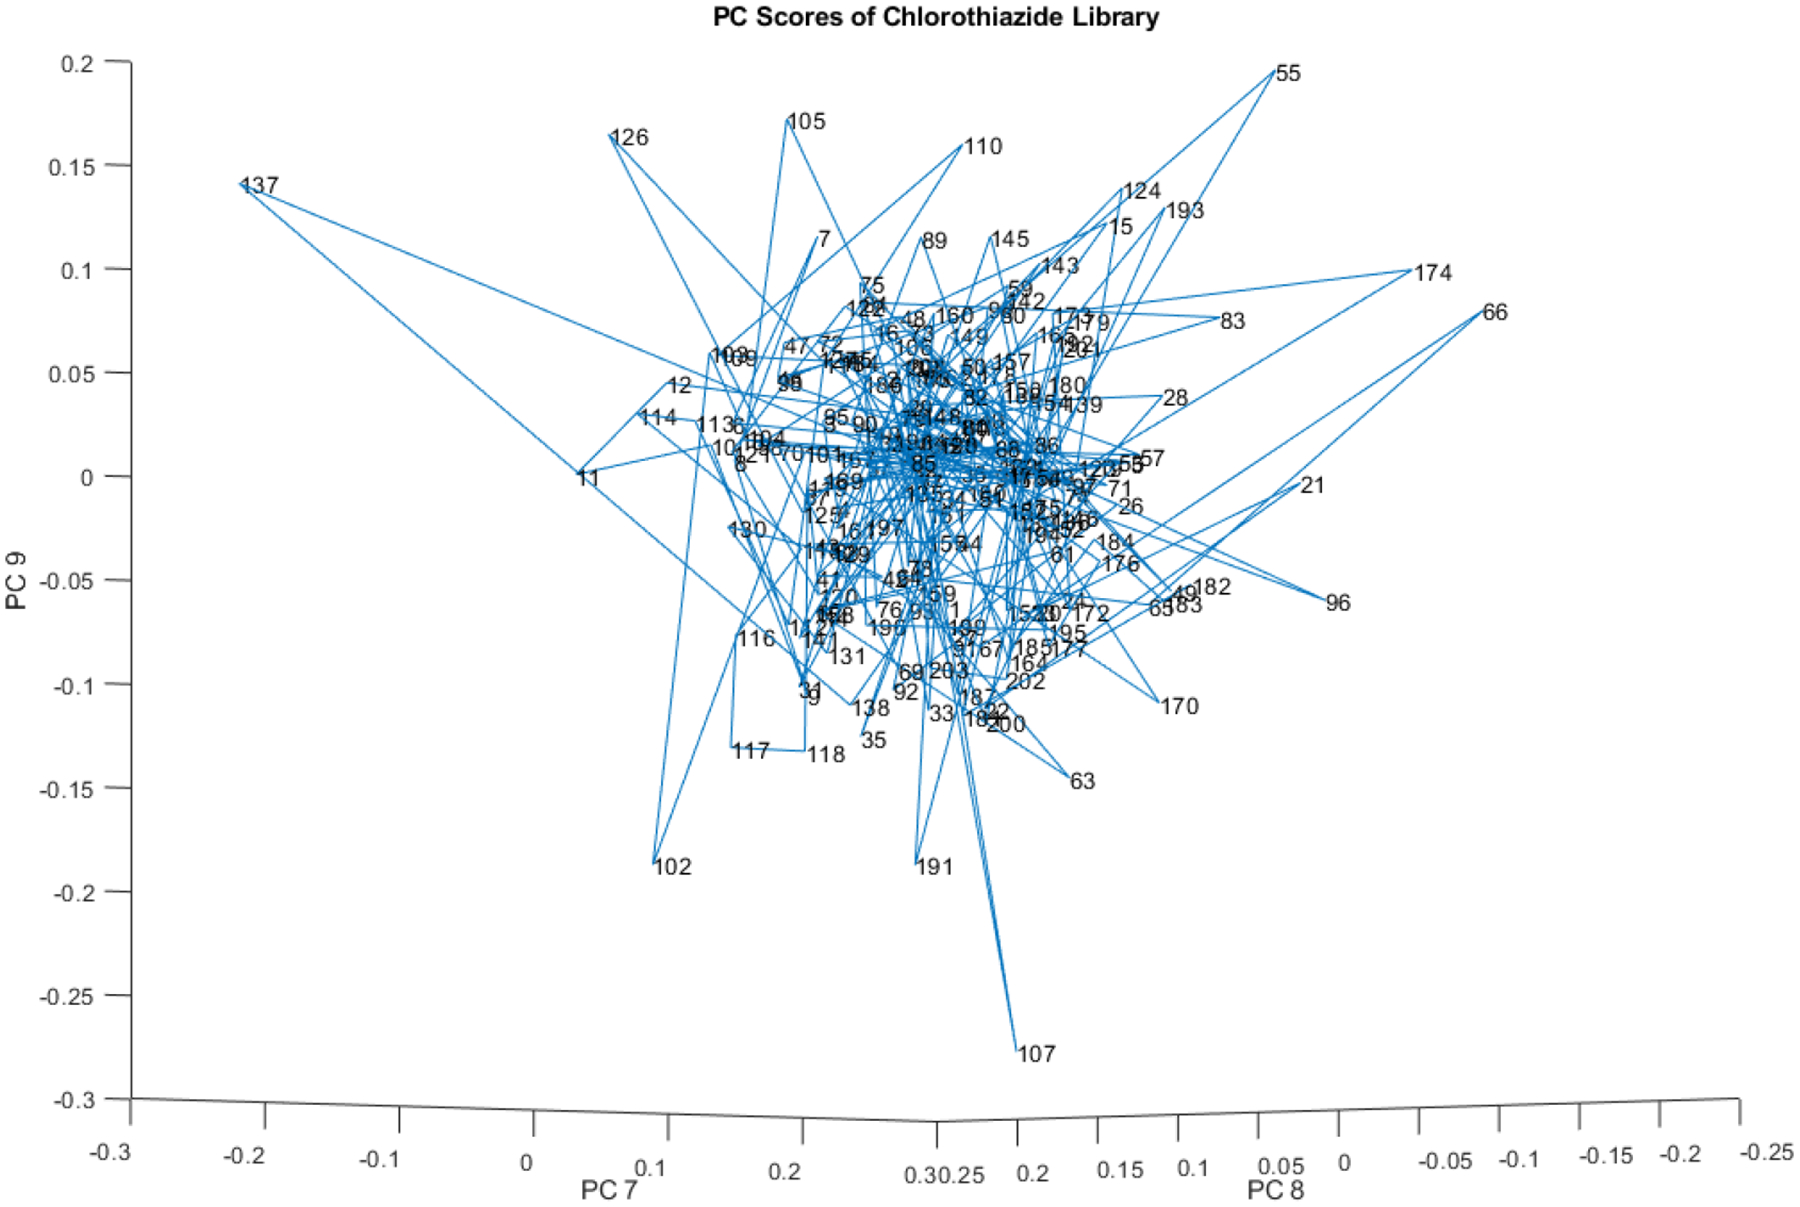
Principal component scores (PCs 7, 8, and 9) of the 204 vial spectra shown in Figure 9.
Table 2 displays the variation accounted for by the first 10 principal components of the chlorothiazide sodium spectra in the library. This variation is significantly higher in the first two principal components than in products from a well-controlled pharmaceutical manufacturing process. For many drugs, 90% of the spectral variation appears on the first principal component. However, Table 2 shows that this level of variation is not reached until the fourth principal component in this case.
Table 2:
Variation accounted for by each of the principal components of the spectra in the library
| PC Number | Variation in this PC | Cumulative PC Variation |
|---|---|---|
| 1 | 0.6493 | 0.6493 |
| 2 | 0.1659 | 0.8152 |
| 3 | 0.0838 | 0.8990 |
| 4 | 0.0416 | 0.9406 |
| 5 | 0.0205 | 0.9612 |
| 6 | 0.0105 | 0.9717 |
| 7 | 0.0081 | 0.9798 |
| 8 | 0.0071 | 0.9869 |
| 9 | 0.0028 | 0.9897 |
| 10 | 0.0027 | 0.9923 |
PC Loadings Plots
Figure 11 depicts the loadings spectrum of PC 1 for the spectral library from 204 vials of chlorothiazide sodium. Important peaks are marked with arrows. The noise level appears to be very low. Because near infrared detectors are thermal detectors, noise tends to increase at the higher wavenumbers first. Baseline adjustment by multiplicative scatter correction tends to dominate the first principal component of all near-infrared diffuse-reflectance spectra.
Figure 11.
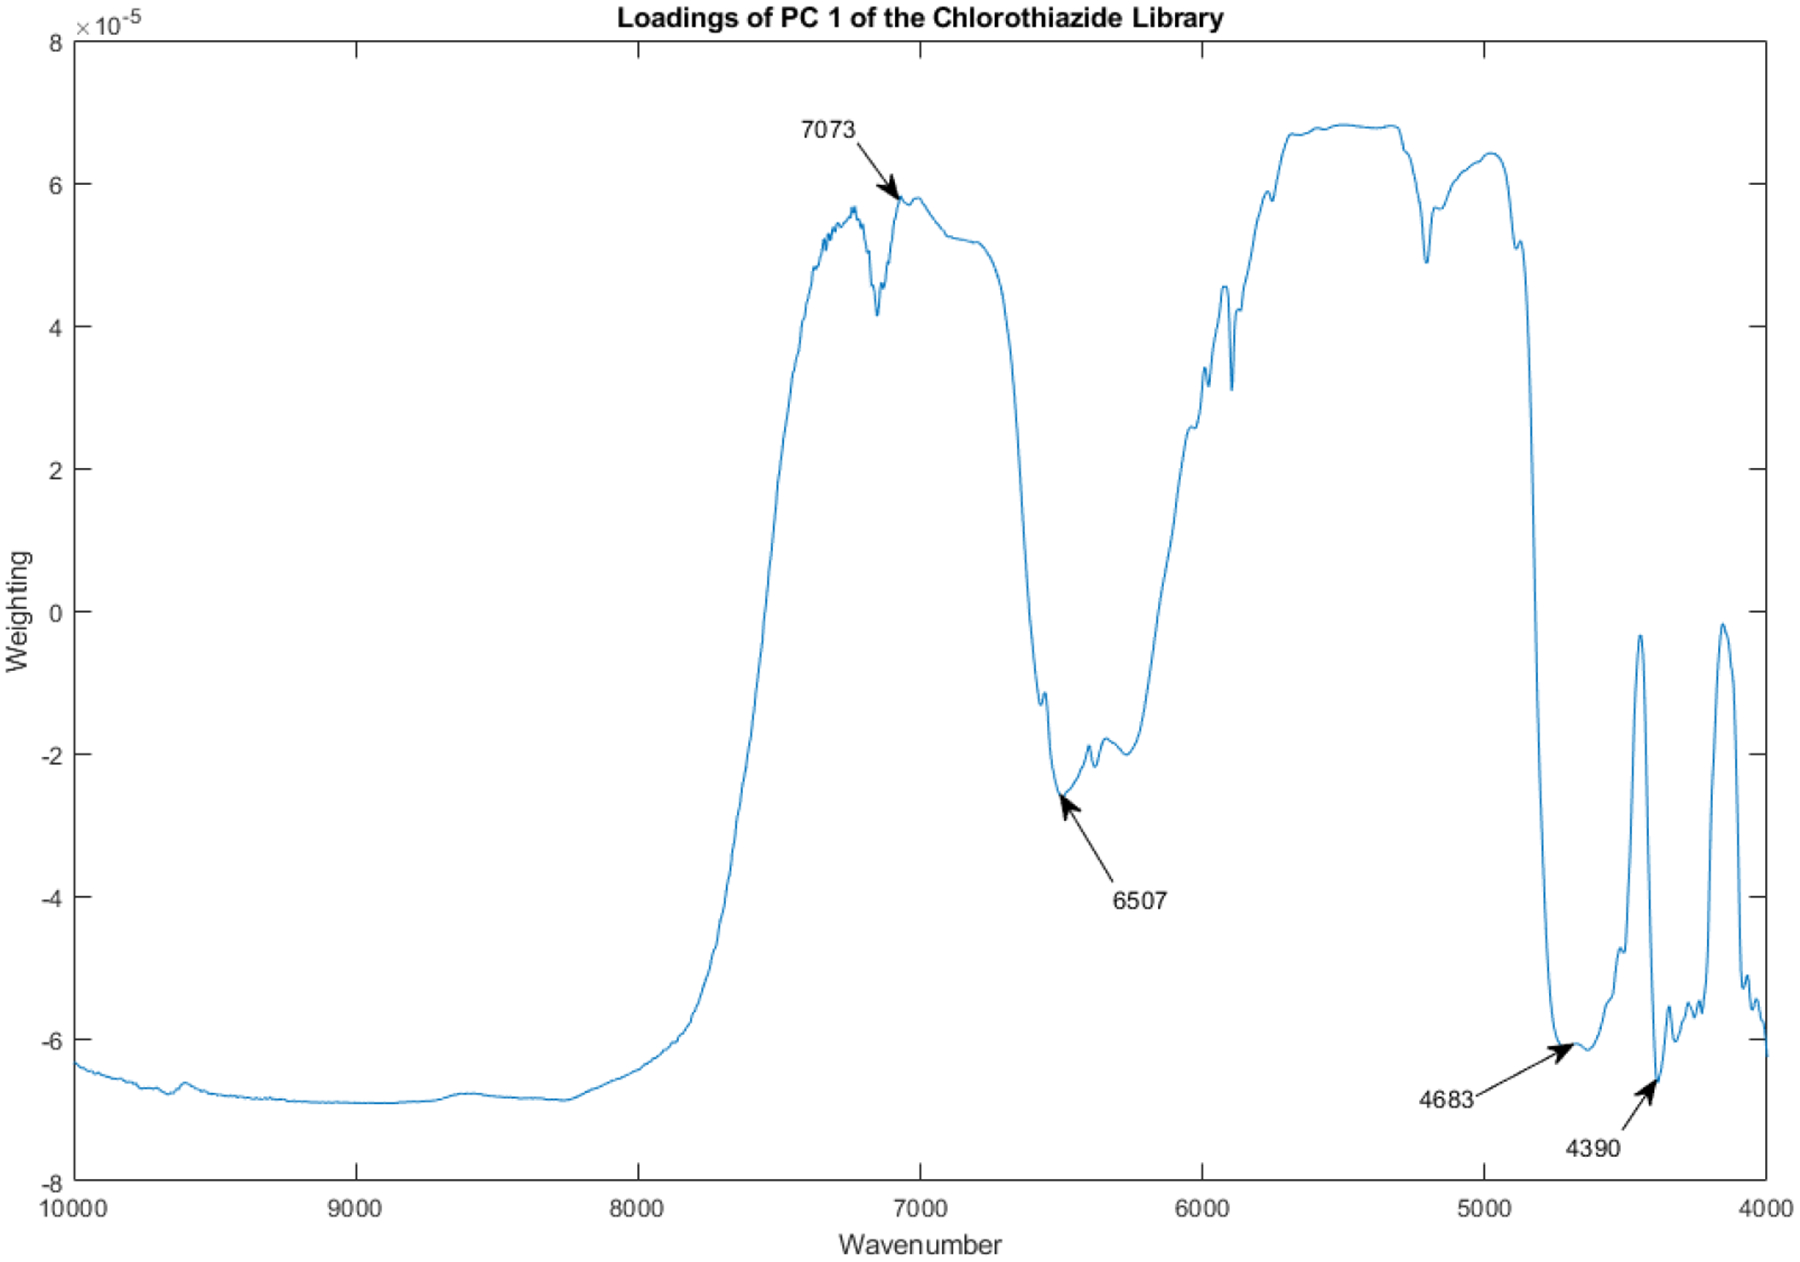
Loadings spectrum of PC 1 for the spectral library from 204 vials of chlorothiazide sodium. Important peaks are marked with arrows.
By PC 2 the spectral loadings already reveal mostly chemical differences between the vials (see Figure 12).
Figure 12.
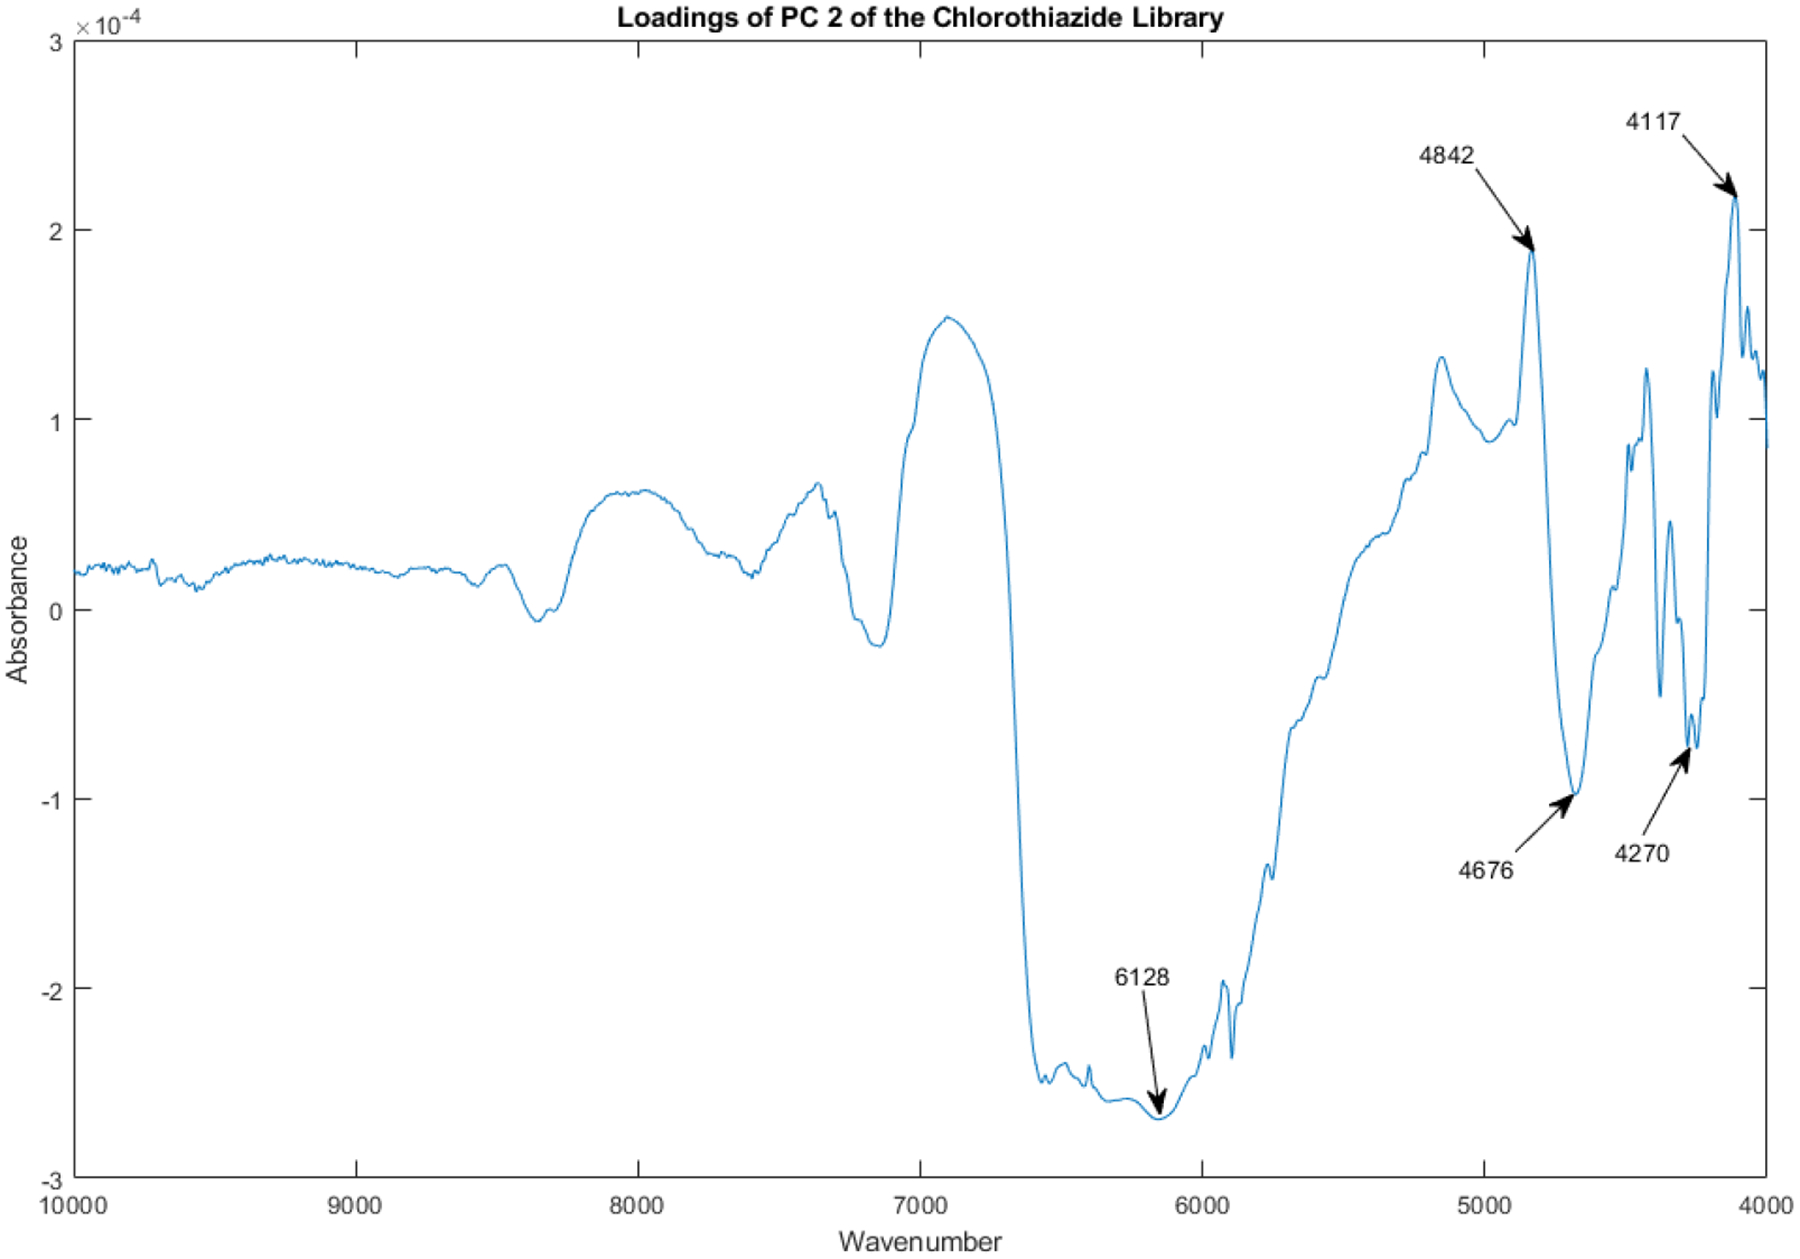
Loadings spectrum of PC 2 of the spectral library.
The loadings spectrum of PC 3 of the library of vials appears in Figure 13.
Figure 13.
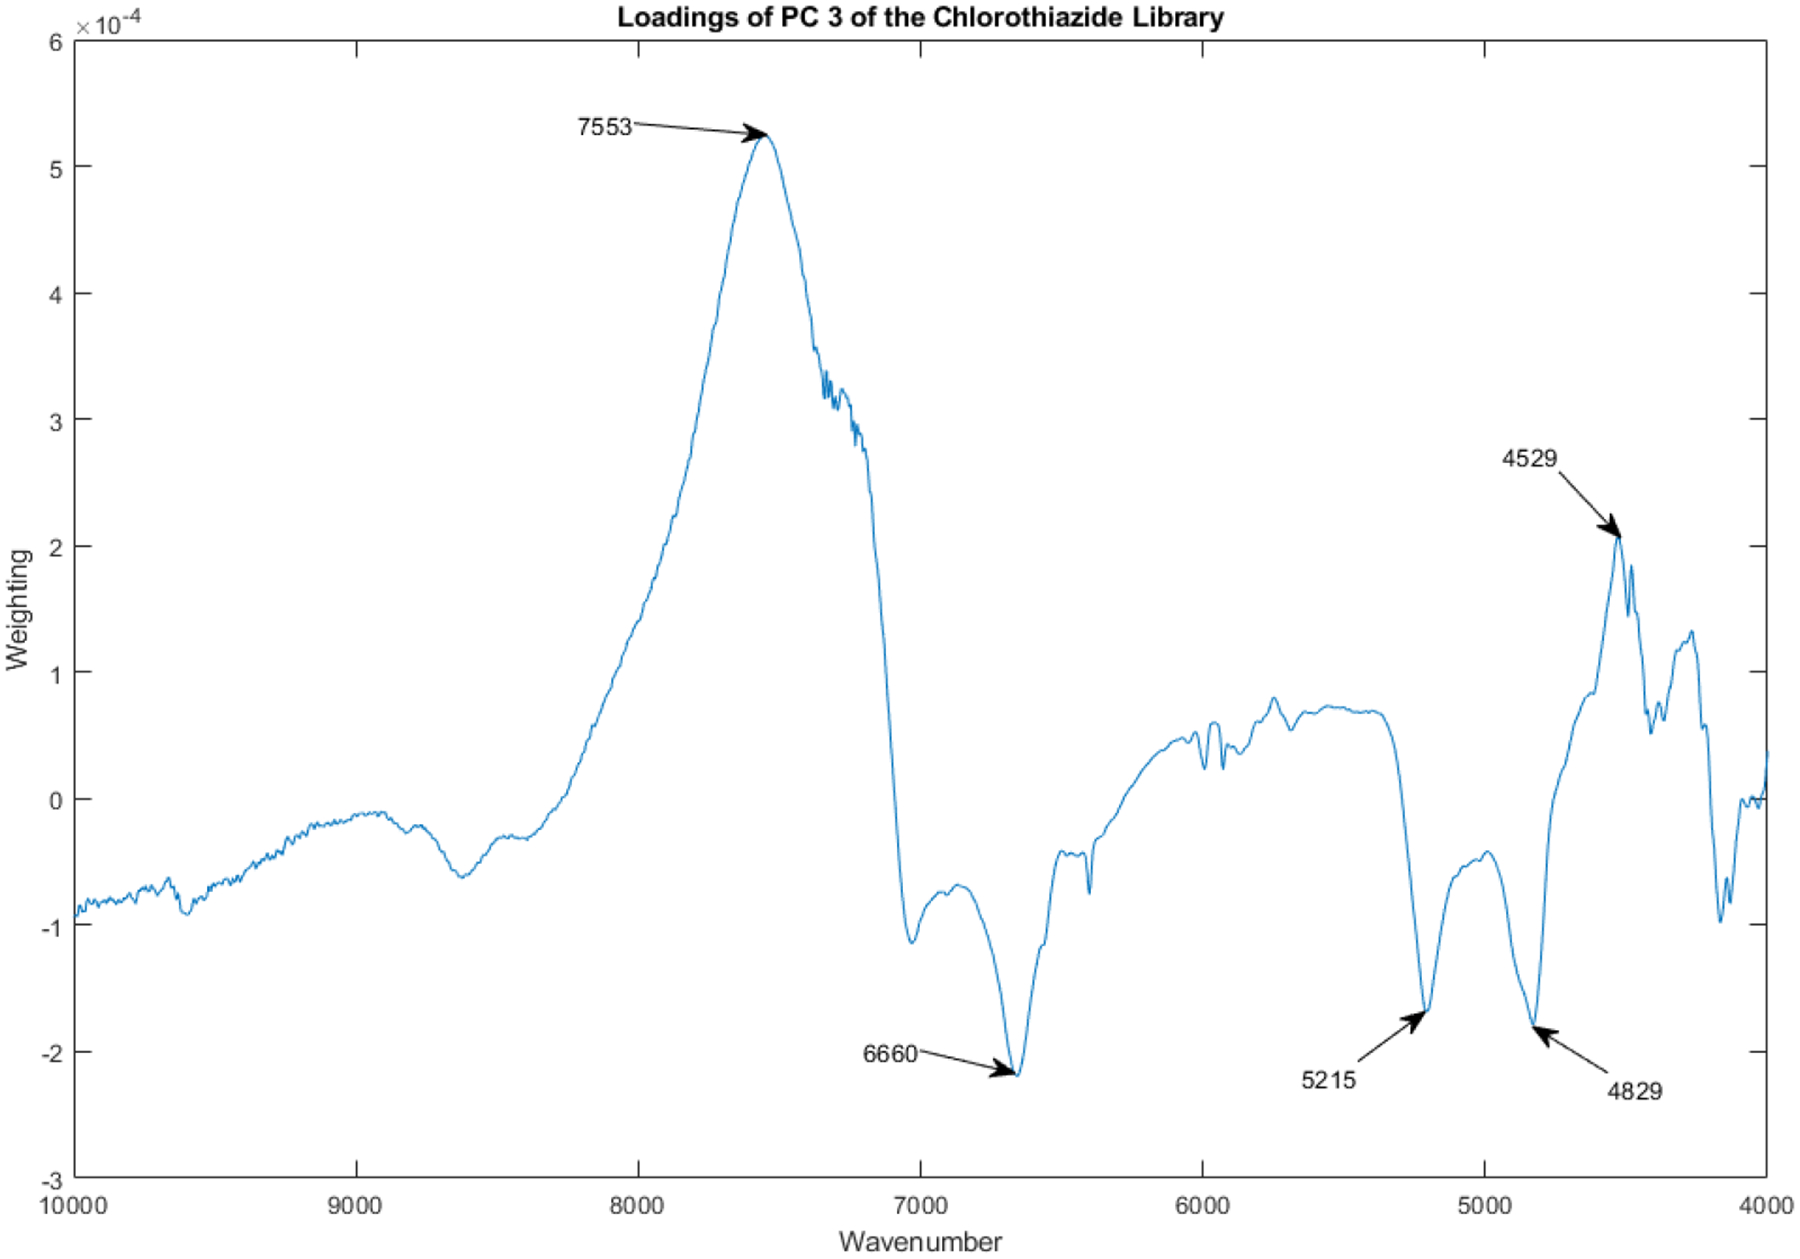
Loadings spectrum of PC 3 of the spectral library.
The loadings spectrum of PC 4 of the library of vials appears in Figure 14.
Figure 14.
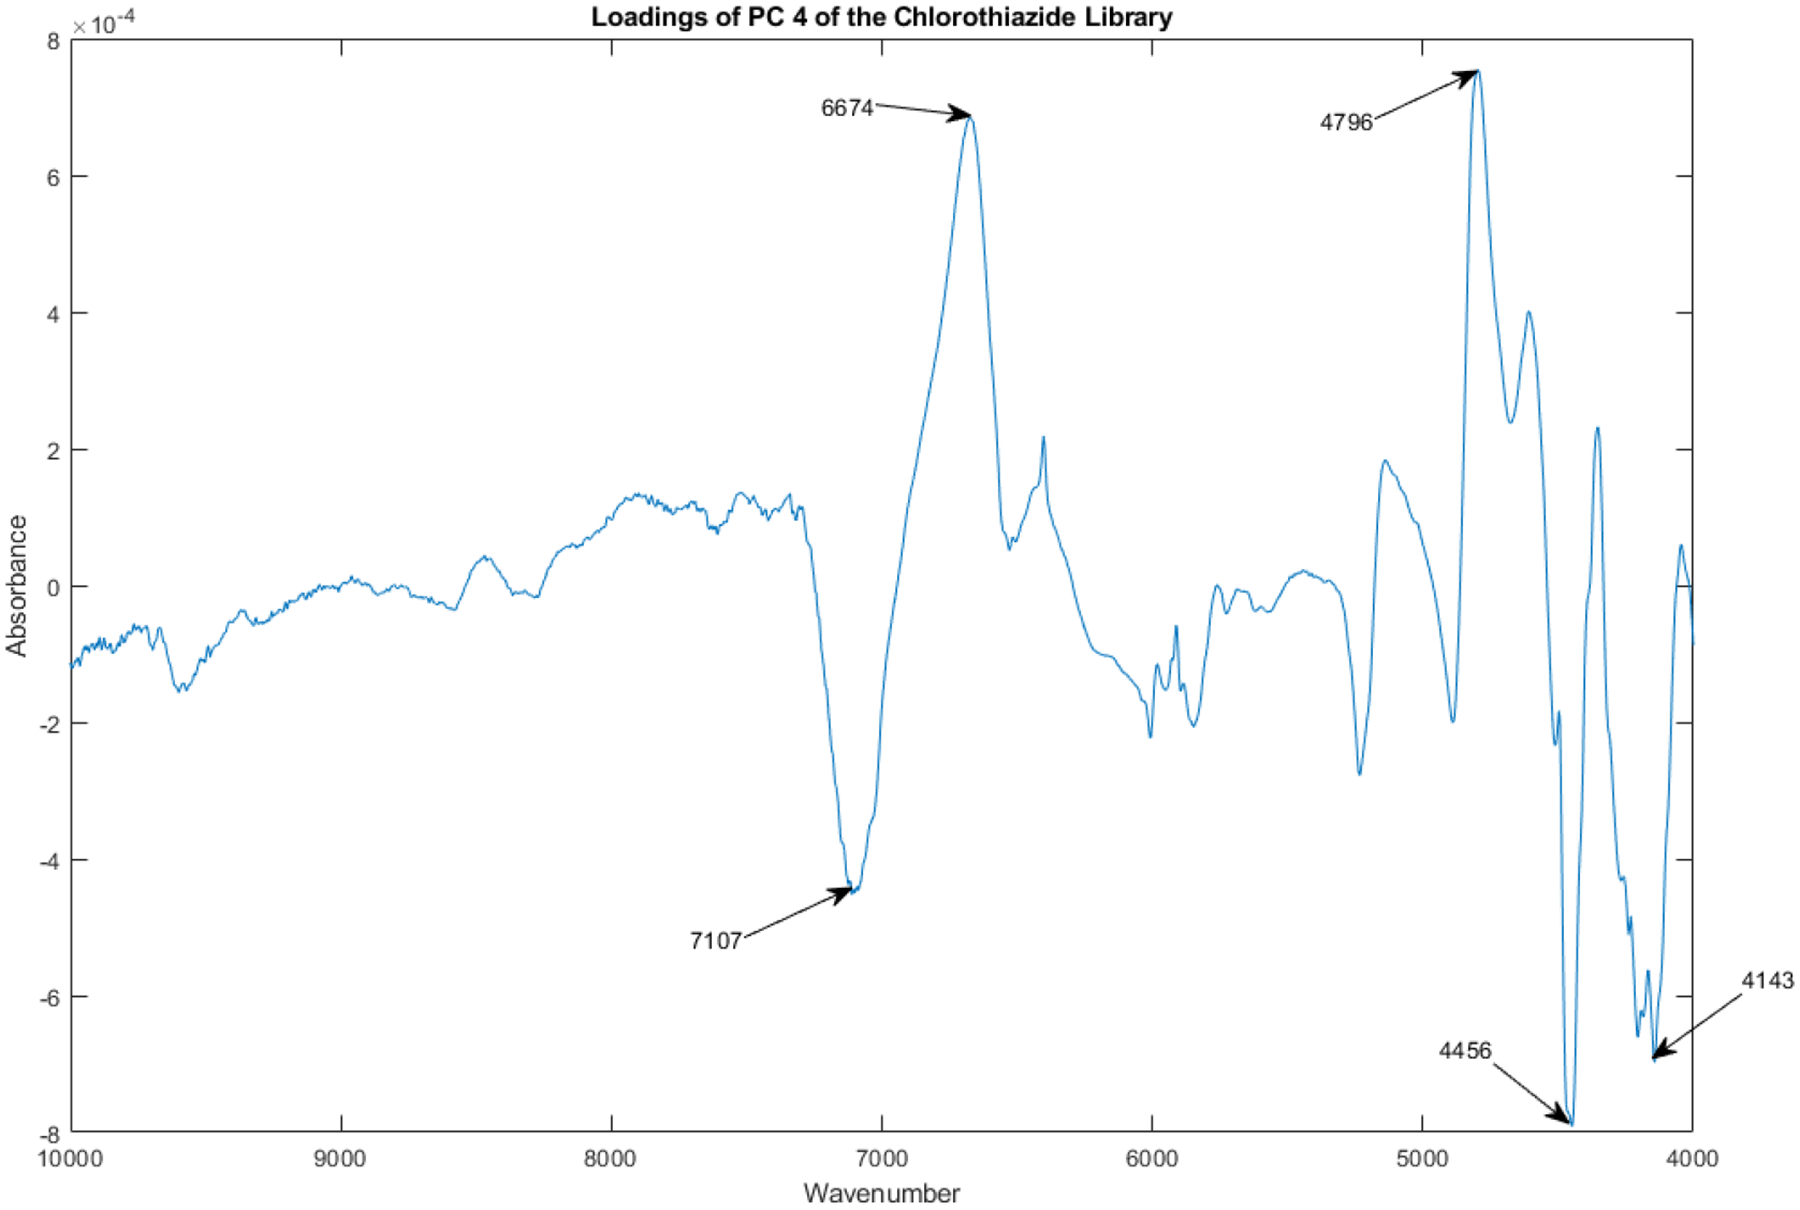
Loadings spectrum of PC 4 of the spectral library.
The loadings spectrum of PC 4 of the library of vials appears in Figure 14.
The loadings spectrum of PC 5 of the library of vials appears in Figure 15.
Figure 15.
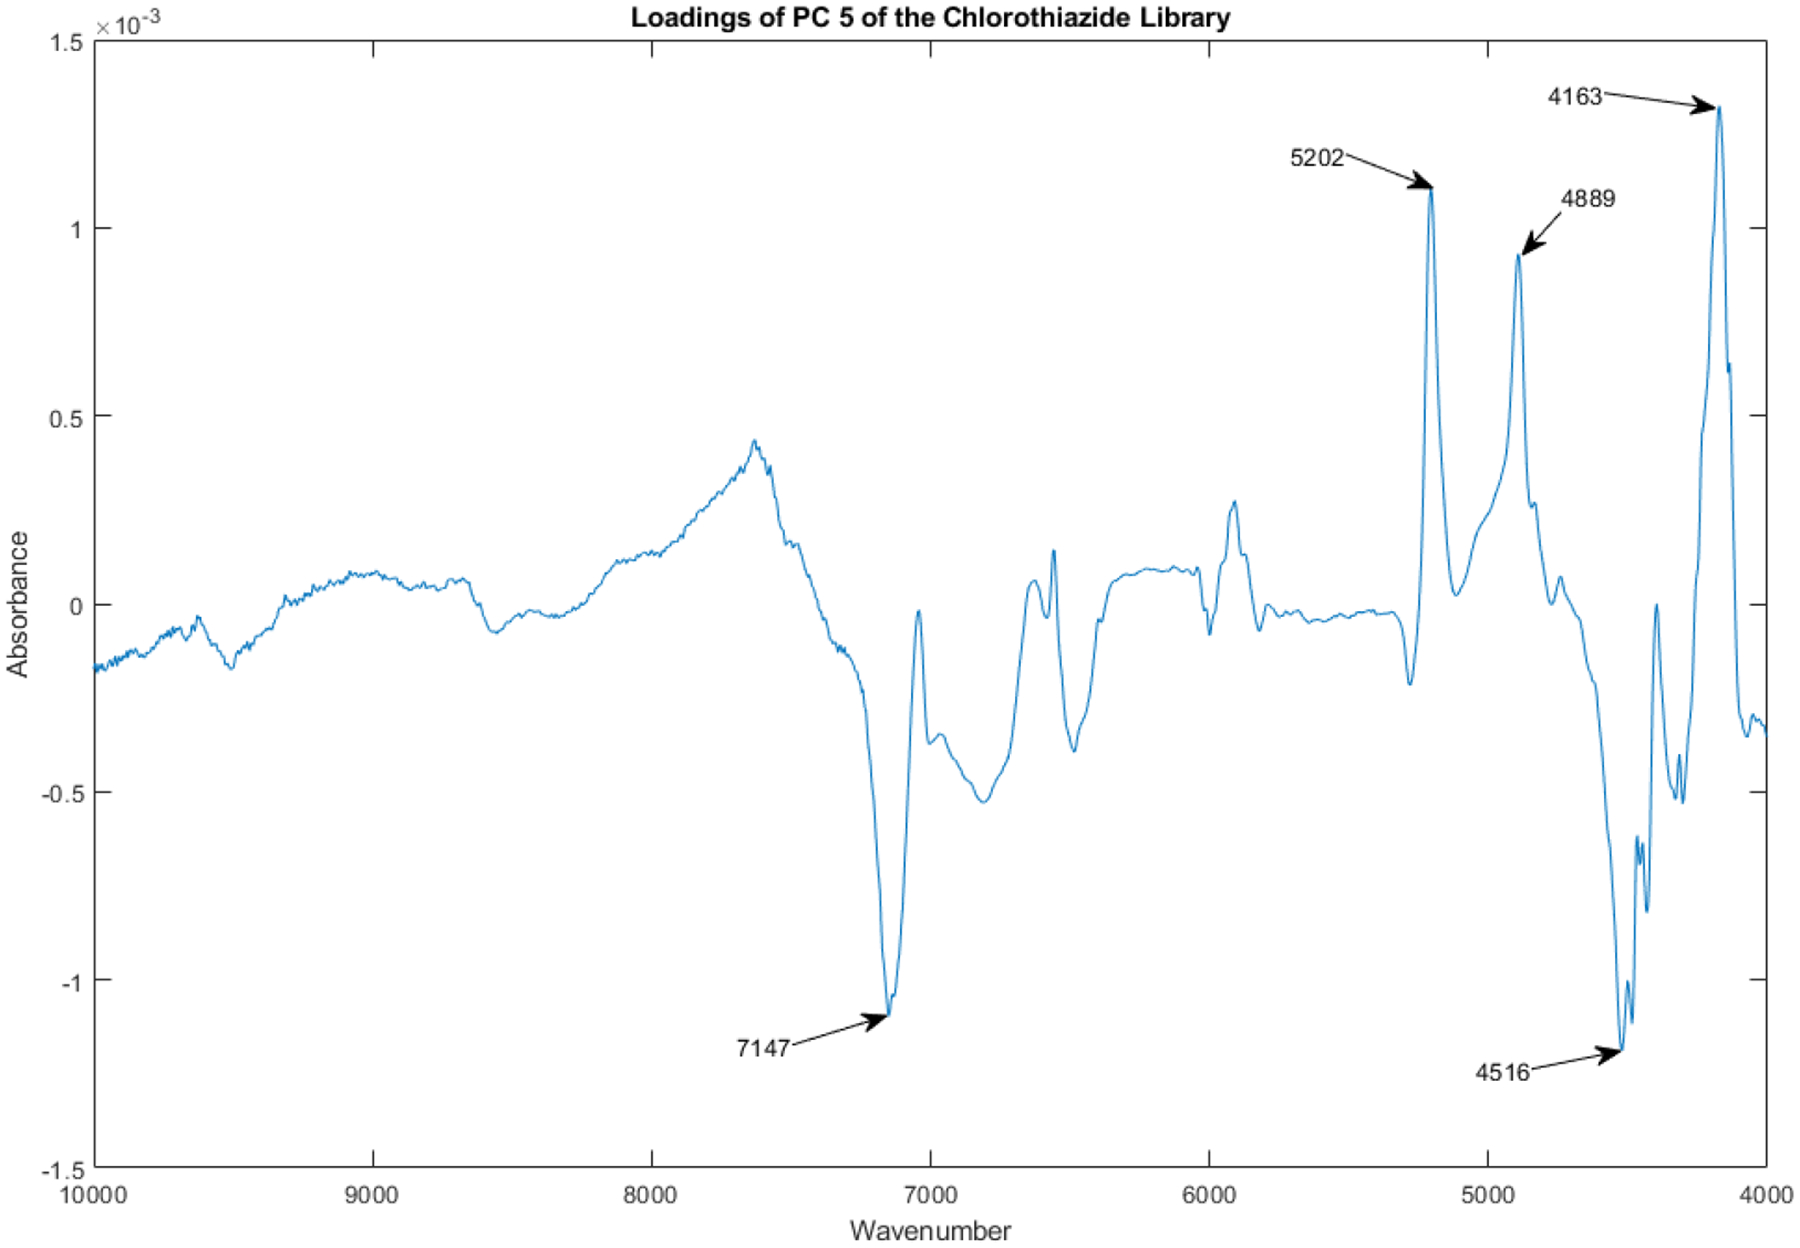
Loadings spectrum of PC 5 of the spectral library.
The loadings spectrum of PC 6 of the library of vials appears in Figure 16.
Figure 16.
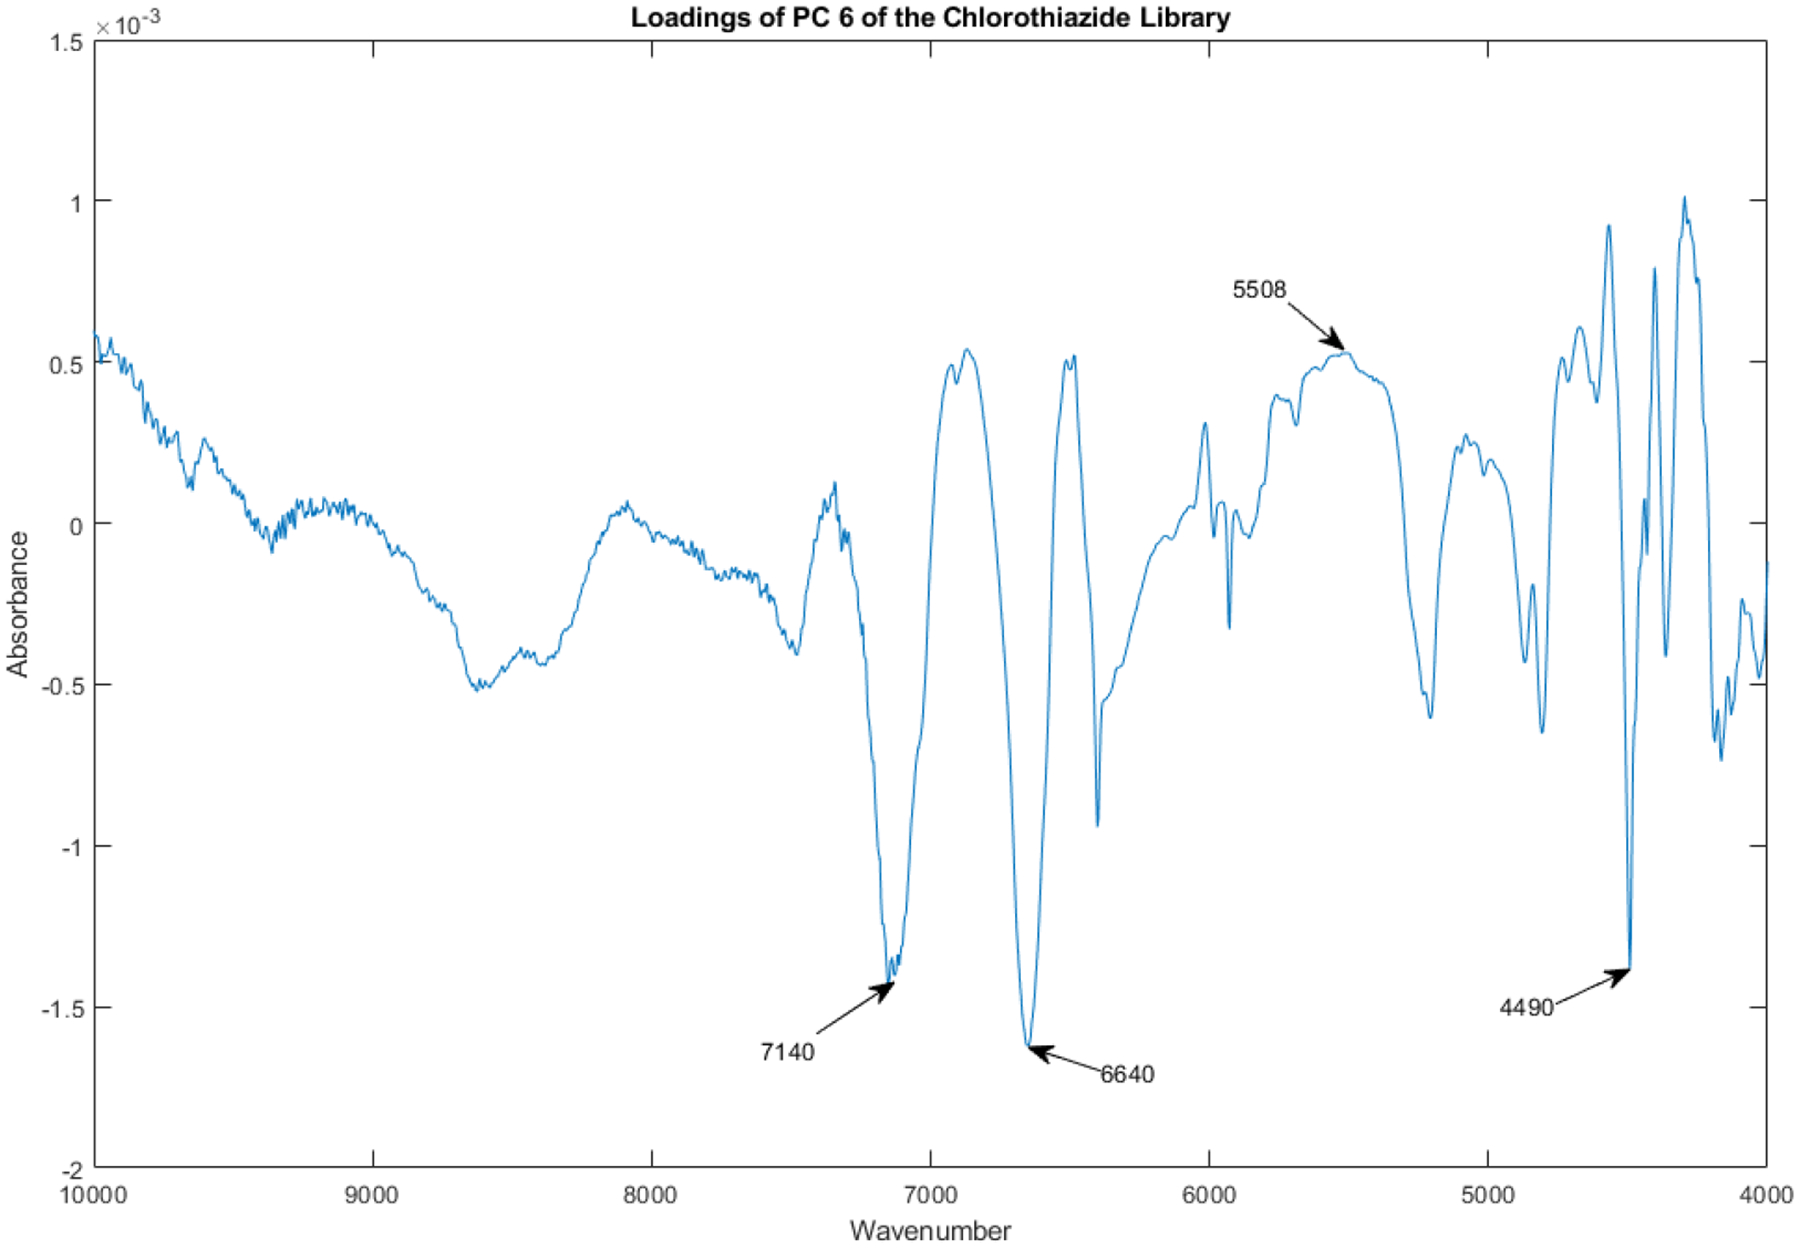
Loadings spectrum of PC 6 of the spectral library.
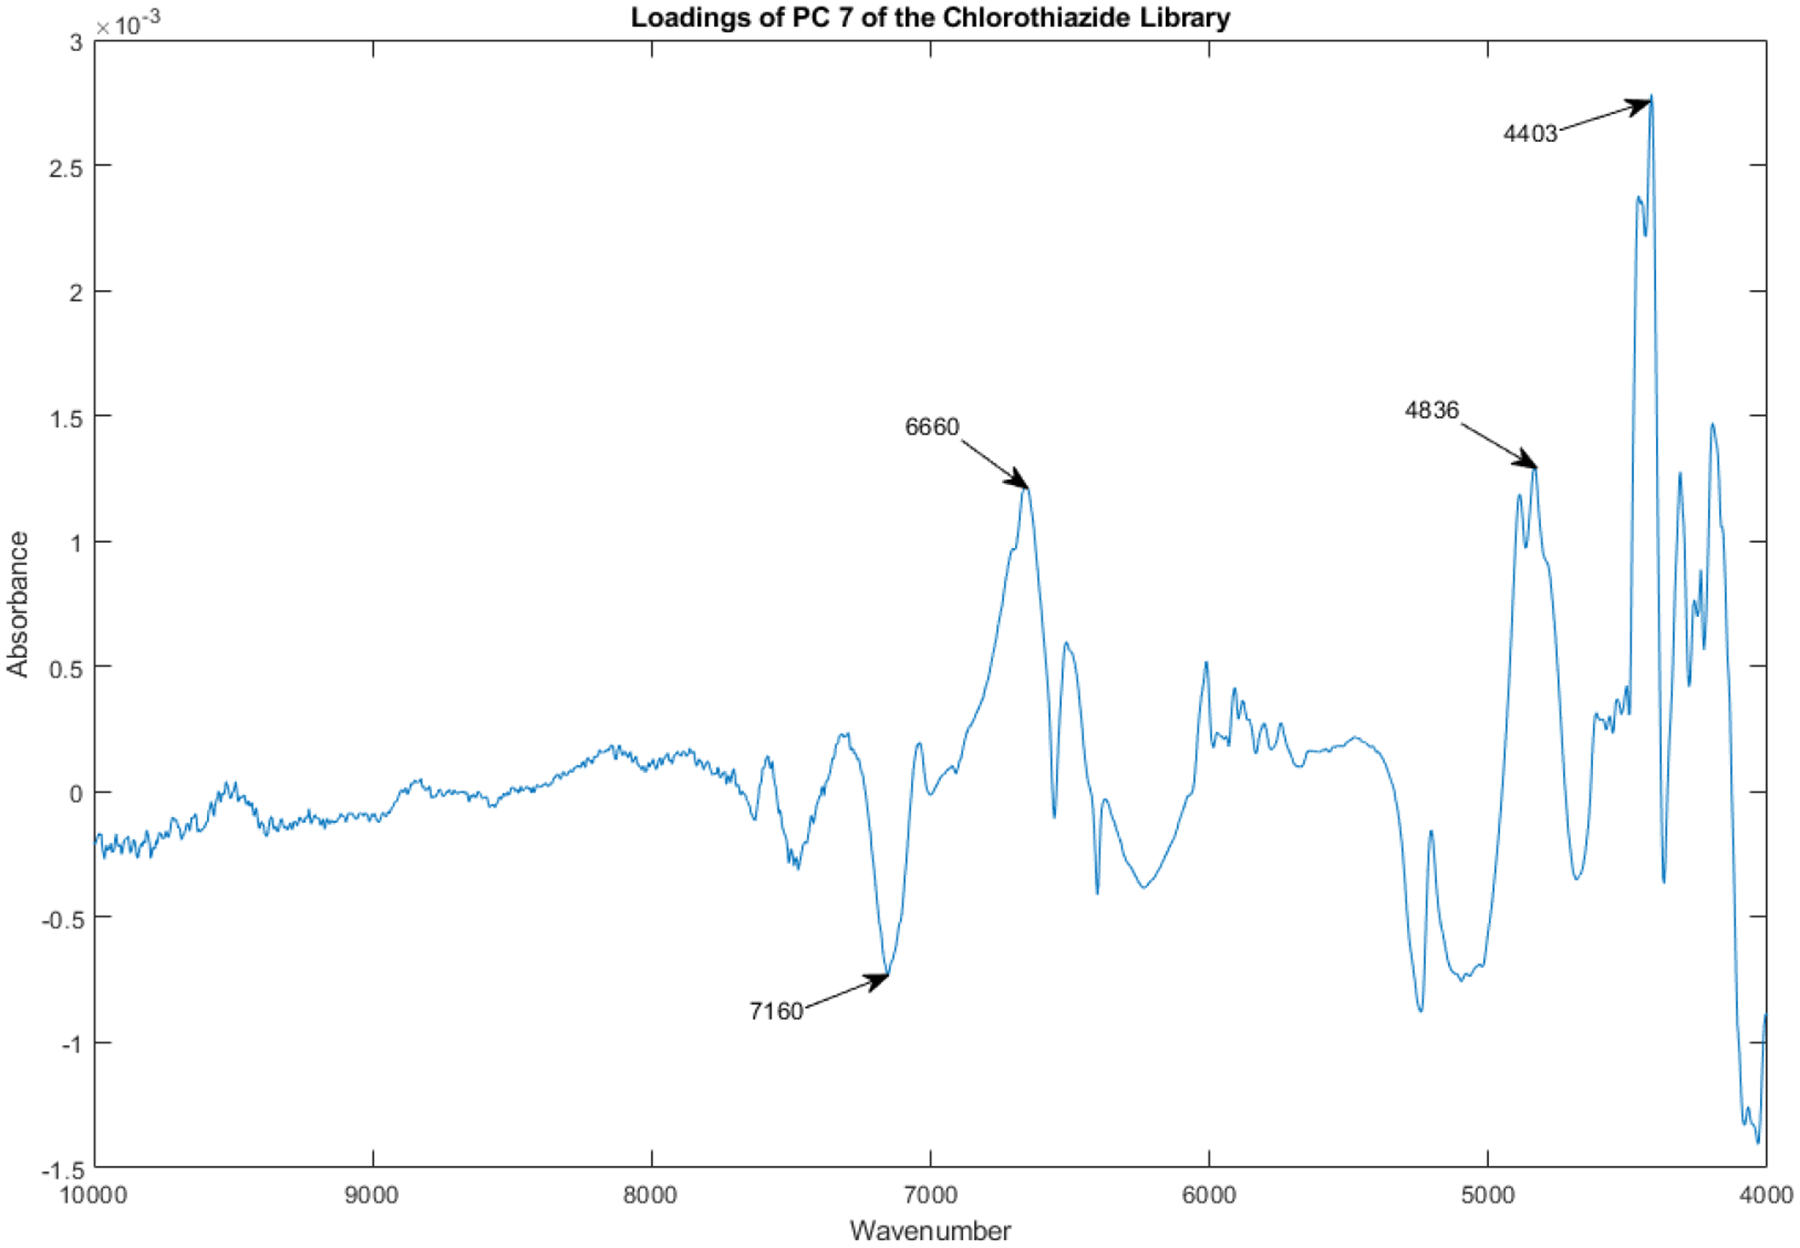
The loadings spectrum of PC 7 of the library of vials appears in Figure 17.
Figure 17.
Loadings spectrum of PC 7 of the spectral library.
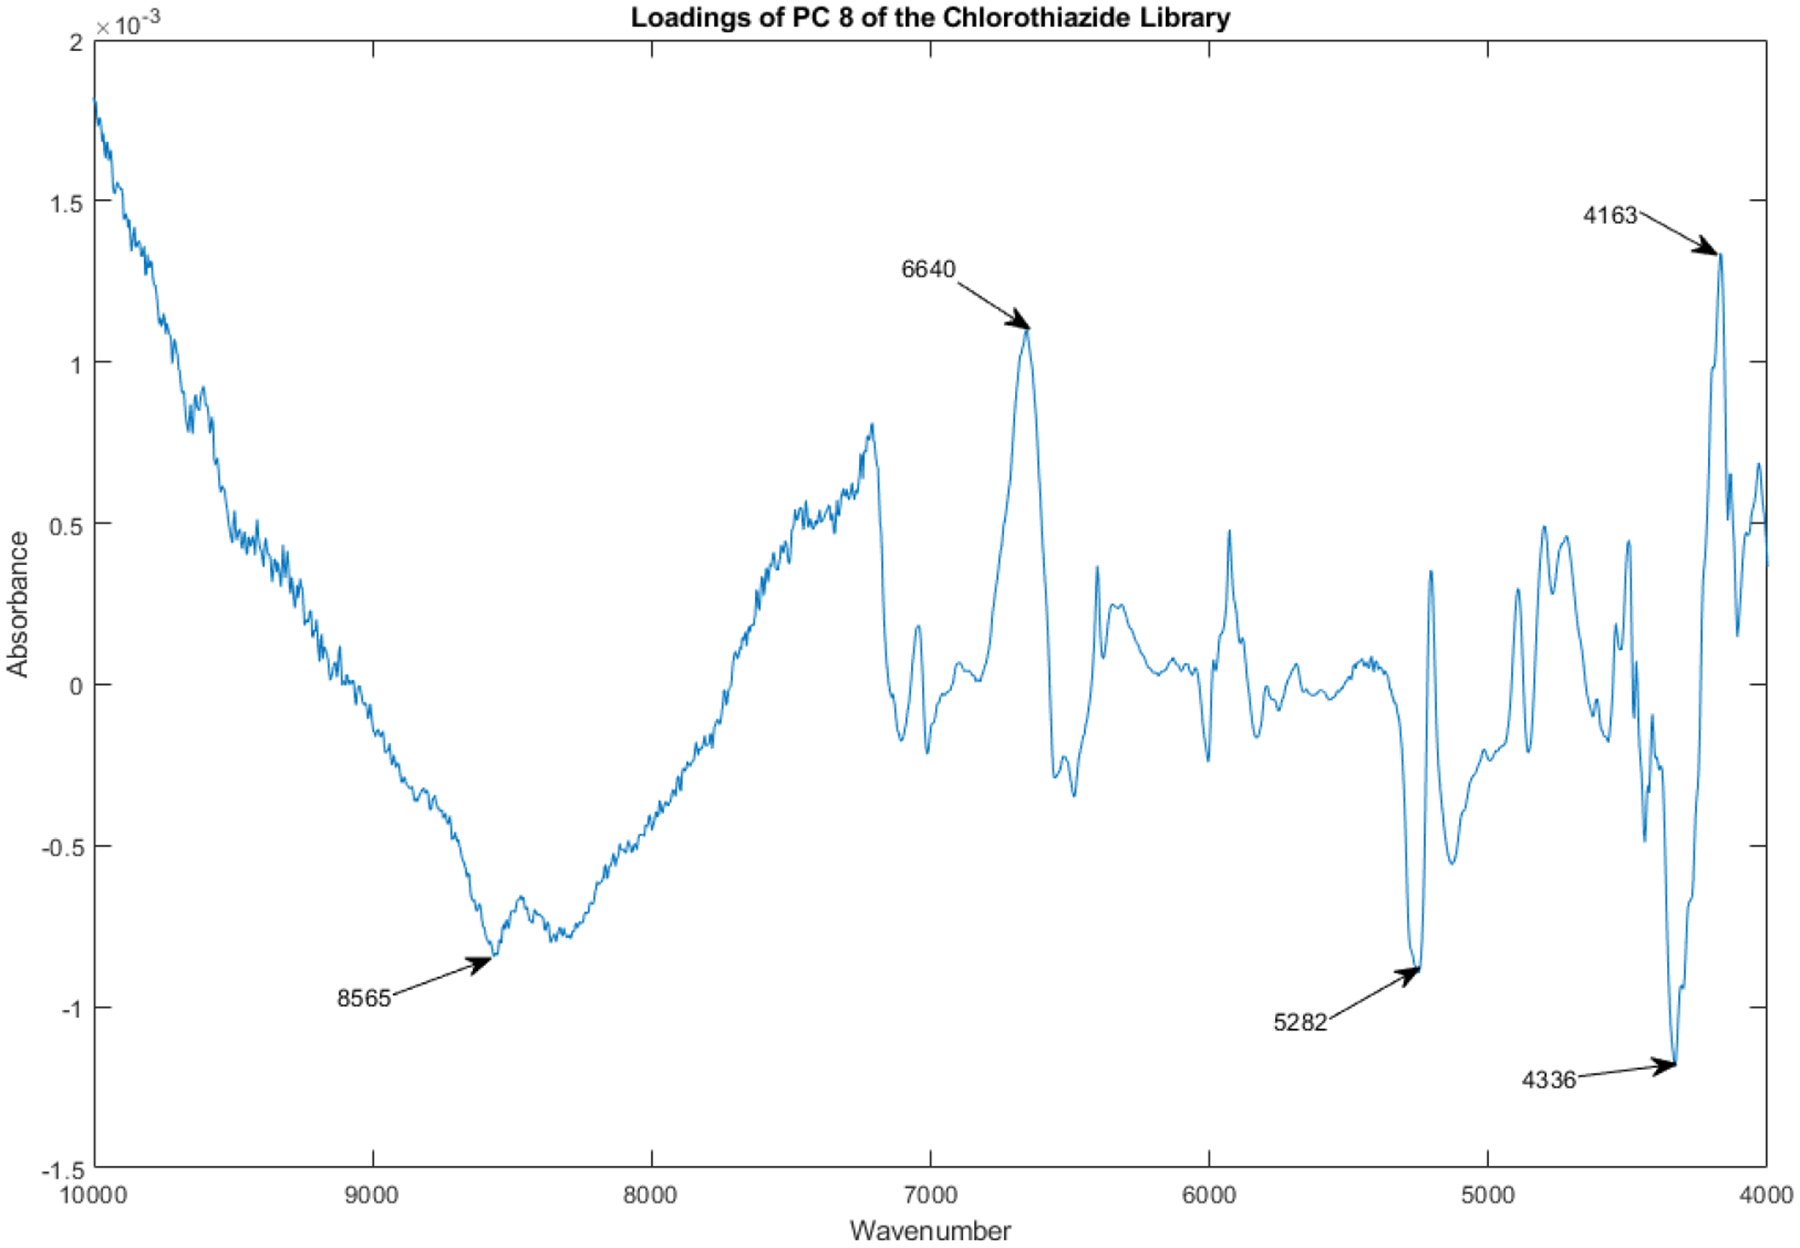
The loadings spectrum of PC 8 of the library of vials appears in Figure 18.
Figure 18.
Loadings spectrum of PC 8 of the spectral library.
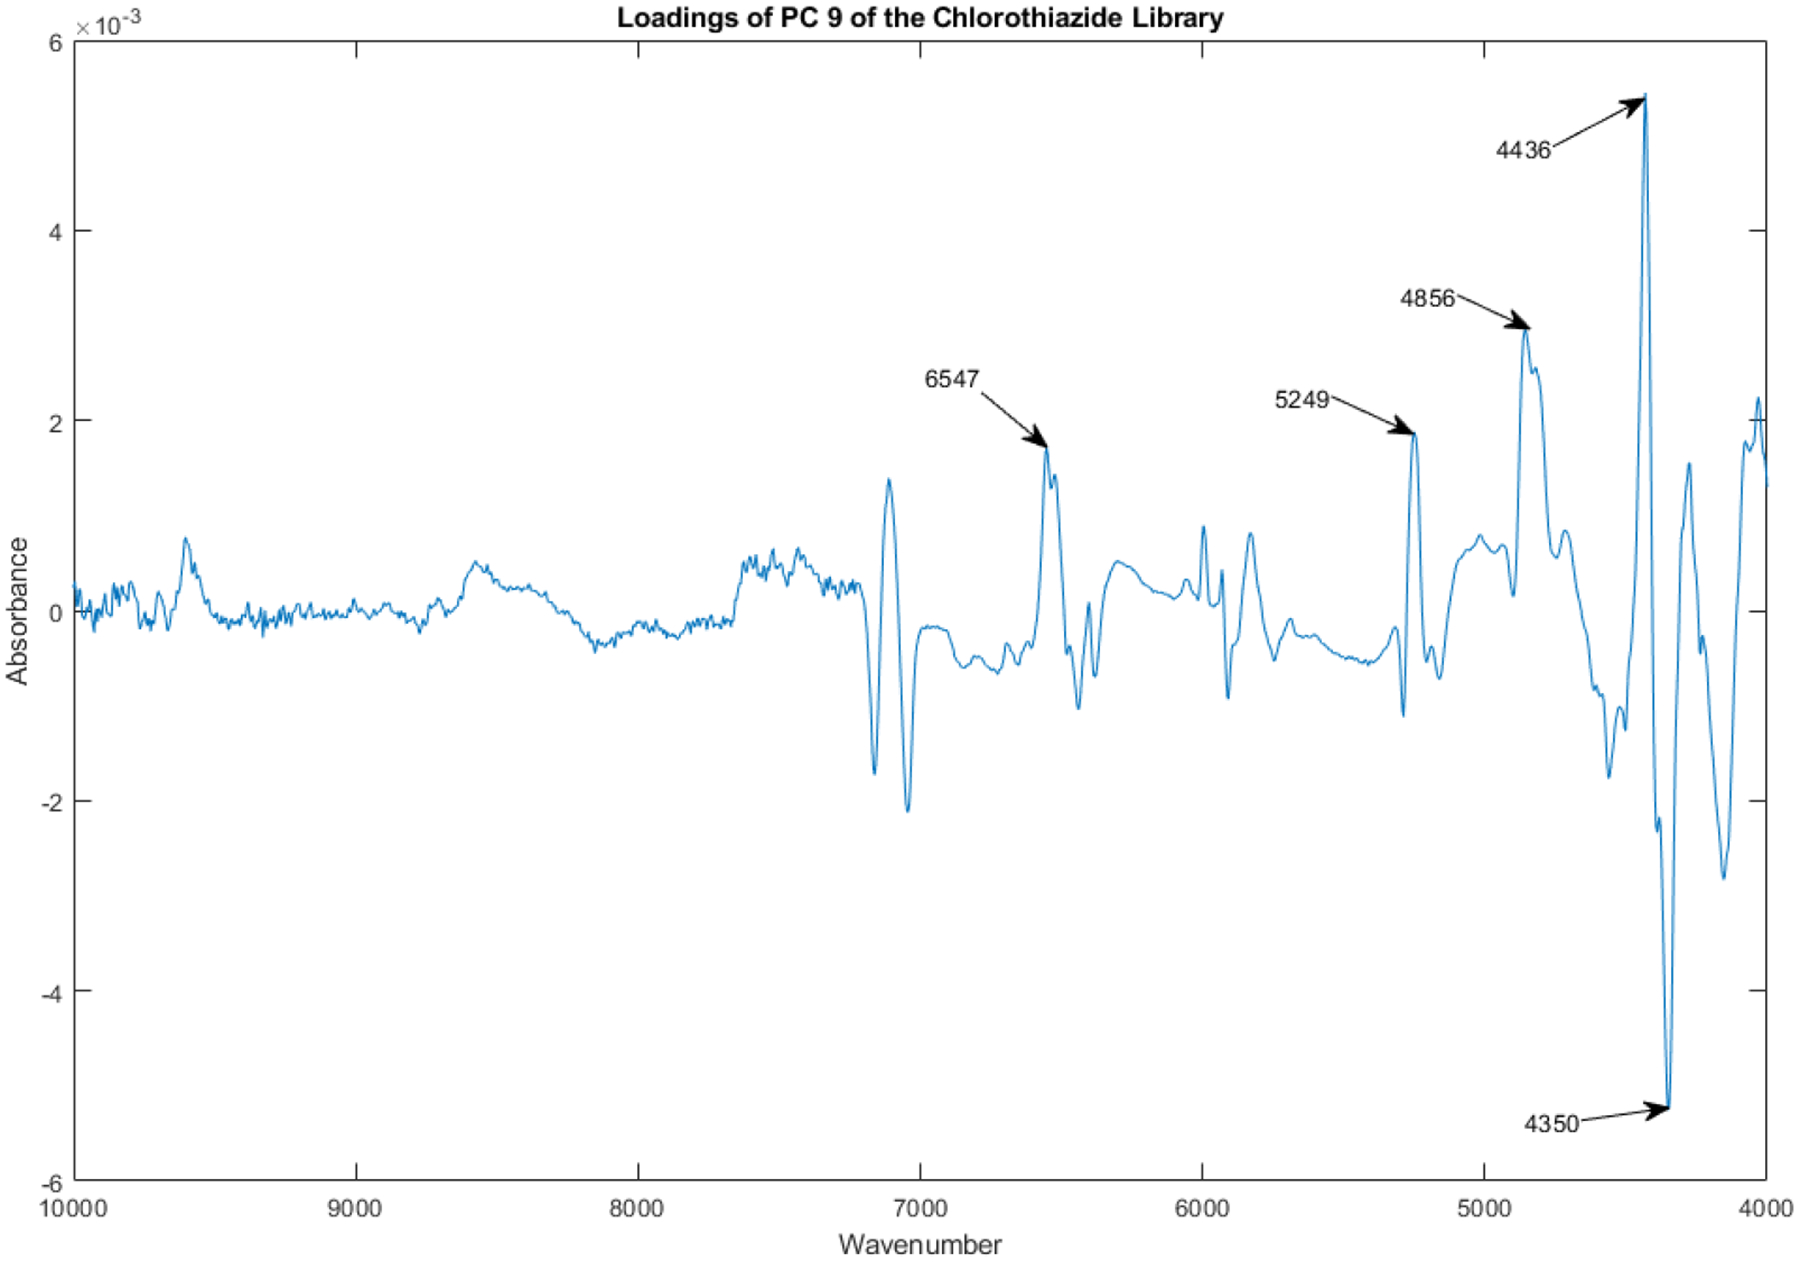
The loadings spectrum of PC 9 of the library of vials appears in Figure 19.
Figure 19.
Loadings spectrum of PC 9 of the spectral library.
Conclusion
Chlorothiazide Sodium for Injection, USP, serves as a diuretic and blood pressure-lowering medication. It comes as a sterile, lyophilized (freeze-dried) white powder packaged in vials. Each vial contains chlorothiazide sodium equivalent to 500 mg of chlorothiazide and 250 mg of mannitol, an inactive ingredient, with sodium hydroxide used to adjust the pH. The powder is white or almost white and crystalline in form. This medication is used as additional treatment for swelling (edema) linked to conditions like congestive heart failure, liver cirrhosis, and hormone therapies involving corticosteroids and estrogens. It is also effective in treating swelling caused by various kidney issues, including nephrotic syndrome, acute glomerulonephritis, and chronic renal failure.
In a small sample of a lot of chlorothiazide sodium, the University of Kentucky Drug Quality Task Force discovered intra-lot variability. Two vials out of six screened from the same lot deviated from the lot’s center by 4.0 and 4.2 standard deviations, respectively. Inter-lot variability was confirmed when examining the near-IR spectra of 204 vials collected from 28 different lots of chlorothiazide sodium. Analysis using BEST identified 13 vials (6.4%) as outliers.
The findings of intra-lot and inter-lot variability in a small sample of chlorothiazide sodium for injection, USP, are significant and raise concerns about the manufacturing process. These spectrometric results do not prove an excess level of impurities or adulteration. However, they suggest that the manufacturing process may have been operating outside of a state of process control. This raises concerns about the consistency and quality of the medication. Additional investigation is needed.
Acknowledgements
The project described was supported in part by the National Center for Research Resources and the National Center for Advancing Translational Sciences, National Institutes of Health, through Grant UL1TR001998. The content is solely the responsibility of the authors and does not necessarily represent the official views of the NIH.
References
- American Hospital Association, FDA: 43 new drug shortages, 86 ongoing shortages in 2020, https://www.aha.org/news/headline/2021-06-30-fda-43-new-drug-shortages-86-ongoing-shortages-2020, 2021. Retrieved March 22, 2024.
- ASHP, Chlorothiazide Sodium Injection, https://www.ashp.org/drug-shortages/current-shortages/drug-shortage-detail.aspx?id=638, 2021. Retrieved March 22, 2024.
- ASHP, Resolved Drug Shortage Bulletins, https://www.ashp.org/drug-shortages/current-shortages/drug-shortages-list?page=ResolvedShortages. Retrieved March 22, 2024.
- DailyMed, CHLOROTHIAZIDE SODIUM injection, powder, lyophilized, for solution, Drug label information. https://dailymed.nlm.nih.gov/dailymed/lookup.cfm?setid=377dc515-e381-4196-8bc7-b738606c57ac, Retrieved April 3, 2024.
- Dempsey RJ, Davis DG, Buice RG Jr, & Lodder RA (1996). Biological and medical applications of near-infrared spectrometry. Applied Spectroscopy, 50(2), 18A–34A. [Google Scholar]
- Isaacs JT, Almeter PJ, Henderson BS, Hunter AN, Lyman TA Zapata SP, Henderson BS, Larkin SA, Long LM, Bossle MN, Bhaktawara SA, Warren MF, Lozier AM, Melson JD, Fraley SR, Relucio EHL, Felix MA, Reynolds JW, Naseman RW, Platt TL, & Lodder RA (2023 a). Assessment of Vecuronium Quality Using Near-Infrared Spectrometry. Contact in context, 2023. [DOI] [PMC free article] [PubMed] [Google Scholar]
- Isaacs JT, Almeter PJ, Henderson BS, Hunter AN, Platt TL, & Lodder RA (2023 b). Potential Process Control Issues With Abatacept. Contact in context, 2023. [DOI] [PMC free article] [PubMed] [Google Scholar]
- Isaacs JT, Almeter PJ, Henderson BS, Hunter AN, Platt TL, & Lodder RA Nonparametric Subcluster Detection in Large Hyperspaces, CIC Computational Sciences, 2023c, 1–24. DOI: 10.6084/m9.figshare.23877213 [DOI] [PMC free article] [PubMed] [Google Scholar]
- Isaksson T, & Næs T (1988). The effect of multiplicative scatter correction (MSC) and linearity improvement in NIR spectroscopy. Applied Spectroscopy, 42(7), 1273–1284. 10.1366/0003702884429869 [DOI] [Google Scholar]
- Jolliffe IT, & Cadima J (2016). Principal component analysis: a review and recent developments. Philosophical Transactions of the Royal Society A: Mathematical, Physical and Engineering Sciences, 374(2065), 20150202. [DOI] [PMC free article] [PubMed] [Google Scholar]
- Lodder RA, & Hieftje GM (1988). Detection of subpopulations in near-infrared reflectance analysis. Applied spectroscopy, 42(8), 1500–1512. [Google Scholar]
- Matlab. Smoothing Splines. https://www.mathworks.com/help/curvefit/smoothing-splines.html. Retrieved May 28, 2023.
- Obaidullah AJ (2023). Thermodynamic and experimental analysis of drug nanoparticles preparation using supercritical thermal processing: Solubility of Chlorothiazide in different Co-solvents. Case Studies in Thermal Engineering, 49, 103212. [Google Scholar]
- Pollock DSG (1993). Smoothing with cubic splines. https://www.physics.muni.cz/~jancely/NM/Texty/Numerika/CubicSmoothingSpline.pdf. Retrieved May 28, 2023.


