

Abstract
Background:
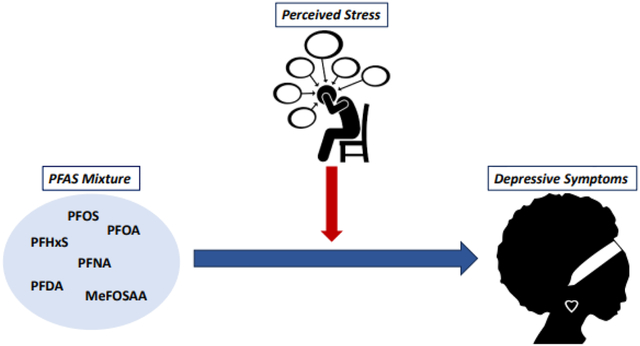
Per- and polyfluoroalkyl substances (PFAS) are endocrine-disrupting chemicals with neurotoxic properties. PFAS have been associated with depressive symptoms in women in some studies, but little research has evaluated the effects of PFAS mixtures. Further, no study has investigated interactions of PFAS-depression associations by perceived stress, which has been shown to modify PFAS effects on other health outcomes.
Objective:
In a prospective cohort study of reproductive-aged Black women, we investigated associations between PFAS and depressive symptoms and the extent to which perceived stress modified these associations.
Methods:
We analyzed data from 1,499 participants (23–35 years) from the Study of Environment, Lifestyle, and Fibroids. We quantified concentrations of nine PFAS in baseline plasma samples using online solid-phase extraction-liquid chromatography-isotope dilution tandem mass spectrometry. Participants reported perceived stress via the Perceived Stress Scale (PSS-4; range=0–16) at baseline and depressive symptoms via the Center for Epidemiologic Studies Depression Scale (CES-D; range=0–44) at the 20-month follow-up visit. We used Bayesian Kernel Machine Regression to estimate associations between PFAS concentrations, individually and as a mixture, and depressive symptoms, and to assess effect modification by PSS-4 scores, adjusting for confounders.
Results:
Baseline perfluorodecanoic acid concentrations were associated with greater depressive symptoms at the 20-month follow-up, but associations for other PFAS were null. The PFAS were not associated with depressive symptoms when evaluated as a mixture. The association between the 90th percentile (vs. 50th percentile) of the PFAS mixture with CES-D scores was null at the 10th (β=0.03; 95% CI=0.20, 0.25), 50th (β=0.02; 95% CI=−0.16, 0.19), and 90th (β=0.01; 95% CI=0.18, 0.20) percentiles of PSS-4 scores, suggesting perceived stress did not modify PFAS mixture.
Conclusion:
In this prospective cohort study, PFAS concentrations—assessed individually or as a mixture—were not appreciably associated with depressive symptoms, and there was no evidence of effect modification by perceived stress.
Keywords: depression, EDCs, PFAS, Black women, mixtures, stress
Graphical Abstract
1. INTRODUCTION
Per- and polyfluoroalkyl substances (PFAS) are a class of environmentally persistent endocrine-disrupting chemicals (EDCs) known to dysregulate hormonal systems (Agency for Toxic Substances and Disease Registry, 2021). PFAS are used extensively in industrial applications (e.g., firefighting foams) and in consumer products (e.g., clothing, cookware, food packaging, cosmetics) (Agency for Toxic Substances and Disease Registry, 2021); human exposure to PFAS is therefore widespread (U.S. CDC, 2023). Data from the National Health and Nutrition Examination Survey (NHANES) show that 98% of Americans have detectable concentrations of PFAS in their blood (U.S. CDC, 2023). Given that PFAS have been associated with numerous adverse health outcomes, such as metabolic and neurological disorders (Brown-Leung and Cannon, 2022; Fenton et al., 2021), the ubiquity of exposure to PFAS is a public health concern.
Depression, a mood disorder that affects nearly 20% of U.S. adults, is characterized by feelings of sadness, irritability, disrupted sleep, changes to appetite, impaired cognition, and loss in interests (Chand and Arif, 2023; Lee et al., 2023; Otte et al., 2016). Though depression affects a large proportion of adults, inequities in the prevalence of depressive symptoms are well documented: women, for example, are twice as likely to report depressive symptoms as men (Albert, 2015). Moreover, Black women, relative to white women, are more likely to have chronic and severe depressive symptoms but are far less likely to seek care (Nelson et al., 2020; Williams et al., 2007; Woods-Giscombe et al., 2016). Depressive symptoms among Black women may relate to experiences of structural racism and discrimination (Martin et al., 2023; Patel et al., 2023; Quist et al., 2022a), and have in turn been linked with elevated body mass index (BMI), hypertension, and risk of cardiovascular disease (Gaffey et al., 2022; Harris et al., 2021).
In addition to psychosocial stressors, toxicological data support the role of environmental chemicals like PFAS in the etiology of depressive symptoms. The neurotoxic properties of PFAS have been well characterized: PFAS alter the functional connectivity of the brain, including regions that regulate emotion, motivation, and mood (e.g., prefrontal cortex, hippocampus) (Bremner et al., 2000; Mayberg et al., 1999; Pandya et al., 2012; Zhang et al., 2018). Additionally, PFAS disrupt neurotransmitter metabolism (i.e., dopamine, glutamate, gamma-aminobutyric acid [GABA]) and calcium ion signaling, particularly in the hypothalamus, cortex, amygdala, and hippocampus, which have been implicated in the development of depressive symptoms (Belujon and Grace, 2017; Brown-Leung and Cannon, 2022; Fogaça and Duman, 2019; Onaolapo and Onaolapo, 2021; Pandya et al., 2012). PFAS further dysregulate the hypothalamic-pituitary-adrenal (HPA) and hypothalamic-pituitary-thyroid (HPT) axes and have been associated with altered concentrations of hormones (e.g., cortisol) that play a role in the stress response and anxiety symptoms (Keller et al., 2017; Varghese and Brown, 2001). These toxicological mechanisms are supported by animal data illustrating increased post-partum anxiety-like behavior among dams treated with a low-dose of perfluorooctanoic acid (PFOA) during pregnancy (Merrill et al., 2022).
Only a handful of epidemiologic studies have investigated PFAS exposure and depressive symptoms, with mixed results. Four studies measured prenatal PFAS biomarker concentrations and assessed maternal depressive symptoms; two studies found that maternal PFAS concentrations measured during pregnancy (first, second, or third trimester) were associated with higher depression scores during pregnancy (measured with the Center for Epidemiologic Studies Depression Scale) and 6 months post-partum (measured with the Edinburg Postnatal Depression Scale [EPD]) (Aung et al., 2023; Hu et al., 2024). However, two studies reported that maternal PFAS (serum or plasma) were not associated with greater depressive symptoms 42 days (measured with the EPD) or 4 weeks through 8 years (measured with the Beck Depression Inventory II) post-pregnancy (Vuong et al., 2020; Wang et al., 2023). An analysis of data from NHANES (2005–2018) among participants ≥20 years further reported non-linear associations of serum PFAS concentrations with depression scores (measured with the Patient Health Questionnaire-9 [PHQ-9]), such that only concentrations above a threshold (i.e., 39.7 ng/mL for total PFAS) were associated with depressive symptoms (Yi et al., 2023). Alternatively, a separate analysis of NHANES data (2005–2018) reported inverse associations between select PFAS (perfluorohexanesulfonic acid [PFHxS], PFOA, perfluoroundecanoic acid [PDUnDA]) and depression scores among participants 18 years and older (Sun et al., 2024).
Previous studies included small numbers of Black participants (Aung et al., 2023; Vuong et al., 2020; Yi et al., 2023). Because Black women report greater severity of chronic depressive symptoms (Nelson et al., 2020; Williams et al., 2007; Woods-Giscombe et al., 2016), understanding the potential role of PFAS in the etiology of depression among Black women is an important research objective. Further, psychosocial stress contributes to depressive symptoms (Quist et al., 2022b), likely through similar toxicological mechanisms as PFAS (i.e., HPA/HPT disruption) (Brown-Leung and Cannon, 2022; Busse et al., 2017), suggesting that psychosocial stress may modify the effects of PFAS, leading to greater depressive symptoms. Although perceived stress has been shown to modify associations of PFAS with other health endpoints (e.g., birth outcomes, corticotropin-releasing hormone) (Eick et al., 2022, 2023, 2021), we are not aware of any previous studies that have examined psychosocial stress as a joint exposure or effect measure modifier of PFAS in relation to depression. Finally, few previous studies of depression considered PFAS mixtures (Aung et al., 2023; Hu et al., 2024; Wang et al., 2023); because PFAS tend to target similar regions of the brain and have overlapping mechanisms of toxicity, exposure to multiple PFAS may have joint or interactive effects (Agency for Toxic Substances and Disease Registry, 2021). Consistent with animal studies of PFAS mixtures (Foguth et al., 2020; Grønnestad et al., 2021; Yu et al., 2016), two studies reported a joint adverse association of a PFAS mixture with depression scores that was stronger than when the PFAS were considered individually (Aung et al., 2023; Hu et al., 2024). However, these studies did not examine potential interactions among the PFAS.
In a prospective cohort study of reproductive-aged Black women, we investigated the association between plasma concentrations of a mixture of PFAS with depressive symptoms and assessed perceived stress as a modifier of the PFAS mixture.
2. METHODS
2.1. Study Population
We analyzed data from the Study of Environment, Lifestyle, and Fibroids (SELF), a prospective cohort of 1,693 reproductive-aged Black women from the Detroit metropolitan area (Baird et al., 2015; Wise, 2015). The study was designed to investigate the development and growth of uterine leiomyomata (UL). Participants were recruited between 2010 and 2012 and were eligible for the study if they: 1) were 23–35 years at enrollment, 2) self-identified as Black/African American, 3) had an intact uterus, 4) had no prior diagnosis of UL, and 5) had no previous diagnosis of cancer or an autoimmune disease that required regular medication use. We subsequently followed participants to ascertain UL incidence and collected data at multiple (20-month, 40-month, and 60-month) follow-up visits. Institutional Review Boards at Henry Ford Health (HFH), the National Institute of Environmental Health Sciences (NIEHS), and Boston University Medical Campus approved all study protocols. The involvement of the Centers for Disease Control and Prevention (CDC) laboratory did not constitute engagement in human subjects research.
2.2. Plasma Collection and Quantification of PFAS
The majority of participants (n=1,499) provided a non-fasting whole blood sample at baseline with sufficient volume to measure PFAS. HFH processed biospecimens and separated plasma from whole blood by centrifuging the whole blood for 10 minutes at 4°C and 1300g. Plasma samples were shipped to the NIEHS repository, aliquoted and stored in straws (Cryo Bio System) at −80°C. Plasma in the straws was aliquoted into polypropylene cryovials and shipped to the CDC overnight on dry ice in two batches (n=781 and 718, respectively). CDC staff used online solid-phase extraction-liquid chromatography-isotope dilution tandem mass spectrometry (Kato et al., 2018) to quantify plasma concentrations of nine PFAS: perfluorohexanesulfonic acid (PFHxS), linear perfluorooctanesulfonic acid (n-PFOS), branched perfluorooctanesulfonic acid (Sm-PFOS), linear perfluorooctanoic acid (n-PFOA), branched perfluorooctanoic acid (Sb-PFOA), perfluorononanoic acid (PFNA), perfluorodecanoic acid (PFDA), perfluoroundecanoic acid (PFUnDA), and 2-(N-methyl-perfluorooctane sulfonamido) acetic acid (MeFOSAA). We calculated total PFOS (PFOS) and total PFOA (PFOA) by summing concentrations of linear and branched PFOS and PFOA, respectively. Full details on laboratory methods and quality assurance/quality control have been described previously (Wise et al., 2021). The CDC used previously validated laboratory methods utilized for NHANES to measure PFAS concentrations in SELF, including reagent blanks, analytic standards, and concentration quality control samples (Botelho and Pirkle, 2018; Kato et al., 2018).
The limit of detection (LOD) for all PFAS was 0.1 ng/mL; we included PFAS with a detection frequency >60% in the final analysis (Table S1): PFHxS, PFOS, PFOA, PFNA, PFDA, and MeFOSAA. We imputed PFAS concentrations <LOD in the final analysis as the LOD/√2 (Hornung and Reed, 1990).
2.3. Assessment of Depressive Symptoms
We measured depressive symptoms using the 11-item Iowa short-form of the CES-D (Table S2), which ascertains participants’ well-being and emotional state in the previous week and was constructed to identify individuals at high-risk of depression (Radloff, 1977). Participant responses included never, hardly ever, sometimes, often, or always (scored as 0, 1, 2, 3 or 4, respectively). Two questions (“I was happy” and “I enjoyed life”) reflected lower levels of depressive symptoms; we therefore reverse-coded responses to these questions. We summed scores across the 11 questions (range: 0—44), where higher scores suggested greater depressive symptoms. The CES-D, including shorter versions of the scale, has good reliability and internal consistency (Carpenter et al., 1998), including in Black and African American populations (Atkins, 2014; Canady et al., 2009; Cosco et al., 2017; Kohout et al., 1993; Makambi et al., 2009a; Torres, 2012).
We invited participants to complete the CES-D at the first follow-up visit that they attended, i.e., only once during follow-up. The majority (88.3%) of participants completed the CES-D at the first (20-month) follow-up visit; an additional 5.4% and 1.8% of participants completed the CES-D at the second (40-month) and third (60-month) follow-up visits, respectively. The remaining participants (4.5%) did not attend any follow-up visits and therefore did not have any CES-D data.
2.4. Measurement of Covariates
We collected baseline covariate data using interviews, in-person clinic visits, and self-administered questionnaires. Socioeconomic and demographic variables included age, educational attainment, annual household income, employment status, and marital status. Anthropometric and behavioral variables included BMI (calculated using height and weight measured at the baseline clinic visit), smoking status, and alcohol consumption. Reproductive variables included parity and breastfeeding duration summed across all prior births.
We measured baseline perceived stress, which we considered as a modifier of the PFAS mixture, using the Perceived Stress Scale (PSS-4) (Cohen et al., 1983). The PSS-4 asks participants to rate their perceived stress in the previous 30 days using the following four questions: have you felt: 1) that you were unable to control the important things in life, 2) confident about your ability to handle your personal problems, 3) that things were going your way, and 4) difficulties were piling up so high that you could not overcome them. Participant response options were never, almost never, sometimes, fairly often, or very often (scored as 0, 1, 2, 3, and 4, respectively). We reverse coded responses to questions 2) and 3) and then summed scores for all four questions to reflect total perceived stress levels at baseline (range: 0–16, where higher scores reflected greater stress levels). The PSS-4 has high short-term (2-month) reliability in Black populations (Cohen et al., 1983; Sharp et al., 2007).
2.5. Statistical Analysis
2.5.1. Multiple Imputation
The analytic sample for this analysis included 1,499 participants with sufficient plasma volume to measure baseline PFAS concentrations. We did not restrict our analytic sample to participants without a history of depression at baseline because we hypothesized that PFAS may influence symptom severity among participants with prior diagnoses of depression. To reduce potential for selection bias, we multiply imputed missing data on covariates (<1%; see Table S3) and CES-D scores (12% of participants who did not attend the 20-month follow-up visit; Figure 1). A subset of participants (~7%) who did not have CES-D scores measured at the 20-month follow-up had CES-D scores measured at a subsequent follow-up visit (Figure 1); we used the multiply imputed 20-month follow-up CES-D scores for these participants, rather than CES-D scores measured at a subsequent (40-month or 60-month) follow-up visit, in statistical analyses to reduce the potential for exposure misclassification resulting from varying time periods between plasma sampling (at baseline) and CES-D measurement. Importantly, multiple imputation of missing data is a valid method that can reduce the influence of bias (Cole et al., 2023; Madley-Dowd et al., 2019).
Figure 1.
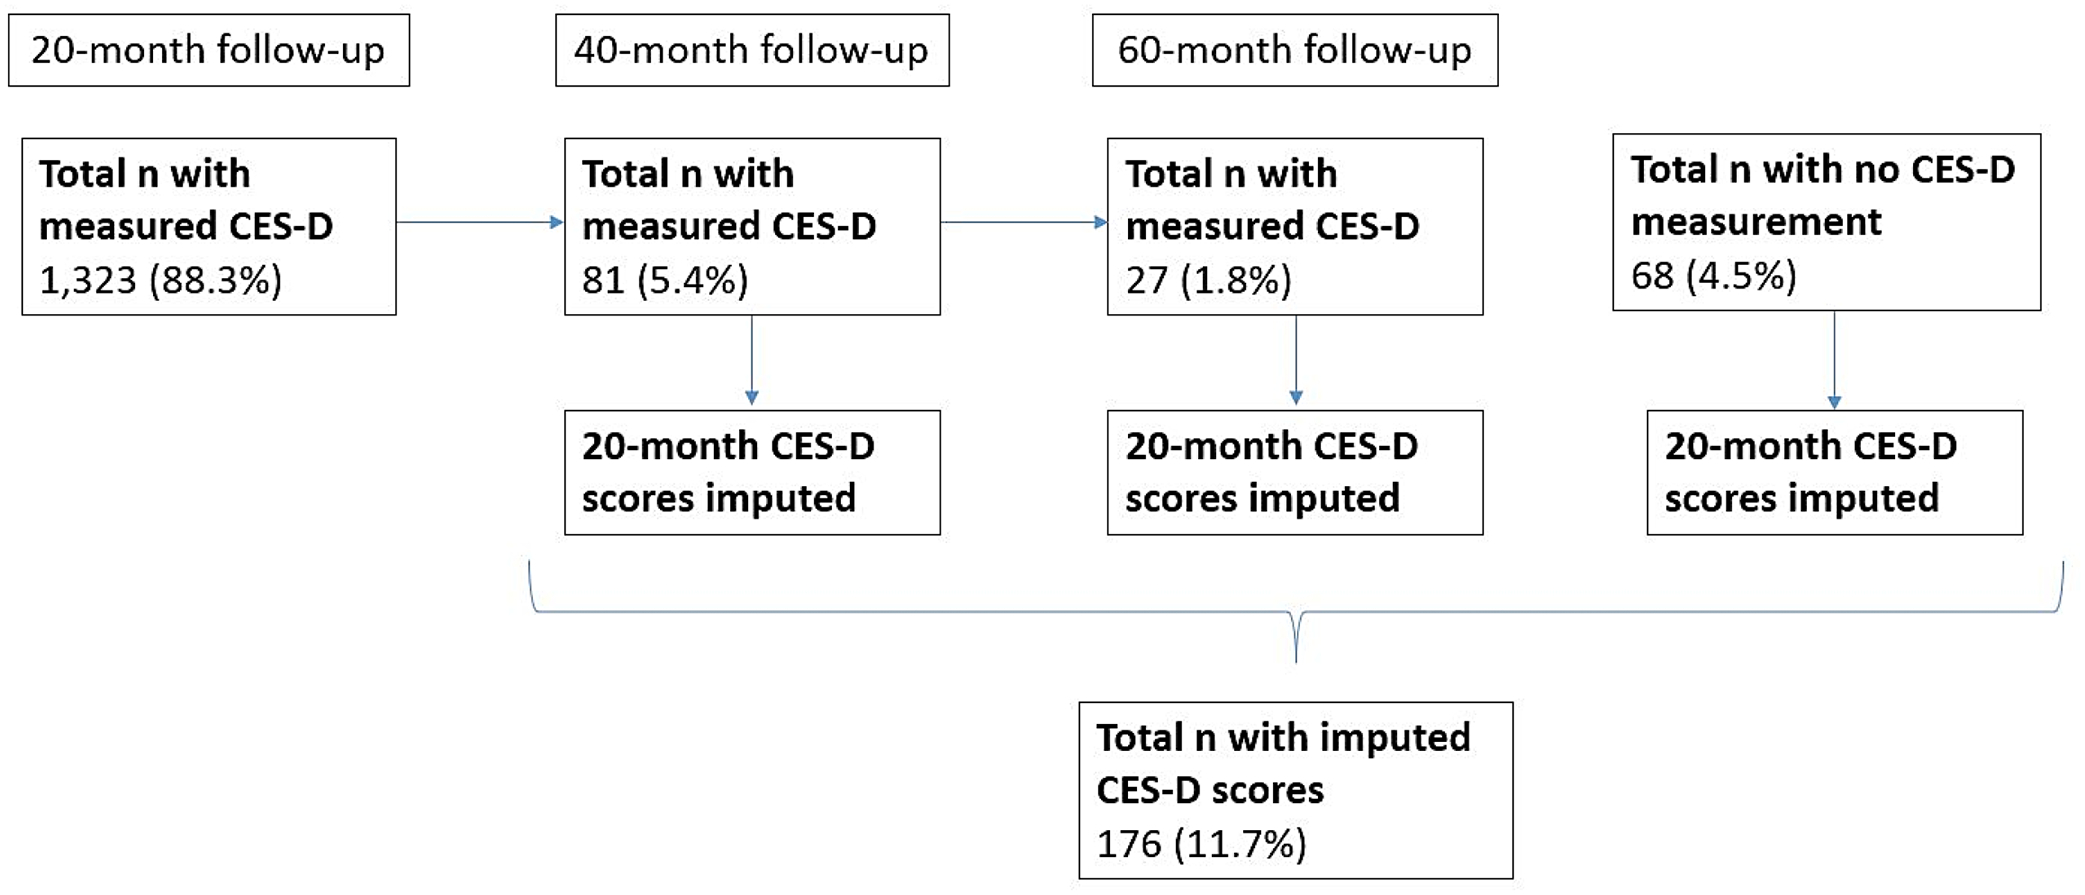
Schematic illustrating the timing of CES-D measurement for participants in the SELF cohort (n=1,499). We imputed scores for participants that completed the CES-D at the 40-month (5.4%) or 60-month visit (1.8%). We also imputed scores for participants that did not have the CES-D measured at any follow-up visit (4.5%)
We generated five imputed datasets with Monte Carlo Markov Chain methods utilizing all relevant variables (PFAS, confounders, baseline PSS-4 scores, 20-month CES-D scores) under the assumption that the data were missing at random (Zhou et al., 2001). Plasma PFAS concentrations were similar among participants with CES-D scores measured at the 20-month follow-up compared with participants who completed the CES-D at a subsequent follow-up visit, and to participants who did not complete the CES-D at any follow-up visit (Table S4). Median imputed 20-month CES-D scores were similar, though lower, compared to CES-D scores measured at 40 months and 60 months among participants who completed the CES-D at the 40-month (n=81) and 60-month (n=27) follow-up visits, respectively (Figure 1, Table S5).
2.5.2. Summary Statistics and Data Transformations
We calculated descriptive statistics for plasma PFAS concentrations, potential confounders, PSS-4 scores, and CES-D scores (Table 1). PFAS plasma concentrations and CES-D scores were right-skewed; we therefore naturally log (ln) transformed these variables prior to modeling to satisfy modelling assumptions and reduce the influence of extreme values. We calculated Spearman correlation coefficients to estimate correlations between plasma concentrations of each PFAS.
Table 1.
Characteristics of 1,499 SELF participants in the analytic sample, 2010–2012.
| Variable | N (percent) or median (25th, 75th percentiles) |
|---|---|
| Sociodemographic characteristics at baseline | |
| Age at enrollment (years) | 29 (26, 32) |
| Educational attainment | |
| High School degree/GED | 334 (22.3%) |
| Some college/Associate’s/Technical school | 746 (49.8%) |
| Bachelor’s/Master’s/Doctorate | 419 (27.9%) |
| Annual household income | |
| <$20,000 | 696 (46.4%) |
| $20,000–50,000 | 544 (36.3%) |
| >$50,000 | 259 (17.3%) |
| Employment status | |
| Not employed | 581 (38.8%) |
| Employed <30 hours/week | 179 (11.9%) |
| Employed ≥30 hours/week | 739 (49.3%) |
| Marital status | |
| Never married | 885 (59.0%) |
| Currently married | 401 (26.8%) |
| Previously married | 213 (14.2%) |
| BMI (kg/m2) | 32.4 (26.4, 39.6) |
| Smoking status | |
| Never | 1104 (73.6%) |
| Former smoker | 114 (7.6%) |
| Current smoker <10 cigarettes/day | 208 (13.9%) |
| Current smoker ≥10 cigarettes/day | 73 (4.9%) |
| Alcohol consumption | |
| Low | 445 (29.7%) |
| Moderate | 757 (50.5%) |
| Heavy | 297 (19.8%) |
| Parity | 1 (0, 2) |
| Perceived stress score (PSS-4) 1 | 7 (4, 8) |
| Depression score (CES-D) 2 | 13 (8, 19) |
| PFAS plasma concentrations (ng/mL) | |
| PFHxS | 0.6 (0.4, 1.0) |
| PFOS3 | 4.3 (2.8, 6.3) |
| PFOA3 | 1.3 (0.9, 1.8) |
| PFNA | 0.5 (0.4, 0.7) |
| PFDA | 0.2 (0.1, 0.3) |
| MeFOSAA | 0.1 (0.1, 0.2) |
PSS-4= Perceived Stress Scale; range= 0–16.
CES-D= 11-item Center for Epidemiologic Studies Depression Scale; range= 0–44.
PFOS and PFOA are the sum of their respective linear and branched isomers.
2.5.3. Selection of Confounders
We used a directed acyclic graph (DAG) informed by the literature to guide the selection of confounders for statistical models (Figure S1) (Aung et al., 2023; Chen et al., 2020; Gaum et al., 2019, 2017; Koh et al., 2017; Mutic et al., 2021; Peltier et al., 2021; Schildroth et al., 2021; Vuong et al., 2020). We adjusted all models for the following baseline characteristics: age (continuous, years), educational attainment (≤high school degree or GED, some college/Associate’s degree/Technical degree, or ≥Bachelor’s degree), annual household income (<$20,000, $20,000-$50,000, or >$50,000), employment status (not employed, employed <30 hours/week, or employed ≥30 hours/week), marital status (never married, currently married, or previously married), BMI (continuous, kg/m2), smoking status (never, former, current <10 cigarettes/day, or current ≥10 cigarettes/day), alcohol consumption (low [<10 drinks/year], moderate [> low, but lower than heavy], or heavy [≥6 drinks per day when drinking alcohol or ≥4 drinks at a single sitting twice per month]), and parity (continuous). Because perceived stress is a known predictor of depressive symptoms in women (Leonard et al., 2020; Li et al., 2021), we included PSS-4 scores as a covariate in all statistical models. We also considered PSS-4 scores as a potential effect measure modifier of associations between PFAS and depressive symptom (CES-D) scores in both Bayesian Kernel Machine Regression (BKMR) and multivariable linear regression models (described below).
2.5.4. Bayesian Kernel Machine Regression
We used BKMR as our primary model to examine associations between the plasma PFAS mixture and depressive symptoms. BKMR utilizes a flexible kernel function to model the mixture, allowing for nonlinearity of the mixture components, pairwise interactions, higher-order interactions between multiple mixture components, and estimation of joint effects (Bobb et al., 2018, 2015). We included PSS-4 scores as a component in the kernel function to assess effect measure modification of the PFAS mixture by perceived stress (Eick et al., 2021). We z-standardized all ln-transformed plasma PFAS concentrations and PSS-4 scores prior to BKMR modeling to keep components included in the kernel function on the same scale. The BKMR model took the following form:
| [1] |
where h represents the kernel function, CES – D scores reflect depressive symptoms, PSS – 4 scores reflect perceived stress, and ei represents the error term.
We fit BKMR models for all five imputed datasets with the non-informative prior specifications, 50,000 iterations, and a 50% burn-in. We selected every 5th iteration for analysis to reduce autocorrelation. We employed the component-wise variable selection option and estimated posterior inclusion probabilities (PIPs), reflecting the relative importance of each exposure variable included in the kernel function, for all PFAS and PSS-4 scores. We pooled findings from each BKMR fit across the five imputed datasets using Rubin’s rule with code developed previously (Devick, 2019; Rubin, 2004).
We estimated summary measures and plotted the following to describe the association of the mixture with depressive symptoms: 1) exposure response profiles for each mixture component, when all other mixture components were held at their medians; 2) joint association at varying percentiles (10th – 90th) of the mixture, compared to the 50th percentile; 3) associations of each mixture component, for an increase from the 25th to 75th percentiles, at the 25th, 50th, and 75th percentiles of all other mixture components; and 4) exposure response profiles for each mixture component, at the 25th, 50th, and 75th percentiles of a second mixture component, holding all other mixture components at their medians. To investigate the modifying role of perceived stress on the overall PFAS mixture, we further estimated the joint association of the PFAS mixture at varying percentiles (10th – 90th), compared with the 50th percentile, fixing PSS-4 scores at their 10th, 50th, and 90th percentiles.
We estimated beta (β) coefficients and 95% credible intervals (CrIs) for all summary measures. To aid in the interpretation of our findings, we also presented β coefficients as the percent difference in CES-D scores, calculated as:
| [2] |
2.5.5. Multivariable Linear Regression
We used multivariable linear regression models to complement the findings from our BKMR model. There was limited evidence of nonlinearity in associations of plasma PFAS concentrations or PSS-4 scores with CES-D scores in the BKMR model and Generalized Additive Models (GAMs), which we fit to assess the linearity of associations between plasma PFAS concentrations and CES-D scores. We therefore modeled plasma PFAS concentrations and PSS-4 scores continuously in subsequent linear regression models. We adjusted for the same set of confounders as in the BKMR models, and mutually adjusted for all plasma PFAS concentrations and PSS-4 scores. We investigated the potential for pairwise interactions between PFAS and perceived stress by including cross-product terms between each PFAS and PSS-4 scores in regression models. All cross-product terms had p-values >0.20, and we therefore did not retain these terms in the final models.
We fit linear regression models for all five imputed datasets and estimated pooled β coefficients and 95% confidence intervals (CIs) using Rubin’s rule (Rubin, 2004). To improve interpretability, we back-transformed the β coefficients and 95% CIs using Equation [2] for PSS-4 scores and the following equations for the PFAS:
| [3] |
| [4] |
where SE represents the standard error.
We interpreted the β coefficients as the percent difference in CES-D scores per doubling in PFAS concentrations or point increase in PSS-4 scores.
2.5.6. Sensitivity Analyses
We performed a series of sensitivity analyses to examine the robustness of our findings. We first fit BKMR and multivariable linear regression models: 1) only among participants with CES-D scores measured at the 20-month follow-up (n=1,323); 2) utilizing the 40-month and 60-month CES-D scores, rather than imputed 20-month CES-D scores, for participants who complete the CES-D at the 40- and 60-month follow-up visits, respectively; and 3) additionally adjusting for duration of breastfeeding (continuous, in months), given breastfeeding is a known route of elimination for PFAS and has been associated with depressive symptoms (Hamdan and Tamim, 2012; Pope and Mazmanian, 2016; Schildroth et al., 2021; Wise et al., 2021). Next, we fit BKMR models changing the: 1) smoothness of the kernel function from the default (b=100) to lower and higher degrees of smoothness (b=50 and b=1000, respectively), and 2) default uniform prior distribution to a gamma distribution (Bauer et al., 2020; Valeri et al., 2017). Finally, we fit linear regression models that were not co-adjusted for all PFAS.
3. RESULTS
3.1. Study Population Characteristics
The median age at enrollment of SELF participants in the analytic sample was 29 years (25th-75th percentiles: 26–32 years), and the median BMI was 32.4 kg/m2 (25th-75th percentiles: 26.4–39.6 kg/m2; Table 1). At baseline, 27.9% of participants had a Bachelor’s degree or higher, 46.4% had annual household incomes <$20,000/year, 38.8% were not employed, and 59.0% had never been married. Seventy-four percent of participants were never smokers and 50.5% were moderate consumers of alcohol. Median (25th-75th percentiles) scores for perceived stress (PSS-4) and depressive symptoms (CES-D) were 7 (4–8) and 13 (8–19), respectively. Thirty-seven percent of participants had CES-D scores (≥16) indicative of clinically relevant depression (Park, 2021).
Median (25th-75th percentiles) plasma PFAS concentrations were highest for PFOS (4.3 ng/mL; 2.8–6.3 ng/mL) and PFOA (1.3 ng/mL; 0.9–1.8 ng/mL), and lowest for MeFOSAA (0.1 ng/mL; 0.1–0.2 ng/mL; Table 1 and Table S6). PFAS concentrations were weakly to moderately correlated, where Spearman correlation coefficients ranged from 0.11 (PFNA-MeFOSAA) to 0.68 (PFOA-PFNA; Table S7).
3.2. Associations of PFAS with Depressive Symptoms
Considered individually, most PFAS concentrations were not materially associated with CES-D scores in multivariable linear regression or BKMR models (Figure 2). However, a doubling in plasma PFDA concentrations was associated with an 11.5% (95% CI=-0.4%, 24.9%) increase in CES-D scores in multivariable linear regression models (Figure 2A). Likewise, when we evaluated PFAS using the BKMR model, PFDA was associated with an 10.5% increase in CES-D scores when the remaining mixture components were held at their 50th percentiles (for an increase in PDFA concentrations from the 25th to 75th percentiles: β=0.10, 95% CrI=-0.06, 0.27; Figure 2B), but this association was less precise.
Figure 2.
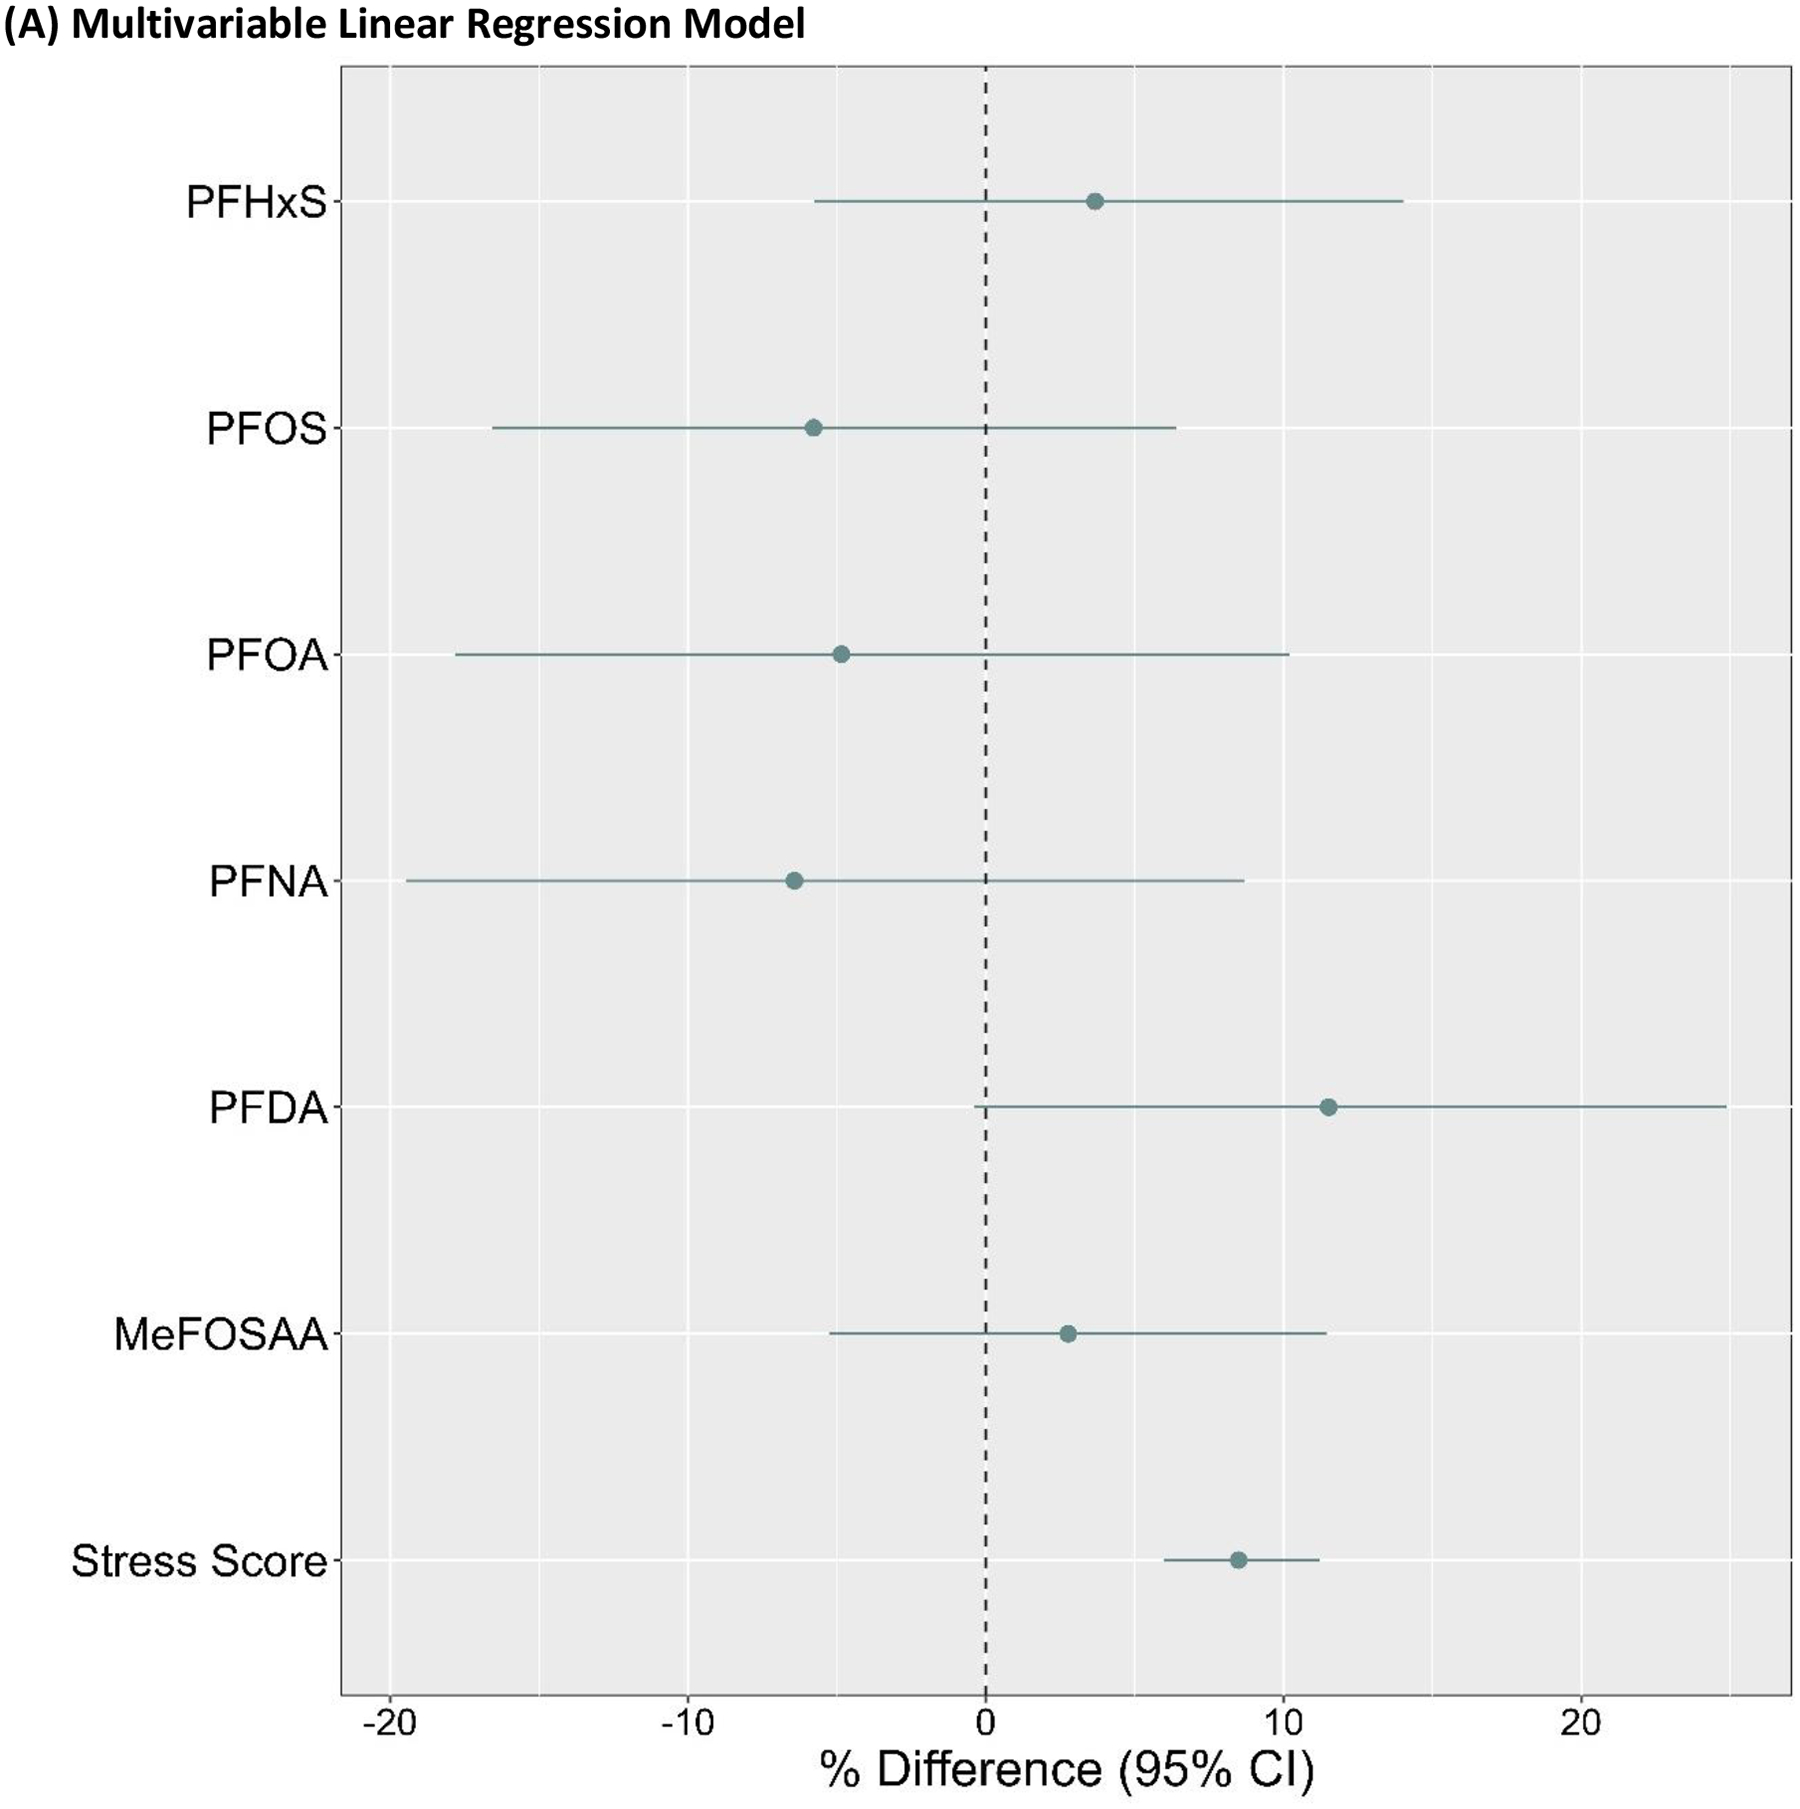
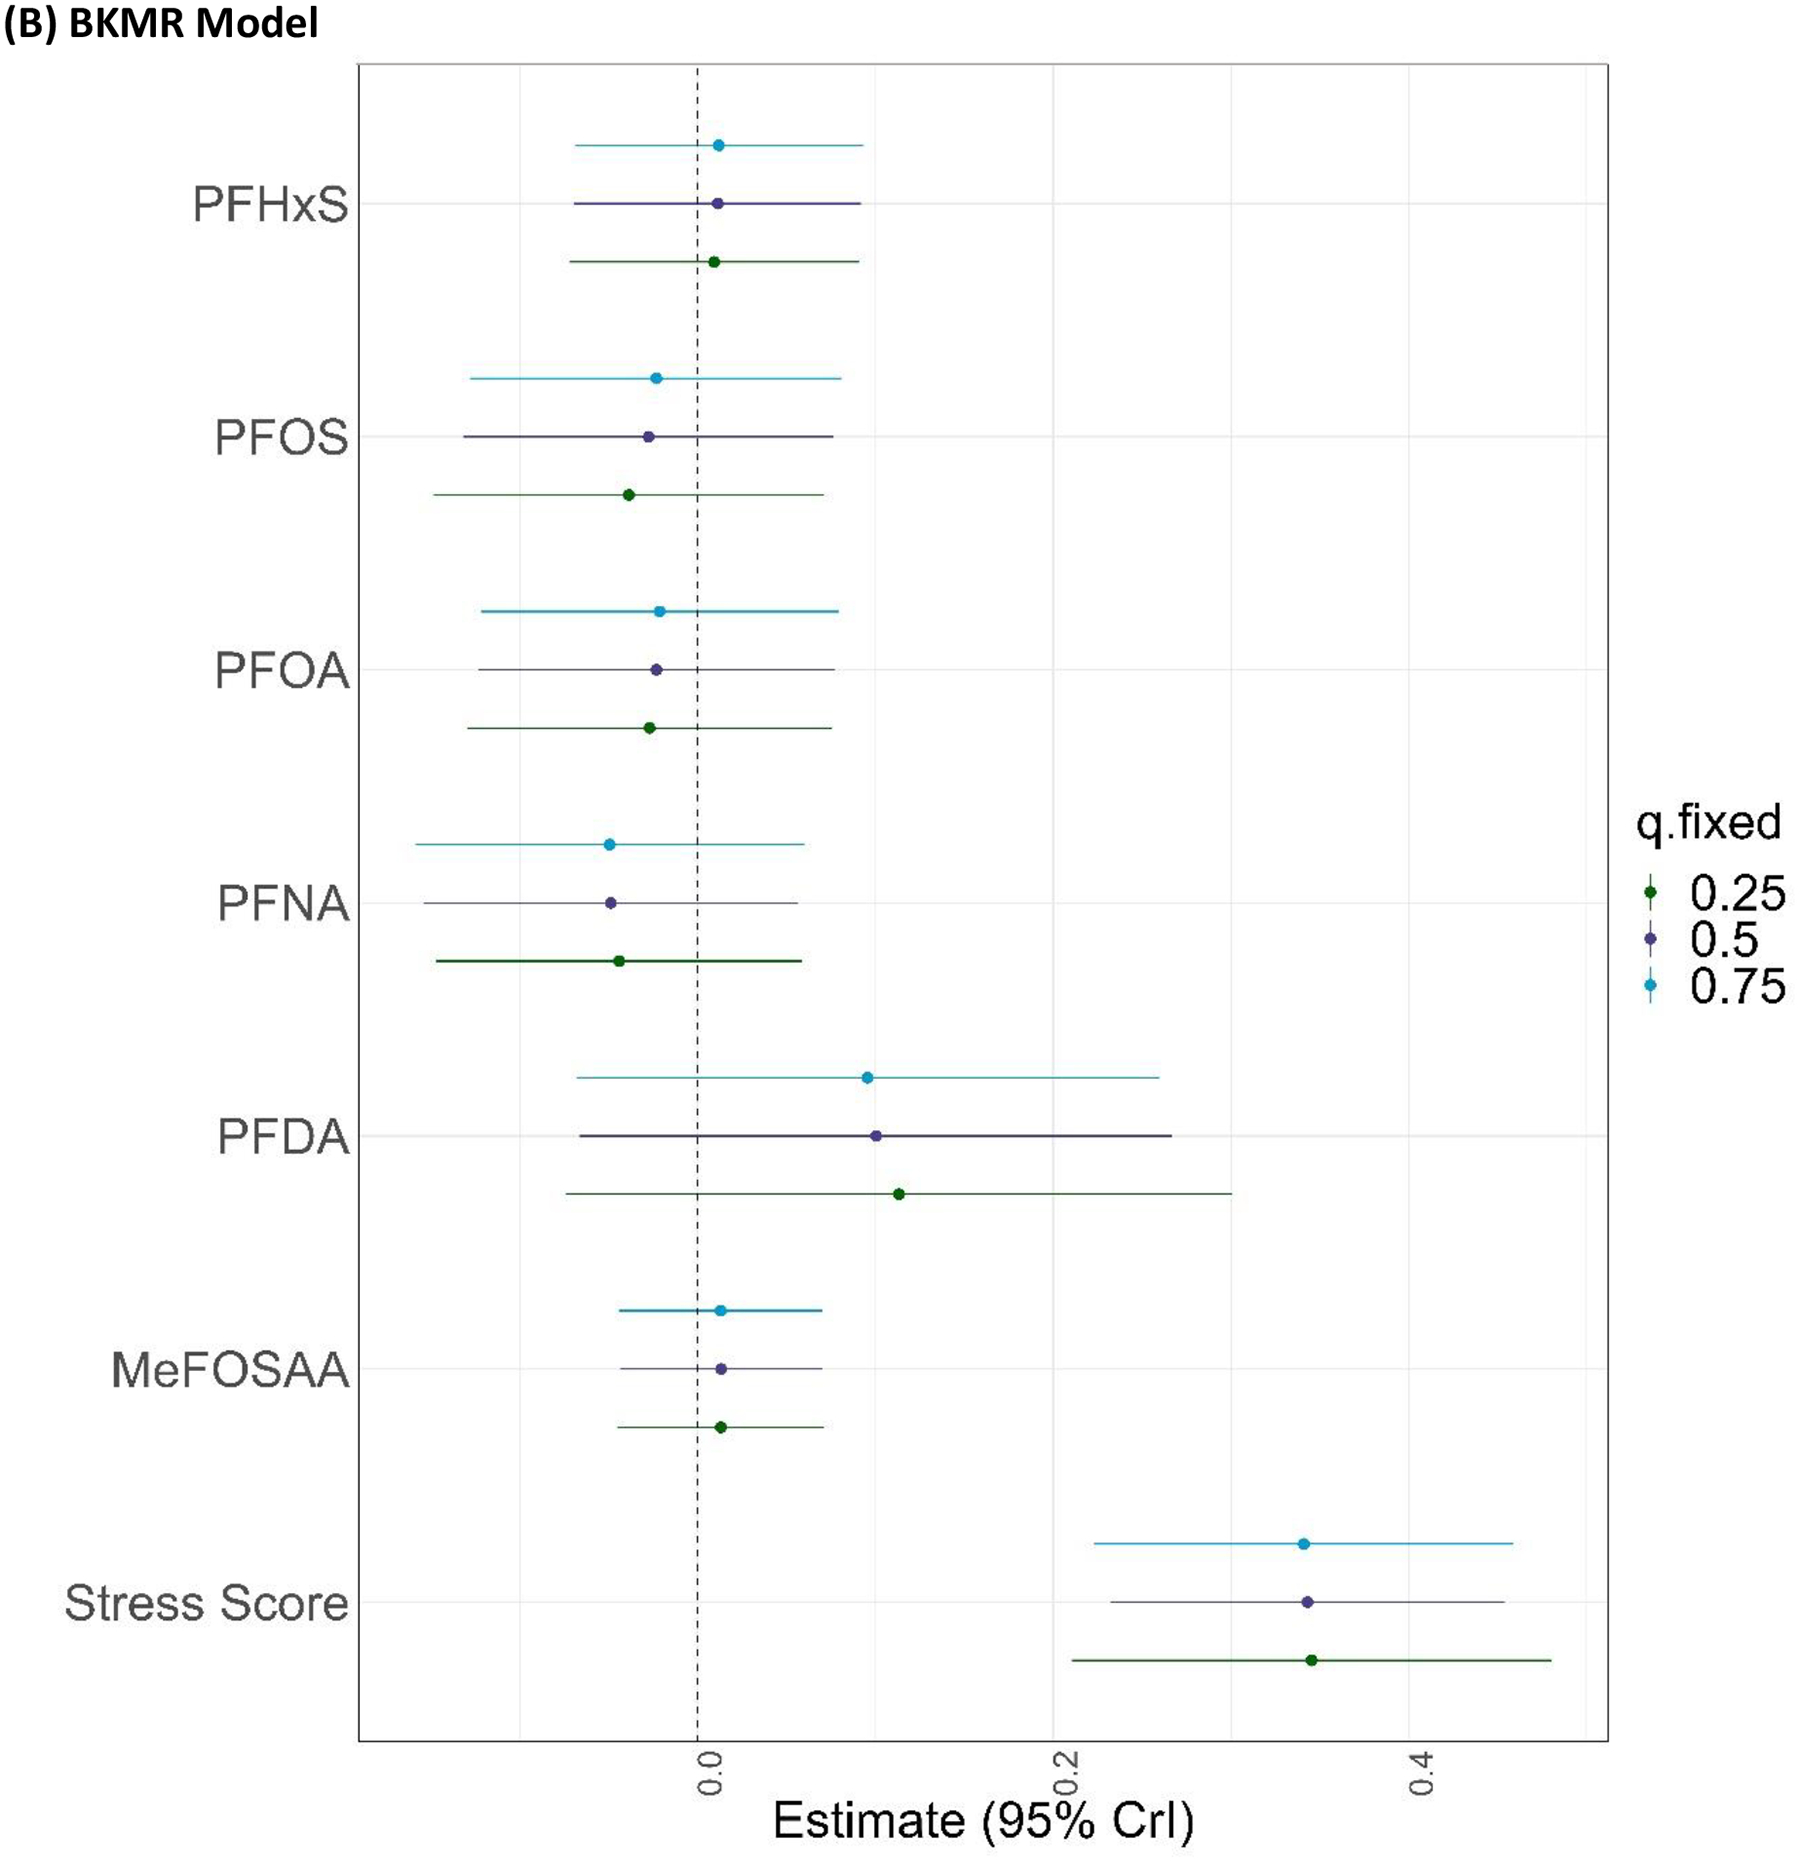
Associations of plasma PFAS concentrations and PSS-4 scores with CES-D scores in the (A) multivariable linear regression model and (B) BKMR model (for an increase from the 25th to 75th percentiles, holding all other mixture components at their 25th, 50th, or 75th percentiles). Both models were adjusted for age, educational attainment, annual household income, employment status, marital status, BMI, smoking status, alcohol consumption, and parity (n=1,499). The multivariable linear regression model was also co-adjusted for all plasma PFAS concentrations and PSS-4 scores. PFAS were ln-transformed for BKMR and multivariable linear regression models; ln-transformed PFAS and PSS-4 scores were z-standardized for the BKMR model. Beta coefficients from the multivariable linear regression model were back-transformed to percent (%) differences in CES-D scores per doubling in plasma PFAS concentrations or point increase in PSS-4 scores.
Higher perceived stress (PSS-4) scores were associated with greater CES-D scores in the multivariable linear regression model (β=8.5%, 95% CI=6.0%, 11.2%) and BKMR model (for an increase from the 25th to 75th percentiles, holding all other mixture components at their 50th percentiles: β=0.34, 95% CrI=0.23, 0.45; Figure 2).
Increasing percentiles of the mixture, including all PFAS and PSS-4 scores, were jointly associated with higher CES-D scores in BKMR models (Figure S2); this association was driven exclusively by PSS-4 scores, which also had the highest PIP (1.0) relative to the PFAS (range: 0.06–0.12)
There was no evidence of pairwise or higher-order interactions between any of the PFAS in relation to CES-D scores in BKMR models (Figure S3 and Figure 2B), nor was there evidence that perceived stress modified associations of individual PFAS with CES-D scores in either the BKMR model (Figures S3) or the multivariable linear regression model.
We further examined potential effect modification by perceived stress of the association between the PFAS mixture and CES-D scores by estimating joint associations between the PFAS mixture (PFHxS, PFOS, PFOA, PFNA, PFDA, MeFOSAA) held at varying percentiles (compared to the 50th percentile) when PSS-4 scores were held at their 10th, 50th, and 90th percentiles (Figure 3). There was no evidence that the PFAS mixture was appreciably associated with CES-D scores, or that perceived stress modified the association between the PFAS mixture and CES-D scores. For example, the association of the 90th percentile of the PFAS mixture, compared with the 50th percentile, with CES-D scores was null when PSS-4 scores were held at their 10th (β=0.03; 95% CI= −0.20, 0.25), 50th (β=0.02; 95% CI= −0.16, 0.19), and 90th (β=0.01; 95% CI= −0.18, 0.20) percentiles (Figure 3).
Figure 3.
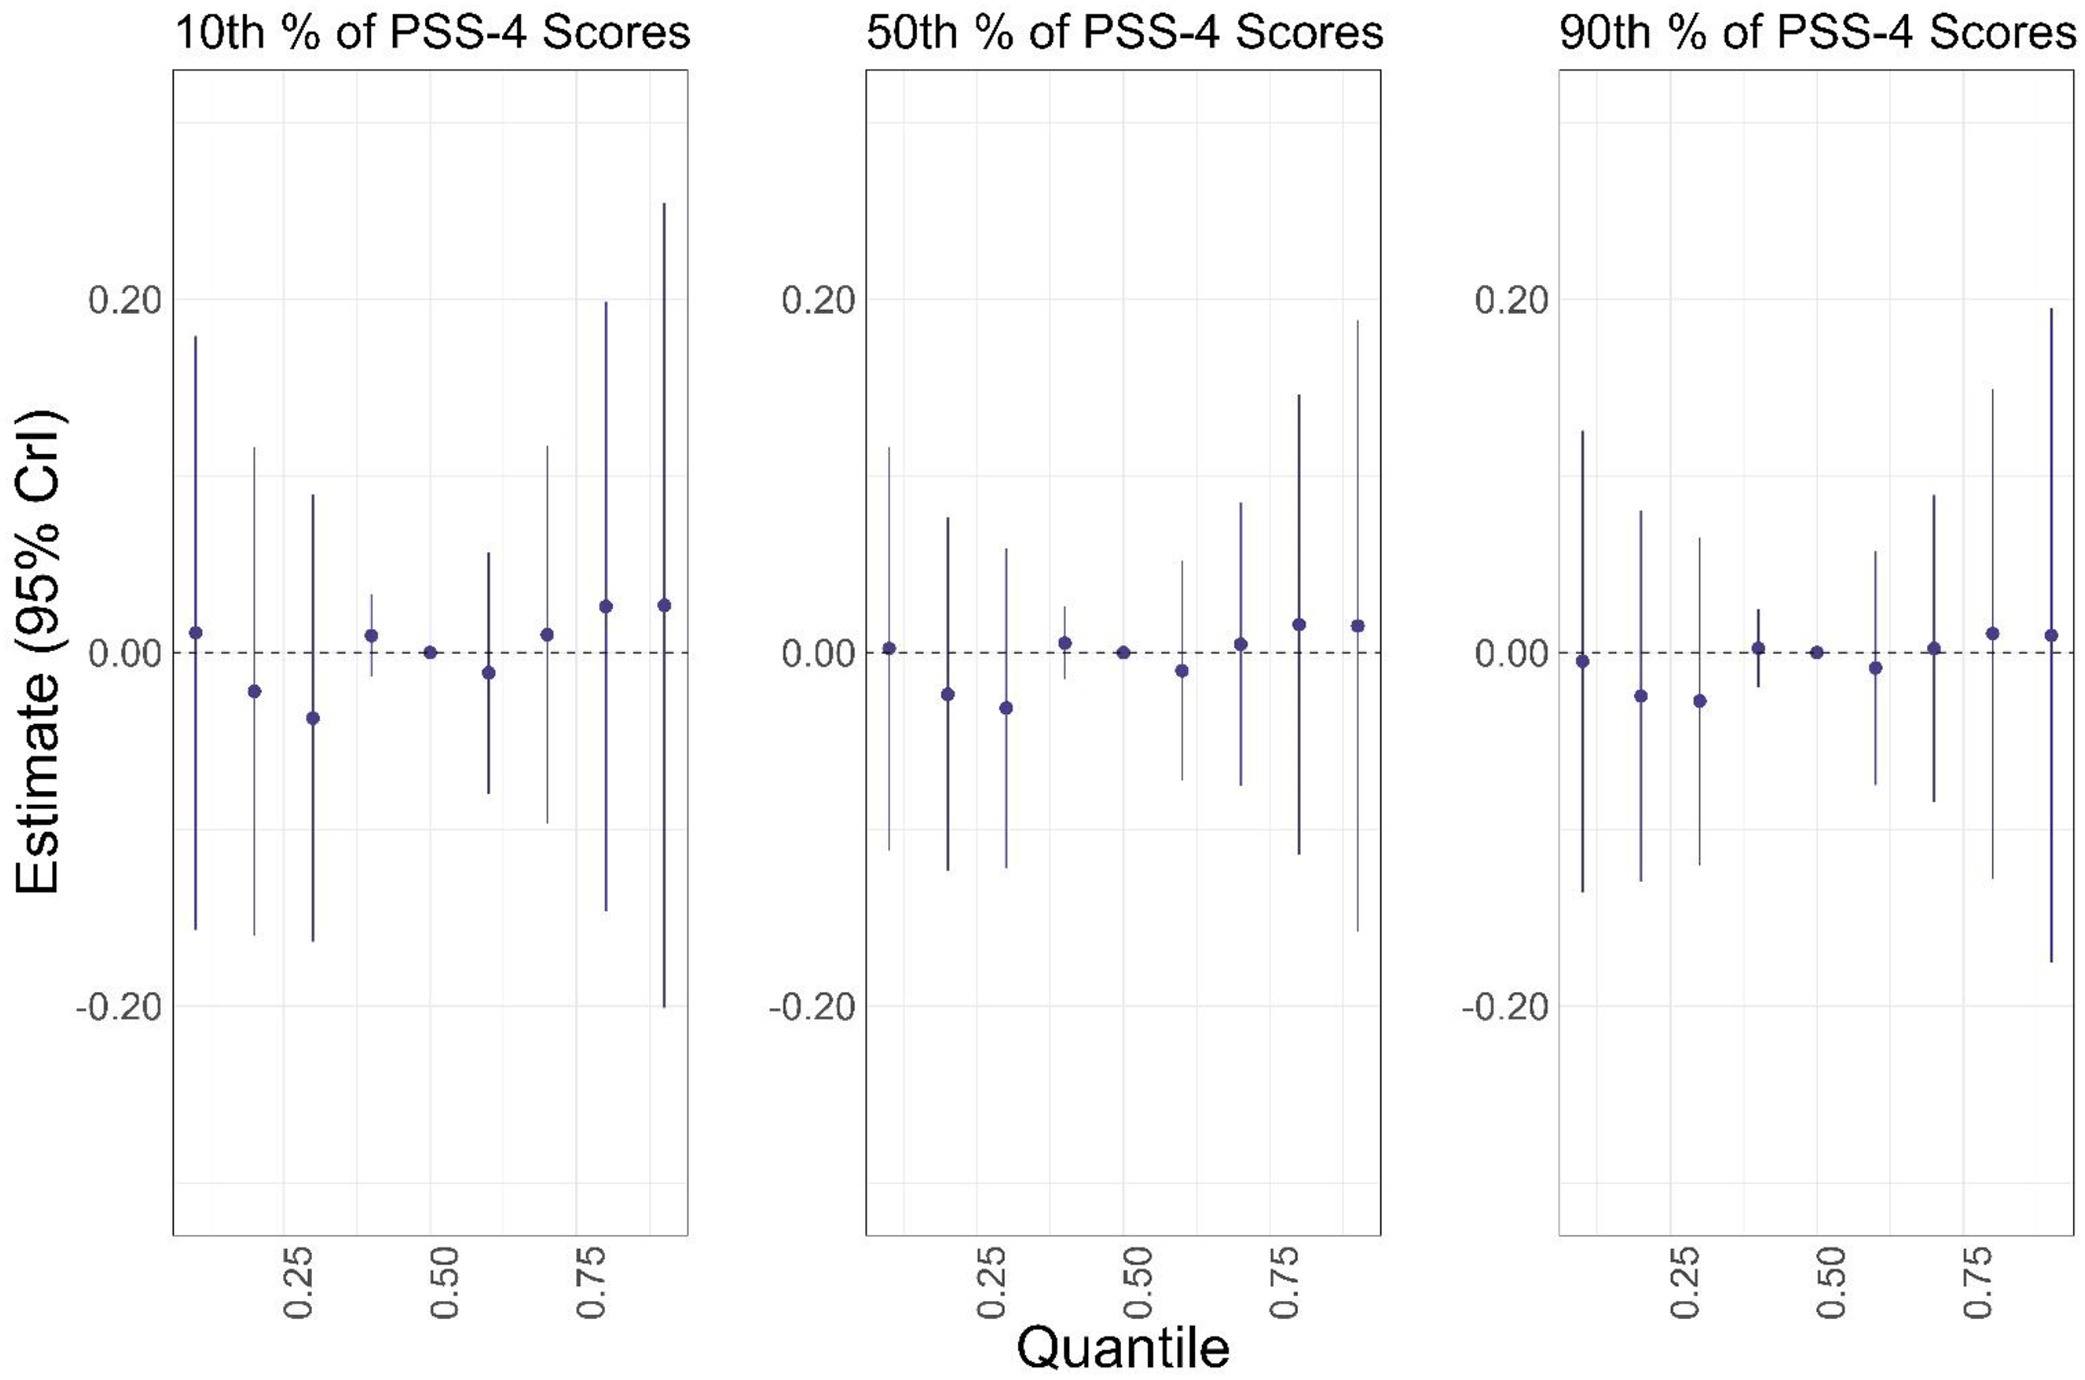
Associations of varying percentiles (10th—90th) of the PFAS mixture (PFHxS, PFOS, PFOA, PFNA, PFDA, MeFOSAA) with CES-D scores, compared to the 50th percentile of the PFAS mixture, when PSS-4 scores were held at their 10th, 50th, and 90th percentiles, respectively. Models were adjusted for age, educational attainment, annual household income, employment status, marital status, BMI, smoking status, alcohol consumption, and parity (n=1,499). Plasma PFAS concentrations scores were ln-transformed and z-standardized; PSS-4 scores were z-standardized.
3.3. Sensitivity analyses
Our main findings did not differ materially from sensitivity analyses where we: 1) restricted the analytic sample to participants with CES-D scores measured at the 20-month follow-up (i.e., a complete case analysis, n=1,323; Figures S4 and S5); 2) utilized 40-month and 60-month CES-D scores, rather than the imputed 20-month CES-D scores, for participants who completed the CES-D at the 40- and 60-month follow-up visits (Figures S6 and S7); 3) additionally adjusted for prior breastfeeding duration (Figures S8 and S9); 4) changed the default prior BKMR specifications (Figure S10–S12); or 5) did not co-adjust linear regression models for all PFAS (Table S8). However, the association for PFDA observed in primary linear regression models was attenuated in the linear regression model that was not co-adjusted for all other PFAS (Table S8). As with our main findings, there was no evidence that plasma PFAS concentrations (individually or as a mixture) were appreciably associated with CES-D scores.
DISCUSSION
We estimated associations of a mixture that included six PFAS and perceived stress with depressive symptoms in a cohort of reproductive-aged Black women. Plasma PFDA concentrations were associated with increased depressive symptoms in linear regression and BKMR models, but other PFAS were not materially associated with depressive symptoms. There was also no evidence of joint or interactive effects of the PFAS mixture. Although self-reported levels of perceived stress were associated with increased depressive symptoms, perceived stress did not modify associations between the PFAS mixture and depression scores.
Environmental chemicals, including PFAS, have been hypothesized to play a role in the etiology of depressive symptoms given their ability to interfere with hormonal systems (Agency for Toxic Substances and Disease Registry, 2021). Disruption of the HPA/HPT axes has been implicated in the development of mood disorders because these axes regulate the stress response (Chu et al., 2022; Nuguru et al., 2022; Russell and Lightman, 2019; Varghese and Brown, 2001). Notably, individuals with depression have elevated levels of cortisol (Keller et al., 2017; Varghese and Brown, 2001), thyroid stimulating hormone (TSH) (Nuguru et al., 2022), and oxidative stress biomarkers (Bajpai et al., 2014; Correia et al., 2023), but reductions in triiodothyronine concentrations (Morin, 2015). Alternatively, studies have reported both increased and reduced levels of thyroxine (T4) among individuals with depressive symptoms (Hage and Azar, 2012; Odawara et al., 2023). PFAS exposure has been associated with higher levels of reactive oxygen species (ROS) and inflammatory biomarkers (Jiao et al., 2021; Ojo et al., 2021; Omoike et al., 2021; Taibl et al., 2022; Tan et al., 2023), compromised oxidative stress defenses (i.e., glutathione) (Jiao et al., 2021; Ojo et al., 2021), increased corticotropin-releasing hormone (CRH) (Eick et al., 2021), higher TSH levels, and lower T4 levels (Coperchini et al., 2020; Derakhshan et al., 2022; Inoue et al., 2019; Lebeaux et al., 2020; Preston et al., 2020, 2018; Reardon et al., 2019; Wang et al., 2013; Xiao et al., 2020; Zhang et al., 2023), supporting the potential induction of depressive symptoms by PFAS through HPA/HPT disruption.
In addition to HPA/HPT dysregulation, the etiology of depression is related to changes in functional connectivity in the brain, particularly the prefrontal cortex and limbic system (Bremner et al., 2000; Mayberg et al., 1999; Pandya et al., 2012; Zhang et al., 2018), activation of the cortico-amygdalastriatal circuits (Pandya et al., 2012; Price and Drevets, 2010; Zhang et al., 2018), and changes in neurotransmitter levels (e.g., dopamine, glutamate, GABA) (Belujon and Grace, 2017; Fogaça and Duman, 2019; Onaolapo and Onaolapo, 2021; Pandya et al., 2012). Importantly, regions of the brain implicated in depression are targets for PFAS neurotoxicity. PFAS induce ROS and disrupt endothelial tight junctions of the blood-brain-barrier, increasing permeability and allowing toxicants, including PFAS, to enter the brain (Brown-Leung and Cannon, 2022; Qian et al., 2010; Reistad et al., 2013; Wang et al., 2011; Yu et al., 2020). PFAS neurotoxicity is characterized by disruptions to neurotransmission through dysregulation of calcium ion signaling and neurotransmitter (e.g., dopamine, glutamate, GABA) synthesis, metabolism, and receptor binding in the cortex, hippocampus, amygdala, and hypothalamus (Brown-Leung and Cannon, 2022; Foguth et al., 2020, 2019; Grønnestad et al., 2021; Li et al., 2017; Long et al., 2013; López-Doval et al., 2015; Mshaty et al., 2020; Salgado et al., 2016, 2015; Tukker et al., 2020). These data support the hypothesis that PFAS exposure can impact depressive symptoms through multiple neurotoxic mechanisms affecting regions of the brain implicated in emotional regulation, mood, and motivation.
Despite extensive toxicological data implicating PFAS in the etiology of depression, epidemiologic studies investigating associations between PFAS and self-reported depressive symptoms are inconsistent. Four studies examined serum or plasma PFAS concentrations among pregnant women (in the first, second, or third trimester) in relation to depression scores measured during pregnancy or the post-partum period. While PFAS (PFOA, PFOS, PFHxS, PFNA, PFDA, PFUnDA, perfluorododecanoic acid, perfluorobutanesulfonic acid, and perfluoroheptanoic acid) were not associated with post-partum depressive symptoms measured at multiple timepoints following birth (42 days or 4 weeks through 8 years post-pregnancy) (Vuong et al., 2020; Wang et al., 2023), PFOA, PFOS, PFHxS, PFNA, PFDA, and MeFOSAA were associated with greater CES-D scores during the second trimester of pregnancy or greater EPD scores 1 to 6 months post-partum (Aung et al., 2023; Hu et al., 2024). These findings are consistent with an animal study that similarly reported higher post-partum anxiety-like behavior among low-dose PFAS-exposed dams (Merrill et al., 2022). Interestingly, the median PFOS concentration (2.0 ng/mL for participants with CES-D scores <16, 1.6 ng/mL for participants with CES-D scores ≥16) in Aung et al. was lower than that in the current study (4.3 ng/mL) (Aung et al., 2023), suggesting that the PFAS concentrations do not necessarily explain discrepant findings between our studies. While we measured PFAS concentrations among non-pregnant participants, Aung et al. measured PFAS during pregnancy (Aung et al., 2023). Pregnancy is a dynamic period characterized by anatomical and functional changes in the brain and may be a critical period of exposure to neurotoxicants (Barba-Müller et al., 2019). The timing of exposure assessment may therefore explain adverse PFAS-depression associations that Aung et al. reported. Alternatively, median PFAS concentrations were consistently higher in Hu et al., which, in addition to differences in exposure timing, may explain discrepant findings between our studies (Hu et al., 2024).
A more recent study of adults aged ≥20 years from NHANES (2005–2018 cycles) reported non-linear associations between PFAS and self-reported depressive symptoms measured using the PHQ-9 (Yi et al., 2023). Using GAMs, the authors identified inflection points in the dose-response curves for PFOS (25.4 ng/mL), PFOA (5.8 ng/mL), and PFNA (0.9 ng/mL), where serum concentrations below the inflection point were associated with lower depression scores and serum concentrations above the inflection point were associated with either increases (PFOS, PFNA) or no change (PFOA) in depression scores (Yi et al., 2023). The inflection point concentrations reported in Yi et al. at which adverse associations were observed were higher than median concentrations in our study (PFOS: 25.4 ng/mL vs. 4.3 ng/mL; PFNA: 0.9 ng/mL vs. 0.5 ng/mL), possibly explaining the inconsistency in results between their study and the current analysis. Moreover, the adverse associations Yi et al. observed were strongly attenuated among females in sex-stratified models, suggesting potential sex-specific effects; therefore, the lack of association in SELF may be explained by weaker effects of PFAS on depression among females.
We found little evidence of either interactions or joint effects of the PFAS mixture, likely because the individual PFAS were not strongly associated with depressive symptoms in either BKMR or linear regression models. These findings are contrary to prior studies in animal models that demonstrate exposure to PFAS mixtures had a greater effect on altered neurotransmitter concentrations (i.e., reduced glutamate, dopamine, serotonin levels) than PFAS considered individually (Foguth et al., 2020; Grønnestad et al., 2021; Yu et al., 2016). To our knowledge, only a handful of prior epidemiologic studies considered a PFAS mixture in relation to depressive symptoms. Using quantile-based g-computation, Aung et al. and Hu et al. both reported that serum or plasma concentrations of PFAS mixtures that included PFHxS, PFOS, PFOA, PFNA, PFDA, PFUnDA, perfluoroheptanesulfonic acid (PFHpS), 6:2 chlorinated polyfluorinated ether sulfonic acid (6:2 Cl-PFESA), or MeFOSAA were jointly associated with greater depression scores (primarily driven by PFOS and MeFOSAA in Aung et al. and PFHxS, PFOA, PFNA, PFHpS, and 6:2 Cl-PFESA in Hu et al.) (Aung et al., 2023; Hu et al., 2024). In Aung et al., this association was markedly stronger among immigrant women (driven by PFHxS, PFOS, PFNA, PFDA, and MeFOSAA), who also had lower serum PFAS concentrations than U.S.-born women for whom the joint association of the mixture was null. The authors concluded that the stronger association of the PFAS mixture with depression scores among immigrant women may reflect modification of the toxic effects of the PFAS mixture by social stressors (e.g., discrimination, hardship, social isolation) (Aung et al., 2023), highlighting the importance of considering both chemical and non-chemical stressors in mixtures research.
Although PFAS (considered individually or as a mixture) were not associated with depressive symptoms in SELF, we did observe strong associations between self-reported perceived stress and depressive symptoms, which has been reported previously (Catabay et al., 2019; Qu et al., 2012). Several types of stressors (i.e., violence, discrimination, financial hardship) have been associated with greater depression scores (Catabay et al., 2019; Gillespie et al., 2021; Holden et al., 2013; Quist et al., 2022b), as well as altered cortisol levels (Adam et al., 2015; Johnson et al., 2022; Lee et al., 2018; Nam et al., 2022; Suglia et al., 2010). However, there was no evidence that perceived stress modified the PFAS mixture in this study, and the association of the overall mixture (PFHxS, PFOS, PFOA, PFNA, PFDA, MeFOSAA, and PSS-4 scores) with depressive symptoms was driven exclusively by PSS-4 scores. The lack of effect modification by perceived stress on the association between PFAS and depression in SELF could relate to the absence of meaningful associations between most PFAS and depression scores. However, several prior studies reported joint and interactive associations of PFAS and perceived stress in relation to pregnancy outcomes (e.g., birthweight) (Eick et al., 2022, 2023) and circulating hormone levels (i.e., CRH) (Eick et al., 2021). Future studies should consider perceived stress in mixtures research for outcomes where the HPA/HPT axes are implicated.
This study represents one of only a handful of epidemiologic studies examining associations between PFAS concentrations and depressive symptoms. We investigated this research question in a large, established cohort with comprehensive chemical biomarker data measured using the same established methods and laboratory used to analyze NHANES samples, and prospective measurements of depressive symptoms. Our study also focused on reproductive-aged Black women, who are inequitably impacted by depression and remain underrepresented in environmental health research (Nelson et al., 2020; Williams et al., 2007; Woods-Giscombe et al., 2016). Further, we measured depressive symptoms using the CES-D, which has demonstrated good internal consistency and reliability (Atkins, 2014; Canady et al., 2009; Cosco et al., 2017; Kohout et al., 1993; Makambi et al., 2009a; Torres, 2012). Utilizing continuous CES-D scores allowed us to investigate potential subclinical effects and may have improved our outcome sensitivity compared to using depression diagnoses given that Black women are less likely to seek out and receive clinical diagnoses of depression (Nelson et al., 2020; Williams et al., 2007; Woods-Giscombe et al., 2016). Notably, CES-D scores in SELF tended to be elevated (i.e., 37% above the clinical cutoff for the CES-D-11) compared to other study populations of Black women (i.e., the Black Women’s Health Study, where 21%-26% of participants scored above the clinical cutoff for the CES-D-20) (Makambi et al., 2009b). Our focus on PFAS mixtures is also noteworthy because, to date, only one other study has investigated the potential for joint associations between a PFAS mixture and depressive symptoms in women. We utilized a state-of-the-art statistical approach to model the mixture, which allowed for the investigation of pairwise interactions, higher-order interactions, and joint effects. This is also one of the first studies to incorporate both chemical and non-chemical stressors as components in a complex mixture. Finally, we were able to adjust for a suite of potential confounders given the collection of extensive of socioeconomic, demographic, and behavioral data in SELF.
Our study had several limitations. Although we were able to adjust for several important confounders, we were unable to adjust for other stressors (e.g., structural racism, discrimination) that could be related to both PFAS exposure and depressive symptoms (Catabay et al., 2019; Gillespie et al., 2021; Holden et al., 2013; Quist et al., 2022b). We also did not adjust for dietary factors or other environmental exposures that may be associated with PFAS exposure and depression (Schildroth et al., 2021; Selvaraj et al., 2022; Wise et al., 2021). Though there were little missing data in SELF, ~12% of participants were missing CES-D scores at the 20-month follow-up. We multiply imputed CES-D scores for these participants to reduce the potential for selection bias. It is possible that utilizing the imputed scores led to some degree of non-differential misclassification of the outcome; however, we would generally expect this misclassification to create a bias towards the null (Yland et al., 2022). Importantly, PFAS biomarker concentrations were similar for participants who completed the CES-D (at the 20-month, 40-month, and 60-month follow-up visits) and for participants who did not complete the CES-D at any follow-up visit (Table S4), and our findings did not materially differ from sensitivity analyses in which we: 1) restricted to participants with complete 20-month outcome data, and 2) used the CES-D scores from subsequent follow-ups (40-month and 60-month), suggesting that our findings were not strongly affected by how we handled missing outcome data.
In this prospective study of reproductive-aged Black women, we found limited evidence that plasma concentrations of PFAS, considered individually or as a mixture, were associated with depressive symptoms. Although perceived stress has been shown to modify the effects of PFAS on other health outcomes in previous studies (Eick et al., 2021), and perceived stress was strongly related to depressive symptoms in our cohort, there was no indication that perceived stress modified associations of the PFAS mixture with depressive symptoms.
Supplementary Material
HIGHLIGHTS.
PFAS have been associated with depressive symptoms, but little is known about PFAS mixtures.
We evaluated associations of a PFAS mixture with depressive symptoms in Black women.
The PFAS mixture was not appreciably associated with depressive symptoms.
Acknowledgements.
This research was supported by the National Institute of Environmental Health Sciences (R01-ES024749). This research was also supported, in part, by the Intramural Research Program of the NIH (ZIAES049013) and funds allocated for health research by the American Recovery and Reinvestment Act.
Footnotes
Publisher's Disclaimer: This is a PDF file of an unedited manuscript that has been accepted for publication. As a service to our customers we are providing this early version of the manuscript. The manuscript will undergo copyediting, typesetting, and review of the resulting proof before it is published in its final form. Please note that during the production process errors may be discovered which could affect the content, and all legal disclaimers that apply to the journal pertain.
Disclaimer: The findings and conclusions in this report are those of the authors and do not necessarily represent the official position of the Centers for Disease Control and Prevention (CDC). The use of trade names is for identification only and does not imply endorsement by the CDC.
Declaration of conflicts of interest:
The authors declare they have nothing to disclose.
REFERENCES
- Adam Emma K, Heissel JA, Zeiders KH, Richeson JA, Ross EC, Ehrlich KB, Levy DJ, Kemeny M, Brodish AB, Malanchuk O, Peck SC, Fuller-Rowell TE, Eccles JS, Adam EK, 2015. Developmental histories of perceived racial discrimination and diurnal cortisol profiles in adulthood: A 20-year prospective study. Psychoneuroendocrinology 62, 279–291. 10.1016/j.psyneuen.2015.08.018 [DOI] [PMC free article] [PubMed] [Google Scholar]
- Agency for Toxic Substances and Disease Registry, 2021. Toxicological Profile for Perfluoroalkyls [WWW Document]. URL https://www.atsdr.cdc.gov/toxprofiles/tp.asp?id=1117&tid=237 (accessed 8.16.20). [PubMed]
- Albert PR, 2015. Why is depression more prevalent in women? J Psychiatry Neurosci 40, 219. 10.1503/JPN.150205 [DOI] [PMC free article] [PubMed] [Google Scholar]
- Atkins R, 2014. Validation of the Center for Epidemiologic Studies Depression Scale in Black Single Mothers. J Nurs Meas 22, 511. 10.1891/1061-3749.22.3.511 [DOI] [PMC free article] [PubMed] [Google Scholar]
- Aung MT, Eick SM, Padula AM, Smith S, Park JS, DeMicco E, Woodruff TJ, Morello-Frosch R, 2023. Maternal per- and poly-fluoroalkyl substances exposures associated with higher depressive symptom scores among immigrant women in the Chemicals in Our Bodies cohort in San Francisco. Environ Int 172, 107758. 10.1016/J.ENVINT.2023.107758 [DOI] [PMC free article] [PubMed] [Google Scholar]
- Baird DD, Harmon QE, Upson K, Moore KR, Barker-Cummings C, Baker S, Cooper T, Wegienka G, 2015. A Prospective, Ultrasound-Based Study to Evaluate Risk Factors for Uterine Fibroid Incidence and Growth: Methods and Results of Recruitment. J Womens Health 24, 907–915. 10.1089/jwh.2015.5277 [DOI] [PMC free article] [PubMed] [Google Scholar]
- Bajpai A, Verma AK, Srivastava M, Srivastava R, 2014. Oxidative Stress and Major Depression. J Clin Diagn Res 8, CC04. 10.7860/JCDR/2014/10258.5292 [DOI] [PMC free article] [PubMed] [Google Scholar]
- Barba-Müller E, Craddock S, Carmona S, Hoekzema E, 2019. Brain plasticity in pregnancy and the postpartum period: links to maternal caregiving and mental health. Arch Womens Ment Health 22, 289. 10.1007/S00737-018-0889-Z [DOI] [PMC free article] [PubMed] [Google Scholar]
- Bauer JA, Devick KL, Bobb JF, Coull BA, Bellinger D, Benedetti C, Cagna G, Fedrighi C, Guazzetti S, Oppini M, Placidi D, Webster TF, White RF, Yang Q, Zoni S, Wright RO, Smith DR, Lucchini RG, Claus Henn B, 2020. Associations of a Metal Mixture Measured in Multiple Biomarkers with IQ: Evidence from Italian Adolescents Living near Ferroalloy Industry. Environ Health Perspect 128, 97002. 10.1289/EHP6803 [DOI] [PMC free article] [PubMed] [Google Scholar]
- Belujon P, Grace AA, 2017. Dopamine System Dysregulation in Major Depressive Disorders. International Journal of Neuropsychopharmacology 20, 1036. 10.1093/IJNP/PYX056 [DOI] [PMC free article] [PubMed] [Google Scholar]
- Bobb JF, Claus Henn B, Valeri L, Coull BA, 2018. Statistical software for analyzing the health effects of multiple concurrent exposures via Bayesian kernel machine regression. Environ Health 17, 67. 10.1186/s12940-018-0413-y [DOI] [PMC free article] [PubMed] [Google Scholar]
- Bobb JF, Valeri L, Claus Henn B, Christiani DC, Wright RO, Mazumdar M, Godleski JJ, Coull BA, 2015. Bayesian kernel machine regression for estimating the health effects of multi-pollutant mixtures. J. F. BOBB AND OTHERS 16, 493–508. 10.1093/biostatistics/kxu058 [DOI] [PMC free article] [PubMed] [Google Scholar]
- Botelho J, Pirkle JL, 2018. Laboratory Procedure Manual: Perfluoroalkyl and Polyfluoroalkyl Substances.
- Bremner JD, Narayan M, Anderson ER, Staib LH, Miller HL, Charney DS, 2000. Hippocampal volume reduction in major depression. Am J Psychiatry 157, 115–117. 10.1176/AJP.157.1.115 [DOI] [PubMed] [Google Scholar]
- Brown-Leung JM, Cannon JR, 2022. Neurotransmission Targets of Per- and Polyfluoroalkyl Substance Neurotoxicity: Mechanisms and Potential Implications for Adverse Neurological Outcomes. Chem Res Toxicol 35, 1312–1333. 10.1021/ACS.CHEMRESTOX.2C00072 [DOI] [PMC free article] [PubMed] [Google Scholar]
- Busse D, Yim IS, Campos B, Marshburn CK, 2017. Discrimination and the HPA axis: current evidence and future directions. J Behav Med 40, 539–552. 10.1007/S10865-017-9830-6 [DOI] [PubMed] [Google Scholar]
- Canady RB, Stommel M, Holzman C, 2009. Measurement Properties of the Centers for Epidemiological Studies Depression Scale (CES-D) in a Sample of African American and Non-Hispanic White Pregnant Women. J Nurs Meas 17, 91–104. 10.1891/106-13749.17.2.91 [DOI] [PMC free article] [PubMed] [Google Scholar]
- Carpenter JS, Andrykowski MA, Wilson J, Hall LA, Rayens MK, Sachs B, Cunningham LLC, 1998. Psychometrics for two short forms of the Center for Epidemiologic Studies-Depression Scale. Issues Ment Health Nurs 19, 481–494. 10.1080/016128498248917 [DOI] [PubMed] [Google Scholar]
- Catabay CJ, Stockman JK, Campbell JC, Tsuyuki K, 2019. PERCEIVED STRESS AND MENTAL HEALTH: THE MEDIATING ROLES OF SOCIAL SUPPORT AND RESILIENCE AMONG BLACK WOMEN EXPOSED TO SEXUAL VIOLENCE. J Affect Disord 259, 143. 10.1016/J.JAD.2019.08.037 [DOI] [PMC free article] [PubMed] [Google Scholar]
- Chand SP, Arif H, 2023. Depression. StatPearls. [Google Scholar]
- Chen H, Chen L, Hao G, 2020. Exercise attenuates the association between household pesticide exposure and depressive symptoms: Evidence from NHANES, 2005–2014. Environ Res 188, 109760. 10.1016/J.ENVRES.2020.109760 [DOI] [PubMed] [Google Scholar]
- Chu B, Marwaha K, Sanvictores T, Ayers D, 2022. Physiology, Stress Reaction. StatPearls. [PubMed] [Google Scholar]
- Cohen S, Kamarck T, Mermelstein R, 1983. A global measure of perceived stress. J Health Soc Behav 24, 385–396. 10.2307/2136404 [DOI] [PubMed] [Google Scholar]
- Cole SR, Zivich PN, Edwards JK, Ross RK, Shook-Sa BE, Price JT, Stringer JSA, 2023. Missing Outcome Data in Epidemiologic Studies. Am J Epidemiol 192, 6. 10.1093/AJE/KWAC179 [DOI] [PMC free article] [PubMed] [Google Scholar]
- Coperchini F, Croce L, Ricci G, Magri F, Rotondi M, Imbriani M, Chiovato L, 2020. Thyroid Disrupting Effects of Old and New Generation PFAS. Front Endocrinol (Lausanne) 11. 10.3389/FENDO.2020.612320 [DOI] [PMC free article] [PubMed] [Google Scholar]
- Correia AS, Cardoso A, Vale N, 2023. Oxidative Stress in Depression: The Link with the Stress Response, Neuroinflammation, Serotonin, Neurogenesis and Synaptic Plasticity. Antioxidants 2023, Vol. 12, Page 470 12, 470. 10.3390/ANTIOX12020470 [DOI] [PMC free article] [PubMed] [Google Scholar]
- Cosco TD, Prina M, Stubbs B, Wu Y-T, 2017. Reliability and Validity of the Center for Epidemiologic Studies Depression Scale in a Population-Based Cohort of Middle-Aged U.S. Adults. J Nurs Meas 25, 476. 10.1891/1061-3749.25.3.476 [DOI] [PubMed] [Google Scholar]
- Derakhshan A, Kortenkamp A, Shu H, Broeren MAC, Lindh CH, Peeters RP, Bornehag C-G, Demeneix B, Korevaar TIM, 2022. Association of per- and polyfluoroalkyl substances with thyroid homeostasis during pregnancy in the SELMA study. Environ Int 167, 160–4120. 10.1016/j.envint.2022.107420 [DOI] [PubMed] [Google Scholar]
- Devick K, 2019. BKMR plot functions for multiply imputed data.
- Eick, Enright EA, Padula AM, Aung M, Geiger SD, Cushing L, Trowbridge J, Keil AP, Gee Baek H, Smith S, Park J-S, Demicco E, Schantz SL, Woodruff TJ, Morello-Frosch R, 2022. Prenatal PFAS and psychosocial stress exposures in relation to fetal growth in two pregnancy cohorts: Applying environmental mixture methods to chemical and non-chemical stressors HHS Public Access. Environ Int 163, 107238. 10.1016/j.envint.2022.107238 [DOI] [PMC free article] [PubMed] [Google Scholar]
- Eick SM, Barr DB, Brennan PA, Taibl KR, Tan Y, Robinson M, Kannan K, Panuwet P, Yakimavets V, Ryan PB, Liang D, Dunlop AL, 2023. Per- and polyfluoroalkyl substances and psychosocial stressors have a joint effect on adverse pregnancy outcomes in the Atlanta African American Maternal-Child cohort. Sci Total Environ 857. 10.1016/J.SCITOTENV.2022.159450 [DOI] [PMC free article] [PubMed] [Google Scholar]
- Eick SM, Goin DE, Cushing L, DeMicco E, Smith S, Park JS, Padula AM, Woodruff TJ, Morello-Frosch R, 2021. Joint effects of prenatal exposure to per- and poly-fluoroalkyl substances and psychosocial stressors on corticotropin-releasing hormone during pregnancy. Journal of Exposure Science & Environmental Epidemiology 2021 32:1 32, 27–36. 10.1038/s41370-021-00322-8 [DOI] [PMC free article] [PubMed] [Google Scholar]
- Fenton SE, Ducatman A, Boobis A, DeWitt JC, Lau C, Ng C, Smith JS, Roberts SM, 2021. Per- and Polyfluoroalkyl Substance Toxicity and Human Health Review: Current State of Knowledge and Strategies for Informing Future Research. Environ Toxicol Chem 40, 606. 10.1002/ETC.4890 [DOI] [PMC free article] [PubMed] [Google Scholar]
- Fogaça MV, Duman RS, 2019. Cortical GABAergic dysfunction in stress and depression: New insights for therapeutic interventions. Front Cell Neurosci 13, 448587. 10.3389/FNCEL.2019.00087/BIBTEX [DOI] [PMC free article] [PubMed] [Google Scholar]
- Foguth RM, Flynn RW, de Perre C, Iacchetta M, Lee LS, Sepúlveda MS, Cannon JR, 2019. Developmental exposure to perfluorooctane sulfonate (PFOS) and perfluorooctanoic acid (PFOA) selectively decreases brain dopamine levels in Northern leopard frogs. Toxicol Appl Pharmacol 377, 114623. 10.1016/J.TAAP.2019.114623 [DOI] [PubMed] [Google Scholar]
- Foguth RM, Hoskins TD, Clark GC, Nelson M, Flynn RW, de Perre C, Hoverman JT, Lee LS, Sepúlveda MS, Cannon JR, 2020. Single and mixture per- and polyfluoroalkyl substances accumulate in developing Northern leopard frog brains and produce complex neurotransmission alterations. Neurotoxicol Teratol 81. 10.1016/J.NTT.2020.106907 [DOI] [PubMed] [Google Scholar]
- Gaffey AE, Cavanagh CE, Rosman L, Wang K, Deng Y, Sims M, O’brien EC, Chamberlain AM, Mentz RJ, Glover LM, Burg MM, 2022. Depressive Symptoms and Incident Heart Failure in the Jackson Heart Study: Differential Risk Among Black Men and Women. J Am Heart Assoc 11, 22514. 10.1161/JAHA.121.022514 [DOI] [PMC free article] [PubMed] [Google Scholar]
- Gaum PM, Gube M, Esser A, Schettgen T, Quinete N, Bertram J, Putschögl FM, Kraus T, Lang J, 2019. Depressive Symptoms After PCB Exposure: Hypotheses for Underlying Pathomechanisms via the Thyroid and Dopamine System. Int J Environ Res Public Health 16. 10.3390/IJERPH16060950 [DOI] [PMC free article] [PubMed] [Google Scholar]
- Gaum PM, Gube M, Schettgen T, Putschögl FM, Kraus T, Fimm B, Lang J, 2017. Polychlorinated biphenyls and depression: cross-sectional and longitudinal investigation of a dopamine-related Neurochemical path in the German HELPcB surveillance program. Environmental Health 16. 10.1186/S12940-017-0316-3 [DOI] [PMC free article] [PubMed] [Google Scholar]
- Gillespie SL, Bose-Brill S, Giurgescu C, Gondwe KW, Nolan TS, Spurlock EJ, Christian LM, 2021. Racial Discrimination and Stress Across the Life Course: Associations With Prenatal Inflammation, Perceived Stress, and Depressive Symptoms. Nurs Res 70, S21–S30. 10.1097/NNR.0000000000000525 [DOI] [PMC free article] [PubMed] [Google Scholar]
- Grønnestad R, Johanson SM, Müller MHB, Schlenk D, Tanabe P, Krøkje Å, Jaspers VLB, Jenssen BM, Ræder EM, Lyche JL, Shi Q, Arukwe A, 2021. Effects of an environmentally relevant PFAS mixture on dopamine and steroid hormone levels in exposed mice. Toxicol Appl Pharmacol 428, 115670. 10.1016/J.TAAP.2021.115670 [DOI] [PubMed] [Google Scholar]
- Hage MP, Azar ST, 2012. The Link between Thyroid Function and Depression. J Thyroid Res 2012. 10.1155/2012/590648 [DOI] [PMC free article] [PubMed] [Google Scholar]
- Hamdan A, Tamim H, 2012. The relationship between postpartum depression and breastfeeding. Int J Psychiatry Med 43, 243–259. 10.2190/PM.43.3.D [DOI] [PubMed] [Google Scholar]
- Harris LK, Berry DC, Cortés YI, 2021. Psychosocial factors related to Cardiovascular Disease Risk in Young African American Women: a systematic review. https://doiorg.ezproxy.bu.edu/10.1080/13557858.2021.1990218 27, 1806–1824. 10.1080/13557858.2021.1990218 [DOI] [PMC free article] [PubMed] [Google Scholar]
- Holden KB, Bradford LD, Hall SP, Belton AS, 2013. Prevalence and Correlates of Depressive Symptoms and Resiliency among African American Women in a Community-Based Primary Health Care Center. J Health Care Poor Underserved 24, 79. 10.1353/HPU.2014.0012 [DOI] [PMC free article] [PubMed] [Google Scholar]
- Hornung RW, Reed LD, 1990. Estimation of Average Concentration in the Presence of Nondetectable Values. Appl Occup Environ Hyg 5, 46–51. 10.1080/1047322X.1990.10389587 [DOI] [Google Scholar]
- Hu L, Mei H, Cai X, Song L, Xu Q, Gao W, Zhang D, Zhou J, Sun C, Li Y, Xiang F, Wang Y, Zhou A, Xiao H, 2024. Prenatal exposure to poly- and perfluoroalkyl substances and postpartum depression in women with twin pregnancies. Int J Hyg Environ Health 256, 114324. 10.1016/J.IJHEH.2024.114324 [DOI] [PubMed] [Google Scholar]
- Inoue K, Ritz B, Andersen SL, Ramlau-Hansen CH, Høyer BB, Bech BH, Henriksen TB, Bonefeld-Jørgensen EC, Olsen J, Liew Z, 2019. Perfluoroalkyl Substances and Maternal Thyroid Hormones in Early Pregnancy; Findings in the Danish National Birth Cohort. Environ Health Perspect 127. 10.1289/EHP5482 [DOI] [PMC free article] [PubMed] [Google Scholar]
- Jiao X, Liu N, Xu Y, Qiao H, 2021. Perfluorononanoic acid impedes mouse oocyte maturation by inducing mitochondrial dysfunction and oxidative stress. Reprod Toxicol 104, 58–67. 10.1016/J.REPROTOX.2021.07.002 [DOI] [PMC free article] [PubMed] [Google Scholar]
- Johnson AJ, Urizar GG, Nwabuzor J, Dinh P, 2022. Racism, shame, and stress reactivity among young black women. Stress and Health 38, 1001–1013. 10.1002/SMI.3152 [DOI] [PMC free article] [PubMed] [Google Scholar]
- Kato K, Kalathil A, Patel A, Ye X, Calafat A, 2018. Per- and polyfluoroalkyl substances and fluorinated alternatives in urine and serum by on-line solid phase extraction-liquid chromatography-tandem mass spectrometry. Chemosphere 209, 338–345. 10.1016/J.CHEMOSPHERE.2018.06.085 [DOI] [PMC free article] [PubMed] [Google Scholar]
- Keller J, Gomez R, Williams G, Lembke A, Lazzeroni L, Murphy GM, Schatzberg AF, 2017. HPA Axis in Major Depression: Cortisol, Clinical Symptomatology, and Genetic Variation Predict Cognition. Mol Psychiatry 22, 527. 10.1038/MP.2016.120 [DOI] [PMC free article] [PubMed] [Google Scholar]
- Koh SB, Kim TH, Min S, Lee K, Kang DR, Choi JR, 2017. Exposure to pesticide as a risk factor for depression: A population-based longitudinal study in Korea. Neurotoxicology 62, 181–185. 10.1016/J.NEURO.2017.07.005 [DOI] [PubMed] [Google Scholar]
- Kohout FJ, Berkman LF, Evans DA, Cornoni-Huntley J, 1993. Two Shorter Forms of the CES-D Depression Symptoms Index. http://dx.doi.org/10.1177/089826439300500202 5, 179–193. 10.1177/089826439300500202 [DOI] [PubMed] [Google Scholar]
- Lebeaux RM, Doherty BT, Gallagher LG, Zoeller RT, Hoofnagle AN, Calafat AM, Karagas MR, Yolton K, Chen A, Lanphear BP, Braun JM, Romano ME, 2020. Maternal serum perfluoroalkyl substance mixtures and thyroid hormone concentrations in maternal and cord sera: The HOME Study. Environ Res 185. 10.1016/J.ENVRES.2020.109395 [DOI] [PMC free article] [PubMed] [Google Scholar]
- Lee B, Wang Y, Carlson SA, Greenlund KJ, Lu H, Liu Y, Croft JB, Eke PI, Town M, Thomas CW, 2023. National, State-Level, and County-Level Prevalence Estimates of Adults Aged ≥18 Years Self-Reporting a Lifetime Diagnosis of Depression — United States, 2020. MMWR Morb Mortal Wkly Rep 72, 644–650. 10.15585/MMWR.MM7224A1 [DOI] [PMC free article] [PubMed] [Google Scholar]
- Lee DB, Eisman AB, Stoddard SA, Peckins MK, Goldstick JE, Hsieh HF, Muñoz-Velázquez J, Zimmerman MA, 2018. Racial Discrimination and Cortisol in African American Emerging Adults: The Role of Neighborhood Racial Composition. Cultur Divers Ethnic Minor Psychol 24, 521. 10.1037/CDP0000217 [DOI] [PMC free article] [PubMed] [Google Scholar]
- Leonard KS, Evans MB, Kjerulff KH, Symons Downs D, 2020. Postpartum Perceived Stress Explains the Association between Perceived Social Support and Depressive Symptoms. Women’s Health Issues 30, 231–239. 10.1016/J.WHI.2020.05.001 [DOI] [PMC free article] [PubMed] [Google Scholar]
- Li P, Wang H, Feng J, Chen G, Zhou Z, Gou X, Ye S, Fan D, Liu Z, Guo X, 2021. Association Between Perceived Stress and Prenatal Depressive Symptoms: Moderating Effect of Social Support. J Multidiscip Healthc 14, 3195. 10.2147/JMDH.S341090 [DOI] [PMC free article] [PubMed] [Google Scholar]
- Li Z, Liu Q, Liu C, Li C, Li Y, Li S, Liu X, Shao J, 2017. Evaluation of PFOS-mediated neurotoxicity in rat primary neurons and astrocytes cultured separately or in co-culture. Toxicol In Vitro 38, 77–90. 10.1016/J.TIV.2016.11.002 [DOI] [PubMed] [Google Scholar]
- Long Y, Wang Y, Ji G, Yan L, Hu F, Gu A, 2013. Neurotoxicity of perfluorooctane sulfonate to hippocampal cells in adult mice. PLoS One 8. 10.1371/JOURNAL.PONE.0054176 [DOI] [PMC free article] [PubMed] [Google Scholar]
- López-Doval S, Salgado R, Fernández-Pérez B, Lafuente A, 2015. Possible role of serotonin and neuropeptide Y on the disruption of the reproductive axis activity by perfluorooctane sulfonate. Toxicol Lett 233, 138–147. 10.1016/J.TOXLET.2015.01.012 [DOI] [PubMed] [Google Scholar]
- Madley-Dowd P, Hughes R, Tilling K, Heron J, 2019. The proportion of missing data should not be used to guide decisions on multiple imputation. J Clin Epidemiol 110, 63. 10.1016/J.JCLINEPI.2019.02.016 [DOI] [PMC free article] [PubMed] [Google Scholar]
- Makambi KH, Williams CD, Taylor TR, Rosenberg L, Adams-Campbell LL, 2009a. An assessment of the CES-D scale factor structure in black women: The Black Women’s Health Study. Psychiatry Res 168, 163. 10.1016/J.PSYCHRES.2008.04.022 [DOI] [PMC free article] [PubMed] [Google Scholar]
- Makambi KH, Williams CD, Taylor TR, Rosenberg L, Adams-Campbell LL, 2009b. An assessment of the CES-D scale factor structure in black women: The Black Women’s Health Study. Psychiatry Res 168, 163. 10.1016/J.PSYCHRES.2008.04.022 [DOI] [PMC free article] [PubMed] [Google Scholar]
- Martin CL, Ghastine L, Wegienka G, Wise LA, Baird DD, Vines AI, 2023. Early Life Disadvantage and the Risk of Depressive Symptoms among Young Black Women. J Racial Ethn Health Disparities. 10.1007/S40615-023-01654-X [DOI] [PMC free article] [PubMed] [Google Scholar]
- Mayberg HS, Liotti M, Brannan SK, McGinnis S, Mahurin RK, Jerabek PA, Silva JA, Tekell JL, Martin CC, Lancaster JL, Fox PT, 1999. Reciprocal limbic-cortical function and negative mood: converging PET findings in depression and normal sadness. Am J Psychiatry 156, 245–253. 10.1176/AJP.156.5.675 [DOI] [PubMed] [Google Scholar]
- Merrill AK, Conrad K, Marvin E, Sobolewski M, 2022. Effects of gestational low dose perfluorooctanoic acid on maternal and “anxiety-like” behavior in dams. Frontiers in Toxicology 4, 971970. 10.3389/FTOX.2022.971970/BIBTEX [DOI] [PMC free article] [PubMed] [Google Scholar]
- Morin AK, 2015. Triiodothyronine (T3) supplementation in major depressive disorder. Mental Health Clinician 5, 253–259. 10.9740/MHC.2015.11.253 [DOI] [Google Scholar]
- Mshaty A, Haijima A, Takatsuru Y, Ninomiya A, Yajima H, Kokubo M, Khairinisa MA, Miyazaki W, Amano I, Koibuchi N, 2020. Neurotoxic effects of lactational exposure to perfluorooctane sulfonate on learning and memory in adult male mouse. Food and Chemical Toxicology 145, 111710. 10.1016/J.FCT.2020.111710 [DOI] [PubMed] [Google Scholar]
- Mutic AD, Barr DB, Hertzberg VS, Brennan PA, Dunlop AL, McCauley LA, 2021. Polybrominated diphenyl ether serum concentrations and depressive symptomatology in pregnant African American women. Int J Environ Res Public Health 18. 10.3390/IJERPH18073614/S1 [DOI] [PMC free article] [PubMed] [Google Scholar]
- Nam S, Jeon S, Lee SJ, Ash G, Nelson LRE, Granger DA, 2022. Real-time racial discrimination, affective states, salivary cortisol and alpha-amylase in Black adults. PLoS One 17, e0273081. 10.1371/JOURNAL.PONE.0273081 [DOI] [PMC free article] [PubMed] [Google Scholar]
- Nelson T, Shahid NN, Cardemil EV, 2020. Do I Really Need to Go and See Somebody? Black Women’s Perceptions of Help-Seeking for Depression. https://doi.org/10.1177/0095798420931644 46, 263–286. 10.1177/0095798420931644 [DOI] [Google Scholar]
- Nuguru SP, Rachakonda S, Sripathi S, Khan MI, Patel N, Meda RT, 2022. Hypothyroidism and Depression: A Narrative Review. Cureus 14. 10.7759/CUREUS.28201 [DOI] [PMC free article] [PubMed] [Google Scholar]
- Odawara S, Shimbo T, Yamauchi T, Kobayashi D, 2023. Association of Low-Normal Free T4 Levels With Future Major Depression Development. J Endocr Soc 7. 10.1210/JENDSO/BVAD096 [DOI] [PMC free article] [PubMed] [Google Scholar]
- Ojo AF, Xia Q, Peng C, Ng JC, 2021. Evaluation of the individual and combined toxicity of perfluoroalkyl substances to human liver cells using biomarkers of oxidative stress. Chemosphere 281. 10.1016/J.CHEMOSPHERE.2021.130808 [DOI] [PubMed] [Google Scholar]
- Omoike OE, Pack RP, Mamudu HM, Liu Y, Strasser S, Zheng S, Okoro J, Wang L, 2021. Association between per and polyfluoroalkyl substances and markers of inflammation and oxidative stress. Environ Res 196, 110361. 10.1016/J.ENVRES.2020.110361 [DOI] [PubMed] [Google Scholar]
- Onaolapo AY, Onaolapo OJ, 2021. Glutamate and depression: Reflecting a deepening knowledge of the gut and brain effects of a ubiquitous molecule. World J Psychiatry 11, 297. 10.5498/WJP.V11.I7.297 [DOI] [PMC free article] [PubMed] [Google Scholar]
- Otte C, Gold SM, Penninx BW, Pariante CM, Etkin A, Fava M, Mohr DC, Schatzberg AF, 2016. Major depressive disorder. Nat Rev Dis Primers 2. 10.1038/NRDP.2016.65 [DOI] [PubMed] [Google Scholar]
- Pandya M, Altinay M, Malone DA, Anand A, 2012. Where in the Brain Is Depression? Curr Psychiatry Rep 14, 634. 10.1007/S11920-012-0322-7 [DOI] [PMC free article] [PubMed] [Google Scholar]
- Park EY, 2021. Factor Structure of the Short-Form of Center for Epidemiological Studies Depression Scale for People With Physical Disabilities. Front Psychiatry 12, 536499. 10.3389/FPSYT.2021.536499/BIBTEX [DOI] [PMC free article] [PubMed] [Google Scholar]
- Patel OP, Quist A, Martin CL, Wegienka G, Baird DD, Wise LA, Vines AI, 2023. Life-Course Mobility in Socioeconomic Position and High Depressive Symptoms Among Young Black Women: The SELF Study. Womens Health Issues 33, 266–272. 10.1016/J.WHI.2022.11.010 [DOI] [PMC free article] [PubMed] [Google Scholar]
- Peltier MR, Fassett MJ, Arita Y, Chiu VY, Takhar HS, Getahun D, 2021. Exposure to polybrominated diphenyl ether-47 increases the risk of post-partum depression. https://doiorg.ezproxy.bu.edu/10.1080/14767058.2021.1974386 35, 8350–8354. 10.1080/14767058.2021.1974386 [DOI] [PubMed] [Google Scholar]
- Pope CJ, Mazmanian D, 2016. Breastfeeding and Postpartum Depression: An Overview and Methodological Recommendations for Future Research. Depress Res Treat 2016. 10.1155/2016/4765310 [DOI] [PMC free article] [PubMed] [Google Scholar]
- Preston EV, Webster TF, Claus Henn B, McClean MD, Gennings C, Oken E, Rifas-Shiman SL, Pearce EN, Calafat AM, Fleisch AF, Sagiv SK, 2020. Prenatal exposure to per- and polyfluoroalkyl substances and maternal and neonatal thyroid function in the Project Viva Cohort: A mixtures approach. Environ Int 139. 10.1016/J.ENVINT.2020.105728 [DOI] [PMC free article] [PubMed] [Google Scholar]
- Preston EV, Webster TF, Oken E, Henn BC, McClean MD, Rifas-Shiman SL, Pearce EN, Braverman LE, Calafat AM, Ye X, Sagiv SK, 2018. Maternal Plasma per- and Polyfluoroalkyl Substance Concentrations in Early Pregnancy and Maternal and Neonatal Thyroid Function in a Prospective Birth Cohort: Project Viva (USA). Environ Health Perspect 126. 10.1289/EHP2534 [DOI] [PMC free article] [PubMed] [Google Scholar]
- Price JL, Drevets WC, 2010. Neurocircuitry of Mood Disorders. Neuropsychopharmacology 35, 192. 10.1038/NPP.2009.104 [DOI] [PMC free article] [PubMed] [Google Scholar]
- Qian Y, Ducatman A, Ward R, Leonard S, Bukowski V, Guo NL, Shi X, Vallyathan V, Castranova V, 2010. Perfluorooctane sulfonate (PFOS) induces reactive oxygen species (ROS) production in human microvascular endothelial cells: role in endothelial permeability. J Toxicol Environ Health A 73, 819–836. 10.1080/15287391003689317 [DOI] [PMC free article] [PubMed] [Google Scholar]
- Qu Z, Tian D, Zhang Q, Wang X, He H, Zhang X, Huang L, Xu F, 2012. The impact of the catastrophic earthquake in China’s Sichuan province on the mental health of pregnant women. J Affect Disord 136, 117–123. 10.1016/J.JAD.2011.08.021 [DOI] [PubMed] [Google Scholar]
- Quist AJL, Han X, Baird DD, Wise LA, Wegienka G, Woods-Giscombe CL, Vines AI, 2022a. Life Course Racism and Depressive Symptoms among Young Black Women. J Urban Health 99, 55–66. 10.1007/S11524-021-00574-7 [DOI] [PMC free article] [PubMed] [Google Scholar]
- Quist AJL, Han X, Baird DD, Wise LA, Wegienka G, Woods-Giscombe CL, Vines AI, 2022b. Life Course Racism and Depressive Symptoms among Young Black Women. J Urban Health 99, 55. 10.1007/S11524-021-00574-7 [DOI] [PMC free article] [PubMed] [Google Scholar]
- Radloff LS, 1977. The CES-D Scale: A Self-Report Depression Scale for Research in the General Population. Appl Psychol Meas 1, 385–401. 10.1177/014662167700100306 [DOI] [Google Scholar]
- Reardon AJF, Khodayari Moez E, Dinu I, Goruk S, Field CJ, Kinniburgh DW, MacDonald AM, Martin JW, 2019. Longitudinal analysis reveals early-pregnancy associations between perfluoroalkyl sulfonates and thyroid hormone status in a Canadian prospective birth cohort. Environ Int 129, 389–399. 10.1016/J.ENVINT.2019.04.023 [DOI] [PMC free article] [PubMed] [Google Scholar]
- Reistad T, Fonnum F, Mariussen E, 2013. Perfluoroalkylated compounds induce cell death and formation of reactive oxygen species in cultured cerebellar granule cells. Toxicol Lett 218, 56–60. 10.1016/J.TOXLET.2013.01.006 [DOI] [PubMed] [Google Scholar]
- Rubin DB, 2004. Multiple imputation for nonresponse in surveys. Wiley. [Google Scholar]
- Russell G, Lightman S, 2019. The human stress response. Nat Rev Endocrinol 15, 525–534. 10.1038/S41574-019-0228-0 [DOI] [PubMed] [Google Scholar]
- Salgado R, López-Doval S, Pereiro N, Lafuente A, 2016. Perfluorooctane sulfonate (PFOS) exposure could modify the dopaminergic system in several limbic brain regions. Toxicol Lett 240, 226–235. 10.1016/J.TOXLET.2015.10.023 [DOI] [PubMed] [Google Scholar]
- Salgado R, Pereiro N, López-Doval S, Lafuente A, 2015. Initial study on the possible mechanisms involved in the effects of high doses of perfluorooctane sulfonate (PFOS) on prolactin secretion. Food and Chemical Toxicology 83, 10–16. 10.1016/J.FCT.2015.05.013 [DOI] [PubMed] [Google Scholar]
- Schildroth S, Wise LA, Wesselink AK, D. La Cruz P, Bethea TN, Weuve J, Fruh V, Botelho JC, Sjodin A, Calafat AM, Baird DD, Henn BC, 2021. Correlates of Persistent Endocrine-Disrupting Chemical Mixtures among Reproductive-Aged Black Women. Environ Sci Technol 55, 14000–14014. 10.1021/ACS.EST.1C02549 [DOI] [PMC free article] [PubMed] [Google Scholar]
- Selvaraj R, Selvamani TY, Zahra A, Malla J, Dhanoa RK, Venugopal S, Shoukrie SI, Hamouda RK, Hamid P, 2022. Association Between Dietary Habits and Depression: A Systematic Review. Cureus 14. 10.7759/CUREUS.32359 [DOI] [PMC free article] [PubMed] [Google Scholar]
- Sharp LK, Kimmel LG, Kee R, Saltoun C, Chang CH, 2007. Assessing the Perceived Stress Scale for African American adults with asthma and low literacy. J Asthma 44, 311–316. 10.1080/02770900701344165 [DOI] [PubMed] [Google Scholar]
- Suglia SF, Staudenmayer J, Cohen S, Enlow MB, Rich-Edwards JW, Wright RJ, 2010. Cumulative Stress and Cortisol Disruption among Black and Hispanic Pregnant Women in an Urban Cohort. Psychol Trauma 2, 326. 10.1037/A0018953 [DOI] [PMC free article] [PubMed] [Google Scholar]
- Sun X, Yang X, Zhang Y, Liu Y, Xiao F, Guo H, Liu X, 2024. Correlation analysis between perfluoroalkyl and poly-fluoroalkyl substances exposure and depressive symptoms in adults: NHANES 2005–2018. Science of The Total Environment 906, 167639. 10.1016/J.SCITOTENV.2023.167639 [DOI] [PubMed] [Google Scholar]
- Taibl KR, Schantz S, Aung MT, Padula A, Geiger S, Smith S, Park JS, Milne GL, Robinson JF, Woodruff TJ, Morello-Frosch R, Eick SM, 2022. Associations of per- and polyfluoroalkyl substances (PFAS) and their mixture with oxidative stress biomarkers during pregnancy. Environ Int 169, 107541. 10.1016/J.ENVINT.2022.107541 [DOI] [PMC free article] [PubMed] [Google Scholar]
- Tan Y, Taibl KR, Dunlop AL, Barr DB, Panuwet P, Yakimavets V, Kannan K, Corwin EJ, Ryan PB, Eatman JA, Liang D, Eick SM, 2023. Association between a Mixture of Per- and Polyfluoroalkyl Substances (PFAS) and Inflammatory Biomarkers in the Atlanta African American Maternal-Child Cohort. Environ Sci Technol 57, 13419–13428. 10.1021/ACS.EST.3C04688 [DOI] [PMC free article] [PubMed] [Google Scholar]
- Torres E, 2012. Psychometric Properties of the Center for Epidemiologic Studies Depression Scale in African-American and Black Caribbean Adults. Issues Ment Health Nurs 33, 687. 10.3109/01612840.2012.697534 [DOI] [PMC free article] [PubMed] [Google Scholar]
- Tukker AM, Bouwman LMS, van Kleef RGDM, Hendriks HS, Legler J, Westerink RHS, 2020. Perfluorooctane sulfonate (PFOS) and perfluorooctanoate (PFOA) acutely affect human α1β2γ2L GABAA receptor and spontaneous neuronal network function in vitro. Scientific Reports 2020 10:1 10, 1–14. 10.1038/s41598-020-62152-2 [DOI] [PMC free article] [PubMed] [Google Scholar]
- U.S. CDC, 2023. Fourth National Report on Human Exposure to Environmental Chemicals. [PubMed]
- Valeri L, Mazumdar MM, Bobb JF, Henn BC, Rodrigues E, Sharif OIA, Kile ML, Quamruzzaman Q, Afroz S, Golam M, Amarasiriwardena C, Bellinger DC, Christiani DC, Coull BA, Wright RO, 2017. The joint effect of prenatal exposure to metal mixtures on neurodevelopmental outcomes at 20–40 months of age: Evidence from rural Bangladesh. Environ Health Perspect 125. 10.1289/EHP614 [DOI] [PMC free article] [PubMed] [Google Scholar]
- Varghese FP, Brown ES, 2001. The Hypothalamic-Pituitary-Adrenal Axis in Major Depressive Disorder: A Brief Primer for Primary Care Physicians. Prim Care Companion J Clin Psychiatry 3, 151. 10.4088/PCC.V03N0401 [DOI] [PMC free article] [PubMed] [Google Scholar]
- Vuong AM, Yolton K, Braun JM, Sjodin A, Calafat AM, Xu Y, Dietrich KN, Lanphear BP, Chen A, 2020. Polybrominated diphenyl ether (PBDE) and poly- and perfluoroalkyl substance (PFAS) exposures during pregnancy and maternal depression. Environ Int 139, 105694. 10.1016/J.ENVINT.2020.105694 [DOI] [PMC free article] [PubMed] [Google Scholar]
- Wang H, Ren T, Zhang N, Xia W, Xiang M, Ran J, Zhang J, 2023. Poly- and perfluoroalkyl substances exposure during pregnancy and postpartum depression: Evidence from the Shanghai birth cohort. Chemosphere 318. 10.1016/J.CHEMOSPHERE.2023.137941 [DOI] [PubMed] [Google Scholar]
- Wang X, Li B, Zhao WD, Liu YJ, Shang DS, Fang WG, Chen YH, 2011. Perfluorooctane sulfonate triggers tight junction “opening” in brain endothelial cells via phosphatidylinositol 3-kinase. Biochem Biophys Res Commun 410, 258–263. 10.1016/J.BBRC.2011.05.128 [DOI] [PubMed] [Google Scholar]
- Wang Y, Starling AP, Haug LS, Eggesbo M, Becher G, Thomsen C, Travlos G, King D, Hoppin JA, Rogan WJ, Longnecker MP, 2013. Association between Perfluoroalkyl substances and thyroid stimulating hormone among pregnant women: A cross-sectional study. Environ Health 12, 1–7. 10.1186/1476-069X-12-76/FIGURES/1 [DOI] [PMC free article] [PubMed] [Google Scholar]
- Williams DR, González HM, Neighbors H, Nesse R, Abelson JM, Sweetman J, Jackson JS, 2007. Prevalence and Distribution of Major Depressive Disorder in African Americans, Caribbean Blacks, and Non-Hispanic Whites: Results From the National Survey of American Life. Arch Gen Psychiatry 64, 305–315. 10.1001/ARCHPSYC.64.3.305 [DOI] [PubMed] [Google Scholar]
- Wise LA, 2015. Study of Environment Lifestyle and Fibroids (SELF): Advancing the Field of Fibroid Epidemiology, Journal of Women’s Health. Mary Ann Liebert Inc. 10.1089/jwh.2015.5526 [DOI] [PMC free article] [PubMed] [Google Scholar]
- Wise LA, Wesselink AK, Schildroth S, Calafat AM, Bethea TN, Geller RJ, Coleman CM, Fruh V, Henn BC, Botelho JC, Harmon QE, Thirkill M, Wegienka GR, Baird DD, 2021. Correlates of plasma concentrations of per- and poly-fluoroalkyl substances among reproductive-aged Black women. Environ Res 203. 10.1016/J.ENVRES.2021.111860 [DOI] [PMC free article] [PubMed] [Google Scholar]
- Woods-Giscombe C, Robinson MN, Carthon D, Devane-Johnson S, Corbie-Smith G, 2016. Superwoman Schema, Stigma, Spirituality, and Culturally Sensitive Providers: Factors Influencing African American Women’s Use of Mental Health Services. J Best Pract Health Prof Divers 9, 1124. [PMC free article] [PubMed] [Google Scholar]
- Xiao C, Grandjean P, Valvi D, Nielsen F, Jensen TK, Weihe P, Oulhote Y, 2020. Associations of Exposure to Perfluoroalkyl Substances With Thyroid Hormone Concentrations and Birth Size. J Clin Endocrinol Metab 105, 735–745. 10.1210/CLINEM/DGZ147 [DOI] [PMC free article] [PubMed] [Google Scholar]
- Yi W, Xuan L, Zakaly HMH, Markovic V, Miszczyk J, Guan H, Zhou P-K, Huang R, 2023. Association between per- and polyfluoroalkyl substances (PFAS) and depression in U.S. adults: A cross-sectional study of NHANES from 2005 to 2018. Environ Res 117188. 10.1016/J.ENVRES.2023.117188 [DOI] [PubMed] [Google Scholar]
- Yland JJ, Wesselink AK, Lash TL, Fox MP, 2022. Misconceptions About the Direction of Bias From Nondifferential Misclassification. Am J Epidemiol 191, 1485–1495. 10.1093/AJE/KWAC035 [DOI] [PMC free article] [PubMed] [Google Scholar]
- Yu N, Wei S, Li M, Yang J, Li K, Jin L, Xie Y, Giesy JP, Zhang X, Yu H, 2016. Effects of Perfluorooctanoic Acid on Metabolic Profiles in Brain and Liver of Mouse Revealed by a Highthroughput Targeted Metabolomics Approach. Scientific Reports 2016 6:1 6, 1–10. 10.1038/srep23963 [DOI] [PMC free article] [PubMed] [Google Scholar]
- Yu Y, Wang C, Zhang X, Zhu J, Wang L, Ji M, Zhang Z, Ji XM, Wang SL, 2020. Perfluorooctane sulfonate disrupts the blood brain barrier through the crosstalk between endothelial cells and astrocytes in mice. Environmental Pollution 256, 113429. 10.1016/J.ENVPOL.2019.113429 [DOI] [PubMed] [Google Scholar]
- Zhang FF, Peng W, Sweeney JA, Jia ZY, Gong QY, 2018. Brain structure alterations in depression: Psychoradiological evidence. CNS Neurosci Ther 24, 994. 10.1111/CNS.12835 [DOI] [PMC free article] [PubMed] [Google Scholar]
- Zhang L, Liang J, Gao A, 2023. Contact to perfluoroalkyl substances and thyroid health effects: A meta-analysis directing on pregnancy. Chemosphere 315, 137748. 10.1016/J.CHEMOSPHERE.2023.137748 [DOI] [PubMed] [Google Scholar]
- Zhou X-H, Eckert GJ, Tierney WM, 2001. Multiple imputation in public health research. Stat Med 20, 1541–1549. 10.1002/sim.689 [DOI] [PubMed] [Google Scholar]
Associated Data
This section collects any data citations, data availability statements, or supplementary materials included in this article.