

Abstract
Metabolism of dietary fibres by colon microbiota plays an important role for human health. Personal data from a nutrition study (57 subjects) were analysed to elucidate quantitative associations between the diet, faecal microbiome, organic acid concentrations and pH. Ratios of the predominant acids acetate, butyrate and propionate ranged from 1:0.67:0.27 to 1:0.17:0.36. Pectin-rich diets resulted in higher faecal acetate concentrations. Negative correlation between faecal pH and BSS was observed. Higher faecal pH and lower acid concentrations were related to the higher abundance of amino acid degrading Clostridium, Odoribacter and Eubacterium coprostanoligenes, which are weak carbohydrate fermenting taxa. Propionic acid correlated especially to high abundance of Prevotella and low abundance of proteobacteria. The acetate to propionate ratio of the Prevotella enterotype was about half of that of the Bacteroides enterotype. Based on the results we suggest the measurement of faecal pH and organic acid composition for research and diagnostic purposes.
Keywords: Gut microbiota, Food diary, Faecal pH, Short chain fatty acids (SCFA), Enterotypes
Graphical abstract

Highlights
-
•
Prevotella enterotype associated with higher faecal propionate concentration and acidic pH.
-
•
Lower faecal pH associated with higher Bristol Stool Score (softer stool).
-
•
Higher faecal pH was related to the higher abundances of Clostridium and Odoribacter.
-
•
Pectin-rich diets supported acetate production by colon microbiota.
1. Introduction
Every organ system of the human body relies on pH balance, however, the renal and the pulmonary systems are the two main pH modulators of the organism. The pulmonary system adjusts pH using carbon dioxide, upon expiration, carbon dioxide is projected into the environment. The renal system affects pH by reabsorbing bicarbonate and excreting fixed acids. Usually the body maintains the pH of blood close to 7.40 [1].
Gastrointestinal tract (GIT) is an organ, separated from blood and lymph circulations by gut epithelial cells and mucus layer, hence, its pH is not tightly controlled by the systems described above. Nevertheless, it is a dynamic environment in which microorganisms interact with the host via their metabolites. Among them, the most important metabolites are fermentation products such as organic acids. These weak acids having pKa 3.9–4.8 are present as organic anions in the gut lumen. The concentration of these anions is negatively correlated with faecal pH [2]. Intestinal pH indicates the acid-alkali balance and metabolic activities of the colon bacteria, which play important role for human health. The main weak acid in the colon is acetic acid, which normally ranges from 40 to 80 mmol/kg faeces followed by propionate (10–20 mmol/kg) and butyrate (5–15 mmol/kg) [[2], [3], [4]]. These bacterial fermentation products are important energy sources for epithelial or other human cells, regulating gut motility, signalling receptors for controlling hormone synthesis, anticancer or anti-inflammatory processes. As small molecules circulate in the blood bacterial products reach tissues and organs outside of the gut having general effect of human physiology, including gut-brain axis [[5], [6], [7]].
Gastrointestinal pH can be measured using a pH sensitive radiotelemetry capsule passing through the GIT [8]. Based on the review of Nugent et al., the luminal pH in the proximal small bowel ranges from 5.5 to 7.0 and gradually rises to 6.5–7.5 in the distal ileum [9]. After a fall from the terminal ileum to the caecum (range 5.7–6.8) pH then rises in the left colon and rectum to 6.1–7.2.
Data on the quantitative relationships of the diet, faecal microbiome, organic acids, pH and human health are scarce. A recent study [4] showed that pH was associated with the abundances of mucin-degraders Akkermansia and Ruminococcaceae, while inversely associated with several butyrate-producers such as Faecalibacterium, Roseburia, Butyriciococcus. In a study of LaBouyer et al. [10] the individual variations of faecal organic acids, pH (in five studies) and colon microbiota of 163 subjects from ten human studies were followed. In the baseline samples on habitual diet, the amount of faecal butyrate correlated positively with the total amount of short-chain fatty acids, whilst opposite was seen for acetate, iso-butyrate and iso-valerate. It was found that relative abundances of the butyrate-producing species Roseburia and Eubacterium rectale correlated with the amount of butyrate.
Ammonia is formed in metabolism of proteins, amino acids, and particularly urea by colon bacteria. The influence of ammonia on colonic pH is thought to be smaller than that of bicarbonate and organic acids. Diet has an impact on the luminal pH through its effects on organic acid production.
The production of acidic metabolites and the prevalence of the fermentative microbiota depend on the pH and available substrates, whilst details on bacterial metabolic interactions are largely unknown. In vitro experiments of Ilhan et al. [11] showed that pH was the strongest driver of microbial community structure and function. The structure of the microbiota was controlled by the pH that was determined by the balance between bicarbonate alkalinity and formation of organic acids. Walker et al. [12] showed that butyrate production by faecal microbiota was more enhanced at pH 5.5 compared to that at pH 6.5. At pH 6.5 growth enhancement of Bacteroides species along with increasing propionate production was observed. Higher abundance of butyric acid producers was observed in batch cultures of faecal microbiota at pH 5.5 on various dietary fibres [13]. Favoured growth of a butyric acid producer Faecalibacterium below pH 6 and Bacteroides above pH 6.5 have been shown in continuous cultures simulating the gastrointestinal environment [14,15]. These results underscore the impact of pH on microbial function in diverse microbial ecosystems such as human gut. The aim of the current study was to find quantitative relationships between diet, faecal pH, organic acids, Bristol stool score, and faecal microbiota at individual level. Our focus was to find associations between faecal pH, specific bacterial metabolites and specific gut bacteria. These metabolites can be formed only in the presence of fibre degrading and metabolizing taxa and available substrates under supporting environmental conditions including pH.
2. Materials and methods
2.1. Study design
In the current paper, the diet and microbiota data from a previously published human study [16] were re-analysed and correlated with the values of measured faecal pH and organic acids. The nutrition study was carried out with 57 healthy volunteers (36 females and 21 males) aged from 23 to 52 years. The participants did not have food restrictions, any kind of food intolerance, extremes in food consumption practices nor chronic illnesses. They continued their habitual diet and filled detailed food dairies three days before providing blood and faecal samples. The amples were collected and analysed as shown in Adamberg et al. [16]. The study was approved by the Tallinn Medical Research Ethics Committee (TMEK No 1631). All participants signed written informed consent forms before the study.
2.2. Faecal sampling, analyses of pH and organic acids
Faecal samples were self-collected by the participants in two consecutive occasions within each sampling period. One to 2 g of faecal samples were taken immediately after defecation by an integrated scoop into a collection tube (Sarstedt, Germany). The tube was kept at −20 °C until frozen transportation to the lab, maximum two days. In the lab, the samples were stored at −80 °C until further analyses.
For pH and organic acid analyses, the faecal sample was diluted five times with deionized water. The faecal suspension was mixed vigorously and centrifuged at 10 000 g 10 min to remove the undissolved particles. pH of the supernatant was measured at room temperature using a pH-meter (Mettler Toledo, MP125, Switzerland), electrode InLab Pro (Mettler Toledo, Switzerland, calibrated by pH buffers 4.01 and 7).
Concentrations of organic acids were determined from the faecal supernatant filtered through AmiconR Ultra-3K filters (cut-off 3 kDa) according to the manufacturer's instructions (Millipore, USA) at 4 °C. The samples were analysed by high-performance liquid chromatography (HPLC, Alliance 2795 system, Waters, Milford, MA, USA), using BioRad HPX-87H column (Hercules, CA, USA) with isocratic elution of 0.005 M H2SO4 at a flow rate of 0.5 mL/min and at 35 °C. The substances were quantified by refractive index (RI) (model 2414; Waters, USA) and UV (210 nm; model 2487; Waters, USA) detectors and analytical grade standards of acetate, butyrate, formate, isobutyrate, isovalerate, lactate, propionate, succinate and valerate. The detection limit for the HPLC method was 0.1 mM.
2.3. Microbiota analyses
Bacterial profiles in faeces were measured using PureLink Microbiome DNA extraction kit (Thermo Fisher Scientific, UK) for DNA extraction, which includes a bead beating step. Universal primers: S-D-Bact-0341-b-S-17 Forward (5′ TCGTCGGCAGCGTCAGATGTGTATAAGAGACAGCCTACGGGNGGCWGCAG) and S-D-Bact-0785-a-A-21 Reverse (5′ GTCTCGTGGGCTCGGAGATGTGTATAAGAGACAGGACTACHVGGGTATCTAATCC) were used for PCR amplification of the V3–V4 hypervariable regions of the 16S rRNA genes. Sequencing libraries were prepared with Nextera XT DNA Library Preparation Kit v2 (Illumina). Prepared libraries were quantified using Qubit™ dsDNA HS Assay Kit (quantitation range 0.2–100 ng; Thermo Fisher Scientific). If the DNA quantity turned out to be too high, the sample was diluted and re-measurement was performed with Qubit™ dsDNA BR Assay Kit (quantitation range 2–1000 ng; Thermo Fisher Scientific, UK). Illumina MiSeq 2 × 250 v2 platform (Illumina) for sequencing of 16S rDNA region V3–V4 as described previously [16].
2.4. Data processing and statistical analyses
This study focuses on personal level relationships between faecal pH and organic acids, and between the diet and faecal microbiota composition. To elucidate the diet-microbiome relationships, the microbiota data of each faecal sample was correlated with the corresponding food consumption data considering the transit time. In general, looser stool is related to a shorter transit and vice versa [17]. Hence, the transit time was evaluated according to the reported Bristol stool score (BSS), and the diet was compared to the faecal microbiota composition. For example, harder stools (BSS <3) were matched with the foods three days earlier, those having BSS between 3 and 5, with the foods two days earlier and the stools with BSS above 5 (loose stools) with those eaten on the previous day.
The food consumption data was recorded by Nutridata program (Version 7, tap.nutridata.ee, National Institute for the Health Development, Estonia) as shown in Adamberg et al. [16]. The foods were quantified as grams per day for every participant. The nutrition data was re-analysed using weight in grams of a food products consumed per day instead of normalized caloric values (kcal of food per 1000 kcal). All foods were categorised into 15 main groups based on the dietary fibre composition and/or the food type (berries, fruits, fats/oils, nuts/seeds, sauces, sweets, vegetables; dairy, egg, fish, meat, refined grain and whole grain cereal products; alcoholic and non-alcoholic drinks). Further, the main food groups were divided into 47 sub-groups as shown in Supplementary Table S1. Very general and heterogeneous groups such as porridge cereals or dried fruits were avoided. Instead, the food groups were reformed based on the content of the microbiota accessible substrates. In cereal products the type of dietary fibres such as beta-glucans in oat and barley or arabinoxylans in rye and wheat were considered. Foods containing polyols or lactose, formed separate groups. The meals or food products containing several components with different fibre types, were divided into primary components. For calculation of consumption pattern amounts of dietary fibre in food groups per day were calculated. For foods not containing dietary fibres (dairy, meat, eggs and drinks), the portion sizes providing above 50 kcal per day (as 1 unit) were taken into calculations.
Four faecal samples were collected from each participant in a period from April to September. To minimize loss of seasonal peculiarities of the food choices, for example the peak time of strawberry consumption in June–July, the samples were analysed in three seasonal periods: taken in April–May, June–July and August–September. Each seasonal period represented a single sampling point per participant.
To find relationships between the diet, faecal pH, organic acids, and bacterial composition, correlation and group-based statistics was applied. For group-based analyses, all samples were divided into three terciles according to their pH and organic acid concentrations (subgroup indicator “low” or “high” represents the values of pH or acid concentrations lower than 33 or higher than 67 percentile). The samples were then compared between seasonal periods as described above. Statistical significance between the groups was calculated using unpaired Wilcoxon test. Results were considered significant at p-value <0.05. The ranges of pH in the pH groups were “low” (pH < 7), medium (pH 7–7.5) and „high“ (pH > 7.5). The ranges of “low” and “high” in the acetate (Ace) groups 10–31 and 49–92 mmol/kg, respectively, in the butyrate (But) groups 1.9–8.6 and 14–33 mmol/kg, respectively, and in the propionate (Prop) groups 3.2–8.5 and 14–35 mmol/kg. Bacteroides and Prevotella prevalent microbiotas were designated by Bacteroides to Prevotella ratio, ratio 1 ± 0.5 was taken as a mixed enterotype. Samples of the two enterotypes were divided into groups based on the sampling periods (April–May, June–July, August–Sept). Only the bacteria significantly different at least between two groups were considered for further analysis (unpaired Wilcoxon test, p < 0.05 was taken as significant). Each participant is represented by a single sample per sampling period.
For general correlation analysis, Pearson correlations were calculated between foods or faecal bacteria and faecal pH or organic acid concentrations for each seasonal period. To find individual level relationships between food consumption and faecal pH or organic acids and faecal microbiota, Pearson correlations were calculated for data pairs of each participant. As there were four samples from each participant, categorical analysis of correlation coefficients was carried out by counting positive and negative correlations in each quartile of correlation coefficients (R1 < −0.5 < R2 < 0 < R3 < 0.5 < R4). Distribution bias of correlation trends towards positive or negative correlation was estimated by chi-square test.
Data analysis and statistics were done using programs Microsoft 365 Excel and R version 4.1.2. using the packages dplyr, GGally, ggpubr, reshape2, rstatix and tidyverse. Graphics were built using R Studio and package ggplot2.
3. Results
3.1. Variability of faecal pH and acid profiles
High variability between participants were found in faecal pH and organic acid content. Variation of the faecal pH between pH 5.7 and 8.8 was seen (Fig. 1), although the median pH and organic acid concentrations were comparable during all sampling periods. Acetate, butyrate and propionate covered the least 77 % (90th percentile) of the amount of all faecal organic acids detected with acetate as the major acid. The concentration of acetate varied from 11 to 92 mM and that of butyrate from 2 to 33 mM. The ratios of acetate, butyrate and propionate ranged from 1:0.67:0.27 to 1:0.17:0.36, respectively.
Fig. 1.

Distribution of faecal pH and concentrations (mmol/kg) of acetate, lactate, butyrate, propionate and succinate of all participants. Samples S1, S2 were taken in April–May, S3, S4 in June–July and S5, S6 in August–September.
3.2. Seasonal changes in food consumption
In total 855 different food items were recorded, with only 20 common food items consumed by more than half of the subjects. Potatoes, onions, table sugar and rapeseed oil were consumed with the highest frequency (at least once by > 90 % participants, ie 53–55 persons) followed by tomatoes, eggs, carrots, cucumbers and 2.5 % drinking milk, all consumed by more than 80 % of the subjects. 46 common foods were similar for more than 25 % of participants i.e. 15 persons. Accordingly, the food items were categorised to elucidate the relationships between individual diet patterns, faecal microbiota composition, pH and organic acid contents.
Based on the food diaries at least one portion (50 g) of meat and dairy products per day were consumed by more than 70 % of the participants. Other abundantly consumed foods were potatoes, sweets and white wheat products (at least 50 g/day by at least 50 % of the subjects) (Fig. 2). When comparing the diets of spring (April–May) and summer (June–July) periods, seasonal variability could be seen. Consumption of strawberries and cherries was the highest in June–July while that of apples, citrus fruits and cruciferous vegetables (cabbages) was the lowest in this period. Also, consumption of buckwheat and rice decreased in summer period. At individual level, the faecal acid concentrations reflected the food consumption patterns. For example, pectin-rich diets resulted in higher faecal acetate concentrations while abundant consumption of white wheat products was inversely correlated with faecal butyrate concentration (Fig. 3).
Fig. 2.
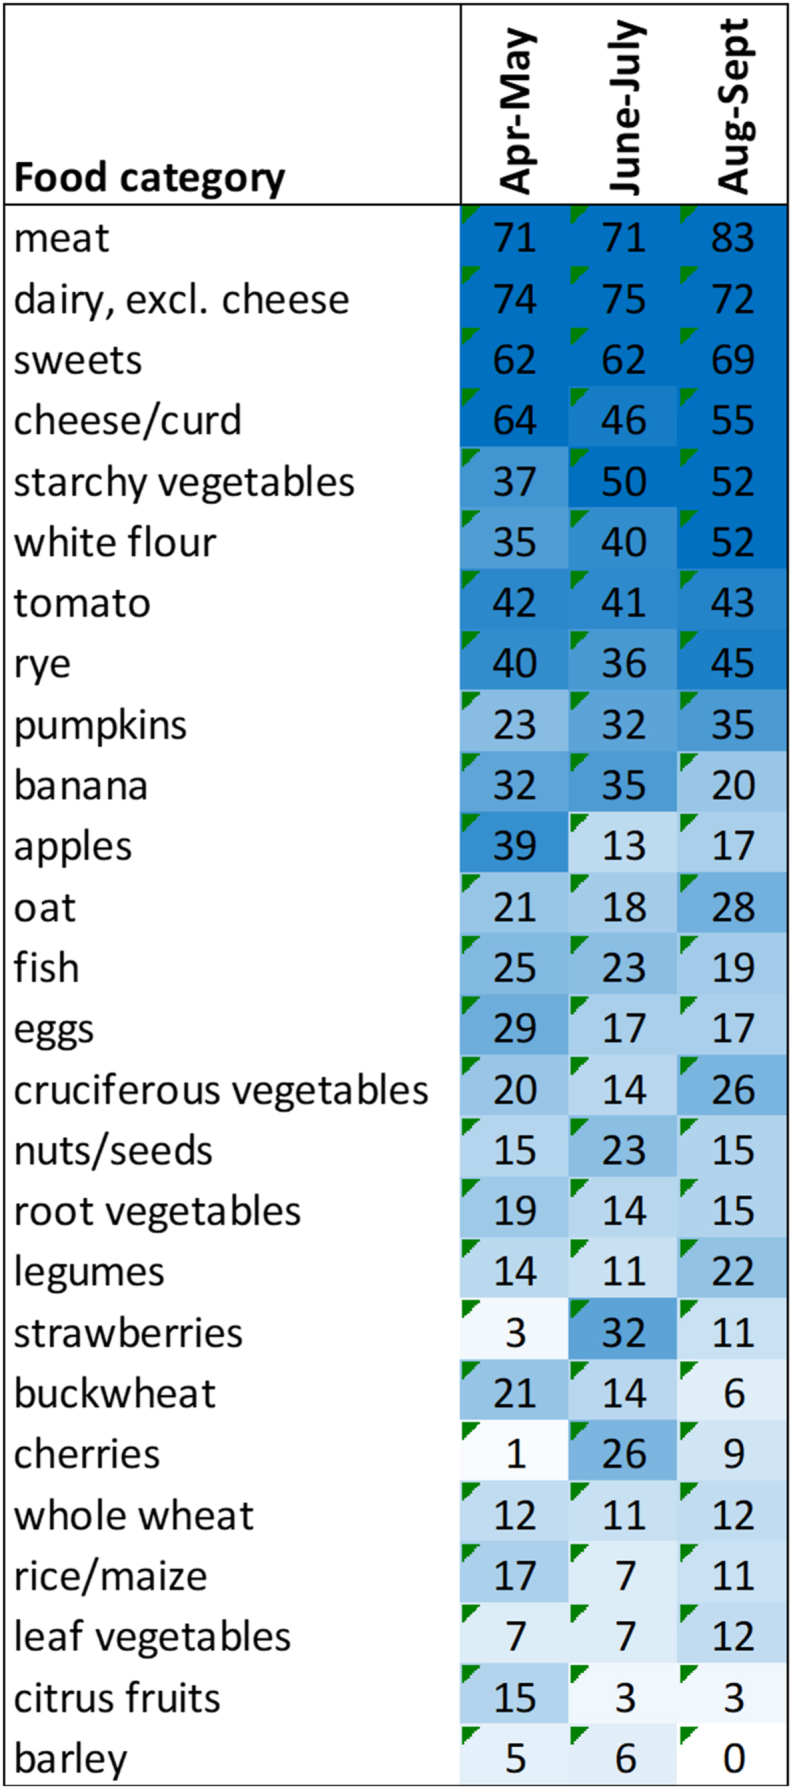
Heatmap of the food consumption patterns indicating seasonal variation. The numbers indicate the percentage of the participants consuming the food in the given category at a certain sampling period (April–May, June–July, August–Sept). Only the amounts of foods providing at least 1 g of dietary fibre per day are presented.
Fig. 3.

Pearson correlation between acetate and butyrate concentrations with pectin-rich fruits (A) and white wheat product consumption (B), respectively. The colour of points (individual samples) and regression lines indicate the participant ID. Pectin-rich fruits indicate the sum of apples, plums and black and red currants.
3.3. Association of abundance of faecal Prevotella and concentration of propionic acid
The patterns of fermentation products reflected the degradation of dietary fibres by gut bacteria. The metabolites, in turn, affected the microbial composition. Lower pH associated with higher concentration of total organic acids. In different, branched chain acids derived from amino acid degradation isovalerate and valerate did not have clear associations with faecal pH, possibly because of ammonia released from the amino group.
Higher faecal pH associated with the higher abundance of known amino acid degrading taxa such as Clostridium cluster XIII, Eubacterium coprostanoligenes and Odoribacter, which are weak carbohydrate fermenters (Fig. 4). On the contrary, well-known dietary fibre degrading and acid producing bacteria such as Roseburia or Prevotella were more abundant in the samples of low pH and high acid concentrations (Supplementary Figs. S2–S5).
Fig. 4.

Bacterial taxa (A–H) significantly different in faecal samples of high and low pH (A–D), as well as high and low concentrations of butyrate (E–F) and propionate (G–H). Samples of each participant were grouped based on the sampling period (Apr–May, June–July, Aug–Sept) and then grouped by pH or acid concentrations. Grouping details are given in materials and methods.
The concentration of propionic acid associated with the abundance of genus Prevotella (Fig. 4). The relative abundance of Prevotella reached up to 42 % with the median values above 26 % in Prophigh group while remained below 11 % in Proplow group. Genus Prevotella comprises several known producers of succinate [18,19] that can be converted to propionate by other gut bacteria such as Dialister. To elucidate the statistical differences of the bacteria and organic acids, the samples were grouped into enterotypes based on the Prevotella to Bacteroides ratio. Subjects of the Prevotella enterotype had higher abundances of Holdemanella but lower abundances of Alistipes, Parasutterella and butyric acid producing taxa, especially Eubacterium rectale throughout the study (Fig. 5). Enhanced propionate production was reflected by 40 % lower median ratios of acetate to propionate in Prevotella enterotype compared to that in Bacteroides enterotype (2.8 mol/mol vs 3.9 mol/mol, respectively, Fig. 5), while opposite was seen for propionate to butyrate ratios. Moreover, higher amounts of propionate were negatively correlated to the abundances of Proteobacteria (Supplementary Fig. S5), a phylum associated with gut inflammation. In addition, negative correlation between high concentrations of propionate and an opportunistic pathogen Odoribacter was observed (Fig. 4).
Fig. 5.

Comparison of the abundances of bacterial genera (A–D) and acid profiles (E–H) significantly different in Bacteroides/Prevotella ratio.
3.4. Individual level data analysis
The individual level data analyses revealed subject-specific relationships between the diet and faecal parameters - pH, organic acid concentrations and microbiota composition. For example, Akkermansia was detected in faecal samples of about half of the participants (29 of 57) and in most of these cases (20) correlation between the abundance of Akkermansia and higher faecal pH was found (Fig. 6). Concentrations of total organic acids and pH associated also with the Bristol stool score (BSS), ie more organic acids (μmol/g) were detected in looser stools. More than half of the participants (34) registered different BSS values at different sampling periods while in 23 cases, negative correlation between pH and the BSS was observed (Fig. 7, Supplementary Fig. S7). However, clear associations between BSS and any food items nor gut microbiota were not found. Higher consumption of sweet juicy fruits (melon and watermelon) resulted in more acidic faecal pH in 8 out of 13 subjects reporting these fruits in their food diaries, and higher BSS. Association of oat consumption with higher faecal pH indicate that more proteins and/or less dietary fibres were available for colonic bacteria.
Fig. 6.

Correlation between faecal microbiota and faecal pH (A–B), total acid concentrations (C–D) or propionic acid (E–F).
Fig. 7.
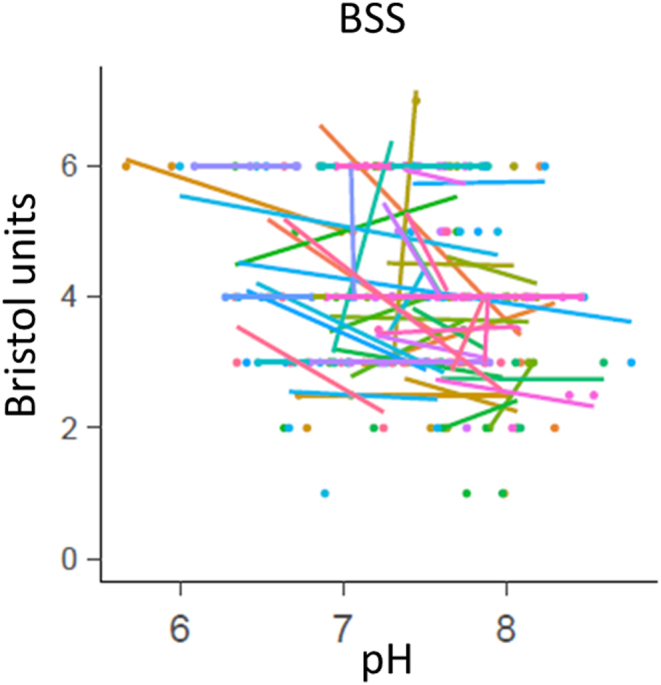
Pearson correlation between faecal pH and Bristol stool score (BSS). The colour of points (individual samples) and regression lines indicate the participant ID.
The concentration of faecal succinate remained typically below 1 μmol/g. As an exception, amounts of succinate above 10 μmol/g were detected in all samples from nine participants. Such high amounts of succinic acid triggered the decrease of pH indicating malabsorption or incomplete conversion of succinate to propionate. Seven out of these subjects had also enormous abundance of faecal Prevotella (23–42 % of total microbiota).
Significant correlation between the total abundance of butyrogenic bacteria (sum of Faecalibacterium, Eubacterium and Roseburia) and total acid concentrations was found without common patterns of specific species and butyrate concentration. It might be related to the type of available fibre source as less faecal butyrate was detected in cases of very low fibre consumption (mostly refined wheat products) (Fig. 3). High concentrations of propionate but also acetate and butyrate correlated with higher abundance of Prevotella (Fig. 6, Supplementary Figs. S8–S10), a characteristic bacterium of looser stools. Concentration of propionate also correlated with the abundances of Phascolarctobacterium, a propionate producing bacterium and Streptococcus, a producer of lactate, which is a precursor for propionate (Fig. 6 and Supplementary Fig. S10). Lower abundances of proteobacteria in the presence of higher propionate concentrations cannot be explained by their inhibition by propionic acid only. Individual level analysis also revealed correlation between lower abundances of several bacteria such as Eubacterium coprostanoligenes, Clostridium cluster XIII and some Bacteroides species (B. cellulosilyticus, B. xylanisolvens) and higher concentration of faecal butyrate and propionate (Supplementary Figs. S9 and S10).
4. Discussion
In this study, the nutrition data were analysed and correlated with the faecal characteristics: pH, organic acid content, BSS and microbiota composition. The analyses were performed both at group and individual levels. Main advantage of the individual level analysis is the possibility to find important biological relationships that could not be found by group level analysis. Additionally, we analysed food consumptions by dividing foods into groups based on dietary fibre composition, which reflects the nutrient groups available for the gut microbiota and organic acids can only be formed in the presence of specific fibre degrading and metabolizing taxa. We showed that the responses of the gut microbiome and its fermentation products to diet were very clearly individual. As shown by Johnson et al. [20] gut microbiome of individuals was related to food choices, but not to conventional nutrients, that was also observed in our study.
Data on general relationships between food and faecal pH or organic acids are limited. Based on the recent literature data, the colonic pH reflects the balance between carbohydrate and protein fermentation, the effect of food components on faecal pH and concentrations of SCFA (Table 1). In individual level analysis we observed a clear reverse correlation between the consumption of white flour products and faecal butyrate concentration indicating limited supply of wholegrain cereal-derived dietary fibres. In long term perspective, this may affect the colonic pH and gut health. To enhance the growth of butyrogenic taxa and increase the butyric acid content in the colon, the refined cereals should be replaced by fibre-rich wholegrain products. However, changing the eating habits can be a bigger obstacle than large-scale production of health supporting foods. High-fibre/whole-grain cereals are avoided in low FODMAP diets as rye and wheat contain fructans. Associations between protein-rich and/or low FODMAP diets and higher faecal pH with lower amounts of organic acids have been observed in several human trials (Table 1) [[21], [22], [23], [24], [25], [26]]. This lack of the whole grain cereals in low FODMAP diet can reduce faecal acids more than 10 μmol/g [23].
Table 1.
Effect of diets or dietary components on the change of faecal pH or organic acids (mM) based on the literature data. pH and organic acid values are shown as difference compared to control diet or baseline period.
| Diet type or food | Control diet | n* | nc* | pH | Acetate | Butyrate | Propionate | Reference |
|---|---|---|---|---|---|---|---|---|
| Low FODMAP | sham | 21 | 20 | 0.4 | −24.5 | −10.2 | −8.7 | [23] |
| Low FODMAP | habitual | 33 | 0.2 | −2 | −2.7 | −1 | [24] | |
| Yacon (FOS, inulin) | habitual | 24 | −0.4 | −2.9 | 0.5 | −1.6 | [27] | |
| Inulin | habitual | 32 | −1 | 11 | 3 | −1 | [28] | |
| Oat beta-glucan | habitual | 25 | 12.8 | 2.1 | 2.8 | [29] | ||
| High-amylose barley | Refined grain | 17 | −0.3 | 10.1 | 8.8 | 2.2 | [30] | |
| Almond | habitual | 35 | −0.3 | −4.6 | 0.8 | 1.1 | [31] | |
| Vegan | omnivore | 36 | 36 | −0.3 | 0 | 3.3 | −3.9 | [32] |
| Wholegrain-rich | Refined grain | 50 | −0.1 | no | 0.7 | no | [4] | |
| Wheat bran (28 g/day) | habitual | 13 | −0 | 8.1 | 10 | −2.1 | [33] | |
| Wheat bran + RS (12 + 22 g/day | habitual | 20 | −0.1 | 8.6 | 12 | −2.4 | [34] | |
| Wheat bran fibre (30 g/day) | Low fibre | 24 | 3.5 | 2.1 | 0.1 | [35] | ||
| RS (30 g/day) | Low fibre | 24 | 2.9 | 3.5 | −1.2 | [35] | ||
| RS rich foods (38 g/day) | Low RS (5 g/day) | 11 | −0.6 | 21 | 7.2 | −2.5 | [36] | |
| Wheat bran extract (AXOS, 10 g/day) | placebo | 57 | −0.2 | 0.3 | −0.1 | 0.1 | [37] | |
| AX (15 g/day) | placebo | 17 | 0.2 | 6.2 | 2.5 | 0.5 | [38] | |
| Mediterranean | Western | 40 | 31 | 0.3 | 3.7 | −1.0 | −1.9 | [39] |
| Normal protein weight loss | maintenance | 18 | −0.2 | −9 | −2.9 | −2 | [21] | |
| HP, low fat | habitual | 11 | 15 | 0.7 | [25] | |||
| HP weight loss | maintenance | 18 | 0.1 | −15.9 | −9.4 | −2.8 | [21] | |
| HP MC | maintenance | 17 | 0.1 | −6.2 | −2.2 | −3.7 | [22] | |
| HP MC | maintenance | 16 | −21.6 | −8.8 | −6.5 | [26] | ||
| HP LC | maintenance | 17 | 0.5 | −22.4 | −8.5 | −6.4 | [22] | |
| HP LC | maintenance | 18 | −29.6 | −13.3 | −9.5 | [26] | ||
| Colorectal cancer | Healthya | 21 | 14 | 1 | [40] | |||
| Colorectal cancer | Healthya | 93 | 49 | 0.5 | −10.3 | −4.1 | −7.1 | [3] |
n* and nc* - indicates the number of participants in the study intervention group or control group, respectively. If nc is missing it indicates to the cross-over study.
Compared with no CRC subjects, RS – resistant starch, AX – arabinoxylan, AXOS – arabinooligosaccharides, HP - high protein, LC - low carbs, MC - medium carbs.
Table 1 Effect of diets or dietary components on faecal pH and organic acids based on published studies. Values of faecal pH and organic acids (μmol/g) are shown as differences compared to the baseline period or control diet.
Decrease of faecal pH and increase of concentrations of organic acids by inulin, arabinoxylo-oligosaccharides, oat bran, resistant starch, high-amylose barley and wheat bran has been reported (Table 1) [[27], [28], [29], [30], [33], [34], [35], [36], [37], [38]]. Also, Mediterranean diet or omnivorous diet rich in dietary fibres have positive effect on formation of bacterial fermentation products [39,41]. Our data showed the importance of the colon microbiota composition in control of faecal pH. The formation of propionate in Prevotella enterotype was especially affected by pH. We propose a cross-feeding mechanism between succinate producing Prevotella and succinate consuming Dialister and/or Phascolarctobacterium resulting in higher propionate amounts. Alternatively, succinate can be a substrate for butyrate production as we observed positive correlation between the abundance of Prevotella and concentration of faecal butyrate. Hence, the diet-derived substrates for Prevotella may through cross-feeding promote the production butyrate by Faecalibacterium, Eubacterium and Roseburia. Consistent with a recent studies [4,10], both total SCFA and formation of butyrate increased significantly at lower faecal pH. Acidic colonic pH influences butyrate production through altering the stoichiometry of butyrate formation, resulting in increased acetate uptake, and facilitating increased relative abundance of butyrate-producing taxa (notably Roseburia and Eubacterium rectale) [10].
Persistent changes of faecal pH are characteristic to substantial diet change or development of a disease. We observed specific associations of faecal pH and bacteria, eg. higher faecal pH of the individuals with detectable amounts of Akkermansia. Although Akkermansia has been shown to ease chronic gut inflammation processes [42], higher abundance of this bacterium has been observed also in Parkinson's disease patients [43,44]. One of the common Parkinson's disease symptoms is constipation, typical to long gut transit time and low BSS (dry stool). Often, low transit rate and low BSS accompany with high abundance of Akkermansia [17,45]. Furthermore, constipation and high faecal pH may be related to colorectal cancer (Tabel 1) [3,40]. In accordance with this, enhanced growth of Akkermansia at high pH and slow dilution rates was demonstrated in in vitro cultivation experiments with faecal cultures [15,46].
In conclusion, the biochemical characteristics – faecal pH and organic acid content have been underexplored in research and healthcare practices so far. We suggest applying these relatively cheap and simple analyses to elucidate colonic fermentation balance and potential pathological shifts. The increase of faecal butyrate concentration is largely driven by lower colonic pH. Statistically significant correlation between the amount of faecal propionic acid and the abundance of genus Prevotella was shown. Cross-feeding between fibre degrading and acid producing taxa resulted in diverse colon microbiota and higher concentrations of total SCFA-s. Thus, fibre-rich diet is a crucial factor for good gut health.
Funding
This research was funded by European Regional Development Fund, grant number 2014-020.4.02.21-0338 and by Estonian Ministry of Education and Research, grant number IUT-1927.
CRediT authorship contribution statement
Signe Adamberg: Writing – review & editing, Methodology, Conceptualization, Funding acquisition. Kaarel Adamberg: Writing – original draft, Methodology, Funding acquisition, Data curation, Conceptualization.
Declaration of competing interest
The authors declare that they have no known competing financial interests or personal relationships that could have appeared to influence the work reported in this paper.
Footnotes
Supplementary data to this article can be found online at https://doi.org/10.1016/j.heliyon.2024.e31134.
Appendix A. Supplementary data
The following are the Supplementary data to this article:
References
- 1.Reeves R.B. Temperature-induced changes in blood acid-base status : donnan rcl and red cell volume. J. Appl. Physiol. 1976;40:762–767. doi: 10.1152/jappl.1976.40.5.762. [DOI] [PubMed] [Google Scholar]
- 2.Cummings J.H., Macfarlane G.T. The control and consequences of bacterial fermentation in the human colon. J. Appl. Bacteriol. 1991;70:443–459. doi: 10.1111/j.1365-2672.1991.tb02739.x. [DOI] [PubMed] [Google Scholar]
- 3.Ohigashi S., Sudo K., Kobayashi D., Takahashi O., et al. Changes of the intestinal microbiota, short chain fatty acids, and fecal pH in patients with colorectal cancer. Dig. Dis. Sci. 2013;58:1717–1726. doi: 10.1007/s10620-012-2526-4. [DOI] [PubMed] [Google Scholar]
- 4.Procházková N., Venlet N., Hansen M.L., Lieberoth C.B., et al. Effects of a wholegrain-rich diet on markers of colonic fermentation and bowel function and their associations with the gut microbiome: a randomised controlled cross-over trial. Front. Nutr. 2023;10:1–10. doi: 10.3389/fnut.2023.1187165. [DOI] [PMC free article] [PubMed] [Google Scholar]
- 5.Flint H.J., Karen P., Louis P., Duncan S.H. The role of the gut microbiota in nutrition and health. Nat. Rev. Gastroenterol. Hepatol. 2012;9:577–589. doi: 10.1038/nrgastro.2012.156. [DOI] [PubMed] [Google Scholar]
- 6.Dalile B., Van Oudenhove L., Vervliet B., Verbeke K. The role of short-chain fatty acids in microbiota–gut–brain communication. Nat. Rev. Gastroenterol. Hepatol. 2019;16:461–478. doi: 10.1038/s41575-019-0157-3. [DOI] [PubMed] [Google Scholar]
- 7.Fan Y., Pedersen O. Gut microbiota in human metabolic health and disease. Nat. Rev. Microbiol. 2021;19:55–71. doi: 10.1038/s41579-020-0433-9. [DOI] [PubMed] [Google Scholar]
- 8.Evans D.F., Pye G., Bramley R., Clark A.G., et al. Measurement of gastrointestinal pH profiles in normal ambulant human subjects. Gut. 1988;29:1035–1041. doi: 10.1136/gut.29.8.1035. [DOI] [PMC free article] [PubMed] [Google Scholar]
- 9.Nugent S.G., Kumar D., Rampton D.S., Evans D.F. Intestinal luminal pH in inflammatory bowel disease: possible determinants and implications for therapy with aminosalicylates and other drugs. Gut. 2001;48:571–577. doi: 10.1136/gut.48.4.571. [DOI] [PMC free article] [PubMed] [Google Scholar]
- 10.LaBouyer M., Holtrop G., Horgan G., Gratz S.W., et al. Higher total faecal short-chain fatty acid concentrations correlate with increasing proportions of butyrate and decreasing proportions of branched-chain fatty acids across multiple human studies. Gut Microb. 2022;3:1–14. doi: 10.1017/gmb.2022.1. [DOI] [PMC free article] [PubMed] [Google Scholar]
- 11.Ilhan Z.E., Marcus A.K., Kang D., Rittmann B.E. pH-mediated microbial and metabolic. mSphere. 2017;2:1–12. doi: 10.1128/mSphere.00047-17. [DOI] [PMC free article] [PubMed] [Google Scholar]
- 12.Walker A.W., Duncan S.H., Carol McWilliam Leitch E., Child M.W., et al. pH and peptide supply can radically alter bacterial populations and short-chain fatty acid ratios within microbial communities from the human colon. Appl. Environ. Microbiol. 2005;71:3692–3700. doi: 10.1128/AEM.71.7.3692-3700.2005. [DOI] [PMC free article] [PubMed] [Google Scholar]
- 13.Reichardt N., Vollmer M., Holtrop G., Farquharson F.M., et al. Specific substrate-driven changes in human faecal microbiota composition contrast with functional redundancy in short-chain fatty acid production. ISME J. 2018;12:610–622. doi: 10.1038/ismej.2017.196. [DOI] [PMC free article] [PubMed] [Google Scholar]
- 14.Chung W.S., Walker A.W., Louis P., Parkhill J., et al. Modulation of the human gut microbiota by dietary fibres occurs at the species level. BMC Biol. 2016:1–13. doi: 10.1186/s12915-015-0224-3. [DOI] [PMC free article] [PubMed] [Google Scholar]
- 15.Raba G., Adamberg S., Adamberg K. Acidic pH enhances butyrate production from pectin by faecal microbiota. FEMS Microbiol. Lett. 2021;368:1–8. doi: 10.1093/femsle/fnab042. [DOI] [PubMed] [Google Scholar]
- 16.Adamberg K., Jaagura M., Aaspõllu A., Nurk E., et al. The composition of faecal microbiota is related to the amount and variety of dietary fibres. Int. J. Food Sci. Nutr. 2020;71:845–855. doi: 10.1080/09637486.2020.1727864. [DOI] [PubMed] [Google Scholar]
- 17.Roager H.M., Hansen L.B.S., Bahl M.I., Frandsen H.L., et al. Metabolism and mucosal turnover in the gut. Nat. Microbiol. 2016:1–9. doi: 10.1038/nmicrobiol.2016.93. [DOI] [PubMed] [Google Scholar]
- 18.Tett A., Huang K.D., Asnicar F., Fehlner-Peach H., et al. The Prevotella copri complex comprises four distinct clades underrepresented in westernized populations. Cell Host Microbe. 2019;26:666–679.e7. doi: 10.1016/j.chom.2019.08.018. [DOI] [PMC free article] [PubMed] [Google Scholar]
- 19.Hayashi H., Shibata K., Sakamoto M., Tomita S., et al. Prevotella copri sp. nov. and Prevotella stercorea sp. nov., isolated from human faeces. Int. J. Syst. Evol. Microbiol. 2007;57:941–946. doi: 10.1099/ijs.0.64778-0. [DOI] [PubMed] [Google Scholar]
- 20.Johnson A.J., Vangay P., Al-Ghalith G.A., Hillmann B.M., et al. Daily sampling reveals personalized diet-microbiome associations in humans. Cell Host Microbe. 2019;25:789–802.e5. doi: 10.1016/j.chom.2019.05.005. [DOI] [PubMed] [Google Scholar]
- 21.Gratz S.W., Hazim S., Richardson A.J., Scobbie L., et al. Dietary carbohydrate rather than protein intake drives colonic microbial fermentation during weight loss. Eur. J. Nutr. 2019;58:1147–1158. doi: 10.1007/s00394-018-1629-x. [DOI] [PMC free article] [PubMed] [Google Scholar]
- 22.Russell W.R., Gratz S.W., Duncan S.H., Holtrop G., et al. High-protein, reduced-carbohydrate weight-loss diets promote metabolite profiles likely to be detrimental to colonic health. Am. J. Clin. Nutr. 2011;93:1062–1072. doi: 10.3945/ajcn.110.002188. [DOI] [PubMed] [Google Scholar]
- 23.Wilson B., Rossi M., Kanno T., Parkes G.C., et al. β-Galactooligosaccharide in conjunction with low FODMAP diet improves irritable bowel syndrome symptoms but reduces fecal bifidobacteria. Am. J. Gastroenterol. 2020;115:906–915. doi: 10.14309/ajg.0000000000000641. [DOI] [PubMed] [Google Scholar]
- 24.Halmos E.P., Christophersen C.T., Bird A.R., Shepherd S.J., et al. 2014. Diets that Differ in Their FODMAP Content Alter the Colonic Luminal Microenvironment. [DOI] [PubMed] [Google Scholar]
- 25.Szurkowska J., Wiacek J., Laparidis K., Karolkiewicz J. A comparative study of selected gut bacteria abundance and sedentary controls. Nutrients. 2021;13:4093. doi: 10.3390/nu13114093. [DOI] [PMC free article] [PubMed] [Google Scholar]
- 26.Duncan S.H., Belenguer A., Holtrop G., Johnstone A.M., et al. Reduced dietary intake of carbohydrates by obese subjects results in decreased concentrations of butyrate and butyrate-producing bacteria in feces. Appl. Environ. Microbiol. 2007;73:1073–1078. doi: 10.1128/AEM.02340-06. [DOI] [PMC free article] [PubMed] [Google Scholar]
- 27.De Souza Lima Sant Anna M., Rodrigues V.C., Araújo T.F., De Oliveira T.T., et al. Yacon-based product in the modulation of intestinal constipation. J. Med. Food. 2015;18:980–986. doi: 10.1089/jmf.2014.0115. [DOI] [PubMed] [Google Scholar]
- 28.Petry N., Egli I., Chassard C., Lacroix C., et al. Inulin modifies the bifidobacteria population, fecal lactate concentration, and fecal pH but does not influence iron absorption in women with low iron status. Am. J. Clin. Nutr. 2012;96:325–331. doi: 10.3945/ajcn.112.035717. [DOI] [PubMed] [Google Scholar]
- 29.Nilsson U., Johansson M., Nilsson Å., Björck I., et al. Dietary supplementation with β-glucan enriched oat bran increases faecal concentration of carboxylic acids in healthy subjects. Eur. J. Clin. Nutr. 2008;62:978–984. doi: 10.1038/sj.ejcn.1602816. [DOI] [PubMed] [Google Scholar]
- 30.Bird A.R., Vuaran M.S., King R.A., Noakes M., et al. Wholegrain foods made from a novel high-amylose barley variety (Himalaya 292) improve indices of bowel health in human subjects. Br. J. Nutr. 2008;99:1032–1040. doi: 10.1017/S000711450783902X. [DOI] [PubMed] [Google Scholar]
- 31.Choo J.M., Tran C.D., Luscombe-Marsh N.D., Stonehouse W., et al. Almond consumption affects fecal microbiota composition, stool pH, and stool moisture in overweight and obese adults with elevated fasting blood glucose: a randomized controlled trial. Nutr. Res. 2021;85:47–59. doi: 10.1016/j.nutres.2020.11.005. [DOI] [PubMed] [Google Scholar]
- 32.Trefflich I., Dietrich S., Braune A., Abraham K., et al. Short-and branched-chain fatty acids as fecal markers for microbiota activity in vegans and omnivores. Nutrients. 2021;13:1–17. doi: 10.3390/nu13061808. [DOI] [PMC free article] [PubMed] [Google Scholar]
- 33.Lewis J.S., Heaton W.K. Increasing butyrate concentration in the distal colon by accelerating intestinal transit. Gut. 1997;41:245–251. doi: 10.1136/gut.41.2.245. [DOI] [PMC free article] [PubMed] [Google Scholar]
- 34.Muir J.G., Yeow E.G.W., Keogh J., Pizzey C., et al. Combining wheat bran with resistant starch has more beneficial effects on fecal indexes than does wheat bran alone. Am. J. Clin. Nutr. 2004;79:1020–1028. doi: 10.1093/ajcn/79.6.1020. [DOI] [PubMed] [Google Scholar]
- 35.Jenkins D.J.A., Vuksan V., Kendall C.W.C., Mehling C.C., et al. Physiological effects of resistant starches on fecal bulk, short chain fatty acids, blood lipids and glycemic index. J. Am. Coll. Nutr. 1998;17:609–616. doi: 10.1080/07315724.1998.10718810. [DOI] [PubMed] [Google Scholar]
- 36.Phillips J., Muir J., Birkett A., Lu Z., et al. Effect of resistant starch on fecal bulk and fermentation-dependent events in humans. Am. J. Clin. Nutr. 1995;62:121–130. doi: 10.1093/ajcn/62.1.121. [DOI] [PubMed] [Google Scholar]
- 37.François I.E.J.A., Lescroart O., Veraverbeke W.S., Marzorati M., et al. Effects of a wheat bran extract containing arabinoxylan oligosaccharides on gastrointestinal health parameters in healthy adult human volunteers: a double-blind, randomised, placebo-controlled, cross-over trial. Br. J. Nutr. 2012;108:2229–2242. doi: 10.1017/S0007114512000372. [DOI] [PubMed] [Google Scholar]
- 38.Salden B.N., Troost F.J., Wilms E., Truchado P., et al. Reinforcement of intestinal epithelial barrier by arabinoxylans in overweight and obese subjects: a randomized controlled trial: arabinoxylans in gut barrier. Clin. Nutr. 2018;37:471–480. doi: 10.1016/j.clnu.2017.01.024. [DOI] [PubMed] [Google Scholar]
- 39.Mitsou E.K., Kakali A., Antonopoulou S., Mountzouris K.C., et al. Adherence to the Mediterranean diet is associated with the gut microbiota pattern and gastrointestinal characteristics in an adult population. Br. J. Nutr. 2017;117:1645–1655. doi: 10.1017/S0007114517001593. [DOI] [PubMed] [Google Scholar]
- 40.Faruk M., I S., Adamu A., Rafindadi A., et al. An analysis of dietary fiber and fecal fiber components including pH in rural Africans with colorectal cancer. Intest. Res. 2018;16:99–108. doi: 10.5217/ir.2018.16.1.99. [DOI] [PMC free article] [PubMed] [Google Scholar]
- 41.De Filippis F., Pellegrini N., Vannini L., Jeffery I.B., et al. High-level adherence to a Mediterranean diet beneficially impacts the gut microbiota and associated metabolome. Gut. 2016;65 doi: 10.1136/gutjnl-2015-309957. [DOI] [PubMed] [Google Scholar]
- 42.Derrien M., Belzer C., de Vos W.M. Akkermansia muciniphila and its role in regulating host functions. Microb. Pathog. 2017;106:171–181. doi: 10.1016/j.micpath.2016.02.005. [DOI] [PubMed] [Google Scholar]
- 43.Wallen Z.D., Appah M., Dean M.N., Sesler C.L., et al. Characterizing dysbiosis of gut microbiome in PD: evidence for overabundance of opportunistic pathogens. Npj Park. Dis. 2020;6:1–12. doi: 10.1038/s41531-020-0112-6. [DOI] [PMC free article] [PubMed] [Google Scholar]
- 44.Baldini F., Hertel J., Sandt E., Thinnes C.C., et al. Parkinson's disease-associated alterations of the gut microbiome predict disease-relevant changes in metabolic functions. BMC Biol. 2020;18:1–21. doi: 10.1186/s12915-020-00775-7. [DOI] [PMC free article] [PubMed] [Google Scholar]
- 45.Vandeputte D., Falony G., Vieira-silva S., Tito R.Y., et al. Stool consistency is strongly associated with gut microbiota richness and composition , enterotypes and bacterial growth rates. Gut. 2015:1–6. doi: 10.1136/gutjnl-2015-309618. [DOI] [PMC free article] [PubMed] [Google Scholar]
- 46.Adamberg K., Raba G., Adamberg S. Use of changestat for growth rate studies of gut microbiota. Front. Bioeng. Biotechnol. 2020;8:1–12. doi: 10.3389/fbioe.2020.00024. [DOI] [PMC free article] [PubMed] [Google Scholar]
Associated Data
This section collects any data citations, data availability statements, or supplementary materials included in this article.