

Abstract
Background
Sickle cell disease (SCD) refers to a group of genetic disorders characterized by the presence of an abnormal haemoglobin molecule called haemoglobin S (HbS). When subjected to oxidative stress from low oxygen concentrations, HbS molecules form rigid polymers, giving the red cell the typical sickle shape. Antioxidants have been shown to reduce oxidative stress and improve outcomes in other diseases associated with oxidative stress. Therefore, it is important to review and synthesize the available evidence on the effect of antioxidants on the clinical outcomes of people with SCD.
Objectives
To assess the effectiveness and safety of antioxidant supplementation for improving health outcomes in people with SCD.
Search methods
We used standard, extensive Cochrane search methods. The latest search date was 15 August 2023.
Selection criteria
We included randomized and quasi‐randomized controlled trials comparing antioxidant supplementation to placebo, other antioxidants, or different doses of antioxidants, in people with SCD.
Data collection and analysis
Two authors independently extracted data, assessed the risk of bias and certainty of the evidence, and reported according to Cochrane methodological procedures.
Main results
The review included 1609 participants in 26 studies, with 17 comparisons. We rated 13 studies as having a high risk of bias overall, and 13 studies as having an unclear risk of bias overall due to study limitations. We used GRADE to rate the certainty of evidence. Only eight studies reported on our important outcomes at six months.
Vitamin C (1400 mg) plus vitamin E (800 mg) versus placebo
Based on evidence from one study in 83 participants, vitamin C (1400 mg) plus vitamin E (800 mg) may not be better than placebo at reducing the frequency of crisis (risk ratio (RR) 1.18, 95% confidence interval (CI) 0.64 to 2.18), the severity of pain (RR 1.33, 95% CI 0.40 to 4.37), or adverse effects (AE), of which the most common were headache, nausea, fatigue, diarrhoea, and epigastric pain (RR 0.56, 95% CI 0.31 to 1.00). Vitamin C plus vitamin E may increase the risk of SCD‐related complications (acute chest syndrome: RR 2.66, 95% CI 0.77 to 9.13; 1 study, 83 participants), and increase haemoglobin level (median (interquartile range) 90 (81 to 96) g/L versus 93.5 (84 to 105) g/L) (1 study, 83 participants) compared to placebo. However, the evidence for all the above effects is very uncertain. The study did not report on quality of life (QoL) of participants and their caregivers, nor on frequency of hospitalization.
Zinc versus placebo
Zinc may not be better than placebo at reducing the frequency of crisis at six months (rate ratio 0.62, 95% CI 0.17 to 2.29; 1 study, 36 participants; low‐certainty evidence). We are uncertain whether zinc is better than placebo at improving sickle cell‐related complications (complete healing of leg ulcers at six months: RR 2.00, 95% CI 0.60 to 6.72; 1 study, 34 participants; very low‐certainty evidence). Zinc may be better than placebo at increasing haemoglobin level (g/dL) (MD 1.26, 95% CI 0.44 to 1.26; 1 study, 36 participants; low‐certainty evidence). The study did not report on severity of pain, QoL, AE, and frequency of hospitalization.
N‐acetylcysteine versus placebo
N‐acetylcysteine (NAC) 1200 mg may not be better than placebo at reducing the frequency of crisis in SCD, reported as pain days (rate ratio 0.99 days, 95% CI 0.53 to 1.84; 1 study, 96 participants; low‐certainty evidence). Low‐certainty evidence from one study (96 participants) suggests NAC (1200 mg) may not be better than placebo at reducing the severity of pain (MD 0.17, 95% CI ‐0.53 to 0.87). Compared to placebo, NAC (1200 mg) may not be better at improving physical QoL (MD ‐1.80, 95% CI ‐5.01 to 1.41) and mental QoL (MD 2.00, 95% CI ‐1.45 to 5.45; very low‐certainty evidence), reducing the risk of adverse effects (gastrointestinal complaints, pruritus, or rash) (RR 0.92, 95% CI 0.75 to 1.14; low‐certainty evidence), reducing the frequency of hospitalizations (rate ratio 0.98, 95% CI 0.41 to 2.38; low‐certainty evidence), and sickle cell‐related complications (RR 5.00, 95% CI 0.25 to 101.48; very low‐certainty evidence), or increasing haemoglobin level (MD ‐0.18 g/dL, 95% CI ‐0.40 to 0.04; low‐certainty evidence).
L‐arginine versus placebo
L‐arginine may not be better than placebo at reducing the frequency of crisis (monthly pain) (RR 0.71, 95% CI 0.26 to 1.95; 1 study, 50 participants; low‐certainty evidence). However, L‐arginine may be better than placebo at reducing the severity of pain (MD ‐1.41, 95% CI ‐1.65 to ‐1.18; 2 studies, 125 participants; low‐certainty evidence). One participant allocated to L‐arginine developed hives during infusion of L‐arginine, another experienced acute clinical deterioration, and a participant in the placebo group had clinically relevant increases in liver function enzymes. The evidence is very uncertain whether L‐arginine is better at reducing the mean number of days in hospital compared to placebo (MD ‐0.85 days, 95% CI ‐1.87 to 0.17; 2 studies, 125 participants; very low‐certainty evidence). Also, L‐arginine may not be better than placebo at increasing haemoglobin level (MD 0.4 g/dL, 95% CI ‐0.50 to 1.3; 2 studies, 106 participants; low‐certainty evidence). No study in this comparison reported on QoL and sickle cell‐related complications.
Omega‐3 versus placebo
Very low‐certainty evidence shows no evidence of a difference in the risk of adverse effects of omega‐3 compared to placebo (RR 1.05, 95% CI 0.74 to 1.48; 1 study, 67 participants). Very low‐certainty evidence suggests that omega‐3 may not be better than placebo at increasing haemoglobin level (MD 0.36 g/L, 95% CI ‐0.21 to 0.93; 1 study, 67 participants). The study did not report on frequency of crisis, severity of pain, QoL, frequency of hospitalization, and sickle cell‐related complications.
Authors' conclusions
There was inconsistent evidence on all outcomes to draw conclusions on the beneficial and harmful effects of antioxidants. However, L‐arginine may be better than placebo at reducing the severity of pain at six months, and zinc may be better than placebo at increasing haemoglobin level. We are uncertain whether other antioxidants are beneficial for SCD. Larger studies conducted on each comparison would reduce the current uncertainties.
Keywords: Humans; Anemia, Sickle Cell; Anemia, Sickle Cell/blood; Anemia, Sickle Cell/drug therapy; Antioxidants; Antioxidants/therapeutic use; Ascorbic Acid; Ascorbic Acid/therapeutic use; Bias; Dietary Supplements; Oxidative Stress; Oxidative Stress/drug effects; Placebos; Placebos/therapeutic use; Quality of Life; Randomized Controlled Trials as Topic
Plain language summary
Do antioxidant supplements help people with sickle cell disease (unusually shaped red blood cells)?
Key messages
• Compared to a dummy pill (placebo), zinc and N‐acetylcysteine (NAC; 1200 mg) may not reduce the frequency of painful episodes (crises) that people with sickle cell disease (SCD) experience.
• Zinc may improve haemoglobin status (number of red blood cells) slightly, but L‐arginine may not. L‐arginine also probably reduces the severity of pain, but may not reduce the frequency of hospitalization.
• Larger studies to assess the effects of vitamin C plus vitamin E, zinc, NAC, L‐arginine, and omega‐3 are needed. Future studies should assess the number and severity of painful episodes that people with SCD experience, their quality of life, harmful effects of treatment, and frequency of hospitalization.
What is sickle cell disease (SCD) and how is it treated?
Sickle cell disease is an inherited condition affecting blood cells that carry oxygen through the body. Red blood cells in people with this condition become sickle‐shaped (almost like the letter C) when oxygen levels are low. Sickle‐shaped red cells lead to the production of harmful substances called free radicals.
'Antioxidant' is a general term used to describe any substance that can protect the cells of our body against chemicals called free radicals, which are capable of damaging the cells.
Antioxidants may help reduce the sickling process and improve recovery from sickle cell complications known as sickle cell crisis. A sickle cell crisis is the pain that occurs when the red cells become sickle‐shaped due to low oxygen in the blood.
What did we want to find out?
We wanted to find out whether giving antioxidant supplements to people with SCD reduced the frequency of crises, reduced pain, and improved their quality of life. We also wanted to find out if there were harms associated with antioxidant supplements for people with SCD.
What did we do?
We searched for studies that compared antioxidants to placebo or other antioxidants, or compared two different doses of the same antioxidant. We compared and summarised their findings and rated our confidence in the evidence, based on factors such as study methods and sizes.
What did we find?
We included 26 studies that looked at 11 antioxidants, involving 1609 children and adults with SCD. The studies took place in Belgium, Brazil, India, Jamaica, the Netherlands, Nigeria, Sudan, UK, and the USA. Thirteen studies were publicly funded, three studies were funded by pharmaceutical companies, and four studies were funded by a mixture of both. One study received no funding and five studies provided no information on their funding sources.
Only eight studies reported on our important outcomes at six months after treatment:
• frequency of crisis (four studies); • pain severity (three studies); • quality of life (one study); • adverse effects (that is, unwanted effects; two studies); • frequency of hospitalization (two studies); • frequency of SCD‐related complications (three studies); • change in haemoglobin status (five studies).
The eight studies investigated different antioxidants: vitamin C plus E, zinc, N‐acetylcysteine (NAC), L‐arginine, and omega‐3.
Main findings
We are very uncertain whether vitamin C (1400 mg) plus vitamin E (800 mg) are better than placebo at reducing the frequency of crises or pain severity, or if they cause more unwanted effects (1 study, 83 participants). We are also uncertain whether vitamin C plus vitamin E are better than placebo at reducing SCD‐related health problems and increasing blood levels in people with SCD.
Zinc may not be better than placebo at reducing the frequency of crises but may result in a slight increase in blood level (1 study, 36 people). We are very uncertain about zinc's effects on SCD‐related complications such as leg ulcers (1 study, 34 participants).
NAC (1200 mg) may not be better than placebo at reducing the frequency of crises, severity of pain, and blood levels. We are very uncertain about its effect on quality of life, unwanted effects, frequency of hospitalization, and SCD‐related complications (1 study, 96 participants).
L‐arginine may not be better than placebo at reducing the frequency of crises (monthly pain) (1 study, 50 participants). However, L‐arginine may be better than placebo at reducing the severity of pain (2 studies, 125 participants). Also, the rate of unwanted events was similar in both treatment groups. L‐arginine may not be better than placebo at shortening hospital stay (2 studies, 125 participants) or increasing blood levels (2 studies, 106 participants).
We are uncertain whether omega‐3 causes more unwanted effects in people with SCD than placebo, or if it is better at increasing blood levels (1 study, 67 participants).
What are the limitations of the evidence?
Overall, we are not very confident about the effects of antioxidants in treating sickle cell disease because there were too few studies for each comparison to be certain about the results. We also had concerns about how some of the studies were conducted. Further research is likely to change these results.
How up to date is this evidence?
The evidence is current to 15 August 2023.
Summary of findings
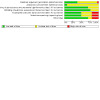
Summary of findings 1. Vitamin C 1400 mg plus vitamin E 800 mg versus placebo for sickle cell disease at up to six months.
| Vitamin C (1400 mg) + vitamin E (800 mg) versus placebo for sickle cell disease at up to six months | ||||||
| Patient or population: adults with sickle cell disease (adults with homozygous SCA or sickle beta 0 thalassaemia SCD) Setting: outpatient clinic Intervention: vitamin C 1400 mg plus vitamin E 800 mg Comparison: placebo | ||||||
| Outcomes | Anticipated absolute effects* (95% CI) | Relative effect (95% CI) | № of participants (studies) | Certainty of the evidence (GRADE) | Comments | |
| Risk with placebo | Risk with vitamin C 1400 mg + vitamin E 800 mg | |||||
| Frequency of pain crisis Follow‐up: up to 6 months |
Study population | RR 1.18 (0.64 to 2.18) | 83 (1 RCT) | ⊕⊝⊝⊝ Very lowa,b | ‐ | |
| 308 per 1000 |
363 per 1000 (197 to 671) |
|||||
| Severity of pain (use of opioid analgesics) Follow‐up: up to 6 months |
Study population | RR 1.33 (0.40 to 4.37) | 83 (1 RCT) | ⊕⊝⊝⊝ Very lowa,b | This outcome was also reported as number of participants using NSAIDs. | |
| 103 per 1000 |
136 per 1000 (41 to 448) |
|||||
| QoL of participants living with SCD and their caregivers | Not measured. | ‐ | ||||
| Adverse effects Follow‐up: up to 6 months |
Study population | RR 0.56 (0.31 to 1.00) | 83 (1 RCT) | ⊕⊝⊝⊝ Very lowa,b | The most commonly reported adverse effects were headache, nausea, fatigue, diarrhoea, epigastric pain. | |
| 487 per 1000 |
273 per 1000 (151 to 487) |
|||||
| Frequency of hospitalization | Not measured. | ‐ | ||||
| Frequency of sickle cell‐related complications: acute chest syndrome Follow‐up: up to 6 months |
Study population | RR 2.66 (CI 0.77 to 9.13) | 83 (1 RCT) | ⊕⊝⊝⊝ Very lowa,b | Other sickle cell‐related complications reported by the trial authors were stroke, priapism, leg ulcer healing, and blood transfusion. | |
| 0 out of 39 | 3 out of 44 | |||||
| Haemoglobin status (g/L) Follow‐up: up to 6 months |
The authors reported median (IQR) 90 g/L (81–96) in the vitamin C plus vitamin E group versus 93.5 g/L (84–105) in the placebo group. | 83 (1 RCT) | ⊕⊝⊝⊝ Very lowa,b | ‐ | ||
| *The risk in the intervention group (and its 95% CI) is based on the assumed risk in the comparison group and the relative effect of the intervention (and its 95% CI). CI: confidence interval; IQR: interquartile range; №: number; NSAIDs: non‐steroidal anti‐inflammatory drugs; QoL: quality of life; RCT: randomized controlled trial; RR: risk ratio; SCA: sickle cell anaemia; SCD: sickle cell disease | ||||||
| GRADE Working Group grades of evidence High certainty: we are very confident that the true effect lies close to that of the estimate of the effect. Moderate certainty: we are moderately confident in the effect estimate; the true effect is likely to be close to the estimate of the effect, but there is a possibility that it is substantially different. Low certainty: our confidence in the effect estimate is limited: the true effect may be substantially different from the estimate of the effect. Very low certainty: we have very little confidence in the effect estimate; the true effect is likely to be substantially different from the estimate of effect. | ||||||
aDowngraded by two levels for very serious risk of bias due to study limitations, such as unclear risk of bias for random sequence generation, selective reporting, and attrition bias. bDowngraded by one level for serious imprecision due to wide CI caused by low participant numbers from a single study.
Summary of findings 2. Zinc versus placebo for sickle cell disease at up to six months.
| Zinc versus placebo for sickle cell disease at up to six months | ||||||
| Patient or population: children and adults with sickle cell disease Setting: outpatient clinic Intervention: zinc Comparison: placebo | ||||||
| Outcomes | Anticipated absolute effects* (95% CI) | Relative effect (95% CI) | № of participants (studies) | Certainty of the evidence (GRADE) | Comments | |
| Risk with placebo | Risk with zinc | |||||
| Frequency of crisis Follow‐up: up to 6 months |
‐ | ‐ | Rate ratio 0.62 (0.17 to 2.29) | 36 (1 RCT) | ⊕⊕⊝⊝ Lowa,b | ‐ |
| Severity of pain | Not measured. | ‐ | ||||
| QoL of participants living with SCD and their caregivers | Not measured. | ‐ | ||||
| Adverse effects | Not measured. | ‐ | ||||
| Frequency of hospitalization | Not measured. | ‐ | ||||
| Frequency of sickle cell‐related complications: number of participants with completely healed leg ulcer (assessed with sq mm per day) Follow ‐up: up to 6 months |
Study population | RR 2.00 (0.60 to 6.72) | 34 (1 RCT) | ⊕⊝⊝⊝ Very lowb,c | ‐ | |
| The risk with placebo was 176 per 1000. | The risk with zinc was 353 per 1000 (106 to 1000). | |||||
| Haemoglobin status (g/dL) Follow‐up: up to 6 months |
The mean haemoglobin status was 6.19 g/dL. | The mean was 1.26 g/dL higher (0.44 higher to 1.26 higher). | MD 1.26 (0.44 to 1.26) | 36 (1 RCT) | ⊕⊕⊝⊝ Lowa,b | ‐ |
| *The risk in the intervention group (and its 95% CI) is based on the assumed risk in the comparison group and the relative effect of the intervention (and its 95% CI). CI: confidence interval; MD: mean difference; №: number; QoL: quality of life; RCT: randomized controlled trial; RR: risk ratio; SCD: sickle cell disease; sq mm: square millimetre | ||||||
| GRADE Working Group grades of evidence High certainty: we are very confident that the true effect lies close to that of the estimate of the effect. Moderate certainty: we are moderately confident in the effect estimate; the true effect is likely to be close to the estimate of the effect, but there is a possibility that it is substantially different. Low certainty: our confidence in the effect estimate is limited; the true effect may be substantially different from the estimate of the effect. Very low certainty: we have very little confidence in the effect estimate: the true effect is likely to be substantially different from the estimate of effect. | ||||||
aDowngraded by one level for serious risk of bias due to study limitations, such as unclear risk of bias for allocation concealment and incomplete outcome reporting. bDowngraded by one level for serious imprecision due to wide CI because of small sample size from a single study. cDowngraded by two levels for very serious risk of bias due to study limitations, such as high risk of bias for random sequence generation, incomplete outcome data, and selective reporting.
Summary of findings 3. N‐acetylcysteine (1200 mg) versus placebo for sickle cell disease at up to six months.
| N‐acetylcysteine (1200 mg) versus placebo for sickle cell disease at up to six months | ||||||
| Patient or population: sickle cell disease Setting: outpatient clinic Intervention: NAC 1200 mg Comparison: placebo | ||||||
| Outcomes | Anticipated absolute effects* (95% CI) | Relative effect (95% CI) | № of participants (studies) | Certainty of the evidence (GRADE) | Comments | |
| Risk with placebo | Risk with N‐acetylcysteine (NAC 1200 mg) | |||||
| Frequency of crisis (number of pain days) Follow‐up: up to 6 months |
‐ | ‐ | Rate ratio 0.99 (0.53 to 1.84) | 96 (1 RCT) | ⊕⊕⊝⊝ Lowa,b | Sins 2018 reported this outcome as the frequency of VOC. |
| Severity of pain (maximum pain intensity on pain days) Follow‐up: up to 6 months |
The mean severity of pain score when taking a placebo was 4.2. | The mean score when taking NAC 1200 mg was 0.17 higher (0.53 lower to 0.87 higher). | MD 0.17 (‐0.53 to 0.87) | 96 (1 RCT) | ⊕⊕⊝⊝ Lowa,b | Limited to participants with ≥ 3 pain days and excluding hospitalization days |
| QoL of participants living with SCD and their caregivers (measured using SF‐36 scale) Follow‐up: up to 6 months |
The mean score for the physical domain when taking a placebo was 1.4. | The mean score when taking NAC 1200 mg was 1.8 lower (5.01 lower to 1.41 higher). | MD ‐1.80 (‐5.01 to 1.41) | 96 (1 RCT) | ⊕⊝⊝⊝ Very lowa,c | ‐ |
| The mean score for the mental domain when taking a placebo was 0.7. | The mean score when taking NAC 1200 mg was 2.00 higher (1.45 lower to 5.45 higher). | MD 2.00 (‐1.45 to 5.45) | 96 (1 RCT) | ⊕⊝⊝⊝ Very lowa,c | ||
| Adverse effects Follow‐up: up to 6 months |
Study population | RR 0.92 (0.75 to 1.14) | 96 (1 RCT) | ⊕⊕⊝⊝ Lowa,b | ‐ | |
| The risk of any adverse effect was 813 per 1000. | The risk of any adverse effect was 748 per 1000 (609 to 926). | |||||
| Frequency of hospitalization Follow‐up: up to 6 months |
This outcome was reported by Sins 2018 as event rate per patient‐year (rate ratio 0.98, 95% CI 0.41 to 2.38). | 96 (1 RCT) | ⊕⊕⊝⊝ Lowa,b | ‐ | ||
| Frequency of sickle cell‐related complications (acute chest syndrome) Follow‐up: up to 6 months |
Study population | RR 5.00 (0.25 to 101.48) | 96 (1 RCT) | ⊕⊝⊝⊝ Very lowa,c | Other complications reported for this comparison were frequency of priapism and sequestration. | |
| 0 out of 48 | 2 out of 48 | |||||
| Haemoglobin status Follow‐up: up to 6 months |
The mean change in haemoglobin level when taking placebo was 0.06 g/dL. | The mean haemoglobin level when taking NAC 1200 mg was 0.18 g/dL lower (0.4 lower to 0.04 higher). | MD ‐0.18 (‐0.40 to 0.04) | 96 (1 RCT) | ⊕⊕⊝⊝ Lowa,b | ‐ |
| *The risk in the intervention group (and its 95% CI) is based on the assumed risk in the comparison group and the relative effect of the intervention (and its 95% CI). CI: confidence interval; MD: mean difference; NAC: N‐acetylcysteine; №: number; QoL: quality of life; RCT: randomized controlled trial; RR: risk ratio; SCD: sickle cell disease; SF‐36: 36‐item Short Form Health Survey; VOC: vaso‐occlusive crisis | ||||||
| GRADE Working Group grades of evidence High certainty: we are very confident that the true effect lies close to that of the estimate of the effect. Moderate certainty: we are moderately confident in the effect estimate; the true effect is likely to be close to the estimate of the effect, but there is a possibility that it is substantially different. Low certainty: our confidence in the effect estimate is limited; the true effect may be substantially different from the estimate of the effect. Very low certainty: we have very little confidence in the effect estimate: the true effect is likely to be substantially different from the estimate of effect. | ||||||
aDowngraded by one level for serious risk of bias due to study limitations, such as high risk of bias for incomplete outcome data. bDowngraded by one level due to serious imprecision because of wide CI. cDowngraded by two levels due to very serious imprecision because of wide CI.
Summary of findings 4. L‐arginine versus placebo for sickle cell disease at up to six months.
| L‐arginine versus placebo for sickle cell disease at up to six months | ||||||
| Patient or population: sickle cell disease Setting: inpatients and outpatients Intervention: L‐arginine Comparison: placebo | ||||||
| Outcomes | Anticipated absolute effects* (95% CI) | Relative effect (95% CI) | № of participants (studies) | Certainty of the evidence (GRADE) | Comments | |
| Risk with placebo | Risk with L‐arginine | |||||
| Frequency of crisis (monthly crisis) Follow‐up: up to 6 months |
Study population | RR 0.71 (0.26 to 1.95) | 50 (1 RCT) | ⊕⊕⊝⊝ Lowa,b | ‐ | |
| The risk of monthly crisis with placebo was 280 per 1000. | The risk of monthly crisis with L‐arginine was 196 per 1000 (73 to 546). | |||||
| Severity of pain (assessed using a 10‐cm visual analogue scale from 0 to 10; lower score is better) Follow‐up: up to 6 months |
The mean change in the severity of pain when taking placebo was ‐4.2. | The mean pain score when taking L‐arginine was 1.41 lower (1.65 lower to 1.18 lower). | MD ‐1.41 (‐1.65 to ‐1.18) | 125 (2 RCTs) | ⊕⊕⊝⊝ Lowc | Both RCTs also reported dose of opioids consumed. |
| QoL of participants living with SCD and their caregivers | Not measured. | ‐ | ||||
| Adverse effects Follow‐up: up to 6 months |
See comments | ‐ | 125 (2 RCTs) | ‐ |
Onalo 2021 reported that "the rate of adverse events was similar in both treatment groups: 71.4% vs. 78.8%, p=0.79 in the arginine versus placebo arm, respectively." The second study reported that a "total of 37 (54.4%) patients reported one or more adverse events, 19 patients in the arginine arm and 18 patients in the placebo arm" (Morris 2013). Morris 2013 also reported that one participant allocated to L‐arginine developed hives during infusion of L‐arginine, another experienced acute clinical deterioration and a participant in the placebo group had clinically relevant increases in liver function enzymes. |
|
| Frequency of hospitalization (number of days in hospital) Follow‐up: up to 6 months |
The mean number of days in hospital when taking placebo was 5.34 days. | The mean number of days in hospital when taking L‐arginine was 0.85 lower (1.87 lower to 0.17 higher). | MD ‐0.85 (‐1.87 to 0.17) | 125 (2 RCTs) | ⊕⊝⊝⊝ Very lowb,c | ‐ |
| Frequency of sickle cell‐related complications | Not measured. | ‐ | ||||
| Haemoglobin status (g/dL) Follow‐up: up to 6 months |
The mean change in haemoglobin level when taking placebo was ‐0.3 g/dL. | The mean change in haemoglobin level when taking L‐arginine was 0.40 higher (‐0.50 lower to 1.30 higher). | MD 0.40 (‐0.50 to 1.30) | 106 (2 RCTs) | ⊕⊕⊝⊝ Lowa,b | ‐ |
| *The risk in the intervention group (and its 95% CI) is based on the assumed risk in the comparison group and the relative effect of the intervention (and its 95% CI). CI: confidence interval; MD: mean difference; №: number; QoL: quality of life; RCT: randomized controlled trial; RR: risk ratio; SCD: sickle cell disease | ||||||
| GRADE Working Group grades of evidence High certainty: we are very confident that the true effect lies close to that of the estimate of the effect. Moderate certainty: we are moderately confident in the effect estimate; the true effect is likely to be close to the estimate of the effect, but there is a possibility that it is substantially different. Low certainty: our confidence in the effect estimate is limited; the true effect may be substantially different from the estimate of the effect. Very low certainty: we have very little confidence in the effect estimate; the true effect is likely to be substantially different from the estimate of effect. | ||||||
aDowngraded by one level for serious risk of bias due to unclear risk of bias for allocation concealment, selective reporting, and other bias. bDowngraded by one level due to wide CI involving harm and benefit. cDowngraded by two levels for very serious risk of bias due to high risk of bias for selective reporting and other bias, and unclear risk of bias for other domains.
Summary of findings 5. Omega‐3 versus placebo for sickle cell disease at up to six months.
| Omega‐3 versus placebo for sickle cell disease at up to six months | ||||||
| Patient or population: sickle cell disease Setting: outpatient clinic Intervention: omega‐3 Comparison: placebo | ||||||
| Outcomes | Anticipated absolute effects* (95% CI) | Relative effect (95% CI) | № of participants (studies) | Certainty of the evidence (GRADE) | Comments | |
| Risk with placebo | Risk with omega‐3 | |||||
| Frequency of crisis | Not measured. | ‐ | ||||
| Severity of pain | Not measured. | ‐ | ||||
| QoL of participants living with SCD and their caregivers | Not measured. | ‐ | ||||
| Adverse effects (any adverse effect) Follow‐up: up to six months |
Study population | RR 1.05 (0.74 to 1.48) | 67 (1 RCT) | ⊕⊝⊝⊝ Very lowa,b | Same author reported the number of participants with serious adverse events at six months (RR 0.60, 95% CI 0.33 to 1.11) (67 participants) | |
| The risk of a serious adverse effect was 706 per 1000 in the placebo group. | The risk of a serious adverse effect was 741 per 1000 (522 to 1000) in the omega‐3 group. | |||||
| Frequency of hospitalization | Not measured. | ‐ | ||||
| Frequency of sickle cell‐related complications | Not measured. | ‐ | ||||
| Haemoglobin status Follow‐up: at up to six months |
The mean haemoglobin level when taking placebo was 0.96 g/dL. | The mean haemoglobin levels when taking omega‐3 was 0.36 higher (0.21 lower to 0.93 higher). | MD 0.36 (‐0.21 to 0.93) | 67 (1 RCT) | ⊕⊝⊝⊝ Very lowa,b | ‐ |
| *The risk in the intervention group (and its 95% CI) is based on the assumed risk in the comparison group and the relative effect of the intervention (and its 95% CI). CI: confidence interval; MD: mean difference; №: number; QoL: quality of life; RCT: randomized controlled trial; RR: risk ratio; SCD: sickle cell disease | ||||||
| GRADE Working Group grades of evidence High certainty: we are very confident that the true effect lies close to that of the estimate of the effect. Moderate certainty: we are moderately confident in the effect estimate; the true effect is likely to be close to the estimate of the effect, but there is a possibility that it is substantially different. Low certainty: our confidence in the effect estimate is limited; the true effect may be substantially different from the estimate of the effect. Very low certainty: we have very little confidence in the effect estimate; the true effect is likely to be substantially different from the estimate of effect. | ||||||
aDowngraded by two levels for very serious risk of bias due to study limitations, such as unclear risk of bias for allocation concealment, high risk of bias for selective reporting, and other bias. bDowngraded by one level for serious imprecision due to wide CI involving benefit and harm, because of small sample size from a single study.
Background
See Appendix 1 for a glossary of terms.
Description of the condition
Sickle cell disease (SCD) is a group of genetic disorders characterized by the presence of an abnormal haemoglobin molecule known as haemoglobin S (HbS). The diverse genetic variants within the spectrum of SCD include HbSS, HbS beta‐thalassaemia, HbSC, and other related conditions where HbS is co‐inherited with another abnormal haemoglobin gene. Haemoglobin S arises from a point mutation in the gene encoding for the haemoglobin molecule, with adenine substituted for thymine at the sixth amino acid codon of the globin chain (Ingram 1958). This leads to the substitution of glutamic acid for valine, a hydrophobic amino acid. When exposed to low oxygen concentrations, the hydrophobic motifs of this abnormal haemoglobin tetramer are exposed, causing globin chains of different haemoglobin to bind together, forming polymers (Pauling 1949; Sundd 2018). This polymerization results in the stiffening of the cell membrane, a change in red cell rheology, and the formation of the notable crescent or sickle shape (Horiuchi 1996; Li 2017). The red blood cell (RBC) is able to revert from this shape as oxygen concentration improves; however, with repeated cycles of sickling and unsickling, the cells become less stable and are cleared from circulation by the spleen (Goodman 2004; Padilla 1973). The sickled red cells have damaged cell membranes and are prone to adhere to leucocytes immobilised on the activated endothelial cells as a result of the background chronic inflammatory process in SCD, leading to microvascular occlusion (Li 2017). Microvascular occlusion exacerbates deoxygenation and further sickling, initiating a vicious cycle of events referred to as 'sickle cell crises' (Li 2017; Sherman 1978).
The normal RBC can withstand the oxidants generated during physiological processes through natural antioxidants. RBCs containing HbS, however, suffer a great deal of oxidative stress, as HbS is more prone to autoxidation, generating more oxidative stress intracellularly, which overwhelms the protective mechanism and, in turn, causes lysis (or break down) of normal RBC. The ensuing haemolysis generates free haem and iron, leading to the formation of stronger oxidant molecules, such as hydroxyl radical (•OH) and ferryl Hb, through the H2O2‐dependent Fenton reaction (Vona 2021). The oxidative stress is worsened by the activation of neutrophils, with an increase in the expression of adhesion molecules and inflammatory cytokines. Antioxidants play a role in ameliorating this oxidative stress and improving the overall well‐being of an individual with SCD (Chirico 2012; Gizi 2011; Morris 2008).
Inflammation and reactive oxygen species (ROS) are linked with many chronic diseases, including SCD. While inflammatory cells generate ROS, ROS at physiologic concentrations can initiate an intracellular signalling cascade that enhances pro‐inflammatory gene expression. However, in excess, as may occur in SCD, it leads to oxidative stress, which may worsen the clinical manifestation of SCD. It also implies that the simultaneous existence of low‐grade chronic inflammation and oxidative stress can exist in SCD (Biswas 2016). The aetiology of this chronic inflammation is multifactorial and involves an increase in the number and phagocytic function of leukocytes, the elaboration of cytokine production (such as interleukin 1β, TNF‐α, and interleukin 6), and changes to the cell membrane (leading to the externalization of phosphatidylserine and an increased expression of adhesion molecules both on the surface of the RBC (CD36, integrin‐α4β1) and on the endothelial cells (e.g. VCAM1, ICAM 1, E‐selectin, P‐selectin)) (Chies 2001; Conran 2018). This leads to increased vaso‐occlusion with resultant ischaemia. Following reoxygenation, a reperfusion injury occurs, increasing the oxidative stress and the mopping up of nitric oxide by the free radicals, as well as further endothelial injury, the escalation of the chronic inflammatory state and vaso‐occlusion. These repetitive episodes of inflammation, ischaemia, and reperfusion injury have been linked to chronic organ damage, and understanding of the role of oxidative stress in painful episodes is evolving, though not yet proven (Antwi‐Boasiako 2019; Ballas 2012; Brandow 2017; Conran 2018; Nur 2011; Ware 2017; Wang 2021).
Description of the intervention
Sickle cell disease management follows a comprehensive care approach comprising pain management, other supportive care, and disease‐modifying therapies such as L‐glutamine, hydroxyurea, crizanzilumab, and voxeletor. While some of these therapies might possess some antioxidant effects, this is not their primary mechanism (Abdel‐Hadi 2023). An exception is L‐glutamine, included in this review for its antioxidant properties. Stem cell transplantation offers a curative treatment avenue, while gene therapy investigations continue for people with sickle cell disease (Abdel‐Hadi 2023).
The discovery of the antioxidant properties of supplements such as vitamins C and E created opportunities for studies on the range of uses for vitamins and other antioxidants. Many antioxidants are now used for managing conditions such as diabetes, malignancies, hypertension, and neurological and heart diseases (Ginter 2014). They exert their effect by countering the production of dangerous oxidants. In this review, we use the term 'antioxidant' for substances that have both direct and indirect antioxidant properties. Some of these substances have other known mechanisms of action unrelated to antioxidation.
Substances with direct antioxidant properties
Vitamin C. Also called ascorbic acid, vitamin C is a widely used, over‐the‐counter dietary supplement that exerts its antioxidant effects by acting as an electron donor for free radicals. This effect stabilizes the radicals and prevents them from causing damage (Didier 2023).
Vitamin E. A fat‐soluble antioxidant found in cell membranes, vitamin E prevents free radical damage by donating electrons. After donating its electron, vitamin E itself can act as a free radical. Vitamin C helps stabilize and regenerate its antioxidant properties. Vitamin E is often found in vegetable oils (Didier 2023).
Vitamin A and derivatives. Vitamin A can scavenge free radicals directly. The incorporation of retinol into cell membranes protects them from damage caused by free radicals and lipid peroxidation and regulates gene expression (Didier 2023; Wang 2021).
Arginine. Arganine is an amino acid that directly protects against oxidative damage by scavenging free radicals. It can be obtained from meat products, dairy products, nuts, and seeds. It is a source of nitric oxide and may also be involved in glutathione synthesis. L‐arginine can also upregulate the gene for HO‐1, GPx, and other natural antioxidant proteins through the activation of nuclear factor erythroid 2‐related factor 2 (NRF2) and the upregulation of antioxidant element‐dependent genes (Liang 2018).
Micronutrients (e.g. folate and zinc). Folate (including vitamin B9 and folic acid) is important for DNA synthesis. It scavenges oxidizing free radicals and inhibits lipid peroxidation. Sources include green leafy vegetables, liver, bread, yeast, and fruit (Joshi 2001). Zinc acts as a cofactor in DNA transcription and protein synthesis, and exhibits antioxidant properties by chelating or antagonizing transition metals such as iron and copper, neutralizing their ability to generate free radicals (Marreiro 2017; Powell 2000).
Glutamine. This amino acid serves as a precursor for molecules such as glutathione, which scavenge reactive oxygen species (ROS) directly or act indirectly through enzymes such as glutathione peroxidase and glutathione S‐transferase, both powerful endogenous antioxidants (Masella 2005; Nur 2011).
Carnitines (L‐carnitine, propionyl‐L‐carnitine). These derivatives reduce oxidative stress in the mitochondria and thus preserve their function. L‐carnitine, which transports fatty acids across mitochondrial membranes, also has a direct cleansing effect and provides indirect antioxidant effects through its anti‐inflammatory properties (Wang 2021).
Lipoic acid. Although lipoic acid does not belong to the phenol group, it also acts as an excellent hydrogen atom donor, especially in its dehydrated form (dihydrolipoic acid) (Wang 2021).
N‐acetylcysteine (NAC). N‐acetylcysteine has a direct antioxidant effect by acting as a free radical scavenger, metal chelator, and also as a precursor to glutathione. It is also known to have an anti‐inflammatory effect (Nur 2011).
Substances with indirect antioxidant properties
Omega‐3. Omega‐3 fatty acids (e.g. EPA (eicosapentaenoic acid) and DHA (docosahexaenoic acid)) are known for their diverse health benefits, including their potential antioxidant effects. Although they are not considered direct antioxidants like vitamins C or E, they can exert an antioxidant effect through various mechanisms, including reducing inflammation and increasing the expression of natural antioxidants, such as haem oxygenase 1 (HO‐1) (Meital 2019).
Niacin. Niacin is a precursor to NAD (nicotinamide adenine dinucleotide) and NADP (nicotinamide adenine dinucleotide phosphate). These two coenzymes are crucial for the function of antioxidant enzymes such as superoxide dismutase and catalase; thus, niacin indirectly promotes antioxidant status (Ilkhani 2016).
Arginine butyrate. Arginine butyrate exerts its antioxidant action by reducing inflammation and prompting epigenetic and translational changes in favour of the production of natural antioxidants (Amiri 2022).
Vitamin D. Although vitamin D has known antioxidant properties, it also has direct effects on bone disease unrelated to its antioxidant properties. As there is an existing Cochrane review on vitamin D supplementation for sickle cell disease (Soe 2020), we decided against including vitamin D in this review.
Antioxidants act through different mechanisms and at different sites, and therefore may have different clinical effects on SCD (e.g. vitamin C is hydrophilic and acts intracellularly, while vitamin E is lipophilic and acts on the membrane). Despite the overall expected benefits of antioxidants, they can be harmful under conditions where high levels of ROS are required to trigger apoptosis. This variability in the functional need for antioxidants may also influence the outcome of antioxidant therapy in people with SCD. Other factors affecting antioxidant activity include solubility in the food matrix; pH value; temperature; activation energy; rate constant; and oxidation‐reduction potential of the antioxidant (Brewer 2011; Kurutas 2016; Nawar 1996).
How the intervention might work
The production of ROS occurs in healthy individuals, but ROS are neutralized by the natural antioxidant mechanisms in the body. The role of some genetic modifiers in regulating oxidant stress has been elucidated in the literature. One of these is the nuclear factor erythroid 2‐related factor 2 (NRF‐2), which increases the transcription of several target genes responsible for the production of innate antioxidants (Pall 2015). In SCD, there is an increase in free radical generation from the increased activity of many oxidases, HbS auto‐oxidation, haem iron release, and decreases in nitric oxide concentrations (Aslan 2000). Studies have also reported a reduction in the natural protective mechanisms, such as superoxide dismutase, glutathione peroxidase, catalase, haem oxygenase, glutathione, vitamin C, and vitamin E (Antwi‐Boasiako 2019; Chirico 2012; Gizi 2011; Silva 2013). The reduction in these natural antioxidants may be related to the genetic modifiers referred to earlier. This shifts the balance towards the increased circulation of free radicals, resulting in increased haemolysis, endothelial damage, increased cell adhesion, hypercoagulability, vaso‐occlusion, altered gene expression via DNA methylation, and histone modifications (Chirico 2012; Nur 2011). The use of antioxidants, either direct‐ or indirect‐acting, could reverse or limit the progression of tissue damage and haemolysis in SCD by clearing free radicals (Belini 2012; Gizi 2011).
In clinical trials, antioxidants have been shown to be useful as an adjunct treatment in preventing tissue injury during cancer therapy and potentiating the anti‐tumour effects of chemotherapy (Thyagarajan 2018). The accumulation of free radicals and the consequent oxidation of biological molecules is considered one of the mechanisms in ageing. The use of antioxidants in preventing age‐related organ damage is currently being explored (Fusco 2007).
Why it is important to do this review
Sickle cell disease is the most common monogenic disorder and a major public health concern globally (Johnson 2016). It is estimated that more than 300,000 babies are born annually with the disease, with the majority of these being in sub‐Saharan Africa, where up to 2% of the population are affected (with the carrier state in some countries being as high as 30%) (WHO 2010). The high prevalence of HbS also mirrors the prevalence of malaria in this region (Macharia 2018; Piel 2010; Piel 2013). Although recent interventions have improved the survival of people with SCD, early childhood mortality in low‐income countries is still as high as 50% (Grosse 2011). SCD is characterised by the frequent punctuation of the steady‐state by crises (pain, sequestration, haemolysis, or aplastic), and long‐term complications can follow due to vaso‐occlusion and haemolysis. Frequently‐encountered complications include stroke, retinopathy, avascular necrosis (especially that of the femur), nephropathy, and pulmonary hypertension (Macharia 2018). Many interventions (including antioxidants) are being evaluated to improve the clinical outcome of people with SCD. To date, antioxidants have not been widely accepted as a treatment for managing SCD, given the conflicting evidence in clinical trials. However, they could be a low‐cost and accessible add‐on treatment for people with SCD and help to improve their quality of life (QoL). Therefore, it is important to review and synthesise the available evidence on the effect of antioxidants on clinical outcomes and the QoL of people with SCD.
Objectives
To assess the effectiveness and safety of antioxidant supplementation for improving health outcomes in people with SCD.
Methods
Criteria for considering studies for this review
Types of studies
We considered randomized controlled trials (RCTs) and quasi‐RCTs for inclusion. We considered a study as quasi‐randomized if investigators used inappropriate strategies (such as alternation) to allocate participants to intervention groups.
Types of participants
All genotypes of SCD were eligible for inclusion. We included participants with SCD (homozygous sickle cell anaemia (HbSS), HbS‐beta thalassaemia (HbSβºthal), sickle cell‐haemoglobin C (HbSc)), irrespective of age, gender, genotype, disease severity, comorbidities, or other concomitant drug therapies. For studies that recruited both SCD and non‐SCD participants (HbAA), we extracted data only for the subset of SCD participants when it was feasible to do so (i.e. where an included study presented data for SCD participants separately).
Types of interventions
We considered studies eligible if they compared antioxidants to placebo, usual care, or other antioxidants, irrespective of the dosage, frequency, and duration of the intervention. Antioxidants included in this review are: L‐glutamine; omega‐3; lipoic acid; zinc; N‐acetylcysteine; L‐arginine; niacin, arginine butyrate; vitamins A, C, and E; folic acids; and propionyl‐L‐carnitine (PLC). We also included studies that compared different dosages of the same antioxidant (vitamin A 3000 mg versus vitamin A 6000 mg, N‐acetylcysteine 1200 mg versus 2400 mg). See Description of the intervention.
Types of outcome measures
Primary outcomes
Frequency of crisis (defined as the number of painful episodes within a given period of time)
Severity of pain (as reported by study authors; for example, as number needing opioid analgesics or non‐steroidal anti‐inflammatory drugs (NSAIDs))
QoL of participants living with SCD and their caregivers (using a validated form; for example, the 36‐item Short Form Health Survey (SF‐36) questionnaire)
Secondary outcomes
Adverse effects (as reported by included studies)
Frequency of hospitalization
Frequency of SCD‐related complications (e.g. chronic organ damage, avascular necrosis, priapism)
Haemoglobin status
Laboratory markers of haemolysis and inflammation
We planned to group outcome data into three‐monthly intervals for the first 12 months and then annually thereafter. However, with the spread of data available in the included studies, we prioritized outcomes reported at time points up to six months (equal to or less than six months), at up to 12 months (seven months to 12 months), and at over 12 months.
Search methods for identification of studies
We searched for all relevant published and unpublished studies, without restrictions on language, year, or publication status, up to 15 August 2023.
Electronic searches
The Information Specialist for Cochrane Cystic Fibrosis (cf.cochrane.org/archive/about-cfgd-group-2023) conducted a search of the Group's Haemoglobinopathies Trials Register for relevant studies using the following terms: (sickle cell OR (haemoglobinopathies AND general)) AND (antioxidants).
The Haemoglobinopathies Trials Register is compiled from electronic searches of the Cochrane Central Register of Controlled Trials (CENTRAL) (updated each new issue of the Cochrane Library) and weekly searches of MEDLINE. Unpublished work is identified by searching the abstract books of five major conferences: the European Haematology Association conference; the American Society of Hematology conference; the British Society for Haematology Annual Scientific Meeting; the Caribbean Public Health Agency Annual Scientific Meeting (formerly the Caribbean Health Research Council Meeting); and the National Sickle Cell Disease Program Annual Meeting.
The most recent search date of the Cochrane Cystic Fibrosis and Genetic Disorders Group's Haemoglobinopathies Trials Register was 15 August 2023. The other databases searched were:
MEDLINE via PubMed (searched up to 15 August 2023; see Appendix 2);
Embase via OVID (searched 1969 to 15 August 2023; see Appendix 2);
US National Institutes of Health Ongoing Trials Register, Clinicaltrials.gov (www.clinicaltrials.gov; searched up to 15 August 2023; Appendix 3);
World Health Organization International Clinical Trials Registry Platform (WHO ICTRP;trialsearch.who.int; searched up to 15 August 2023; Appendix 3).
For details of our search strategies, please see the Appendices.
Searching other resources
We checked the reference lists of all relevant articles obtained from our search and those from previously published systematic reviews to identify additional articles. We also contacted the authors of included studies to request any additional information and unpublished data.
Data collection and analysis
We employed the standard methods of Cochrane Cystic Fibrosis and referred to the methods in the Cochrane Handbook of Systematic Reviews of Interventions (Higgins 2022a).
Selection of studies
Two review authors (ABB and ATO) checked for and removed duplicates and entered potentially eligible studies into Covidence (Covidence 2019). Two review authors (ABB and OEO) independently assessed abstracts and the full text of studies to determine which studies satisfied the inclusion criteria (Criteria for considering studies for this review). A third review author (JO) resolved any conflicts. The results are presented in a PRISMA flow diagram (Moher 2015).
Data extraction and management
Two review authors (ABB and ATO) independently extracted data using a standard data extraction form created in Microsoft Excel, and a third review author (OO) resolved conflicts.
We collected data on:
participant characteristics;
study characteristics and design;
interventions and comparator; and
outcome data – reported separately for each outcome.
We referred to Chapters 4 and 5 of the Cochrane Handbook of Systematic Reviews for Interventions (Lefebvre 2022; Li 2022). We contacted the authors of the included studies to request further information and clarification on incomplete data. When we identified multiple publications from a single study, we grouped these references together. One review author (OO) entered the extracted data into the Review Manager (RevMan) software for analysis (RevMan 2023). We had planned to group outcome data into three‐monthly intervals for the first 12 months and then annually thereafter. However, with the spread of data available in the included studies, we grouped outcomes into three time points and presented results in three intervals: at up to six months (equal to or less than six months), at up to 12 months (seven months to 12 months), and at over 12 months.
Assessment of risk of bias in included studies
Two review authors (ABB and AAO) assessed the risk of bias in each included study across seven domains, using the risk of bias tool (RoB 1), described in the Cochrane Handbook (Higgins 2017). These domains are:
sequence generation;
allocation concealment;
blinding of participants and personnel (self‐reported and objective);
blinding of outcome assessment (self‐reported and objective);
incomplete outcome data;
selective reporting; and
other potential sources of bias.
For each included study, we assessed each domain as having a 'low', 'unclear', or 'high' risk of bias. We resolved any discrepancies in assessment by discussion and achieved consensus with a third review author (OO).
Where a study described the randomization and allocation processes, including concealment from the researchers, and at least two review authors deem these to be adequate, we considered the study to have an overall low risk of bias. When these processes were inadequate or unclear, we deemed the study to have an overall high risk of bias or unclear risk of bias, respectively. We used the overall risk of bias of an outcome to feed into our GRADE assessment, such that where most information was from studies at low risk of bias (i.e. with no apparent limitations), our confidence in the results was not affected and we did not downgrade the certainty of the evidence.
We did not exclude studies based on risk of bias, but we would have performed a sensitivity analysis to explore the synthesis of evidence with variable quality if there was a need to do so.
Measures of treatment effect
We analysed pair‐wise comparisons of the treatment effect of the interventions compared to controls on all outcomes using the generic inverse‐variance approach in RevMan (RevMan 2023). For continuous outcomes, we reported the mean difference (MD) and standard deviation (SD) with their corresponding 95% confidence intervals (CI) (Deeks 2022). For binary data, we calculated the risk ratio (RR) with 95% CIs, using the crude number of events for dichotomous outcomes. We presented count data as a rate and calculated rate ratios with 95% CIs. Where trials presented results as an incidence rate ratio with its CI, we obtained the standard error (SE) from the CI using the formula described in Section 6.3.1 of the Cochrane Handbook (Higgins 2022b), and entered the result into RevMan to be plotted on a log scale (RevMan 2023).
Unit of analysis issues
The unit of analysis in all studies with a parallel‐group design was the individual participant. We did not identify any cross‐over studies or cluster‐randomized studies that met our inclusion criteria. Although some eligible studies had multiple study arms of interest, we extracted data from these arms and presented their effect estimates with their confidence interval independently, comparing each arm with the common comparator separately; we did not combine the data in meta‐analysis.
Dealing with missing data
Where there were insufficient or unclear data in the publication, we contacted the study authors to request additional information (Arruda 2012; Daak 2018). We assessed whether investigators had performed an intention‐to‐treat (ITT) analysis and reported the number of participants missing from each study arm, where possible. We analysed data according to the ITT principle (all randomized participants were analysed in the groups to which they were originally assigned) when the authors of included studies accounted for all included participants (Higgins 2022c).
Assessment of heterogeneity
We assessed heterogeneity between studies using the Chi² and I² statistics, and by visual inspection of the overlap in confidence intervals on the forest plots (Higgins 2003). For the Chi² test, a P value of less than 0.10 was considered as evidence of significant heterogeneity, while for the I² statistic, we applied the categories defined in the Cochrane Handbook for Systematic Reviews of Interventions (Deeks 2022):
0% to 40%: no heterogeneity;
30% to 60%: may represent moderate heterogeneity;
50% to 90%: may represent substantial heterogeneity; or
75% to 100%: considerable heterogeneity.
Assessment of reporting biases
We minimized reporting bias from the non‐publication of studies or selective outcome reporting by using a broad search strategy, which included searching study registries. We could not assess publication bias because we did not combine up to 10 studies in a meta‐analysis (Page 2022).
To assess for selective reporting, we compared study protocols (when feasible) with the reported outcomes in the study publication. Where a study protocol was unavailable, we compared the methods section and outcomes reported in the results section and with other similar studies. We recorded information on the sponsors and funding sources for studies and conflicts of interest of authors in order to assess for external bias.
Data synthesis
When possible, we combined studies in a meta‐analysis (Deeks 2022). We analysed the data using a fixed‐effect model where we expected homogeneity in the data across the studies. Where there was unexplained substantial heterogeneity between studies in a meta‐analysis (I2 > 50%), we repeated the analysis using a random‐effects model and downgraded the certainty of the evidence due to heterogeneity. For data presented as incidence rates, we calculated the incidence rate ratio and obtained the SE by using the formula square root (1/e1 +1/e2), where CI and P value were not reported, where 'e' was the number of events. Where studies presented results as an incidence rate ratio with its confidence interval, we obtained the SE from the CI using the formula described in the Cochrane Handbook (Higgins 2022b), and analysed these data using Review Manager 5 (RevMan 5) (Review Manager 5). We presented the main results of the review alongside a GRADE appraisal of the certainty of evidence.
Subgroup analysis and investigation of heterogeneity
We assessed statistical heterogeneity between subgroups by visually inspecting the forest plots for overlapping CIs, and by applying the Chi2 test and the I2 statistic.
Sensitivity analysis
We planned to conduct sensitivity analyses to assess the effect of the overall risk of bias by including or excluding those studies with an overall high risk of bias. However, this was not possible due to having very few included studies.
Summary of findings and assessment of the certainty of the evidence
We created summary of findings tables for the following comparisons, and presented outcomes reported at our prespecified shortest time point (up to six months):
vitamin C (1400 mg) + vitamin E (800 mg) versus placebo (Table 1);
zinc versus placebo (Table 2);
NAC (1200 mg) versus placebo (Table 3);
L'arginine versus placebo (Table 4); and
omega‐3 versus placebo (Table 5).
We prioritised seven review outcomes for inclusion in the summary of findings tables, based on clinical importance in patient care and management:
frequency of crisis;
severity of pain;
QoL (of participants living with SCD and their caregivers);
adverse effects;
frequency of hospitalization;
frequency of SCD‐related complications (e.g. chronic organ damage, avascular necrosis, priapism); and
haemoglobin status.
For the five key comparisons listed above, we presented outcomes reported at longer‐term time points (e.g. at up to 12 months, 18 months, or both), and other outcomes, in additional summary of findings tables (please see Appendix 4). We also created additional summary of findings tables for the remaining 12 comparisons, and presented the available data for the seven review outcomes listed above (please see Appendix 4).
Two authors (OO and JO) independently used the five GRADE considerations (study limitations, consistency of effect, imprecision, indirectness, and publication bias) to rate the certainty of the body of evidence identified for the seven prespecified outcomes that are relevant to clinicians and consumers (Schünemann 2022a). We resolved any differences through discussion to reach consensus.
We used methods and recommendations described in the Cochrane Handbook for Systematic Reviews of Interventions (Higgins 2017; Schünemann 2022b), employing GRADEpro GDT software (GRADEpro GDT 2015). We justified all decisions to downgrade the certainty of the evidence with comments in the footnotes.
Results
Description of studies
Results of the search
Our search yielded 5312 records through database searching and 17 records through searching other sources. After removing duplicates, we screened 5135 records by title and abstract and excluded 5031 records. We assessed 104 full‐text records and included 26 RCTs (from 61 reports) (Characteristics of included studies). We excluded 13 studies (from 14 reports) with reasons (Characteristics of excluded studies). A further 12 studies (from 14 reports) are ongoing (Characteristics of ongoing studies), and 15 records are awaiting classification because their texts were not available for assessment (Characteristics of studies awaiting classification). We have summarized the result of the screening process in a PRISMA diagram (Figure 1).
1.

PRISMA flow diagram
Included studies
Study design
All included studies were RCTs, except for one quasi‐RCT (Serjeant 1970).
Sample sizes
The 26 included studies involved 1609 participants (children and adults). The sample size for the studies varied from fewer than 20 participants (Koshy 2001; Nur 2012; Serjeant 1997; Tomer 2001), to fewer than 30 participants (Bao 2008; Brownell 2020; Fung 2002; McMahon 2010; Morris 2019; Pace 2003; Prasad 1984; Scoffone 2013; Serjeant 1970); some studies had a sample size of fewer than 100 participants (Arruda 2012; Daak 2018; Dougherty 2012; Eleuterio 2019; Martins 2009; Morris 2013; Onalo 2021; Styles 2007; Sins 2018). Only four studies included more than 100 participants (Daak 2013; Gupta 1995; Niihara 2018; Rabb 1983).
Setting
All studies except one, Onalo 2021, were carried out at sickle cell outpatient clinics. Three studies were conducted in Brazil (Arruda 2012; Eleuterio 2019; Martins 2009); one in Sudan (Daak 2013), one in Nigeria (Onalo 2021); three in Jamaica (Rabb 1983; Serjeant 1970; Serjeant 1997); two in the Netherlands (Sins 2018; Nur 2012), with Sins 2018 being a multicentre study conducted in the Netherlands, Belgium, and the UK; nine in the USA (Bao 2008; Brownell 2020; Daak 2018; Dougherty 2012; Fung 2002; Morris 2013; Niihara 2018; Pace 2003; Scoffone 2013), and one in India (Gupta 1995). We could not identify the study locations of six included RCTs because we could not access the full texts (Koshy 2001; McMahon 2010; Morris 2019; Prasad 1984; Styles 2007; Tomer 2001).
Participants
Populations were described for all 26 included studies. Eleven studies included both children and adults with SCD (Bao 2008; Brownell 2020; Daak 2013; Dougherty 2012; Koshy 2001; Morris 2013; Morris 2019; Niihara 2018; Pace 2003; Prasad 1984; Sins 2018). Four studies included only adults with SCD (Arruda 2012; Tomer 2001; Nur 2012; Scoffone 2013). Eight studies included only children with SCD (Daak 2018; Eleuterio 2019; Fung 2002; Gupta 1995; Martins 2009; Onalo 2021; Rabb 1983; Styles 2007). One study included adults with SCD who had leg ulcers (McMahon 2010). Another study included 34 people with leg ulcers; however, participants' ages were not clearly reported in the available text (Serjeant 1970). Finally, one study included 15 people with leg ulcers, aged 17 to 40 years (Serjeant 1997).
Interventions
The comparisons for each outcome varied greatly, which made meta‐analysis almost impossible. One study compared vitamin C 1400 mg/day plus vitamin E 800 mg/day versus placebo for six months (Arruda 2012). Five studies compared zinc acetate to placebo but varied in dosages and presentation (Bao 2008; Fung 2002; Gupta 1995; Prasad 1984; Serjeant 1970). One study compared vitamin A to placebo either alone or in combination with zinc acetate (Dougherty 2012), and a further study compared different doses of vitamin A (Brownell 2020). Three studies compared omega‐3 to placebo, with the comparison varying in formulation and doses (Daak 2013; Daak 2018; Tomer 2001). Five studies compared L‐arginine to placebo (Eleuterio 2019; Morris 2013; Morris 2019; Onalo 2021; Styles 2007). Two studies compared arginine butyrate to standard local care (usual care) (McMahon 2010; Koshy 2001). One study compared folic acid to calcium lactate as placebo (Rabb 1983). One study compared extended‐release niacin (niacin‐ER) to placebo (Scoffone 2013). One study compared alpha‐lipoic acid (ALA) 200 mg to placebo (Martins 2009). A further study had four arms and compared different doses of NAC to placebo (Pace 2003), while one conducted a head‐to‐head comparison of NAC to placebo (Sins 2018). One study compared two different doses of NAC (1200 mg versus 2400 mg) (Nur 2012). One study compared L‐glutamine to placebo (Niihara 2018). The final study was a pilot RCT that compared oral propionyl‐L‐carninitine (PLC) to placebo (Serjeant 1997).
Outcomes
All included studies evaluated one or more of our outcomes of interest except for Prasad 1984, which did not measure any outcome of interest to this review. However, the outcomes were not measured the same way across studies. It was common to have one study measure an outcome as dichotomous and another to measure the same outcome as continuous. We could not use the data available in the abstract of one study (Styles 2007): the abstract did not state the number of participants for each study arm, no full text publication was available, and no email address was available, so we could not contact the authors. We did obtain additional information from Onalo 2021 on the severity of pain.
Funding sources and conflicts of interest
All studies declared their source of funding except for five studies (Eleuterio 2019; Fung 2002; Koshy 2001; Rabb 1983; Tomer 2001), which provided no information on funding. Thirteen studies received public funding (Arruda 2012; Bao 2008; Brownell 2020;Dougherty 2012; Gupta 1995; Martins 2009; McMahon 2010; Morris 2013; Onalo 2021; Prasad 1984; Serjeant 1970; Sins 2018; Styles 2007). Four studies received funding from government and from a pharmaceutical company (Daak 2013; Morris 2019; Pace 2003; Scoffone 2013), and three studies received funding from pharmaceutical companies only (Daak 2018; Niihara 2018; Serjeant 1997). One study, Nur 2012, received no funding.
Three studies had conflicts of interest to declare (Daak 2018; Morris 2019; Niihara 2018); 11 studies did not provide any information about authors' conflicts of interest (Arruda 2012; Bao 2008; Fung 2002; Gupta 1995; Morris 2013; Scoffone 2013; Serjeant 1970; Styles 2007; Pace 2003; Prasad 1984; Serjeant 1997); while 10 studies declared authors had no conflicts of interest (Brownell 2020; Daak 2013; Dougherty 2012; Eleuterio 2019; Friedrisch 2016; Martins 2009; McMahon 2010; Nur 2012; Onalo 2021; Sins 2018); see Characteristics of included studies).
Excluded studies
We excluded 13 studies (from 14 reports) (Ajayi 1993; Eberhardt 2002; Elias 2013; Ghahramanlu 2014; Gordeuk 2018; Guddati 2018; Jaja 2002; Marealle 2018; Mirhosseini 2011; NCT00131508; Prasad 1999, Shiva 2018; Tschumi 1981). We excluded 11 studies due to an ineligible study design, one due to an ineligible population, and one because it was terminated due to slow recruitment.
Ongoing studies
We identified 12 ongoing studies (Datta 2019; EUCTR 2006‐005889‐40; IRCT20210715051904N1; NCT01202812; NCT01891292; NCT02525107; NCT04011345; NCT04301336; NCT04839354; NTR3806; RBR‐10r7d6f3; Williams 2020). The starting dates for the studies ranged from 2010 to 2022. Datta 2019 started in March 2019, and compared zinc to placebo in "Ugandan children aged 1.00‐4.99 years of age with SCA". EUCTR 2006‐005889‐40 started in November 2006 and is ongoing. IRCT20210715051904N1 started in February 2022, and involves combination therapy of L‐glutamine and hydroxyurea in participants aged five years and above with sickle‐cell syndrome. NCT01891292 is comparing enalapril to N‐acetylcysteine amongst children with SCD; the starting date is unknown. Two studies are assessing the effectiveness of omega‐3: NCT01202812 started in October 2010, and NCT02525107 started in September 2015 but the study's current status is unknown. NCT04011345 is evaluating folic acid supplementation (1 mg/day) in children with SCD; the starting date for the study was January 2020. NCT04301336 is a four‐arm study assessing zinc supplements, simvastatin, vitamin D, and omega‐3 (with all four experimental arms also receiving "standard care (e.g. hydroxyurea, folic acid supplementation, morphine sulfate)"), compared to the control condition of "standard care" alone. Recruitment started November 2019, and the participants are people with SCD. NCT04839354 is comparing arginine hydrochloride to placebo, amongst participants aged three to 21 years old who have SCD. It started in June 2021, and is recruiting until 2027. NTR3806 is assessing the effectiveness of N‐acetylcysteine; recruitment started in March 2013 and is still ongoing. RBR‐10r7d6f3 is comparing fish oil plus vitamin D supplementation to placebo; recruitment started in January 2018. Williams 2020 is comparing "1 mg/d folic acid, standard care, and placebo". There was no information about the starting date and the current status is unknown. The participants are children with SCD. See Characteristics of ongoing studies for further details.
Studies awaiting classification
We identified 15 studies that are now awaiting classification. We could not obtain the full texts of eight studies, despite contacting colleagues at other institutions and Cochrane centres (Abdelhalim 2022; Akinkugbe 1983; Brewer 1977; Friedrisch 2016; Gupta 1987a; Gupta 1987b; Koh 2005; Namazzi 2023). To our knowledge, the remaining seven studies have been completed (NCT00513617; NCT00586209; NCT01054768; NCT01849016; NCT03293641; NCT05371184; NCT04684381); however, they have not yet been published.
Risk of bias in included studies
We rated 13 included studies as having a high risk of bias overall (Daak 2013; Daak 2018; Fung 2002; Koshy 2001; Morris 2013; Niihara 2018; Nur 2012; Onalo 2021; Rabb 1983; Scoffone 2013; Serjeant 1970; Serjeant 1997; Sins 2018), and 13 studies as having an unclear risk of bias overall due to study limitations (Arruda 2012; Bao 2008; Brownell 2020; Dougherty 2012; Eleuterio 2019; Gupta 1995; Martins 2009; McMahon 2010; Morris 2019; Pace 2003; Prasad 1984; Styles 2007; Tomer 2001). See risk of bias summary (Figure 2) and risk of bias graph (Figure 3).
2.

Risk of bias summary: review authors' judgements about each risk of bias item for each included study.
3.
Risk of bias graph: review authors' judgements about each risk of bias item for each included study
Allocation
Sequence generation
We rated 10 studies as low risk of bias for sequence generation because methods used for assigning participants to treatment arms were unpredictable (Brownell 2020; Daak 2013; Daak 2018; Eleuterio 2019; Fung 2002; Gupta 1995; McMahon 2010; Morris 2013; Onalo 2021; Sins 2018); 15 studies as unclear because there was no information to make a judgement (Arruda 2012; Bao 2008; Dougherty 2012; Koshy 2001; Martins 2009; Morris 2019; Niihara 2018; Nur 2012; Pace 2003; Prasad 1984; Serjeant 1997; Scoffone 2013; Styles 2007; Rabb 1983; Tomer 2001); and one study as high risk because the authors allocated participants alternately to treatment and placebo groups (Serjeant 1970).
Allocation concealment
We rated two studies as having a low risk of bias for allocation concealment because the participants and investigators could not know the sequence of allocating the intervention (Brownell 2020; Sins 2018). We rated the remaining 24 studies as having an unclear risk of bias for this domain due to a lack of information (Arruda 2012; Bao 2008; Dougherty 2012; Daak 2013; Daak 2018; Eleuterio 2019; Fung 2002; Gupta 1995; Koshy 2001; Martins 2009; Morris 2013; Morris 2019; McMahon 2010; Niihara 2018; Nur 2012; Onalo 2021Pace 2003; Prasad 1984; Rabb 1983; Serjeant 1970; Serjeant 1997; Scoffone 2013; Styles 2007; Tomer 2001).
Blinding
For performance bias, we rated 18 studies as having a low risk of bias because study participants and personnel would not know which interventions they were taking (Arruda 2012; Bao 2008; Brownell 2020; Daak 2013; Daak 2018; Dougherty 2012; Eleuterio 2019; Fung 2002; Gupta 1995; Morris 2013; Niihara 2018; Onalo 2021; Pace 2003; Rabb 1983; Serjeant 1970; Serjeant 1997; Sins 2018; Tomer 2001), and eight studies as having an unclear risk of bias because no information was available to make a judgement (Koshy 2001; McMahon 2010; Martins 2009; Morris 2019; Nur 2012; Prasad 1984; Scoffone 2013; Styles 2007).
We rated 20 studies at low risk for detection bias because the assessors could not know which interventions study participants were taking. Six studies were rated as unclear risk for detection bias because no information was provided (Koshy 2001; Martins 2009; Morris 2019; Nur 2012; Prasad 1984; Scoffone 2013).
Incomplete outcome data
We rated 13 studies as low risk for attrition bias because missing data were properly accounted for (Bao 2008; Daak 2013; Daak 2018; Dougherty 2012; Martins 2009; McMahon 2010; Morris 2019; Niihara 2018; Onalo 2021; Pace 2003; Prasad 1984; Serjeant 1997; Tomer 2001). We assessed five studies as having a high risk of bias because they did not properly account for missing data (Fung 2002; Rabb 1983; Scoffone 2013; Serjeant 1970; Sins 2018). We rated eight studies as having an unclear risk of bias for this domain as the information provided was insufficient to make a judgement (Arruda 2012; Brownell 2020; Eleuterio 2019; Gupta 1995; Koshy 2001; Morris 2013; Nur 2012; Styles 2007).
Selective reporting
We rated 13 studies as having a low risk of reporting bias because the studies accounted for all participants randomised and all prespecified outcomes (Bao 2008; Brownell 2020; Dougherty 2012; Eleuterio 2019; Fung 2002; Gupta 1995; Martins 2009; McMahon 2010; Morris 2013; Morris 2019; Pace 2003; Serjeant 1997; Sins 2018); five studies as having a high risk of bias because data for some important outcomes were not properly reported for analysis or not reported all (Daak 2013; Daak 2018; Niihara 2018; Nur 2012; Onalo 2021); and eight studies as unclear risk because there was insufficient information to make a judgement (Arruda 2012; Koshy 2001; Prasad 1984; Rabb 1983; Scoffone 2013; Serjeant 1970; Styles 2007; Tomer 2001).
Other potential sources of bias
We rated 18 studies as having a low risk of bias for this domain because we did not suspect other bias (Arruda 2012; Bao 2008; Brownell 2020; Daak 2013; Dougherty 2012; Fung 2002; Gupta 1995; Martins 2009; Morris 2019; Niihara 2018; Nur 2012; Pace 2003; Prasad 1984; Rabb 1983; Scoffone 2013; Serjeant 1970; Sins 2018; Tomer 2001). We assessed three studies as having an unclear risk of bias because there was insufficient information to make a judgement (Eleuterio 2019; McMahon 2010; Styles 2007). We assessed five studies as having a high risk of bias for the following reasons. Daak 2018 was sponsored by a pharmaceutical company. When we asked the authors for additional data, we were informed that the funder had the data. In Morris 2013, two of the three participants who withdrew from the control arm were included in the analysis for the primary outcome but not for other outcomes. In contrast, none of the two participants who withdrew from the L‐arginine group were included in the final analysis. In Onalo 2021, the scale used to assess pain was not clearly stated. The authors of the Koshy 2001 study did not provide the P value or SD for data analysis. They also reported that the intervention group received "Local care + Butyrate (500 mg/kg dose or 750 mg/kg dose)", but did not report how many received each dosage (Koshy 2001). Finally, in Serjeant 1997, the authors deviated from the study protocol.
Effects of interventions
See: Table 1; Table 2; Table 3; Table 4; Table 5
We have structured this section by grouping the comparisons into four categories:
antioxidants versus placebo (13 separate comparisons; 21 studies);
one antioxidant versus another antioxidant (1 comparison, 1 study: vitamin A versus vitamin A plus zinc)
antioxidants versus standard local care (1 comparison; 2 studies);
two different doses of the same antioxidant (2 comparisons; 3 studies).
Two multi‐armed studies contributed to more than one comparison (Dougherty 2012; Pace 2003). As noted in the Methods section (see Summary of findings and assessment of the certainty of the evidence), we created summary of findings tables for five key comparisons, all of which are from the first comparison category of antioxidant versus placebo:
vitamin C (1400 mg) plus vitamin E (800 mg) versus placebo (Table 1);
zinc versus placebo (Table 2);
NAC (1200 mg) versus placebo (Table 3);
L'arginine versus placebo (Table 4); and
omega‐3 versus placebo (Table 5).
We assessed the evidence at up to six months for each comparison, and graded the certainty of the evidence. Additional summary of findings tables for other comparisons and other time points are presented as additional tables and can be viewed in Appendix 4.
Comparison group A: antioxidants versus placebo
1. L‐glutamine versus placebo
For this comparison, we found one study involving 230 participants (Niihara 2018). See Table 6 in Appendix 4 for GRADE judgements for this comparison.
1. Summary of findings: L‐glutamine versus placebo for sickle cell disease at up to 12 months.
| L‐glutamine versus placebo for sickle cell disease at up to 12 months | ||||||
|
Patient or population: sickle cell disease Setting: outpatient clinic Intervention: L‐glutamine Comparison: placebo | ||||||
| Outcomes | Anticipated absolute effects* (95% CI) | Relative effect (95% CI) | № of participants (studies) | Certainty of the evidence (GRADE) | Comments | |
| Risk with placebo | Risk with L‐glutamine | |||||
| Frequency of crisis (number of pain crises) Follow‐up: 12 months |
The mean frequency of crisis was 3.9 | The mean score in the intervention group was 0.7 lower (1.37 lower to 0.03 lower) | ‐ | 230 (1 RCT) | ⨁◯◯◯ Very lowa,b | ‐ |
| Severity of pain | Not measured. | |||||
| QoL of participants living with SCD and their caregivers | Not measured. | |||||
| Adverse effects Follow‐up: 12 months |
"The rate of adverse events was higher in the placebo group than in the l‐glutamine group (100% vs. 98.0%), as was the rate of serious adverse events (87.1% vs. 78.2%)." | 230 (1 RCT) | ⨁◯◯◯ Very lowa,b | ‐ | ||
| Frequency of hospitalization Follow‐up: 12 months |
The mean frequency of hospitalisation was 0 | The mean score in the intervention group was 0.7 lower (1.31 lower to 0.09 lower) | ‐ | 230 (1 RCT) | ⨁◯◯◯ Very lowa,b | ‐ |
| Frequency of sickle cell‐related complications: acute chest syndrome Follow‐up: 12 months |
231 per 1000 | 85 per 1000 (44 to 166) | RR 0.37 (0.19 to 0.72) | 230 (1 RCT) | ⨁◯◯◯ Very lowa,b | ‐ |
| Haemoglobin status (g/L) | Not measured. | |||||
| *The risk in the intervention group (and its 95% CI) is based on the assumed risk in the comparison group and the relative effect of the intervention (and its 95% CI). CI: confidence interval; №: number; QoL: quality of life; RCT: randomized controlled trial; RR: risk ratio; vs: versus. | ||||||
| GRADE Working Group grades of evidence High certainty: we are very confident that the true effect lies close to that of the estimate of the effect. Moderate certainty: we are moderately confident in the effect estimate; the true effect is likely to be close to the estimate of the effect, but there is a possibility that it is substantially different. Low certainty: our confidence in the effect estimate is limited; the true effect may be substantially different from the estimate of the effect. Very low certainty: we have very little confidence in the effect estimate; the true effect is likely to be substantially different from the estimate of effect. | ||||||
aDowngraded by two levels for serious risk of bias due to study limitations such as unclear risk of bias for allocation sequence generation and concealment, and high risk of bias for selective reporting. bDowngraded by one level for serious imprecision due to wide CI.
Primary outcomes
Frequency of crisis
The study reported the mean number of pain crises at up to 12 months. L‐glutamine may result in a slight reduction in the mean frequency of pain crisis compared to placebo (mean difference (MD) ‐0.70, 95% CI ‐1.37 to ‐0.03; 1 study, 230 participants; very low‐certainty evidence; Analysis 1.1), but the evidence is very uncertain.
1.1. Analysis.

Comparison 1: L‐glutamine with hydroxyurea versus placebo with hydroxyurea, Outcome 1: Frequency of crisis (mean number of pain crises)
Severity of pain
The included study did not report on this outcome.
QoL of participants living with SCD and their caregivers
The included study did not report on this outcome.
Secondary outcomes
Adverse effects
The study authors reported, "The rate of adverse events (AE) may not be different in the L‐glutamine group compared [to] placebo (100% vs. 98.0%), as was the rate of serious adverse events (87.1% vs. 78.2%)" (1 study, 230 participants; very low‐certainty evidence), but the evidence is very uncertain.
Frequency of hospitalization
The included study reported the mean number of days in the hospital and the mean cumulative number of days in the hospital. At up to 12 months, we are very uncertain of the effect of L‐glutamine in reducing the duration of hospitalization (MD ‐0.70 days, 95% CI ‐1.31 to ‐0.09; 1 study, 230 participants; very low‐certainty evidence), the mean cumulative number of days spent in the hospital (MD ‐6.00 days, 95% CI ‐12.63 to 0.63; 1 study, 230 participants; very low‐certainty evidence), as well as the number of emergency clinic visits (MD ‐0.40 visits, 95% CI ‐0.96 to 0.16; 1 study, 230 participants; very low‐certainty evidence; Analysis 1.2).
1.2. Analysis.

Comparison 1: L‐glutamine with hydroxyurea versus placebo with hydroxyurea, Outcome 2: Frequency of hospitalisation
Frequency of SCD‐related complications
This study reported this outcome as the number of participants experiencing acute chest syndrome. L‐glutamine may be better than placebo at reducing the risk of acute chest syndrome at up to 12 months (risk ratio (RR) 0.37, 95% CI 0.19 to 0.72; 1 study, 230 participants; very low‐certainty evidence; Analysis 1.3); however, the evidence is very uncertain.
1.3. Analysis.

Comparison 1: L‐glutamine with hydroxyurea versus placebo with hydroxyurea, Outcome 3: SCD‐related complications (number of participants)
Haemoglobin status
The included study did not report on this outcome.
Laboratory markers of haemolysis and inflammation
The included study did not report on this outcome.
2. Vitamin C (1400 mg) plus vitamin E (800 mg) versus placebo
This comparison consists of one study with 83 participants (Arruda 2012). See Table 1 for GRADE judgements for this comparison.
Primary outcomes
Frequency of crisis
The study reported the number of participants experiencing a pain crisis at up to six months. We are very uncertain whether vitamin C (1400 mg) plus vitamin E (800 mg) is better than placebo at reducing the risk of crisis in people with SCD at up to six months (RR 1.18, 95% CI 0.64 to 2.18; 1 study, 83 participants; very low‐certainty evidence; Analysis 2.1).
2.1. Analysis.

Comparison 2: Vitamin C (1400 mg) + vitamin E (800 mg) versus placebo, Outcome 1: Frequency of crisis (number of participants with pain crisis)
Severity of pain
The study reported data relevant to this outcome as the number of participants using opioid analgesia and the number using non‐steroidal anti‐inflammatory drugs (NSAIDs). We are very uncertain whether vitamin C (1400 mg) plus vitamin E (800 mg) is better than placebo at reducing opioid use at up to six months (RR 1.33, 95% CI 0.40 to 4.37; 1 study, 83 participants; very low‐certainty evidence; Analysis 2.2) or the use of NSAIDs (RR 1.06, 95% CI 0.62 to 1.81; 1 study, 83 participants; very low‐certainty evidence; Analysis 2.2).
2.2. Analysis.

Comparison 2: Vitamin C (1400 mg) + vitamin E (800 mg) versus placebo, Outcome 2: Severity of pain
QoL of participants living with SCD and their caregivers
The study did not measure this outcome.
Secondary outcomes
Adverse effects (AEs)
The study authors reported that, at up to six months, "the most common AEs reported in the vitamins group were headache (18% vitamins versus 10% placebo, P = 0.36), nausea (14% vitamins versus 10% placebo, P = 0.74), fatigue (11% vitamins versus 13% placebo, P = 1), diarrhoea (7% vitamins versus 0% placebo, P = 0.24), epigastric pain (5% vitamins and placebo, P = 1), with no significant differences in the incidence rates between the two groups for any reported adverse event". We contacted the study authors for additional information on the actual number of adverse effects per treatment arm and entered the data we received in our analysis. We are very uncertain whether vitamin C plus vitamin E cause AEs in people with SCD compared to placebo (RR 0.56, 95% CI 0.31 to 1.00; 1 study, 83 participants; very low‐certainty evidence; Analysis 2.3).
2.3. Analysis.

Comparison 2: Vitamin C (1400 mg) + vitamin E (800 mg) versus placebo, Outcome 3: Adverse events
Frequency of hospitalization
This outcome was not reported.
Frequency of SCD‐related complications
Investigators reported the number of participants experiencing the following complications at up to six months: acute chest syndrome (RR 2.66, 95% CI 0.77 to 9.13; 1 study, 83 participants; Analysis 2.4); priapism (RR 0.89, 95% CI 0.06 to 13.70; 1 study, 83 participants; Analysis 2.4); stroke (RR 4.44, 95% CI 0.22 to 89.84; 1 study, 83 participants; Analysis 2.4); leg ulcer healing (RR 6.22, 95% CI 0.33 to 116.81; 1 study, 83 participants; Analysis 2.4); and blood transfusion (RR 1.11, 95% CI 0.49 to 2.52; 1 study, 83 participants; Analysis 2.4). The frequency of SCD‐related complications was higher in the vitamin group than in the placebo group. Given the very low certainty of the evidence for this outcome, we are uncertain whether vitamin C plus vitamin E is better than placebo at reducing the frequency of SCD‐related complications.
2.4. Analysis.
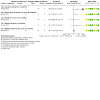
Comparison 2: Vitamin C (1400 mg) + vitamin E (800 mg) versus placebo, Outcome 4: SCD‐related complications (number of participants)
Haemoglobin status
The authors reported median (interquartile range (IQR)) haemoglobin levels of 90 g/L (81 to 96) in the vitamin C plus vitamin E group versus 93.5 g/L (84 to 105) in the placebo group at six months post‐intervention. We were unable to enter the data into our analyses in the reported format. We are very uncertain whether vitamin C plus vitamin E is better than placebo at improving the haemoglobin status of people with SCD at up to six months (1 study, 83 participants; very low‐certainty evidence).
Laboratory markers of haemolysis and inflammation
The laboratory parameters reported for this outcome at up to six months were also reported as median (IQR) (see Table 7). The median (IQR) of neutrophils (white blood cells (WBC)) when taking vitamin C 1400 mg plus vitamin E 800 mg was 4.96 x 10⁹/L (2.75 to 5.91) compared to 4.08 x 10⁹/L (2.68 to 5.63) with placebo (1 study, 83 participants; very low‐certainty evidence); for reticulocytes count with vitamin C 1400 mg plus vitamin E 800 mg, it was median (IQR) 193 x 109/L (118 to 370) compared to 142 x 109/L (971 to 259); and for haemoglobin, with vitamin C 1400 mg plus vitamin E 800 mg, it was median (IQR) 90 x 109/L (81 to 96) compared to 93.5 x 10⁹/L (84 to 105) with placebo (1 study, 83 participants; very low‐certainty evidence). Also, the median (IQR) lactate dehydrogenase (LDH) level was 474 units per litre (u/L) (318 to 651) in the vitamin C 1400 mg plus vitamin E 800 mg compared to 390 u/L (303 to 599) with placebo (1 study, 83 participants; very low‐certainty evidence). We are very uncertain whether vitamin C plus vitamin E is better than placebo at improving laboratory markers of haemolysis and inflammation (see Table 7).
2. Vitamin C (1400 mg) + vitamin E (800 mg) versus placebo for sickle cell disease at up to six months.
| Arruda 2012 | ||||||||
| Laboratory parameter | Intervention | N | Baseline median (IQR) | Day 90 median (IQR) | P value | N | Day 180 median (IQR) | P value |
| Haemoglobin (g/L) | Placebo | 39 | 95 (82–103) | 93 (85–101) | 0.23 | 34 | 93.5 (84–105) | 0.62 |
| Vitamin C + E | 44 | 89 (82–97) | 88 (79–95) | 0.62 | 37 | 90 (81–96) | 0.07 | |
| Reticulocytes (x 109/L) | Placebo | 39 | 193 (100–260) | 153 (787–239) | 0.14 | 34 | 142 (971–259) | 0.91 |
| Vitamin C + E | 44 | 152 (564–237) | 162 (749–228) | 0.82 | 37 | 193 (118–370) | 0.02 | |
| Lactate dehydrogenase (u/L) | Placebo | 39 | 366 (272–675) | 397 (290–652) | 0.5 | 34 | 390 (303–599) | 0.70 |
| Vitamin C + E | 44 | 396 (2768–564) | 3845 (302–568) | 0.11 | 37 | 474 (318–651) | 0.04 | |
| Neutrophils (x 109/L) | Placebo | 39 | 4.28 (2.44‐6.19) | 4.63 (6.18‐12.40) | 0.33 | 34 | 4.08 (2.68‐5.63) | 0.72 |
| Vitamin C + E | 44 | 4.24 (2.46‐5.76) | 4.23 (6.25‐10.65) | 0.73 | 37 | 4.96 (2.75‐5.91) | 0.02 | |
ID: identifier; IQR: interquartile range; N: number of participants
3. Zinc versus placebo
This comparison included five studies (269 participants) (Bao 2008; Fung 2002; Gupta 1995; Prasad 1984; Serjeant 1970). However, one study did not measure our outcomes of interest (Prasad 1984). See Table 2 and Table 8 in Appendix 4 for GRADE judgements for this comparison.
3. Summary of findings: Zinc versus placebo for sickle cell disease at up to 18 months.
| Zinc versus placebo for sickle cell disease at up to 18 months | ||||||
|
Patient or population: sickle cell disease Setting: outpatient clinic Intervention: zinc Comparison: placebo | ||||||
| Outcomes | Anticipated absolute effects* (95% CI) | Relative effect (95% CI) | № of participants (studies) | Certainty of the evidence (GRADE) | Comments | |
| Risk with placebo | Risk with zinc | |||||
| Frequency of crisis: VOC Follow‐up: 18 months | ‐ | ‐ | Rate ratio 0.68 (0.53 to 0.87) | 130 (1 RCT) | ⨁⨁⨁◯ Moderatea |
‐ |
| Severity of pain Follow‐up: 18 months |
Not measured for this time point | |||||
| QoL of participants living with SCD and their caregivers (loss of work days/crisis) Follow‐up: 18 months | The mean loss of work days/crisis when taking placebo was 4.9 days/crisis | The mean loss of work days/crisis when taking zinc was 1.5 days/crisis lower (2.24 lower to 0.76 lower) | MD ‐1.5 (‐2.24 to ‐0.76) | 130 (1 RCT) | ⨁⨁◯◯ Lowa,b | ‐ |
| Adverse effects | Not measured. | |||||
| Frequency of hospitalization: hospital stay/crisis Follow‐up: 18 months | The mean frequency of hospital stay/crisis when taking placebo was 3.9days | The mean frequency of hospital stay/crisis when taking zinc was 0.4 days higher (0.26 lower to 1.06 higher) | MD 0.4 days (‐0.26 to 1.06) | 130 (1 RCT) | ⨁⨁◯◯ Lowa,b | Frequency of hospitalizations reported as the mean hospital stay/crisis which was the number of days spent in the hospital per crisis |
| Frequency of sickle cell‐related complications: haemolytic crisis Follow‐up: 18 months | ‐ | ‐ | Rate ratio 0.69 (0.39 to 1.22) | 130 (1 RCT) | ⨁⨁◯◯ Lowa,b | The risk of haemolytic crisis and sequestration were also reported for this time point. |
| Haemoglobin status (%) Follow‐up: 18 months | The mean haemoglobin level when taking placebo was 68% | The mean haemoglobin with zinc was 11% higher (10.18 higher to 11.82 higher) | MD 11% (10.18 to 11.82 ) | 130 (1 RCT) | ⨁⨁⨁◯ Moderatea |
‐ |
| *The risk in the intervention group (and its 95% CI) is based on the assumed risk in the comparison group and the relative effect of the intervention (and its 95% CI). CI: confidence interval; MD: mean difference; №: number; RCT: randomized controlled trial; RR: risk ratio; SCD: sickle cell disease; VOC: vaso‐occlusive crisis | ||||||
| GRADE Working Group grades of evidence High certainty: we are very confident that the true effect lies close to that of the estimate of the effect. Moderate certainty: we are moderately confident in the effect estimate; the true effect is likely to be close to the estimate of the effect, but there is a possibility that it is substantially different. Low certainty: our confidence in the effect estimate is limited; the true effect may be substantially different from the estimate of the effect. Very low certainty: we have very little confidence in the effect estimate; the true effect is likely to be substantially different from the estimate of effect. | ||||||
aDowngraded by one level for risk of bias as we rated the study (Gupta 1995) as having unclear risk of bias for allocation concealment, attrition, and selective reporting. bDowngraded by one level for serious imprecision due to wide CI involving harm and benefit.
Primary outcomes
Frequency of crisis
Two studies (166 participants) reported this outcome (Bao 2008; Gupta 1995). Bao 2008 reported this outcome as count data (number of crisis episodes) and we calculated the rate ratio with its CI, as described above in the Methods section. Zinc may not be better than placebo at reducing the frequency of crisis at up to six months (rate ratio 0.62, 95% CI 0.17 to 2.29; 1 study, 36 participants; low‐certainty evidence; Analysis 3.1).
3.1. Analysis.

Comparison 3: Zinc versus placebo, Outcome 1: Frequency of crisis (number of VOC episodes)
At 18 months, Gupta 1995 reported the rate of episodes of vaso‐occlusive crisis (VOC). Zinc is probably better at reducing the rate of episodes of VOC compared to placebo (rate ratio 0.68, 95% CI 0.53 to 0.87; 1 study, 130 participants; moderate‐certainty evidence). However, zinc may not be better than placebo at reducing all episodes of crisis at over 12 months (rate ratio 0.72, 95% CI 0.09 to 5.66; 1 study, 130 participants; low‐certainty evidence; Analysis 3.1).
Gupta 1995 also reported the mean frequency of pain crises in each group at over 12 months, and showed zinc is probably better than placebo at reducing the mean frequency of pain crisis at over 12 months (MD ‐2.83, 95% CI ‐3.51 to ‐2.15; 1 study, 130 participants; moderate‐certainty evidence; Analysis 3.2).
3.2. Analysis.

Comparison 3: Zinc versus placebo, Outcome 2: Frequency of crisis (mean number of pain crises)
Severity of pain
The included studies did not report on this outcome.
QoL of participants living with SCD and their caregivers
Only one study (130 participants) reported on this outcome in terms of "loss of work days" per crisis (number of days lost due to each crisis) (Gupta 1995). Zinc may be better at reducing lost work days compared to placebo at 18 months (MD ‐1.50 days, 95% CI ‐2.24 to ‐0.76; 1 study, 130 participants; low‐certainty evidence; Analysis 3.3).
3.3. Analysis.

Comparison 3: Zinc versus placebo, Outcome 3: QoL of participants living with SCD and their caregivers
Secondary outcomes
Adverse effects
The included studies did not report on this outcome.
Frequency of hospitalization
One study (130 participants) reported on the frequency of hospitalizations, as mean hospital stay/crisis, which was the number of days spent in the hospital per crisis (Gupta 1995). Zinc may not reduce the frequency of hospitalization in SCD compared to placebo at 18 months (MD 0.40, 95% CI ‐0.26 to 1.06; 1 study, 130 participants; low‐certainty evidence; Analysis 3.4).
3.4. Analysis.

Comparison 3: Zinc versus placebo, Outcome 4: Frequency of hospitalization
Frequency of SCD‐related complications
Three studies (200 participants) reported on SCD‐related complications (Bao 2008; Gupta 1995; Serjeant 1970). We are very uncertain whether zinc is better than placebo at improving leg ulcers (mm2 per day) at six months (RR 1.63, 95% CI 0.92 to 2.87; 1 study (Serjeant 1970), 34 participants; very low‐certainty evidence) or is more effective for complete healing of leg ulcers (RR 2.00, 95% CI 0.60 to 6.72; 1 study, 34 participants; very low‐certainty evidence; Analysis 3.5).
3.5. Analysis.

Comparison 3: Zinc versus placebo, Outcome 5: SCD‐related complications (sq mm per day)
Gupta 1995 and Bao 2008 reported other complications. Zinc may be better at reducing the risk of infections than placebo at six months (rate ratio 0.06, 95% CI 0.01 to 0.54; 1 study (Bao 2008), 36 participants; very low‐certainty evidence; Analysis 3.6). Based on data from Gupta 1995 at over 18 months, low‐certainty evidence showed that, compared to placebo, zinc may not be better at reducing the risk of sequestration (rate ratio 1.00, 95% CI 0.45 to 2.23; 1 study, 130 participants; Analysis 3.7), haemolytic crisis (rate ratio 0.69, 95% CI 0.39 to 1.22.70; 1 study, 130 participants; Analysis 3.7), and aplastic crisis (rate ratio 0.74, 95% CI 0.14 to 4.04; 1 study, 130 participants; Analysis 3.7).
3.6. Analysis.

Comparison 3: Zinc versus placebo, Outcome 6: Frequency of SCD‐related complications (number of participants with infections) at 6 months
3.7. Analysis.

Comparison 3: Zinc versus placebo, Outcome 7: SCD‐related complications (other)
Haemoglobin status
Two studies (166 participants) reported on this outcome (Bao 2008; Gupta 1995). Bao 2008 reported haemoglobin in g/dL, and showed that zinc may result in a slight increase in haemoglobin level (g/dL) compared to placebo in people with SCD at up to six months (MD 1.26 (g/dL), 95% CI 0.44 to 1.26; 1 study, 36 participants; low‐certainty evidence; Analysis 3.8). Gupta 1995 reported haemoglobin level in percentage at 18 months, and found that zinc probably increased haemoglobin level compared to placebo at this time point (MD 11.00%, 95% CI 10.18 to 11.82; 1 study, 130 participants; moderate‐certainty evidence; Analysis 3.9).
3.8. Analysis.

Comparison 3: Zinc versus placebo, Outcome 8: Haemoglobin status (g/dL) (at up to 6 months)
3.9. Analysis.

Comparison 3: Zinc versus placebo, Outcome 9: Haemoglobin % (at over 12 months)
Laboratory markers of haemolysis and inflammation
Three studies (208 participants) reported on laboratory markers of haemolysis and inflammation (Bao 2008; Fung 2002; Gupta 1995).
The evidence is uncertain whether zinc is better than placebo at reducing total white blood cells at up to six months (MD 1.03 x 10³/L, 95% CI ‐1.57 to 3.63; 1 study (Bao 2008), 36 participants; very low‐certainty evidence; Analysis 3.10). In addition, at over 12 months, zinc may be better than placebo at reducing total reticulocyte (MD ‐6.00%, 95% CI ‐6.24 to ‐5.76; 1 study (Gupta 1995), 130 participants; low‐certainty evidence; Analysis 3.10). However, the effects of zinc on platelet count at up to six months compared to placebo are uncertain (MD 31.80 x 10³/L, 95% CI ‐88.59 to 152.19; 1 study (Bao 2008), 36 participants; very low‐certainty evidence; Analysis 3.10). Also, zinc may not be better in reducing reticulocyte count in people with SCD compared to placebo at up to six months (MD ‐1.60%, 95% CI ‐4.69 to 1.49; 1 study (Fung 2002), 42 participants; very low‐certainty evidence) and at up to 12 months (MD 0.30%, 95% CI‐ 1.43 to 2.03; 1 study (Fung 2002), 42 participants; very low‐certainty evidence; Analysis 3.10).
3.10. Analysis.

Comparison 3: Zinc versus placebo, Outcome 10: Laboratory markers of haemolysis and inflammation
4. Vitamin A versus placebo
This comparison included one study (62 participants) (Dougherty 2012). See Table 9 in Appendix 4 for GRADE judgements for this comparison.
4. Summary of findings: Vitamin A versus placebo for sickle cell disease at up to 12 months.
| Vitamin A versus placebo for sickle cell disease at up to 12 months | ||||||
|
Patient or population: sickle cell disease Setting: outpatient clinic Intervention: vitamin A Comparison: placebo | ||||||
| Outcomes | Anticipated absolute effects* (95% CI) | Relative effect (95% CI) | № of participants (studies) | Certainty of the evidence (GRADE) | Comments | |
| Risk with placebo | Risk with vitamin A | |||||
| Frequency of crisis: vaso‐occlusive crisis Follow‐up: 12 months |
The mean change in the frequency of VOC when taking placebo was 0.1 | The mean frequency of VOC when taking vitamin A was 0.1 higher (0.17 lower to 0.37 higher) | MD 0.1 (‐0.17 to 0.37) | 44 (1 RCT) | ⨁◯◯◯ Very lowa,b | ‐ |
| Severity of pain | Not measured. | |||||
| QoL of participants living with SCD and their caregivers | Not measured. | |||||
| Adverse effects | Not measured. | |||||
| Frequency of hospitalization (days) Follow‐up: 12 months | The mean change in number of hospitalizations when taking placebo was ‐0.5days | The mean number of hospitalizations when taking vitamin A was 1.6 days higher (0.14 lower to 3.34 higher) | MD 1.6 days (0.14 to 3.34) | 44 (1 RCT) | ⨁◯◯◯ Very lowa,b | ‐ |
| Frequency of sickle cell‐related complications: acute chest syndrome Follow‐up 12 months |
The mean change in frequency of acute chest syndrome when taking a placebo was ‐0.3 | The mean frequency of acute chest syndrome when taking vitamin A was 0.3 higher (0.12 lower to 0.72 higher) | MD 0.3 (‐0.12 to 0.72) | 44 (1 RCT) | ⨁◯◯◯ Very lowa,b | ‐ |
| Haemoglobin status (g/mL) Median (IQR) Follow‐up: 12 months |
At baseline, the haemoglobin estimation decreased slightly in the vitamin A group from median (IQR) 8.2 (6.2‐9.8) to 8.0 (6.9‐10.8) post‐intervention. In the placebo group, haemoglobin increased slightly from median (IQR) 7.9 (6.6‐9.9) to 8.1 (6.8‐9.6) after the intervention. | ‐ | 44 (1 RCT) | ⨁◯◯◯ Very lowa,b | ‐ | |
| *The risk in the intervention group (and its 95% CI) is based on the assumed risk in the comparison group and the relative effect of the intervention (and its 95% CI). CI: confidence interval; IQR: interquartile range; MD: mean difference; №: number; QoL: quality of life; RCT: randomized controlled trial. | ||||||
| GRADE Working Group grades of evidence High certainty: we are very confident that the true effect lies close to that of the estimate of the effect. Moderate certainty: we are moderately confident in the effect estimate; the true effect is likely to be close to the estimate of the effect, but there is a possibility that it is substantially different. Low certainty: our confidence in the effect estimate is limited; the true effect may be substantially different from the estimate of the effect. Very low certainty: we have very little confidence in the effect estimate; the true effect is likely to be substantially different from the estimate of effect. | ||||||
aDowngraded by two levels for very serious risk of bias for unclear risk of bias for random sequence generation and allocation concealment. bDowngraded by one level for serious imprecision due to wide CI due to small sample size from a single study.
Primary outcomes
Frequency of crisis
The evidence is very uncertain about the effect of vitamin A on the frequency of crisis, reported as the mean number of vaso‐occlusive crises (VOC), compared to placebo at up to 12 months (MD 0.10, 95% CI ‐0.17 to 0.37; 1 study, 44 participants; very low‐certainty evidence; Analysis 4.1).
4.1. Analysis.

Comparison 4: Vitamin A versus placebo, Outcome 1: Frequency of crisis (mean change from baseline: number of vaso‐occlusive crises (at up to 12 months))
Severity of pain
This outcome was not measured for this comparison.
QoL of participants living with SCD and their caregivers
This outcome was not measured for this comparison.
Secondary outcomes
Adverse effects
The included study did not report on this outcome.
Frequency of hospitalization
We are uncertain whether vitamin A reduces the frequency of hospitalizations (measured as the number of hospitalizations and reported as 'time in hospital' (days)) compared to placebo at up to 12 months (MD 1.60 days, 95% CI ‐0.14 to 3.34; 1 study, 44 participants; very low‐certainty evidence), and time spent in the haematology acute care unit at the same time point (MD ‐0.40 days, 95% CI‐ 1.19 to 0.39; 1 study, 44 participants; very low‐certainty evidence; Analysis 4.2). However, there may be no difference in the effect of vitamin A compared to placebo in reducing emergency visits (MD 0.10 visits, 95% CI ‐0.66 to 0.86; 1 study, 44 participants; low‐certainty evidence; Analysis 4.2).
4.2. Analysis.
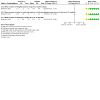
Comparison 4: Vitamin A versus placebo, Outcome 2: Frequency of hospitalization (mean change from baseline)
Frequency of SCD‐related complications
The included study reported on episodes of acute chest syndrome. We are very uncertain whether vitamin A has any effect in reducing acute chest syndrome compared to placebo at up to 12 months (MD 0.30, 95% CI ‐0.12 to 0.72; 1 study, 44 participants; very low‐certainty evidence; Analysis 4.3).
4.3. Analysis.

Comparison 4: Vitamin A versus placebo, Outcome 3: Frequency of SCD‐related complications (mean change from baseline)
Haemoglobin status
We are very uncertain whether vitamin A improves haemoglobin status compared to placebo in people with SCD at up to 12 months. The authors reported this outcome as median (IQR) 8.0 g/mL (6.9 to 10.8) in the vitamin A group versus 8.1 g/mL (6.8 to 9.6) in the placebo group (1 study, 44 participants; very low‐certainty evidence).
Laboratory markers of haemolysis and inflammation
We are uncertain whether vitamin A improves reticulocyte count compared to placebo at up to 12 months (MD ‐1.30%, 95% CI ‐4.03 to 1.43; 1 study, 42 participants; very low‐certainty evidence; Analysis 4.4). Furthermore, Dougherty 2012 reported other laboratory markers at up to 12 months as median (IQR). We present the results and certainty of the evidence in Table 9 and Table 10, respectively (WBC count, vitamin A: median 13.7 x 10³/µL (IQR 6.8 to 20.7), placebo: 4.5 x 10³/µL (IQR 5.6 to 18.1); platelet count, vitamin A: median 448 x 103/µL (IQR 237 to 582), placebo 489 x 103/µL (IQR 246 to 940); and HbF status, vitamin A: median 7.2% (IQR 0.5 to 21.8), placebo: 8.8 % (IQR 1.4 to 18.4); see Table 10).
4.4. Analysis.

Comparison 4: Vitamin A versus placebo, Outcome 4: Laboratory markers of haemolysis and inflammation
5. Vitamin A versus placebo for sickle cell disease at up to 12 months.
| Dougherty 2012 | ||||
| Laboratory parameter | Intervention | N | Baseline median (IQR) | 12 months median (IQR) |
| Haemoglobin (g/mL) | Vitamin A | 23 | 8.2 (6.2‐9.8) | 8.0 (6.9‐10.8) |
| Placebo | 21 | 7.9 (6.6‐9.9) | 8.1 (6.8‐9.6) | |
| HbF (%) | Vitamin A | 23 | 6.9 (0.5‐22.9) | 7.2 (0.5‐21.8) |
| Placebo | 21 | 10.0 (1.5‐20.3) | 8.8 (1.4‐18.4) | |
| Platelets (103/µL) | Vitamin A | 23 | 429 (239‐682) | 448 (237‐582) |
| Placebo | 21 | 451 (224‐961) | 489 (246‐940) | |
| WBC (103/µL) | Vitamin A | 23 | 12.0 (5.4‐22.7) | 13.7 (6.8‐20.7) |
| Placebo | 21 | 12.1 (6.1‐25.1) | 10.8 (7.2‐14.9) | |
HbF: foetal haemoglobin; ID: identifier; IQR: interquartile range; N: number of participants; WBC: white blood cells
5. Vitamin A plus zinc versus placebo
This comparison included one study (39 participants) (Dougherty 2012). See Table 11 in Appendix 4 for GRADE judgements for this comparison.
6. Summary of findings: Vitamin A + zinc versus placebo for sickle cell disease at up to 12 months.
| Vitamin A + zinc versus placebo for sickle cell disease at up to 12 months | ||||||
|
Patient or population: sickle cell disease Setting: outpatient clinic Intervention: vitamin A + zinc Comparison: placebo | ||||||
| Outcomes | Anticipated absolute effects* (95% CI) | Relative effect (95% CI) | № of participants (studies) | Certainty of the evidence (GRADE) | Comments | |
| Risk with placebo | Risk with vitamin A + zinc | |||||
| Frequency of crisis: VOC Follow‐up: 12 months | The mean frequency of VOC when taking placebo was 0.1 | The mean frequency of VOC when taking vitamin A + zinc was 0.3 lower (1.2 lower to 0.6 higher) | MD ‐0.3 (‐1.2 to 0.6 ) | 39 (1 RCT) | ⨁◯◯◯ Very lowa,b | ‐ |
| Severity of pain | Not measured. | |||||
| QoL of participants living with SCD and their caregivers | Not measured. | |||||
| Adverse effects | Not measured. | |||||
| Frequency of hospitalization Follow‐up: 12 months |
The mean frequency of hospitalisation when taking placebo was ‐0.5 days | The mean frequency of hospitalisation when taking vitamin A + zinc was 0.9 days higher (2.61 lower to 4.41 higher) | MD 0.9 days (‐2.61 to 4.41) | 39 (1 RCT) | ⨁◯◯◯ Very lowa,b | Reported as the time spent in haematology acute care unit and emergency clinic visits during 12 months of follow‐up |
| Frequency of sickle cell‐related complications: acute chest syndrome Follow‐up: 12 months | The mean frequency of acute chest syndrome when taking placebo was 0.2 | The mean frequency of acute chest syndrome when taking vitamin A + zinc was 0.2 higher (‐0.17 lower to 0.57 higher) | MD 0.2 (‐0.17 to 0.57) | 39 (1 RCT) | ⨁◯◯◯ Very lowa,b | ‐ |
| Haemoglobin status Follow‐up: 12 months | The median haemoglobin status was 8.1 g/dL | The median haemoglobin status in the intervention group was 7.6 g/dL higher (6.7 higher to 10.7 higher) | Median 7.6 g/dL (6.7 to 10.7) | 39 (1 RCT) | ⨁◯◯◯ Very lowa,b | ‐ |
| *The risk in the intervention group (and its 95% CI) is based on the assumed risk in the comparison group and the relative effect of the intervention (and its 95% CI). CI: confidence interval; IQR: interquartile range; MD: mean difference; №: number; QoL: quality of life; RCT: randomized controlled trial; SCD: sickle cell disease; VOC: vaso‐occlusive crisis | ||||||
| GRADE Working Group grades of evidence High certainty: we are very confident that the true effect lies close to that of the estimate of the effect. Moderate certainty: we are moderately confident in the effect estimate; the true effect is likely to be close to the estimate of the effect, but there is a possibility that it is substantially different. Low certainty: our confidence in the effect estimate is limited; the true effect may be substantially different from the estimate of the effect. Very low certainty: we have very little confidence in the effect estimate; the true effect is likely to be substantially different from the estimate of effect. | ||||||
aDowngraded by two levels for very serious risk of bias due to unclear risk of bias for random sequence generation and allocation concealment. bDowngraded by one level for serious imprecision due to wide CI due to small sample size.
Primary outcomes
Frequency of crisis
The included study reported the frequency of crisis as the mean number of VOC. We are very uncertain whether vitamin A plus zinc reduces the number of VOC at up to 12 months compared to placebo (MD ‐0.30 episodes, 95% CI ‐1.20 to 0.60; 1 study, 39 participants; very low‐certainty evidence; Analysis 5.1).
5.1. Analysis.

Comparison 5: Vitamin A + zinc versus placebo, Outcome 1: Frequency of crisis (mean change from baseline: number of vaso‐occlusive crises (at up to 12 months))
Severity of pain
This outcome was not measured for this comparison.
QoL of participants living with SCD and their caregivers
This outcome was not measured for this comparison.
Secondary outcomes
Adverse effects
This outcome was not reported for this comparison.
Frequency of hospitalization
We are very uncertain whether vitamin A plus zinc reduces the frequency of hospitalization (measured as the number of hospitalizations over 12 months of follow‐up and reported as 'time in hospital') (days) compared to placebo at up to 12 months (MD 0.90 days, 95% CI ‐2.61 to 4.41; 1 study, 39 participants; very low‐certainty evidence; Analysis 5.2); time spent in the haematology acute care unit (MD 0.30 days, 95% CI ‐0.37 to 0.97; 1 study, 39 participants; very low‐certainty evidence; Analysis 5.2); or emergency unit visits (MD ‐0.20 visits, 95% CI ‐0.98 to 0.58; 1 study, 39 participants; very low‐certainty evidence; Analysis 5.2).
5.2. Analysis.
Comparison 5: Vitamin A + zinc versus placebo, Outcome 2: Frequency of hospitalization (mean change from baseline)
Frequency of SCD‐related complications
This study reported the frequency of SCD‐related complications as the mean number of episodes of acute chest syndrome. Vitamin A plus zinc was not better than placebo at reducing episodes of acute chest syndrome compared to placebo at up to 12 months (MD 0.20, 95% CI ‐0.17 to 0.57; 1 study, 39 participants; very low‐certainty evidence; Analysis 5.3); however, the evidence is very uncertain.
5.3. Analysis.

Comparison 5: Vitamin A + zinc versus placebo, Outcome 3: Frequency of SCD‐related complications
Haemoglobin status
We are uncertain whether vitamin A plus zinc improves the haemoglobin status of people with SCD compared to placebo (at up to 12 months). The authors reported the median (IQR) haemoglobin level in the vitamin plus zinc group as 7.6 g/mL (6.7 to 10.7) versus 8.1 g/mL (6.8 to 9.6) in the placebo group (very low‐certainty evidence; Table 11 in Appendix 4).
Laboratory markers of haemolysis and inflammation
Vitamin A plus zinc may make little or no difference to reticulocyte count compared to placebo at up to 12 months (MD ‐2.5%, 95% CI ‐5.39 to 0.39; 1 study, 39 participants; very low‐certainty evidence; Analysis 5.4). Study authors reported other laboratory markers for this comparison as median (IQR): WBC count, vitamin A plus zinc: 14.5 x 10³/µL (5.6 to 18.1), placebo: 4.5 x 10³/µL (5.6 to 18.1); platelet count, vitamin A plus zinc: 514 x 103/µL (208 to 812), placebo: 489 x 103/µL (246 to 940); and HbF status, vitamin A plus zinc: 7.6% (2.2 to 18.4), placebo: 8.8% (1.4 to 18.4) (Table 12).
5.4. Analysis.
Comparison 5: Vitamin A + zinc versus placebo, Outcome 4: Laboratory markers of haemolysis and inflammation
7. Vitamin A + zinc versus placebo for sickle cell disease at up to 12 months.
| Dougherty 2012 | ||||
| Laboratory parameter | Intervention | N | Baseline median (IQR) | 12 months median (IQR) |
| Haemoglobin (g/mL) | Vitamin A + zinc | 18 | 7.9 (6.6‐10.0) | 7.6 (6.7‐10.7) |
| Placebo | 21 | 7.9 (6.6‐9.9) | 8.1 (6.8‐9.6) | |
| HbF (%) | Vitamin A + zinc | 18 | 7.6 (2.2‐18.4) | 6.6 (2.5‐19.0) |
| Placebo | 21 | 10.0 (1.5‐20.3) | 8.8 (1.4‐18.4) | |
| Platelets (103/µL) | Vitamin A + zinc | 18 | 484 (173‐490) | 514 (208‐812) |
| Placebo | 21 | 451 (224‐961) | 489 (246‐940) | |
| WBC (103/µL) | Vitamin A + zinc | 18 | 13.2 (8.7‐26.8) | 14.5 (5.6‐18.1) |
| Placebo | 21 | 12.1 (6.1‐25.1) | 10.8 (7.2‐14.9) | |
HbF: foetal haemoglobin; ID: identifier; IQR: interquartile range; N: number; WBC: white blood cells
6. N‐acetylcysteine (600 mg) versus placebo
This comparison includes one study (21 participants) comparing N‐acetylcysteine (NAC) to placebo (Pace 2003). See Table 13 in Appendix 4 for GRADE judgements for this comparison.
8. Summary of findings: N‐acetylcysteine (600 mg) versus placebo for sickle cell disease at up to 12 months.
| N‐acetylcysteine (600 mg) versus placebo for sickle cell disease at up to 12 months | ||||||
|
Patient or population: sickle cell disease Setting: outpatient clinic Intervention: N‐acetylcysteine (NAC) (600 mg) Comparison: placebo | ||||||
| Outcomes | Anticipated absolute effects* (95% CI) | Relative effect (95% CI) | № of participants (studies) | Certainty of the evidence (GRADE) | Comments | |
| Risk with placebo | Risk with NAC (600 mg) | |||||
| Frequency of crisis‐related complications: VOC Follow‐up: 12 months |
‐ | ‐ | Rate ratio 1.05 (0.43 to 2.57) | 10 (1 RCT) | ⨁◯◯◯ Very lowa,b | ‐ |
| Severity of pain | Not measured. | |||||
| QoL of participants living with SCD and their caregivers | Not measured. | |||||
| Adverse effects | Not measured. | |||||
| Frequency of hospitalizations | Not measured. | |||||
| Frequency of SCD‐related complications | Not measured. | |||||
| Haemoglobin status | Not measured. | |||||
| *The risk in the intervention group (and its 95% CI) is based on the assumed risk in the comparison group and the relative effect of the intervention (and its 95% CI). CI: confidence interval; NAC: N‐acetylcysteine; №: number; QoL: quality of life; RCT: randomized controlled trial; SCD: sickle cell disease; VOC: vaso‐occlusive crisis | ||||||
| GRADE Working Group grades of evidence High certainty: we are very confident that the true effect lies close to that of the estimate of the effect. Moderate certainty: we are moderately confident in the effect estimate; the true effect is likely to be close to the estimate of the effect, but there is a possibility that it is substantially different. Low certainty: our confidence in the effect estimate is limited; the true effect may be substantially different from the estimate of the effect. Very low certainty: we have very little confidence in the effect estimate; the true effect is likely to be substantially different from the estimate of effect. | ||||||
aDowngraded by two levels for very serious risk of bias due to unclear risk of bias for random sequence generation and allocation concealment. bDowngraded by one level for serious imprecision due to wide CI because the sample size was small.
Primary outcomes
Frequency of crisis
Pace 2003 reported the number of VOC episodes per comparison group, and we obtained the rate ratio as described above in the methods section. NAC (600 mg) may have no effect in reducing the rate of VOC episodes compared to placebo at up to 12 months (rate ratio 1.05, 95% CI 0.43 to 2.57; 1 study, 10 participants; Analysis 6.1); however, the evidence is very uncertain.
6.1. Analysis.

Comparison 6: N‐acetylcysteine (600 mg) versus placebo, Outcome 1: Frequency of crisis
Severity of pain
This outcome was not measured for this comparison.
QoL of participants living with SCD and their caregivers
This outcome was not measured for this comparison.
Secondary outcomes
Pace 2003 did not measure/report any of the review's secondary outcomes.
7. N‐acetylcysteine (1200 mg) versus placebo
This comparison consists of two studies (106 participants) (Pace 2003; Sins 2018). One study reported the episodes of event per intervention group (Pace 2003), and the second presented events per person‐year and reported its rate ratios with their 95% CI (Sins 2018); we obtained the SE as described in the Methods section. See Table 3 and Table 14 in Appendix 4 for GRADE judgements for this comparison.
9. Summary of findings: N‐acetylcysteine (1200 mg) compared to placebo for sickle cell disease at up to 12 months.
| N‐acetylcysteine (1200 mg) compared to placebo for sickle cell disease at up to 12 months | ||||||
|
Patient or population: sickle cell disease Setting: outpatient Intervention: N‐acetylcysteine (NAC) (1200 mg) Comparison: placebo | ||||||
| Outcomes | Anticipated absolute effects* (95% CI) | Relative effect (95% CI) | № of participants (studies) | Certainty of the evidence (GRADE) | Comments | |
| Risk with Placebo | Risk with NAC (1200 mg) | |||||
| Frequency of crisis at up to 12 months | ‐ | ‐ | Rate ratio 0.83 (0.72 to 0.95) | 10 (1 RCT) | ⨁⨁◯◯ Very lowa,b | ‐ |
| Severity of pain | Not measured | |||||
| QoL of participants living with SCD and their caregivers | Not measured | |||||
| Adverse effects | Not measured | |||||
| Frequency of hospitalization | Not measured | |||||
| Frequency of SCD‐related complications | Not measured | |||||
| *The risk in the intervention group (and its 95% CI is based on the assumed risk in the comparison group and the relative effect of the intervention (and its 95% CI) CI: confidence interval; NAC: N‐acetylcysteine; №: number; QoL: quality of life; RCT: randomized controlled trial; SCD: sickle cell disease | ||||||
| GRADE Working Group grades of evidence High certainty: we are very confident that the true effect lies close to that of the estimate of the effect. Moderate certainty: we are moderately confident in the effect estimate; the true effect is likely to be close to the estimate of the effect, but there is a possibility that it is substantially different. Low certainty: our confidence in the effect estimate is limited; the true effect may be substantially different from the estimate of the effect. Very low certainty: we have very little confidence in the effect estimate; the true effect is likely to be substantially different from the estimate of effect. | ||||||
aDowngraded by two levels for very serious risk of bias due to unclear risk of bias for random sequence generation and allocation concealment. bDowngraded by one level for serious imprecision due to wide CI due to small sample size from a single study.
Primary outcomes
Frequency of crisis
At up to six months, one study, Sins 2018, reported the rate of number of episodes of pain days. NAC (1200 mg) may not be better than placebo at reducing the number of days of pain (rate ratio 0.99 days, 95% CI 0.53 to 1.84; 1 study, 96 participants; low‐certainty evidence; Analysis 7.1). Additionally, NAC (1200 mg) may not be better at reducing the number of episodes of vaso‐occlusive crisis events at up to six months than placebo (rate ratio 0.99, 95% CI 0.51 to 1.92; 1 study, 96 participants; low‐certainty evidence; Analysis 7.1).
7.1. Analysis.

Comparison 7: N‐acetylcysteine (1200 mg) versus placebo, Outcome 1: Frequency of crisis
At up to 12 months, Pace 2003 reported the rate of number of episodes of vaso‐occlusive crisis and showed NAC (1200 mg) may be better at reducing the number of episodes of vaso‐occlusive crisis compared to placebo (rate ratio 0.83, 95% CI 0.72 to 0.95; 1 study, 10 participants; very low‐certainty evidence; Analysis 7.1); however, the evidence is very uncertain.
Severity of pain
This outcome was reported in Sins 2018, and measured as the mean 'maximum pain intensity on pain days' (limited to participants with ≥ three pain days and excluding hospitalization days). NAC (1200 mg) may not be better than placebo at reducing the severity of pain at up to six months (MD 0.17, 95% CI ‐0.53 to 0.87; 1 study, 96 participants; low‐certainty evidence; Analysis 7.2). Also, low‐certainty evidence showed that NAC (1200 mg) was not better than placebo at reducing the number of days with home analgesic at up to six months (rate ratio 1.04 days, 95% CI 0.83 to 1.31; 1 study, 96 participants; Analysis 7.3).
7.2. Analysis.

Comparison 7: N‐acetylcysteine (1200 mg) versus placebo, Outcome 2: Pain severity (pain intensity)
7.3. Analysis.

Comparison 7: N‐acetylcysteine (1200 mg) versus placebo, Outcome 3: Pain severity (home analgesia)
QoL of participants living with SCD and their caregivers
This outcome was reported in Sins 2018 at up to six months, and measured using the 36‐item Short Form Health Survey (SF‐36) questionnaire. We are very uncertain whether NAC (1200 mg) improves participants' QoL using the physical domain score (MD ‐1.80, 95% CI ‐5.01 to 1.41; 1 study, 96 participants; very low‐certainty evidence; Analysis 7.4) or the mental domain score (MD 2.00, 95% CI ‐1.45 to 5.45; 1 study, 96 participants; very low‐certainty evidence; Analysis 7.4).
7.4. Analysis.

Comparison 7: N‐acetylcysteine (1200 mg) versus placebo, Outcome 4: QoL of participants living with SCD and their caregivers (measured using SF‐36 scoring system)
Secondary outcomes
Adverse effects
One study (96 participants) reported AEs, such as gastrointestinal complaints, pruritus or rash, which occurred at up to six months (Sins 2018). The risk of AEs was similar between NAC (1200 mg) and placebo (RR 0.92, 95% CI 0.75 to 1.14; 1 study, 96 participants; low‐certainty evidence; Analysis 7.5).
7.5. Analysis.

Comparison 7: N‐acetylcysteine (1200 mg) versus placebo, Outcome 5: Adverse effects
Frequency of hospitalization
This outcome was reported in one study (Sins 2018). Low‐certainty evidence showed that NAC (1200 mg) may not be better than placebo at reducing the frequency of hospitalizations at up to six months (rate ratio 0.98, 95% CI 0.41 to 2.38; 1 study, 96 participants; Analysis 7.6).
7.6. Analysis.

Comparison 7: N‐acetylcysteine (1200 mg) versus placebo, Outcome 6: Frequency of hospitalization
Frequency of SCD‐related complications
A range of complications were reported in one study (Sins 2018). At up to six months, we are very uncertain of the effects of NAC (1200 mg) in preventing acute chest syndrome (RR 5.00, 95% CI 0.25 to 101.48; 1 study, 96 participants; very low‐certainty evidence; Analysis 7.7), priapism (RR 3.00, 95% CI 0.13 to 71.85; 1 study, 96 participants; very low‐certainty evidence; Analysis 7.7), and sequestration (RR 3.00, 95% CI 0.13 to 71.85; 1 study, 96 participants; very low‐certainty evidence; Analysis 7.7), compared to placebo.
7.7. Analysis.

Comparison 7: N‐acetylcysteine (1200 mg) versus placebo, Outcome 7: Frequency of SCD‐related complications
Haemoglobin status
Haemoglobin status was reported in one study at up to six months (Sins 2018). NAC (1200 mg) may not be better than placebo at increasing haemoglobin level in people with SCD at up to six months (MD ‐0.18 g/dL, 95% CI ‐0.40 to 0.04; 1 study, 96 participants; low‐certainty evidence; Analysis 7.8).
7.8. Analysis.

Comparison 7: N‐acetylcysteine (1200 mg) versus placebo, Outcome 8: Haemoglobin status (g/dL)
Laboratory markers of haemolysis and inflammation
This outcome was reported in one study at up to six months (Sins 2018). We are uncertain whether NAC (1200 mg) is effective in reducing WBC count (MD 0.06 x 10⁹/L, 95% CI ‐0.85 to 0.97; 1 study, 96 participants; very low‐certainty evidence); reticulocyte count (MD 3.63 x 10³/L, 95% CI ‐27.60 to 34.86; 1 study, 96 participants; very low‐certainty evidence; Analysis 7.9); platelet count (MD 40.41 x 10³/L, 95% CI ‐21.58 to 102.40; 1 study, 96 participants; very low‐certainty evidence; Analysis 7.9), low‐density lipoprotein (LDL) (MD ‐16.61 U/L, 95% CI ‐55.32 to 22.10; 1 study, 96 participants; very low‐certainty evidence; Analysis 7.9), and C‐reactive protein (CRP) (MD 0.21 g/dL, 95% CI ‐1.66 to 2.08; 1 study, 96 participants; very low‐certainty evidence; Analysis 7.9), compared to placebo.
7.9. Analysis.
Comparison 7: N‐acetylcysteine (1200 mg) versus placebo, Outcome 9: Laboratory markers of haemolysis and inflammation
8. N‐acetylcysteine (2400 mg) versus placebo
This comparison consists of one study (10 participants) (Pace 2003). See Table 15 in Appendix 4 for GRADE judgements for this comparison.
10. Summary of findings: N‐acetylcysteine (2400 mg) versus placebo for sickle cell disease at up to 12 months.
| N‐acetylcysteine (2400 mg) versus placebo for sickle cell disease at up to 12 months | ||||||
|
Patient or population: sickle cell disease Setting: outpatient clinic Intervention: N‐acetylcysteine (NAC) (2400 mg) Comparison: placebo | ||||||
| Outcomes | Anticipated absolute effects* (95% CI) | Relative effect (95% CI) | № of participants (studies) | Certainty of the evidence (GRADE) | Comments | |
| Risk with placebo | Risk with NAC (2400 mg) | |||||
| Frequency of crisis: VOC Follow‐up: 12 months |
‐ | ‐ | Rate ratio 0.64 (0.19 to 2.11) | 11 (1 RCT) | ⨁◯◯◯ Very lowa,b | ‐ |
| Severity of pain | Not measured. | |||||
| QoL of participants living with SCD and their caregivers | Not measured. | |||||
| Adverse effects | Not measured. | |||||
| Frequency of hospitalization | Not measured. | |||||
| Frequency of SCD‐related complications | Not measured. | |||||
| Haemoglobin status | Not measured. | |||||
| *The risk in the intervention group (and its 95% CI is based on the assumed risk in the comparison group and the relative effect of the intervention (and its 95% CI) CI: confidence interval; NAC: N‐acetylcysteine; №: number; QoL: quality of life; RCT: randomized controlled trial; SCD: sickle cell disease; VOC: vaso‐occlusive crisis | ||||||
| GRADE Working Group grades of evidence High certainty: we are very confident that the true effect lies close to that of the estimate of the effect. Moderate certainty: we are moderately confident in the effect estimate; the true effect is likely to be close to the estimate of the effect, but there is a possibility that it is substantially different. Low certainty: our confidence in the effect estimate is limited; the true effect may be substantially different from the estimate of the effect. Very low certainty: we have very little confidence in the effect estimate; the true effect is likely to be substantially different from the estimate of effect. | ||||||
aDowngraded by two levels for very serious risk of bias due to unclear risk of bias for random sequence generation and allocation concealment. bDowngraded by one level for serious imprecision due to wide CI due to small sample size from a single study.
Of the review's eight outcomes of interest, Pace 2003 measured only one outcome for this comparison: frequency of crisis.
Frequency of crisis
We are uncertain whether NAC (2400 mg) is better at reducing episodes of VOC in people with SCD compared to placebo at up to 12 months (rate ratio 0.64, 95% CI 0.19 to 2.11; 1 study, 11 participants; very low‐certainty evidence; Analysis 8.1).
8.1. Analysis.

Comparison 8: N‐acetylcysteine (2400 mg) versus placebo, Outcome 1: Frequency of crises
9. L‐arginine versus placebo
This comparison included four studies (226 participants) (Eleuterio 2019; Morris 2013; Onalo 2021; Styles 2007). However, Styles 2007 did not contribute data to the effect estimates because only the abstract was available, with inadequate information for analysis. Although the mode of administering the interventions and dosages differ in some of the studies, we have combined the studies in a meta‐analysis, where appropriate, because there was no heterogeneity detected when we did so. Eleuterio 2019 compared L‐arginine (500 mg/day) with placebo and administered hydroxyurea as a co‐intervention for both arms (Eleuterio 2019). Morris 2013 compared L‐arginine (100 mg/kg three times per day) with placebo, and Onalo 2021 compared oral L‐arginine‐hydrochloride (100 mg/kg three times per day) with placebo. See Table 4 for GRADE judgements for this comparison.
Primary outcomes
Frequency of crisis
This outcome was reported in one study (Eleuterio 2019). L‐arginine may not be better than placebo at reducing the frequency of daily pain at up to six months (RR 0.09, 95% CI 0.01 to 1.56; 1 study, 50 participants; low‐certainty evidence; Analysis 9.1), weekly pain (RR 0.33, 95% CI 0.04 to 2.99; 1 study, 50 participants; low‐certainty evidence; Analysis 9.1), monthly pain (RR 0.71, 95% CI 0.26 to 1.95; 1 study, 50 participants; low‐certainty evidence; Analysis 9.1), and yearly pain (RR 4.33, 95% CI 1.40 to 13.37; 1 study, 50 participants; low‐certainty evidence; Analysis 9.1). It is unclear how yearly pain for the outcome 'frequency of pain' was measured at four months of follow‐up by Eleuterio 2019. The authors reported that, "To measure pain frequency, a time scale was used to stratify the patients. The scale divided the patients into five pain categories: never (absence of pain), every day, every week, every month, and every year".
9.1. Analysis.

Comparison 9: L‐arginine versus placebo, Outcome 1: Frequency of crisis
Severity of pain
This outcome was reported by two studies (125 participants) (Morris 2013; Onalo 2021). L‐arginine may be better than placebo at reducing the severity of pain (measured based on a 10‐cm visual analogue scale from 0 to 10 (lower score is better)) in SCD at up to six months (MD ‐1.41, 95% CI ‐1.65 to ‐1.18; I2 = 0%; 2 studies, 125 participants; low‐certainty evidence; Analysis 9.2). Also, L‐arginine may be better than placebo at reducing the quantity of opioid consumed at up to six months (MD ‐1.77, 95% CI ‐2.97 to ‐0.57; I2 = 0%; 2 studies, 125 participants; low‐certainty evidence; Analysis 9.2). However, L‐arginine may have no better effect in improving the "mean rate of decline in worst pain" when compared to placebo at up to six months (MD 0.41, 95% CI 0.10 to 0.72; 1 study (Onalo 2021), 68 participants; low‐certainty evidence; Analysis 9.2).
9.2. Analysis.

Comparison 9: L‐arginine versus placebo, Outcome 2: Severity of pain
QoL of participants living with SCD and their caregivers
The included studies did not measure this outcome.
Secondary outcomes
Adverse effects
Two studies (125 participants) reported this outcome at up to six months, but we were not able to analyse their results, and so report them narratively below (Morris 2013; Onalo 2021).
The Morris 2013 study reported that "one patient (randomised to the arginine arm) developed hives during infusion of the study drug. Although the patient had a history of allergy to paper tape and paper tape had been inadvertently used, the study drug was discontinued and the patient was withdrawn from the study due to an AE that was possibly related to the study drug. A second patient (randomised to the placebo group) was withdrawn from the study after experiencing an acute clinical deterioration during the evolution of ACS, requiring an emergency red blood cell transfusion, and transfer from the ward to the intensive care unit. A second serious adverse event (SAE) was reported in a patient randomized to the placebo group: this patient had clinically relevant increases in liver function enzymes (alanine transaminase rose from 44 U/L on admission to 197 U/L on day 4 while aspartate transaminase increased from 64 to 200 U/L). The clinical team felt that this was likely related to SCD, but could be related to the study drug, so an SAE was reported to the Institutional Review Board and Data Safety Monitoring Board, but the patient continued participation in the study and was closely monitored. No other patients experienced clinical deterioration, and no other adverse events occurred. Arginine and placebo were well tolerated" (Morris 2013).
The Onalo 2021 study reported that "the rate of adverse events was similar in both treatment groups: 71.4% versus 78.8%, P = 0.79 in the arginine versus placebo arm, respectively. A total of 37 (54.4%) patients reported one or more adverse events, 19 patients in the arginine arm and 18 patients in the placebo arm" (Onalo 2021).
Frequency of hospitalization
Two studies reported this outcome as the number of days spent in hospital (Morris 2013; Onalo 2021). The evidence is very uncertain whether L‐arginine is better at reducing the mean number of days spent in hospital at up to six months compared to placebo (MD ‐0.85 days, 95% CI ‐1.87 to 0.17; I2 = 0%; 2 studies, 125 participants; very low‐certainty evidence; Analysis 9.3).
9.3. Analysis.

Comparison 9: L‐arginine versus placebo, Outcome 3: Frequency of hospitalization
Frequency of SCD‐related complications
The included studies did not measure this outcome.
Haemoglobin status
Two studies reported this outcome (Eleuterio 2019; Morris 2013). L‐arginine may not be better at improving haemoglobin level compared to placebo in people with SCD at up to six months (MD 0.40 g/dL, 95% CI ‐0.50 to 1.30; I2 = 0%; 2 studies, 106 participants; low‐certainty evidence; Analysis 9.4).
9.4. Analysis.

Comparison 9: L‐arginine versus placebo, Outcome 4: Haemoglobin status (g/dL)
Laboratory markers of haemolysis and inflammation
Two studies reported laboratory markers of haemolysis and inflammation at up to six months (Eleuterio 2019; Morris 2013). The evidence is very uncertain about the effect of L‐arginine in reducing WBC count at up to six months (MD 0.10 (x 109/L), 95% CI ‐1.92 to 2.12; 1 study, 56 participants; very low‐certainty evidence; Analysis 9.5). L‐arginine may not be better than placebo at increasing reticulocyte count in people with SCD at up to six months (MD ‐0.86%, 95% CI ‐3.56 to 1.83; I2 = 0%; 2 studies, 106 participants; low‐certainty evidence; Analysis 9.5). The evidence is very uncertain about the effect of L‐arginine in reducing platelet count (MD ‐153.10 (x 109/L), 95% CI ‐229.30 to ‐76.90; I2 = 77%; 2 studies, 106 participants; very low‐certainty evidence; Analysis 9.5). L‐arginine may not be better than placebo at increasing HbF level (MD 0.10 g/dL, 95% CI ‐0.27 to 0.47; 1 study, 50 participants; low‐certainty evidence; Analysis 9.5).
9.5. Analysis.

Comparison 9: L‐arginine versus placebo, Outcome 5: Laboratory markers of haemolysis and inflammation
10. Omega‐3 versus placebo
This comparison consists of three studies (217 participants) (Daak 2013; Daak 2018; Tomer 2001). See Table 5 and Table 16 in Appendix 4 for GRADE judgements for this comparison.
11. Summary of findings: Omega‐3 versus placebo for sickle cell disease at up to 12 months.
| Omega‐3 versus placebo for sickle cell disease at up to 12 months | ||||||
|
Patient or population: sickle cell disease Setting: outpatient clinic Intervention: omega‐3 Comparison: placebo | ||||||
| Outcomes | Anticipated absolute effects* (95% CI) | Relative effect (95% CI) | № of participants (studies) | Certainty of the evidence (GRADE) | Comments | |
| Risk with placebo | Risk with omega‐3 | |||||
| Frequency of crisis Follow‐up: 12 months |
‐ | ‐ | Rate ratio 0.76 (0.22 to 2.65) | 10 (1 RCT) | ⨁◯◯◯ Very lowa,b | Daak 2013 also reported the median rate of VOC at 12 months: median of 2.7 (IQR 0.9 to 4.8) in the omega‐3 group versus 4.6 (IQR 3.0 to 6.4) in the placebo group (1 trial, 140 participants). |
| Severity of pain | Not measured. | |||||
| QoL of participants living with SCD and their caregivers Follow‐up: 12 months |
Participants in the omega‐3 group missed a median (IQR) of 0 (7.6) days versus the placebo group who missed a median (IQR) of 4.3 (21.1) days | 95 (1 RCT) | ⨁◯◯◯ Very lowb,c | ‐ | ||
| Adverse effects Follow‐up: 12 months |
The risk when taking placebo was 29 per 1000 | The risk when taking omega‐3 was 29 per 1000 | RR 1.00 (0.14 to 6.90 | 140 (1 RCT) | ⨁◯◯◯ Very lowb,c | ‐ |
| Frequency of hospitalization | Not measured. | |||||
| Frequency of sickle cell‐related complications ‐ blood transfusion Follow‐up: 12 months | The risk when taking placebo was 143 per 1000 | The risk when taking omega‐3 was 43 per 1000 (13 to 149) | RR 0.30 (0.09 to 1.04) | 140 (1 RCT) | ⨁◯◯◯ Very lowb,c | Other complications reported were sequestration crisis, avascular necrosis, and severe anaemia. |
| Haemoglobin status (g/L) Follow‐up: 12 months | The mean haemoglobin level when taking placebo was 0g/L | The mean when taking omega‐3 was 0.17 g/L lower (2.23 lower to 2.19 higher) | MD ‐0.17 g/L (‐2.23 to 2.19) | 150 (2 RCTs) | ⨁◯◯◯ Very lowb,c | ‐ |
| *The risk in the intervention group (and its 95% CI) is based on the assumed risk in the comparison group and the relative effect of the intervention (and its 95% CI). CI: confidence interval; IQR: interquartile range; MD: mean difference; №: number; RR: risk ratio; RCT: randomized controlled trial | ||||||
| GRADE Working Group grades of evidence High certainty: we are very confident that the true effect lies close to that of the estimate of the effect. Moderate certainty: we are moderately confident in the effect estimate; the true effect is likely to be close to the estimate of the effect, but there is a possibility that it is substantially different. Low certainty: our confidence in the effect estimate is limited; the true effect may be substantially different from the estimate of the effect. Very low certainty: we have very little confidence in the effect estimate; the true effect is likely to be substantially different from the estimate of effect. | ||||||
aDowngraded by two levels for very serious risk of bias due to study limitations such as unclear risk of bias for random sequence generation, allocation concealment, and selective reporting. bDowngraded by one level for serious imprecision due to wide CI due to small sample size. cDowngraded by two levels for very serious risk of bias due to study limitations such as unclear risk of bias for random sequence generation, allocation concealment, and high risk of selective reporting bias.
Primary outcomes
Frequency of crisis
Two studies reported this outcome (Daak 2013; Tomer 2001). We are very uncertain whether omega‐3 is better at reducing the frequency of pain crises, measured as the number of pain episodes, than placebo at up to 12 months (rate ratio 0.76, 95% CI 0.22 to 2.65; 1 study, 10 participants; very low‐certainty evidence; Analysis 10.1).
10.1. Analysis.

Comparison 10: Omega‐3 versus placebo, Outcome 1: Frequency of crisis
Daak 2013 also reported the median rate of VOC at 12 months: median of 2.7 (IQR 0.9 to 4.8) in the omega‐3 group versus 4.6 (IQR 3.0 to 6.4) in the placebo group (1 study, 140 participants; very low‐certainty evidence).
Severity of pain
The included studies did not measure this outcome.
QoL of participants living with SCD and their caregivers
One study (95 participants) reported on the number of days absent from school, presenting the median (IQR) for each group at 12 months of follow‐up (Daak 2013). Participants in the omega‐3 group missed a median (IQR) of 0 (7.6) days versus the placebo group who missed a median (IQR) of 4.3 (21.1) days (very low‐certainty evidence; Table 17).
12. Omega‐3 versus placebo: absence from school at up to 12 monthsa.
| Omega 3 (n = 49) | Placebo (n = 46) | P value |
| Median 0 (IQR 7.6) | Median 4.3 (IQR 21.1) | "Not significant" |
a33 participants (n = 31 younger than school age and 2 not attending school) were not included in the analysis. Zero‐inflated Poisson regression was used to test for statistical significance, Daak 2013.
IQR: interquartile range; n: number of participants
Secondary outcomes
Adverse effects
Two studies (274 participants) reported this outcome (Daak 2013; Daak 2018).
Very low‐certainty evidence showed that there was no difference in the risk of serious adverse effects (SAEs) at six months compared to placebo (RR 0.60, 95% CI 0.33 to 1.11; 1 study (Daak 2018), 67 participants; very low‐certainty evidence; Analysis 10.2), on any adverse effect at up to six months (RR 1.05, 95% CI 0.74 to 1.48; 1 study (Daak 2018), 67 participants; very low‐certainty evidence; Analysis 10.2), or on any adverse effect at up to 12 months (RR 1.00, 95% CI 0.14 to 6.90; 1 study (Daak 2013), 140 participants; very low‐certainty evidence; Analysis 10.2). Two participants from each group complained of dyspepsia, one participant from the omega‐3 group complained of stomach ache, and 21 participants from the omega‐3 group reported increased appetite during the follow‐up period.
10.2. Analysis.

Comparison 10: Omega‐3 versus placebo, Outcome 2: Adverse effects
Frequency of hospitalization
The included studies did not measure this outcome.
Frequency of SCD‐related complications
One study (140 participants) reported a number of different measures for this outcome at up to 12 months (Daak 2013). We are uncertain whether omega‐3 is better at reducing severe anaemia at up to 12 months compared to placebo (RR 0.20, 95% CI 0.05 to 0.88; 1 study, 140 participants; very low‐certainty evidence; Analysis 10.3); the rate of blood transfusion (RR 0.30, 95% CI 0.09 to 1.04; 1 study, 140 participants; very low‐certainty evidence; Analysis 10.3), sequestration crisis (RR 0.50, 95% CI 0.05 to 5.39; 1 study, 140 participants; very low‐certainty evidence; Analysis 10.3), avascular necrosis (RR 0.50, 95% CI 0.05 to 5.39; 1 study, 140 participants; very low‐certainty evidence; Analysis 10.3), or stroke (RR 0.20, 95% CI 0.01 to 4.09; 1 study; 140 participants; very low‐certainty evidence; Analysis 10.3), compared to placebo.
10.3. Analysis.

Comparison 10: Omega‐3 versus placebo, Outcome 3: Frequency of SCD‐related complications
Haemoglobin status
All three studies (217 participants) reported this outcome (Daak 2013; Daak 2018; Tomer 2001). We are uncertain whether omega‐3 can improve the haemoglobin status of participants compared to placebo at up to six months (MD 0.36 g/L, 95% CI ‐0.21 to 0.93; 1 study (Daak 2018), 67 participants; very low‐certainty evidence; Analysis 10.4), and at up to 12 months (MD ‐0.17 g/L, 95% CI ‐2.23 to 2.19; I2 = 0%; 2 studies (Daak 2013; Tomer 2001), 150 participants; very low‐certainty evidence; Analysis 10.4).
10.4. Analysis.

Comparison 10: Omega‐3 versus placebo, Outcome 4: Haemoglobin status
Laboratory markers of haemolysis and inflammation
All three studies (217 participants) reported this outcome (Daak 2013; Daak 2018; Tomer 2001). Based on data from Daak 2018, we are uncertain whether omega‐3 has any effect compared to placebo on the following measures at six months (Analysis 10.5): total WBC (MD ‐1.50 x 10³/μL, 95% CI ‐3.48 to 0.48; 1 study, 67 participants; very low‐certainty evidence); reticulocytes (MD ‐0.25%, 95% CI‐1.84 to 1.34; 1 study, 67 participants; very low‐certainty evidence); total platelet count (MD ‐33.84 x 10³/µL, 95% CI ‐118.97 to 51.29; 1 study, 67 participants; very low‐certainty evidence); lactate dehydrogenase (LDH) levels (MD ‐70.55 U/L, 95% CI ‐151.81 to 10.71; 1 study, 67 participants; very low‐certainty evidence).
10.5. Analysis.

Comparison 10: Omega‐3 versus placebo, Outcome 5: Laboratory markers of haemolysis and inflammation
There may be little or no difference in the effect of omega‐3 compared to placebo in reducing laboratory markers of haemolysis and inflammation at 12 months on the same outcome measures (Analysis 10.5): total WBC (MD 0.40 μL, 95% CI ‐0.87 to 1.67; I2 = 0%; 2 studies (Daak 2013; Tomer 2001), 150 participants; low‐certainty evidence); reticulocytes (MD 0.43%, 95% CI ‐4.46 to 13.60; 1 study (Tomer 2001), 10 participants; very low‐certainty evidence); total platelet count (MD 30.63 x 10³/μL, 95% CI ‐13.48 to 74.74; I2 = 0%; 2 studies (Daak 2013; Tomer 2001), 150 participants; low‐certainty evidence); LDH levels (MD 17.60 U/L, 95% CI ‐162.21 to 197.41; 1 study (Tomer 2001), 10 participants; very low‐certainty evidence).
11. Folic acid versus placebo
This comparison includes one study (115 participants) (Rabb 1983). See Table 18 in Appendix 4 for GRADE judgements for this comparison.
13. Summary of findings: Folic acid versus placebo for sickle cell disease at up to 12 months.
| Folic acid versus placebo for sickle cell disease at up to 12 months | ||||||
|
Patient or population: sickle cell disease Setting: outcome clinic Intervention: folic acid Comparison: placebo | ||||||
| Outcomes | Anticipated absolute effects* (95% CI) | Relative effect (95% CI) | № of participants (studies) | Certainty of the evidence (GRADE) | Comments | |
| Risk with placebo | Risk with folic acid | |||||
| Frequency of crisis | Not measured. | |||||
| Severity of pain Follow‐up: 12 months | The risk of severe pain when taking placebo was 321 per 1000 | The risk when taking folic acid was 373 per 1000 (225 to 617) | RR 1.16 (0.70 to 1.92) | 115 (1 RCT) | ⨁⨁◯◯ Lowa,b | ‐ |
| QoL of participants living with SCD and their caregivers | Not measured. | |||||
| Adverse effects | Not measured. | |||||
| Frequency of hospitalization Follow‐up: 12 months | ‐ | ‐ | Rate ratio 1.01 (0.39 to 2.62) | 115 (1 RCT) | ⨁⨁◯◯ Lowa,b | Reported as the rate of clinic visits/child |
| Frequency of sickle cell‐related complications: major infection Follow‐up: 12 months |
The risk of major infections when taking placebo was 268 per 1000 | The risk when taking folic acid was 238 per 1000 (126 to 445) |
Risk ratio 0.89 (0.47 to 1.66) |
115 (1 RCT) | ⨁⨁◯◯ Lowa,b | This outcome was also reported as minor infections, sequestration and dactylitis. |
| Haemoglobin status | Not measured. | |||||
| *The risk in the intervention group (and its 95% CI) is based on the assumed risk in the comparison group and the relative effect of the intervention (and its 95% CI). CI: confidence interval; № : number; QoL: quality of life; RR: risk ratio; RCT: randomized controlled trial; | ||||||
| GRADE Working Group grades of evidence High certainty: we are very confident that the true effect lies close to that of the estimate of the effect. Moderate certainty: we are moderately confident in the effect estimate; the true effect is likely to be close to the estimate of the effect, but there is a possibility that it is substantially different. Low certainty: our confidence in the effect estimate is limited; the true effect may be substantially different from the estimate of the effect. Very low certainty: we have very little confidence in the effect estimate; the true effect is likely to be substantially different from the estimate of effect. | ||||||
aDowngraded by one level for serious risk due to attrition bias. bDowngraded by one level for serious imprecision due to a wide CI involving both harm and benefit.
Primary outcomes
Frequency of crisis
The included study did not measure this outcome.
Severity of pain
Folic acid may result in little to no difference in the number of participants experiencing a painful crisis at up to 12 months compared to placebo (RR 1.16, 95% CI 0.70 to 1.92; 1 study, 115 participants; low‐certainty evidence; Analysis 11.1).
11.1. Analysis.

Comparison 11: Folic acid versus placebo, Outcome 1: Severity of pain crises
QoL of participants living with SCD and their caregivers
The included study did not measure this outcome.
Secondary outcomes
Adverse effects
The included study did not report on this outcome.
Frequency of hospitalization
This outcome was measured as the number of clinic visits per child. Folic acid may have no effect in reducing the rate of clinic visits compared to placebo (rate ratio 1.01, 95% CI 0.39 to 2.62; 1 study, 115 participants; low‐certainty evidence; Analysis 11.2).
11.2. Analysis.

Comparison 11: Folic acid versus placebo, Outcome 2: Frequency of hospitalization
Frequency of SCD‐related complications
Folic acid may make little or no difference in reducing the frequency of SCD‐related complications compared to placebo at up to 12 months (Analysis 11.3): SCD‐related major infections (RR 0.89, 95% CI 0.47 to 1.66; 1 study, 115 participants; low‐certainty evidence); SCD‐related minor infections (RR 0.99, 95% CI 0.85 to 1.15; 1 study, 115 participants; low‐certainty evidence); SCD‐related dactylitis (RR 0.67, 95% CI 0.35 to 1.27; 1 study, 115 participants; low‐certainty evidence); and splenic sequestration (RR 1.07, 95% CI 0.44 to 2.57; 1 study, 115 participants; low‐certainty evidence) (Rabb 1983).
11.3. Analysis.

Comparison 11: Folic acid versus placebo, Outcome 3: Frequency of SCD‐related complications
Haemoglobin status
The included study did not measure this outcome.
Laboratory markers of haemolysis and inflammation
The included study did not measure this outcome.
12. Extended‐release niacin versus placebo
This comparison included one study (27 participants) (Scoffone 2013). See Table 14 in Appendix 4 for GRADE judgements for this comparison.
Of the review's eight outcomes of interest, Scoffone 2013 measured only two, both of them secondary outcomes.
Haemoglobin status
We are very uncertain whether extended‐release niacin results in an increase in haemoglobin levels at up to six months compared to placebo (MD 0.40 g/dL, 95% CI ‐0.69 to 1.49; 1 study, 27 participants; very low‐certainty evidence; Analysis 12.1).
12.1. Analysis.

Comparison 12: Extended‐release niacin (niacin‐ER) versus placebo, Outcome 1: Haemoglobin status
Laboratory markers of haemolysis and inflammation
We are also uncertain whether extended‐release niacin reduces total WBC count at up to six months (MD 0.00 K/μL, 95% CI ‐1.71 to 1.71; 1 study, 27 participants; very low‐certainty evidence; Analysis 12.2) or reticulocyte count at up to six months (MD ‐1.00 K/μL, 95% CI ‐70.79 to 68.79; 1 study, 27 participants; very low‐certainty evidence; Analysis 12.2), compared to placebo. The study also reported median (IQR) C‐reactive protein levels at up to six months: 1.2 mg/dL (0.5 to 4.6) in the niacin group versus 0.5 mg/dL (0.2 to 3.1) in the placebo group (P = 0.36).
12.2. Analysis.

Comparison 12: Extended‐release niacin (niacin‐ER) versus placebo, Outcome 2: Laboratory markers of haemolysis and inflammation
13. Oral propionyl‐L‐carnitine (PLC) versus placebo
This comparison included one study (15 participants) (Serjeant 1997). See Table 19 in Appendix 4 for GRADE judgements for this comparison.
14. Summary of findings: Oral propionyl‐L‐carnitine (PLC) compared to placebo for sickle cell disease at up to six months.
| Oral propionyl‐L‐carnitine (PLC) compared to placebo for sickle cell disease at up to six months | ||||||
|
Patient or population: sickle cell disease
Setting: outpatient clinic Intervention: PLC Comparison: placebo | ||||||
| Outcomes | Anticipated absolute effects* (95% CI) | Relative effect (95% CI) | № of participants (studies) | Certainty of the evidence (GRADE) | Comments | |
| Risk with placebo | Risk with PLC | |||||
| Frequency of crisis | Not measured. | ‐ | ||||
| Severity of pain | Not measured. | ‐ | ||||
| QoL of participants living with SCD and their caregivers | Not measured. | ‐ | ||||
| Adverse effects | Not measured. | ‐ | ||||
| Frequency of hospitalization | Not measured. | ‐ | ||||
| Frequency of SCD‐related complications (increase in leg ulcer area in cm) Follow‐up: up to 6 months |
The mean increase in leg ulcer area when taking placebo was 0.7 cm | The mean increase in leg ulcer area when taking PLC was 3.9 cm lower (13.91 lower to 6.11 higher). | MD ‐3.90 (‐13.91 to 6.11) | 15 (1 RCT) | ⊕⊝⊝⊝ Very lowa | Ulcer size after treatment (lower size is better) |
| Haemoglobin status | Not measured. | ‐ | ||||
| *The risk in the intervention group (and its 95% CI) is based on the assumed risk in the comparison group and the relative effect of the intervention (and its 95% CI). CI: confidence interval; MD: mean difference; PLC: propionyl‐L‐carnitine; QoL: quality of life; RCT: randomised controlled trial; SCD: sickle cell disease. | ||||||
| GRADE Working Group grades of evidence High certainty: we are very confident that the true effect lies close to that of the estimate of the effect. Moderate certainty: we are moderately confident in the effect estimate; the true effect is likely to be close to the estimate of the effect, but there is a possibility that it is substantially different. Low certainty: our confidence in the effect estimate is limited; the true effect may be substantially different from the estimate of the effect. Very low certainty: we have very little confidence in the effect estimate: the true effect is likely to be substantially different from the estimate of effect. | ||||||
aDowngraded by three levels for very serious risk of bias due to high risk of bias for random sequence generation and incomplete outcome data, and very serious imprecision due to very wide CI that include both harm and benefit.
Of the review's eight outcomes of interest, Serjeant 1997 measured only one secondary outcome for this comparison: frequency of SCD‐related complications.
Frequency of SCD‐related complications
This outcome was reported as the mean increase in leg ulcer area after treatment (cm; lower size is better). We are very uncertain whether oral propionyl‐L‐carnitine is better than placebo at healing leg ulcers post‐intervention at up to six months (MD ‐3.90 cm, 95% CI ‐13.91 to 6.11; 1 study, 15 participants; very low‐certainty evidence; Analysis 13.1).
13.1. Analysis.

Comparison 13: Oral propionyl‐L‐carnitine (PLC) versus placebo, Outcome 1: Frequency of SCD‐related complications
Comparison group B: one antioxidant versus another antioxidant
1. Vitamin A versus vitamin A plus zinc
This comparison included one study (41 participants) (Dougherty 2012). See Table 20 in Appendix 4 for GRADE judgements for this comparison.
15. Summary of findings: Vitamin A versus vitamin A + zinc for sickle cell disease at up to 12 months.
| Vitamin A versus vitamin A + zinc for sickle cell disease at up to 12 months | ||||||
|
Patient or population: sickle cell disease Setting: outpatient clinic Intervention: vitamin A Comparison: vitamin A + zinc | ||||||
| Outcomes | Anticipated absolute effects* (95% CI) | Relative effect (95% CI) | № of participants (studies) | Certainty of the evidence (GRADE) | Comments | |
| Risk with vitamin A | Risk with vitamin A + zinc | |||||
| Frequency of crisis: VOC Follow‐up: 12 months | The mean change in the frequency of crisis (VOC) when taking only vitamin A was ‐0.2. | The mean change when taking vitamin A plus zinc was 0.4 higher (0.49 lower to 1.29 higher) | MD 0.4 (‐0.4 to 1.29) | 41 (1 RCT) | ⨁◯◯◯ Very lowa,b | ‐ |
| Severity of pain | Not measured. | |||||
| QoL of participants living with SCD and their caregivers | Not measured. | |||||
| Adverse effects | Not measured. | |||||
| Frequency of hospitalization Follow‐up: 12 months | The mean number of hospitalizations when taking only vitamin A was 0.4 days | The mean number of hospitalizations when taking vitamin A plus zinc was 0.7 days lower (2.8 lower to 4.2 higher) | MD ‐ 0.7 (‐2.8 to 4.2) | 41 (1 RCT) | ⨁◯◯◯ Very lowa,b | ‐ |
| Frequency of sickle cell‐related complications: acute chest 'event' Follow‐up: 12 months | The mean frequency of acute chest syndrome when taking only vitamin A was 0.2 | The mean frequency of acute chest syndrome when taking vitamin A plus zinc was 0.2 lower (0.52 lower to 0.12 higher) | MD ‐0.2 (‐0.52 to 0.12) | 41 (1 RCT) | ⨁◯◯◯ Very lowa,b | ‐ |
| Haemoglobin status Follow‐up: 12 months | There may be little or no difference in the effect of vitamin A compared to vitamin A + zinc in haemoglobin levels in SCD (vitamin A reduced from median (IQR) 8.2 g/mL (6.2‐9.8) to 8.0 g/mL (6.9‐10.8) versus median (IQR) 7.9 g/mL (6.6‐10.0) to 7.6 g/mL (6.7‐10.7) in vitamin A + zinc). | ‐ | 41 (1 RCT) | ⨁◯◯◯ Very lowa,b | ‐ | |
| *The risk in the intervention group (and its 95% CI) is based on the assumed risk in the comparison group and the relative effect of the intervention (and its 95% CI). CI: confidence interval; MD: mean difference; №: number; QoL: quality of life; RCT: randomized controlled trial; SCD: sickle cell disease; VOC: vaso‐occlusive crisis | ||||||
| GRADE Working Group grades of evidence High certainty: we are very confident that the true effect lies close to that of the estimate of the effect. Moderate certainty: we are moderately confident in the effect estimate; the true effect is likely to be close to the estimate of the effect, but there is a possibility that it is substantially different. Low certainty: our confidence in the effect estimate is limited; the true effect may be substantially different from the estimate of the effect. Very low certainty: we have very little confidence in the effect estimate; the true effect is likely to be substantially different from the estimate of effect. | ||||||
aDowngraded by two levels for very serious risk of bias due to unclear risk of bias for random sequence generation and allocation concealment. bDowngraded by one level for serious imprecision due to wide CI due to small sample size.
Primary outcomes
Frequency of crisis
We are very uncertain whether vitamin A is better than vitamin A plus zinc at reducing VOC at up to 12 months (MD 0.40, 95% CI ‐0.49 to 1.29; 1 study, 41 participants; very low‐certainty evidence; Analysis 14.1).
14.1. Analysis.

Comparison 14: Vitamin A versus vitamin A + zinc, Outcome 1: Frequency of crisis
Severity of pain
The included study did not measure this outcome.
QoL of participants living with SCD and their caregivers
The included study did not measure this outcome.
Secondary outcomes
Adverse effects
The included study did not report this outcome.
Frequency of hospitalization
At up to 12 months, we are uncertain whether vitamin A compared to vitamin A plus zinc has any effect on SCD‐related hospitalization (measured as the number of hospitalizations over 12 months of follow‐up and reported as 'time in hospital') (MD 0.70 days, 95% CI ‐2.80 to 4.20; 1 study, 41 participants; very low‐certainty evidence; Analysis 14.2), time spent in the haematology acute care unit (MD ‐0.70 day, 95% CI ‐1.65 to 0.25; 1 study, 41 participants; very low‐certainty evidence; Analysis 14.2), and number of emergency visits (MD 0.10 visits, 95% CI ‐0.71 to 0.91; 1 study, 41 participants; very low‐certainty evidence).
14.2. Analysis.

Comparison 14: Vitamin A versus vitamin A + zinc, Outcome 2: Frequency of hospitalization (mean change from baseline)
Frequency of SCD‐related complications
We are very uncertain whether vitamin A is better than vitamin A plus zinc at reducing acute chest syndrome at up to 12 months (MD ‐0.20, 95% CI ‐0.52 to 0.12; 1 study, 41 participants; very low‐certainty evidence; Analysis 14.3).
14.3. Analysis.

Comparison 14: Vitamin A versus vitamin A + zinc, Outcome 3: Frequency of SCD‐related complications
Haemoglobin status
There may be little or no difference in the effect of vitamin A compared to vitamin A plus zinc in increasing haemoglobin levels at up to 12 months: haemoglobin levels with vitamin A fell from a median (IQR) 8.2 g/mL (6.2 to 9.8) to 8.0 g/mL (6.9 to 10.8) versus a median (IQR) 7.9 g/mL (6.6 to 10.0) to 7.6 g/mL(6.7 to 10.7) with vitamin A plus zinc (1 study, 41 participants; low‐certainty evidence).
Laboratory markers of haemolysis and inflammation
Vitamin A may make little or no difference in reducing reticulocyte count compared to vitamin A plus zinc (MD ‐0.20%, 95% CI ‐3.33 to 2.93; 1 study, 41 participants; low‐certainty evidence; Analysis 14.4).
14.4. Analysis.

Comparison 14: Vitamin A versus vitamin A + zinc, Outcome 4: Laboratory markers of haemolysis and inflammation
Dougherty 2012 reported other laboratory markers as median (IQR) at up to 12 months (Table 21). We are uncertain whether vitamin A has any effect on other laboratory markers of haemolysis and inflammation compared to vitamin A plus zinc at 12 months. In the vitamin A group, total WBC count increased from median (IQR) 12.0 x 10³/µL (5.4 to 22.7) at baseline to 13.7 x 10³/µL (6.8 to 20.7) compared to vitamin A plus zinc, which increased from median (IQR) 13.2 x 10³/µL (8.7 to 26.8) to 14.5 x 10³/µL (5.6 to 18.1) (1 study, 41 participants; very low‐certainty evidence). We are uncertain whether vitamin A compared to vitamin A plus zinc has an effect in reducing total platelet count. Platelet count increased slightly with vitamin A from median (IQR) 429 x 103/µL (239 to 682) to 448 x 103/µL (237 to 582) compared to a marked increase in the vitamin A plus zinc group from median (IQR) 484 x 103/µL (173 to 490) to median (IQR) 514 x 103/µL (208 to 812) in the vitamin A plus zinc group (1 study, 41 participants; very low‐certainty evidence). Also, we are uncertain whether vitamin A is better than vitamin A plus zinc at increasing HbF levels. HbF level increased from median (IQR) 6.9% (0.5 to 22.9) to 7.2% (0.5 to 21.8) in the vitamin A group compared to a decrease from 7.6% (2.2 to 18.4) to 6.6% (2.5 to 19.0) in the vitamin A plus zinc group (41 participants; very low‐certainty evidence; Table 21).
16. Vitamin A versus vitamin A + zinc for sickle cell disease at up to 12 months.
| Dougherty 2012 | ||||
| Laboratory parameters | Intervention | N | Baseline median (IQR) | 12 months median (IQR) |
| Haemoglobin (g/mL) | Vitamin A | 23 | 8.2 (6.2‐9.8) | 8.0 (6.9‐10.8) |
| Vitamin A + zinc | 21 | 7.9 (6.6‐10.0) | 7.6 (6.7‐10.7) | |
| HbF (%) | Vitamin A | 23 | 6.9 (0.5‐22.9) | 7.2 (0.5‐21.8) |
| Vitamin A + zinc | 21 | 7.6 (2.2‐18.4) | 6.6 (2.5‐19.0) | |
| Platelets (103/µL) | Vitamin A | 23 | 429 (239‐682) | 448 (237‐582) |
| Vitamin A + zinc | 21 | 484 (173‐490) | 514 (208‐812) | |
| WBC (103/µL) | Vitamin A | 23 | 12.0 (5.4‐22.7) | 13.7 (6.8‐20.7) |
| Vitamin A + zinc | 21 | 13.2 (8.7‐26.8) | 14.5 (5.6‐18.1) | |
HbF: foetal haemoglobin; ID: identifier; IQR:interquartile range; N: number; WBC: white blood cells
Comparison group C: antioxidant versus standard local care
1. Standard local care plus arginine butyrate versus standard local care
This comparison included two studies (46 participants) (Koshy 2001; McMahon 2010). See Table 22 in Appendix 4 for GRADE judgements for this comparison.
17. Summary of findings: Standard local care + arginine butyrate (500 mg/kg/dose) versus standard local care for sickle cell disease at up to six months.
| Standard local care + arginine butyrate (500 mg/kg/dose) versus standard local care for sickle cell disease at up to six months | ||||||
|
Patient or population: sickle cell disease Setting: outpatient clinic Intervention: standard local care + arginine butyrate (500 mg/kg/dose) Comparison: standard local care | ||||||
| Outcomes | Anticipated absolute effects* (95% CI) | Relative effect (95% CI) | № of participants (studies) | Certainty of the evidence (GRADE) | Comments | |
| Risk with standard local care | Risk with standard local care + arginine butyrate 500 mg/kg/dose | |||||
| Frequency of crisis | Not measured. | |||||
| Severity of pain | Not measured. | |||||
| QoL of participants living with SCD and their caregivers | Not measured. | |||||
| Adverse effects Follow‐up: up to 6 months |
Only McMahon 2010 reported adverse events and reported: "No serious adverse events were reported to be directly related to the study drug. Drug‐related adverse events related to Arginine Butyrate included headache and nausea, which were usually preventable or controlled with anti‐emetics and acetaminophen or ibuprofen therapy given prior to and during the cell disease infusions". | ‐ | 26 (1 RCT) |
⊕⊕⊝⊝ Lowa |
‐ | |
| Frequency of hospitalization | Not measured. | |||||
| Frequency of sickle cell‐related complications (mean reduction in leg ulcer area (cm)) Follow‐up: up to 6 months |
The mean reduction in leg ulcer area was ‐2.5 cm in the standard care group. |
The mean reduction in leg ulcer area was 22.87 cm lower (37.92 lower to 7.82 lower) in the intervention group. |
MD ‐22.87 (‐37.92 to ‐7.82) |
46 (2 RCTs) |
⊕⊕⊕⊝ Very lowb,c |
The studies (Koshy 2001; McMahon 2010) also reported number of completely healed leg ulcers at up to six months (46 participants; rate ratio 1.38, 95% CI 0.64 to 2.99; I2 = 0%; 2 trials) and McMahon 2010 (26 participants) reported number of partially healed leg ulcers (rate ratio 1.61, 95% CI 0.69 to 4.03). |
| Haemoglobin status | Not measured. | |||||
| *The risk in the intervention group (and its 95% CI) is based on the assumed risk in the comparison group and the relative effect of the intervention (and its 95% CI). CI: confidence interval; №: number; QoL: quality of life; RCT: randomized controlled trial; SCD: sickle cell disease | ||||||
| GRADE Working Group grades of evidence High certainty: we are very confident that the true effect lies close to that of the estimate of the effect. Moderate certainty: we are moderately confident in the effect estimate; the true effect is likely to be close to the estimate of the effect, but there is a possibility that it is substantially different. Low certainty: our confidence in the effect estimate is limited; the true effect may be substantially different from the estimate of the effect. Very low certainty: we have very little confidence in the effect estimate; the true effect is likely to be substantially different from the estimate of effect. | ||||||
aWe downgraded by two levels for very serious risk of bias due to study limitations. McMahon 2010 had unclear risk of bias for selection bias, blinding of participants and personnel, and 'other bias.' bWe downgraded by two levels for very serious risk of bias due to study limitations. McMahon 2010 and Koshy 2001 had unclear risk of bias in most of the domains, and Koshy 2001 had a high risk of bias for 'other bias'. cDowngraded by one level for serious imprecision due to a wide CI.
Of the review's eight outcomes of interest, McMahon 2010 measured two secondary outcomes (adverse effects and frequency of SCD‐related complications), and Koshy 2001 measured only one secondary outcome for this comparison (frequency of SCD‐related complications).
Secondary outcomes
Adverse effects
McMahon 2010 reported that "No serious adverse events were reported to be directly related to the study drug. Drug‐related adverse events related to arginine butyrate included headache and nausea, which were usually preventable or controlled with anti‐emetics and acetaminophen or ibuprofen therapy given prior to and during the infusions" (low‐certainty evidence).
Frequency of SCD‐related complications
Standard local care plus arginine butyrate may be better than standard local care alone at reducing the diameter of leg ulcers in SCD at up to six months (MD ‐22.87 cm, 95% CI ‐37.92 to ‐7.82; I2 = 0%; 2 studies, 46 participants; very low‐certainty evidence; Analysis 15.1), but the evidence is very uncertain. Further, we are very uncertain whether standard local care plus arginine butyrate increased the number of leg ulcers that healed completely at up to six months compared to standard local care alone (rate ratio 1.38, 95% CI 0.64 to 2.99; I2 = 0%; 2 studies, 46 participants; very low‐certainty evidence; Analysis 15.2), or the number of leg ulcers that partially healed (rate ratio 1.61, 95% CI 0.69 to 4.03; 1 study, 26 participants; very low‐certainty evidence; Analysis 15.2).
15.1. Analysis.

Comparison 15: Standard local care plus arginine butyrate (500 mg/kg) versus standard local care, Outcome 1: Frequency of SCD‐related complications (improvement in leg ulcer size)
15.2. Analysis.
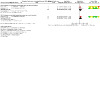
Comparison 15: Standard local care plus arginine butyrate (500 mg/kg) versus standard local care, Outcome 2: Frequency of SCD‐related complications (leg ulcer healing rate)
Comparison group D: two different doses of the same antioxidant
1. Vitamin A (3000 mg) versus vitamin A (6000 mg)
This comparison included one study (22 participants) (Brownell 2020). See Table 23 in Appendix 4 for GRADE judgements for this comparison.
18. Summary of findings: Vitamin A (3000 mg) compared to vitamin A (6000 mg) for sickle cell disease at up to six months.
| Vitamin A (3000mg) compared to vitamin A (6000 mg) for sickle cell disease at up to six months | ||||||
|
Patient or population: sickle cell disease
Setting: outpatient clinic Intervention: vitamin A (3000 mg) Comparison: vitamin A (6000 mg) | ||||||
| Outcomes | Anticipated absolute effects* (95% CI) | Relative effect (95% CI) | № of participants (studies) | Certainty of the evidence (GRADE) | Comments | |
| Risk with vitamin A (6000 mg) | Risk with vitamin A (3000 mg) | |||||
| Frequency of crisis | Not measured. | ‐ | ||||
| Severity of pain | Not measured. | ‐ | ||||
| QoL of participants living with SCD and their caregivers | Not measured. | ‐ | ||||
| Adverse effects | Not measured. | ‐ | ||||
| Frequency of hospitalization | Not measured. | ‐ | ||||
| Frequency of sickle cell‐related complications | Not measured. | ‐ | ||||
| Haemoglobin status Follow‐up: up to 6 months | The mean change in haemoglobin level when taking vitamin A (6000 mg) was 0 g/dL | The mean change in haemoglobin level when taking vitamin A (3000 mg) was 0 g/dL (0.52 lower to 0.52 higher) | MD 0.00 (‐0.52 to 0.52) | 22 (1 RCT) | ⊕⊕⊝⊝ Lowa,b | ‐ |
| *The risk in the intervention group (and its 95% CI) is based on the assumed risk in the comparison group and the relative effect of the intervention (and its 95% CI). CI: confidence interval; MD: mean difference; QoL: quality of life; RCT: randomised controlled trial; SCD: sickle cell disease | ||||||
aDowngraded by one level for serious risk of bias due to unclear risk of bias for attrition because no explanation was given for participants lost to follow‐up. bDowngraded by one level for serious imprecision due to wide CI due to small sample size.
Of the review's eight outcomes of interest, Brownell 2020 measured only two secondary outcomes.
Haemoglobin status
Vitamin A (3000 mg) may make little or no difference to haemoglobin levels in people with SCD compared to vitamin A (6000 mg) at up to six months (MD 0.00 g/dL, 95% CI ‐0.52 to 0.52; 1 study, 22 participants; low‐certainty evidence; Analysis 16.1).
16.1. Analysis.

Comparison 16: Vitamin A (3000 mg) versus vitamin A (6000 mg), Outcome 1: Haemoglobin status (g/dL)
Laboratory markers of haemolysis and inflammation
Low‐certainty evidence showed that vitamin A (6000 mg) may be better than vitamin A (3000 mg) at reducing reticulocyte count at up to six months (MD 2.40%, 95% CI 0.43 to 4.37; 1 study, 22 participants; Analysis 16.2). Vitamin A (3000 mg) may make little or no difference to HbF level compared to vitamin A (6000 mg) at up to six months (MD 1.40%, 95% CI ‐2.75 to 5.55; 1 study, 22 participants; low‐certainty evidence; Analysis 16.2).
16.2. Analysis.

Comparison 16: Vitamin A (3000 mg) versus vitamin A (6000 mg), Outcome 2: Laboratory markers of haemolysis and inflammation
2. N‐acetylcysteine (1200 mg) versus N‐acetylcysteine (2400 mg)
This comparison included two studies (21 participants) (Nur 2012; Pace 2003). See Tables 20 and 21 in Appendix 4 for GRADE judgements for this comparison.
Primary outcomes
Frequency of crisis
One study reported this outcome as the number of VOC episodes per group (10 participants) (Pace 2003). We are very uncertain whether NAC (2400 mg) is better than NAC (1200 mg) at reducing the number of VOC episodes at up to 12 months (rate ratio 0.77, 95% CI 0.24 to 2.50; 1 study, 10 participants; very low‐certainty evidence; Analysis 17.1).
17.1. Analysis.

Comparison 17: N‐acetylcysteine (1200 mg) versus N‐acetylcysteine (2400 mg), Outcome 1: Frequency of crisis
Severity of pain
Neither study measured this outcome.
QoL of participants living with SCD and their caregivers
Neither study measured this outcome.
Secondary outcomes
Adverse effects
One study (11 participants) reported this outcome at up to six months, but not in a format that could be analysed (Nur 2012). Investigators reported that "One patient (P4) discontinued using NAC after 3 weeks and withdrew from the study. One patient on the 2400 mg NAC dose had gastro‐intestinal complaints that disappeared after switching to 1200 mg on the second day of treatment which she continued using (P 6)" (Nur 2012) (1 study, 11 participants; very low‐certainty evidence).
Frequency of hospitalization
Neither study measured this outcome.
Frequency of SCD‐related complications
Neither study measured this outcome.
Haemoglobin status
One study reported this outcome (Nur 2012). We are very uncertain whether NAC (1200 mg) is better than NAC (2400 mg) at increasing haemoglobin level in people with SCD at up to six months (MD ‐3.80 g/dL, 95% CI ‐7.68 to 0.08; 1 study, 11 participants; very low‐certainty evidence; Analysis 17.2).
17.2. Analysis.

Comparison 17: N‐acetylcysteine (1200 mg) versus N‐acetylcysteine (2400 mg), Outcome 2: Haemoglobin status (g/dL)
Laboratory markers of haemolysis and inflammation
Neither study measured this outcome.
Discussion
Summary of main results
The review included 26 studies representing 17 comparisons: 13 comparisons of antioxidants (single or in combination) to placebo; one head‐to‐head comparison of different antioxidants (vitamin A plus zinc versus vitamin A alone); one comparison of an antioxidant (arginine butyrate) to standard local care; and two comparisons of antioxidants given at different doses (vitamin A; N‐acetylcysteine). The reporting of review outcomes varied across the studies, with 14 studies reporting on primary outcomes at different time points: frequency of crisis (10 studies), pain severity (five studies), and QoL (three studies). The important secondary outcomes reported included adverse events (nine studies), frequency of hospitalisation (seven studies), frequency of SCD‐related complications (12 studies), and change in haemoglobin status (13 studies). See Table 1; Table 2; Table 3; Table 4; Table 5, and Appendix 4.
Primary outcomes
Overall, eight studies reported on the primary outcomes of the review at six months, using a range of instruments and measurements in a relatively small population.
The effect of the interventions on the frequency of crisis ranged from some reduction to a possible increase in the frequency of crisis. Zinc, NAC (1200 mg), and L‐arginine may not be better than placebo at reducing the frequency of crisis at up to six months (low‐certainty evidence). We are uncertain of the effects of vitamin C (1400 mg) plus vitamin E (800 mg) in reducing the frequency of crisis compared to placebo at up to six months (very low‐certainty evidence, downgraded due to very serious risk of bias and imprecision). The frequency of crisis was not measured for omega‐3 at six months.
The review showed that, at six months, L‐arginine may reduce the severity of pain compared to placebo in people with SCD (low‐certainty evidence). The evidence is very uncertain whether vitamin C (1400 mg) plus vitamin E (800 mg) or NAC (1200 mg) are better than placebo at reducing the severity of pain in people with SCD. We downgraded the certainty of the evidence for these latter two comparisons to very low, due to serious risk of bias, imprecision, and indirectness. It was not clear to what extent the results were influenced by contextual factors such as co‐administered medicines. Studies in other antioxidants did not measure this outcome.
Three studies reported on quality of life, but assessed this with different scales, which meant we were unable to make an overall assessment of the quality of life of participants and their caregivers. Sins 2018 measured the effect of NAC (1200 mg) on mental and physical quality of life using the SF‐36 scoring scale at six months' follow‐up. The evidence is very uncertain about the effect of NAC (1200 mg) compared to placebo in improving quality of life. We downgraded the certainty of the evidence to very low, due to very serious risk of bias and imprecision.
Secondary outcomes
The effect of antioxidants on adverse effects ranged from a reduced to an increased risk of adverse effects, and varied by the type of event assessed. Adverse effects were not reported by 17 of the included studies for 10 comparisons. The most common adverse effects were headaches, gastrointestinal complaints, and rash. Overall, the evidence is very uncertain about the effect of antioxidants on the risk of adverse effects. The certainty of the evidence ranged from very low to low for adverse effects, due to very serious risk of bias and imprecision.
Hospitalization was assessed in terms of frequency of hospitalization, mean difference in frequency, and mean difference in duration of hospitalization. The evidence is uncertain whether L‐arginine reduces the duration of hospitalization compared to placebo at up to six months (very low‐certainty evidence). We are very uncertain of the effects of NAC (1200 mg) on the frequency of hospitalization compared to placebo, as the certainty of the evidence was very low. We downgraded the certainty of the evidence for serious risk of bias, imprecision, and indirectness.
Twelve studies reported the frequency of SCD‐related complications. However, the studies considered different presentations of SCD complications, such as leg ulcers, acute chest syndrome, infections, SCD‐related dactylitis, splenic sequestration, blood transfusion, and severe anaemia, and applied a wide range of interventions; hence, a pooled analysis of the effect was not possible. The evidence is very uncertain about the effects of vitamin C (1400 mg) plus vitamin E (800 mg), zinc, and NAC (1200 mg) in reducing the frequency of SCD‐related complications at six months, compared to placebo. We downgraded the certainty of the evidence to very low due to serious risk of bias, imprecision, and indirectness.
Haemoglobin status was assessed in many studies by a difference in the mean haemoglobin levels between groups. The effect ranged from little to none, with substantial heterogeneity observed across the studies. There was low‐certainty evidence that zinc may result in a slight increase in haemoglobin level compared to placebo, but L‐arginine and NAC (1200 mg) at up to six months may make little to no difference. We are very uncertain of the effect of other interventions, including vitamin C (1400 mg) plus vitamin E (800 mg) and omega‐3, in increasing haemoglobin level at up to six months, compared to placebo (all very low‐certainty evidence). We downgraded the certainty of the evidence due to very serious risk of bias and imprecision.
Overall completeness and applicability of evidence
The review represents a detailed summary of the effect of antioxidants on several key outcomes in the management of SCD. The comparisons and outcomes reflect the range of applications where antioxidants have been considered. The wide range of interventions and outcomes creates methodological challenges to producing summaries of overall effects derived from the evidence, and thus also has implications for the applicability of the evidence. Most interventions showed very little or no effect on the outcomes assessed. Antioxidants are used as adjuvant treatment and produce effects by targeting different pathways and this could account for the heterogeneity in effects. Most studies were in small populations, and outcomes were measured differently across studies: both of these features could raise questions about the applicability of the evidence to a wider population.
Certainty of the evidence
The review is based on data from 26 studies with 17 comparisons and a wide range of outcomes. However, each comparison was evaluated in relatively small populations, with the certainty of the evidence judged as low or very low across the outcomes assessed.
We downgraded the certainty of the evidence for the following reasons: serious risk of bias, serious indirectness, and serious/very serious imprecision because of wide confidence intervals involving both harm and benefit. The certainty of the evidence was very low for L‐glutamine, very low for vitamin C plus vitamin E, moderate to low for zinc, low to very low for N‐acetylcysteine, low to very low for L‐arginine, very low for omega‐3, low for folic acid, very low for extended‐release niacin, very low for vitamin A, very low for vitamin A plus zinc, very low for oral propionyl‐L‐carnitine, and low to very low for arginine butyrate. The interventions were compared to either placebo or standard local care, with some of the comparisons having co‐interventions for both treatment arms; in some cases, different dosages of interventions were compared. Overall, the certainty of the evidence for most interventions was very low (Table 1; Table 2; Table 3; Table 4; Table 5).
Potential biases in the review process
We could not add the data from some included studies to the analyses in this review (Martins 2009; Morris 2019; Prasad 1984; Serjeant 1970; Styles 2007), as the full texts were not accessible, and we could not reach the study authors to request additional data. We did not prespecify the time points of interest. We classified time points into six months, 12 months, and over 12 months in assessing the outcomes, based on clinical feedback and the range of follow‐up periods reported in the studies. We also made a judgement as to which comparisons we included in the core summary of findings tables and at what time point, based on clinical importance. We acknowledge that these judgements reflect subjective decisions by the study team.
Finally, we did not include vitamin D, which is known to have antioxidant properties, as this is covered by another review (Soe 2020).
It is unclear to us whether these differences between our protocol and systematic review may have introduced some level of bias.
Agreements and disagreements with other studies or reviews
In 2013, a Cochrane review on zinc supplementation concluded that zinc was beneficial for reducing the frequency of crisis in SCD (Swe 2013). In contrast to this, Dekker 2012 reported that the effect of zinc on VOC was less convincing, though it showed a beneficial effect in reducing the occurrence of infection. In this present review, the effect of zinc on the frequency of crises was measured in two included studies, and we found no evidence that zinc was beneficial in reducing the frequency of crises or improving sickle cell disease‐related complications (such as leg ulcers) compared to placebo, based on low‐ to very low‐certainty evidence.
A review by Delesderrier 2020 included many of the primary studies included in this review, but due to the heterogeneity of the results, presented a narrative summary. We observed differences in the risk of bias scores for the included studies, but the overall score in both reviews indicates a high risk of bias across most of the studies. The deductions on the effect of antioxidants, such as vitamins A, C, D, as well as L‐arginine, L‐glutamine, and N‐acetylcysteine, on haemolysis markers and change in haemoglobin indices were similar in both reviews. However, Delesderrier 2020 drew more positive conclusions on the effects of the interventions, which may not be consistent with the data, and they did not provide an objective assessment of the certainty of the evidence.
Similarly, there is some overlap in the studies and outcomes reported here and those in the review by Sins 2017, which included five studies evaluating the effect of antioxidants, in addition to other types of interventions for the management of sickle cell disease. Both reviews agree on the poor methodological rigour in the included studies, with an overall high risk of bias in most studies as assessed by the Cochrane RoB tool. However, while the findings from Sins 2017 support L‐glutamine, ours do not. Our findings are in agreement with those reported by Cieri‐Hutcherson 2019 on the uncertainty of the evidence regarding the potential benefits of L‐glutamine.
Another review by Gyamfi 2021 focused on evidence‐based interventions. It included a broad range of interventions, including disease‐modifying agents, supportive care agents/analgesics, anti‐malarials, systemic treatments, patient/ provider education, and nutritional supplements. Gyamfi 2021 applied methods as described in the Cochrane Handbook, including the use of the RoB tool to assess the methodological quality of the included studies. The review focused on implementation outcomes measures (adoption, appropriateness, acceptability, cost, feasibility, fidelity, penetration, and sustainability), so its findings are not comparable with our review.
Authors' conclusions
Implications for practice.
There is a lot of interest in the use of antioxidants to reduce the risks associated with sickle cell disease (SCD). In this review, none of the interventions showed any benefit in reducing the frequency of crisis compared to placebo at up to six months. Also, L‐arginine was the only intervention more beneficial than placebo in reducing the severity of pain at up to six months. In the comparisons that reported adverse events, the risk of adverse events between antioxidants and placebo was not different. However, one participant allocated to L‐arginine developed hives during infusion of L‐arginine, another experienced acute clinical deterioration, and a participant in the placebo group had clinically relevant increases in liver function enzymes. Most studies were small, and outcomes were measured differently across studies: these features potentially limit the applicability of the review's findings to a wider population. We conclude that the evidence supporting the effect of the interventions was of very low to low certainty for the review's primary outcomes, and the evidence for the secondary outcomes was inconclusive. The decision to use these antioxidants for the management of sickle cell disease should follow careful consideration of their marginal risks and benefits.
Implications for research.
The wide range of potential interventions for and presentations of sickle cell disease crisis make a clear assessment of the effects of antioxidants challenging. More randomized controlled trials (RCTs) are required to better understand the role of antioxidants in the onset, progression, or resolution of sickle cell disease crisis. Future research should include large, multicenter RCTs that address the effects of clinically important antioxidants, including zinc, omega‐3, N‐acetylcysteine, L‐glutamine, vitamin C plus vitamin E, and L‐arginine, on the complications of sickle cell disease, painful episodes and their severity, frequency of hospitalization, haemoglobin, and adverse effects. There is also a need for stakeholders to reach a consensus on important SCD outcomes and validated tools for measuring these outcomes in clinical trials involving SCD. Doing so could minimize variations in outcome reporting, resulting in more precise assessments of the effects of antioxidants as interventions in SCD.
History
Protocol first published: Issue 4, 2020
Acknowledgements
We acknowledge the support of Cochrane South Africa, responsible for managing the Aubrey Sheiham award, which provided partial support to the contact author for dedicated time to work on the review.
Editorial and peer‐reviewer contributions
Cochrane Cystic Fibrosis and Genetic Disorders supported the authors in the development of this intervention review up to April 2023.
The following people conducted the editorial process for this article:
Sign‐off Editor (final editorial decision): Mariane de Montalembert, Necker‐Enfants Malades Hospital, Paris, France.
Managing Editor: Helen Wakeford, Cochrane Central Editorial Service (selected peer reviewers, provided editorial guidance to authors, edited the article); Joanne Duffield, Cochrane Central Editorial service (provided editorial guidance to authors, edited the article).
Editorial Assistant (conducted editorial policy checks, collated peer‐reviewer comments and supported editorial team): Leticia Rodrigues, Cochrane Central Editorial Service.
Copy Editor (copy editing and production): Faith Armitage, Cochrane Central Production Service.
Peer‐reviewers (provided comments and recommended an editorial decision): Nuala Livingstone, Cochrane Evidence Production and Methods Directorate (methods review), Jo Abbott ‐ Information Specialist (search review), Luis Almeida and Zenaide Quezado Affiliation National Institutes of Health Clinical Center (clinical/content review), Nicola Conran, University of Campinas, Brazil (clinical/content review), and Cassandra Trimnell, Sickle Cell 101 (consumer review).
Appendices
Appendix 1. Glossary of terms
| Term | Definition |
| Polymerization | Arrangement of haemoglobin within the red blood cell as long parallel fibres |
| Microcapillaries | The microvessels that carry blood from arterioles to venules. They are lined by the endothelial walls, and serve as an exchange site between the intravascular compartment and the interstitium. |
| Lyse | Break down |
| Peroxidation | Loss of free electron to free radicals |
| Neutralizing | Removing the toxic effect |
| Resonance delocalization | Release of free electron from a covalent bond |
| Cell signalling | Transfer of information from receptors on the cell surface to the nucleus for gene expression |
| Gene expression | Process by which nucleotide sequence is being used for protein synthesis |
Appendix 2. Search methods – Electronic databases
MEDLINE via PubMed
DATE OF SEARCH up to 15 August 2023
Anemia, Sickle Cell [mh: noexp]
Sickle cell trait [mh]
Hemoglobin SC Disease [mh]
Hemoglobin, Sickle [mh]
“Hemoglobin SC” [tiab]OR “Haemoglobin SC” [tiab] OR “Hemoglobin SS” [tiab] OR “Haemoglobin SS” [tiab] OR “Hemoglobin C” [tiab] OR “Haemoglobin C” [tiab] OR “Hemoglobin S” [tiab] OR “haemoglobin S” [tiab] OR “Hemoglobin D” [tiab] OR “Haemoglobin D” [tiab] OR “Hemoglobin SE” [tiab] OR “Haemoglobin SE” [tiab]
“Hb C disease” [tiab] OR “Hb D disease” [tiab] OR “Hb E disease” [tiab] OR “SC disease” [tiab] OR “HbS Disease” [tiab]
“Sickle cell” [tiab] OR “Sickling disorder” [tiab]
Hemoglobinopathies [tiab]
("Cell Disorder" [tiab] OR "Cell Disorders" [tiab] OR “Cell Diseases” [tiab] OR “Cell Disease” [tiab]) AND Sickle [tiab]
Hb SC [tiab] OR HbSC [tiab] OR HbAS [tiab] OR Hb AS [tiab] OR HbSS [tiab] OR Hb SS [tiab] OR HbAC [tiab] OR Hb AC [tiab] OR Hb SE [tiab] OR HbSE [tiab]
Thalassaemia [tiab] OR Thalassemia [tiab]
#1 OR #2 OR #3 OR #4 OR #5 OR #6 OR #7 OR #8 OR #9 OR #10 OR #11
Antioxidants [mh]
Antioxidant* [tiab] OR “Anti oxidants” [tiab] OR “Anti Oxidant” [tiab]
Vitamin e [mh]
Beta carotene [mh]
Ascorbic Acid [mh]
Vitamin A [mh]
selenium [mh]
Glutathione [mh]
Retinoids [mh]
Curcumin [mh]
tocopherols [mh] OR tocotrienols [mh]
“Ascorbic acid” [tiab] OR “Vitamin C” [tiab] OR Ascorbate [tiab] OR Ascorbicum [tiab]
“vitamin E” [tiab] OR carotene [tiab] OR betacarotene [tiab] OR “beta carotene” [tiab]
tocopherol* [tiab] OR tocotrienol* [tiab] OR selenium [tiab] OR magnorbin [tiab]
GSH [tiab] OR Glutathione [tiab] OR NAC [tiab] OR Acetylcysteine [tiab] OR Cysteine [tiab]
Retinoid* [tiab] OR Zinc [tiab] OR Glutamine [tiab] OR Micronutrients [tiab] OR “Edetate sodium” [tiab]
#13 OR #14 OR #15 OR #16 OR #17 OR #18 OR #19 OR #20 OR #21 OR #22 OR #23 OR #24 OR #25 OR #26 OR #27 OR #28
Embase Ovid SP
| Source | Search strategy |
| Embase Ovid SP | 1 sickle cell anemia/ (34884) 2 sickle cell trait/ (2819) 3 hemoglobin SC disease/ (852) 4 hemoglobin S/ (5155) 5 ("Hemoglobin SC" or "Haemoglobin SC" or "Hemoglobin SS" or "Haemoglobin SS" or "Hemoglobin C" or "Haemoglobin C" or "Hemoglobin S" or "haemoglobin S" or "Hemoglobin D" or "Haemoglobin D" or "Hemoglobin SE" or "Haemoglobin SE").ti,ab. (3052) 6 ("Hb C disease" or "Hb D disease" or "Hb E disease" or "SC disease" or "HbS Disease").ti,ab. (523) 7 ("Sickle cell" or "Sickling disorder").ti,ab. (34777) 8 Hemoglobinopathies.ti,ab. (4441) 9 (("Cell Disorder" or "Cell Disorders" or "Cell Diseases" or "Cell Disease") and Sickle).ti,ab. (26040) 10 (Hb SC or HbSC or HbAS or Hb AS or HbSS or Hb SS or HbAC or Hb AC or Hb SE or HbSE).ti,ab. (69349) 11 (Thalassaemia or Thalassemia).ti,ab. (26364) 12 1 or 2 or 3 or 4 or 5 or 6 or 7 or 8 or 9 or 10 or 11 (124840) 13 antioxidant/ (175854) 14 (Antioxidant* or "Anti oxidants" or "Anti Oxidant").ti,ab. (338479) 15 alpha tocopherol/ (62885) 16 beta carotene/ (19526) 17 ascorbic acid/ (88247) 18 retinol/ (33645) 19 selenium/ (38687) 20 glutathione/ (107920) 21 retinoid/ (13355) 22 curcumin/ (35829) 23 tocopherol/ or alpha tocotrienol/ (7164) 24 ("Ascorbic acid" or "Vitamin C" or Ascorbate or Ascorbicum).ti,ab. (66150) 25 ("vitamin E" or carotene or betacarotene or "beta carotene").ti,ab. (43625) 26 (tocopherol* or tocotrienol* or selenium or magnorbin).ti,ab. (52791) 27 (GSH or Glutathione or NAC or Acetylcysteine or Cysteine).ti,ab. (280792) 28 (Retinoid* or Zinc or Glutamine or Micronutrients or "Edetate sodium").ti,ab. (200243) 29 13 or 14 or 15 or 16 or 17 or 18 or 19 or 20 or 21 or 22 or 23 or 24 or 25 or 26 or 27 or 28 (929847) 30 12 and 29 (5854) 31 limit 30 to embase (3784) |
Appendix 3. Search methods – Clinical trial registries
| Database/ Resource | Strategy |
| ClinicalTrials.gov |
[Advanced search] CONDITION OR DISEASE: sickle cell OTHER TERMS: antioxidant OR oxidative OR vitamin e OR vitamin C OR vitamin a OR ascorbic acid OR zinc OR Glutamine OR glutathione OR Retinoid OR Selenium OR Micronutrients OR Beta‐carotene OR Edetate sodium OR EDTA OR acetylcysteine STUDY TYPE: Interventional Studies (Clinical Trials) |
| WHO ICTRP |
[Advanced Search] CONDITION: sickle cell INTERVENTION: antioxidant OR oxidative OR vitamin e OR vitamin C OR vitamin a OR ascorbic acid OR zinc OR Glutamine OR glutathione OR Retinoid OR Selenium OR Micronutrients OR Beta‐carotene OR Edetate sodium OR EDTA OR acetylcysteine RECRUITMENT STATUS: All |
| The Cochrane Cystic Fibrosis and Genetic Disorders Group's Haemoglobinopathies Trials Register | (sickle cell OR (haemoglobinopathies AND general)) AND (antioxidants) |
Appendix 4. Additional summary of findings tables
Table 6; Table 8; Table 9; Table 11; Table 13; Table 14; Table 15; Table 16; Table 18; Table 20; Table 22; Table 41; Table 42; Table 19; Table 23; Table 43; Table 41
19. Summary of findings: N‐acetylcysteine (1200 mg) versus N‐acetylcysteine (2400 mg) for sickle cell disease at up to 12 months.
| N‐acetylcysteine (1200 mg) versus N‐acetylcysteine (2400 mg) for sickle cell disease at up to 12 months | ||||||
|
Patient or population: sickle cell disease Setting: outpatient clinic Intervention: N‐acetylcysteine (NAC) (1200 mg) Comparison: NAC (2400 mg) | ||||||
| Outcomes | Anticipated absolute effects* (95% CI) | Relative effect (95% CI) | № of participants (studies) | Certainty of the evidence (GRADE) | Comments | |
| Risk with NAC (2400 mg) | Risk with NAC (1200 mg) | |||||
| Frequency of crisis (VOC) Follow‐up: 12 months | ‐ | ‐ | Rate ratio 0.77 (0.24 to 2.50) | 10 (1 RCT) | ⨁◯◯◯ Very lowa,b | ‐ |
| Severity of pain | Not measured. | |||||
| QoL of participants living with SCD and their caregivers | Not measured. | |||||
| Adverse effects | Not measured. | |||||
| Frequency of hospitalization | Not measured. | |||||
| Frequency of SCD‐related complications | Not measured. | |||||
| Haemoglobin status | Not measured. | |||||
| *The risk in the intervention group (and its 95% CI) is based on the assumed risk in the comparison group and the relative effect of the intervention (and its 95% CI). CI: confidence interval; NAC: N‐acetylcysteine; №: number; QoL: quality of life; RCT: randomised controlled trial; SCD: sickle cell disease; VOC: vaso‐occlusive crisis | ||||||
| GRADE Working Group grades of evidence High certainty: we are very confident that the true effect lies close to that of the estimate of the effect. Moderate certainty: we are moderately confident in the effect estimate; the true effect is likely to be close to the estimate of the effect, but there is a possibility that it is substantially different. Low certainty: our confidence in the effect estimate is limited; the true effect may be substantially different from the estimate of the effect. Very low certainty: we have very little confidence in the effect estimate; the true effect is likely to be substantially different from the estimate of effect. | ||||||
aDowngraded by two levels for very serious risk of bias due to unclear risk of bias for random sequence generation and allocation concealment. bDowngraded by one level for serious imprecision for wide CI due to small sample size from a single study.
20. Summary of findings: Extended‐release niacin (niacin‐ER) compared to placebo for sickle cell disease at up to six months.
| Extended‐release niacin (niacin‐ER) compared to placebo for sickle cell disease at up to six months | ||||||
| Patient or population: sickle cell disease Setting: outpatient clinic Intervention: extended‐release niacin (niacin‐ER) Comparison: placebo | ||||||
| Outcomes | Anticipated absolute effects* (95% CI) | Relative effect (95% CI) | № of participants (studies) | Certainty of the evidence (GRADE) | Comments | |
| Risk with placebo | Risk with extended release niacin (niacin‐ER) | |||||
| Frequency of crisis | Not measured. | ‐ | ||||
| Severity of pain | Not measured. | ‐ | ||||
| QoL of participants living with SCD and their caregivers | Not measured. | ‐ | ||||
| Adverse effects | Not measured. | ‐ | ||||
| Frequency of hospitalization | Not measured. | ‐ | ||||
| Frequency of sickle cell‐related complications | Not measured. | ‐ | ||||
| Haemoglobin status (g/dL) Follow‐up: up to 6 months |
The mean change from baseline in haemoglobin level when taking placebo was 8.8 g/dL. | The mean change in haemoglobin levels when taking niacin‐ER was 0.4 g/dL higher (0.69 lower to 1.49 higher). | MD 0.40 (‐0.69 to 1.49) | 27 (1 RCT) | ⊕⊝⊝⊝ Very lowa,b | ‐ |
| *The risk in the intervention group (and its 95% CI) is based on the assumed risk in the comparison group and the relative effect of the intervention (and its 95% CI). CI: confidence interval; MD: mean difference; QoL: quality of life; RCT: randomized controlled trial | ||||||
|
GRADE Working Group grades of evidence
High certainty: we are very confident that the true effect lies close to that of the estimate of the effect. Moderate certainty: we are moderately confident in the effect estimate; the true effect is likely to be close to the estimate of the effect, but there is a possibility that it is substantially different. Low certainty: our confidence in the effect estimate is limited; the true effect may be substantially different from the estimate of the effect. Very low certainty: we have very little confidence in the effect estimate; the true effect is likely to be substantially different from the estimate of effect. | ||||||
aWe downgraded by two levels for very serious risk of bias due to attrition bias and unclear risk of bias in other domains. bWe downgraded by one level for serious imprecision due to a wide confidence interval because of the small sample size.
21. Summary of findings: N‐acetylcysteine (1200 mg) compared to N‐acetylcysteine (2400 mg) for sickle cell disease at up to six months.
| N‐acetylcysteine (1200 mg) compared to N‐acetylcysteine (2400 mg) for sickle cell disease | ||||||
| Patient or population: sickle cell disease Setting: outpatient clinic Intervention: N‐acetylcysteine (NAC) (1200 mg) Comparison: NAC (2400 mg) | ||||||
| Outcomes | Anticipated absolute effects* (95% CI) | Relative effect (95% CI) | № of participants (studies) | Certainty of the evidence (GRADE) | Comments | |
| Risk with NAC (2400 mg) | Risk with NAC (1200 mg) | |||||
| Frequency of crisis | Not measured. | ‐ | ||||
| Severity of pain | Not measured. | ‐ | ||||
| QoL of participants living with SCD and their caregivers | Not measured. | ‐ | ||||
| Adverse events Follow‐up: up to 6 months | Nur 2011 reported: "One patient (P4) discontinued using NAC after 3 weeks and withdrew from the study. One patient on the 2400 mg NAC dose had gastro‐intestinal complaints that disappeared after switching to 1200 mg on the second day of treatment which she continued using. No other patient reported adverse events". | 11 (1 RCT) | ⊕⊝⊝⊝ Very lowa,b | ‐ | ||
| Frequency of hospitalizations | Not measured. | ‐ | ||||
| Frequency of SCD‐related complications | Not measured. | ‐ | ||||
| Haemoglobin status (g/dL) Follow‐up: up to 6 months | The mean haemoglobin level when taking NAC 2400 mg was 6.5 g/dL. | The mean haemoglobin level when taking NAC 1200 mg was 3.8 g/dL lower (7.68 lower to 0.08 higher). | MD ‐3.80 (‐7.68 to 0.08) | 11 (1 RCT) | Very lowa, b | ‐ |
| *The risk in the intervention group (and its 95% CI) is based on the assumed risk in the comparison group and the relative effect of the intervention (and its 95% CI). CI: confidence interval; NAC: N‐acetylcysteine; № : number; QoL: quality of life; RCT: randomised controlled trial; SCD: sickle cell disease | ||||||
| GRADE Working Group grades of evidence High certainty: we are very confident that the true effect lies close to that of the estimate of the effect. Moderate certainty: we are moderately confident in the effect estimate; the true effect is likely to be close to the estimate of the effect, but there is a possibility that it is substantially different. Low certainty: our confidence in the effect estimate is limited; the true effect may be substantially different from the estimate of the effect. Very low certainty: we have very little confidence in the effect estimate; the true effect is likely to be substantially different from the estimate of the effect. | ||||||
aDowngraded by two levels for very serious risk of bias due to unclear risk of bias for random sequence generation and allocation concealment. bDowngraded by one level for serious imprecision for wide CI due to small sample size.
Data and analyses
Comparison 1. L‐glutamine with hydroxyurea versus placebo with hydroxyurea.
| Outcome or subgroup title | No. of studies | No. of participants | Statistical method | Effect size |
|---|---|---|---|---|
| 1.1 Frequency of crisis (mean number of pain crises) | 1 | Mean Difference (IV, Fixed, 95% CI) | Totals not selected | |
| 1.1.1 At up to 12 months | 1 | Mean Difference (IV, Fixed, 95% CI) | Totals not selected | |
| 1.2 Frequency of hospitalisation | 1 | Mean Difference (IV, Fixed, 95% CI) | Totals not selected | |
| 1.2.1 Mean number of days in hospital (up to 12 months) | 1 | Mean Difference (IV, Fixed, 95% CI) | Totals not selected | |
| 1.2.2 Mean cumulative number days in hospital (at up to 12 months) | 1 | Mean Difference (IV, Fixed, 95% CI) | Totals not selected | |
| 1.2.3 Mean number of emergency clinic visits (at up to 12 months) | 1 | Mean Difference (IV, Fixed, 95% CI) | Totals not selected | |
| 1.3 SCD‐related complications (number of participants) | 1 | Risk Ratio (IV, Fixed, 95% CI) | Totals not selected | |
| 1.3.1 Acute chest syndrome (at up to 12 months) | 1 | Risk Ratio (IV, Fixed, 95% CI) | Totals not selected |
Comparison 2. Vitamin C (1400 mg) + vitamin E (800 mg) versus placebo.
| Outcome or subgroup title | No. of studies | No. of participants | Statistical method | Effect size |
|---|---|---|---|---|
| 2.1 Frequency of crisis (number of participants with pain crisis) | 1 | Risk Ratio (M‐H, Fixed, 95% CI) | Totals not selected | |
| 2.1.1 Number of participants who experienced pain crisis at up to 6 months | 1 | Risk Ratio (M‐H, Fixed, 95% CI) | Totals not selected | |
| 2.2 Severity of pain | 1 | Risk Ratio (M‐H, Fixed, 95% CI) | Totals not selected | |
| 2.2.1 Number of participants using opioid analgesics (at up to 6 months) | 1 | Risk Ratio (M‐H, Fixed, 95% CI) | Totals not selected | |
| 2.2.2 Number of participants using NSAIDs (at up to 6 months) | 1 | Risk Ratio (M‐H, Fixed, 95% CI) | Totals not selected | |
| 2.3 Adverse events | 1 | Risk Ratio (M‐H, Fixed, 95% CI) | Totals not selected | |
| 2.3.1 At up to 6 months (number of participants experiencing AEs) | 1 | Risk Ratio (M‐H, Fixed, 95% CI) | Totals not selected | |
| 2.4 SCD‐related complications (number of participants) | 1 | Risk Ratio (M‐H, Fixed, 95% CI) | Totals not selected | |
| 2.4.1 Leg ulcer (at up to six months) | 1 | Risk Ratio (M‐H, Fixed, 95% CI) | Totals not selected | |
| 2.4.2 Acute chest syndrome (at up to six months) | 1 | Risk Ratio (M‐H, Fixed, 95% CI) | Totals not selected | |
| 2.4.3 Priapism (at up to six months) | 1 | Risk Ratio (M‐H, Fixed, 95% CI) | Totals not selected | |
| 2.4.4 Stroke (at up to six months) | 1 | Risk Ratio (M‐H, Fixed, 95% CI) | Totals not selected | |
| 2.4.5 Blood transfusion (at up to six months) | 1 | Risk Ratio (M‐H, Fixed, 95% CI) | Totals not selected |
Comparison 3. Zinc versus placebo.
| Outcome or subgroup title | No. of studies | No. of participants | Statistical method | Effect size |
|---|---|---|---|---|
| 3.1 Frequency of crisis (number of VOC episodes) | 2 | Rate Ratio (IV, Fixed, 95% CI) | Totals not selected | |
| 3.1.1 Frequency of crisis (number of sickle pain episodes at over six months ) | 1 | Rate Ratio (IV, Fixed, 95% CI) | Totals not selected | |
| 3.1.2 Number of vaso‐occlusive crises (at over 12 months) | 1 | Rate Ratio (IV, Fixed, 95% CI) | Totals not selected | |
| 3.1.3 Total episodes of crisis (at up to 12 months) | 1 | Rate Ratio (IV, Fixed, 95% CI) | Totals not selected | |
| 3.2 Frequency of crisis (mean number of pain crises) | 1 | Mean Difference (IV, Fixed, 95% CI) | Totals not selected | |
| 3.2.1 At over 12 months (mean frequency of crisis) | 1 | Mean Difference (IV, Fixed, 95% CI) | Totals not selected | |
| 3.3 QoL of participants living with SCD and their caregivers | 1 | Mean Difference (IV, Fixed, 95% CI) | Totals not selected | |
| 3.3.1 Loss of work days/crisis (at over 12 months) | 1 | Mean Difference (IV, Fixed, 95% CI) | Totals not selected | |
| 3.4 Frequency of hospitalization | 1 | Mean Difference (IV, Fixed, 95% CI) | Totals not selected | |
| 3.4.1 At over 12 months (mean hospital stay/crisis) | 1 | Mean Difference (IV, Fixed, 95% CI) | Totals not selected | |
| 3.5 SCD‐related complications (sq mm per day) | 1 | Risk Ratio (M‐H, Fixed, 95% CI) | Totals not selected | |
| 3.5.1 Number of participants with improved leg ulcer (sq mm per day) at up to 6 months | 1 | Risk Ratio (M‐H, Fixed, 95% CI) | Totals not selected | |
| 3.5.2 Complete healing of leg ulcer (sq mm per day) at up to 6 months | 1 | Risk Ratio (M‐H, Fixed, 95% CI) | Totals not selected | |
| 3.6 Frequency of SCD‐related complications (number of participants with infections) at 6 months | 1 | 36 | Odds Ratio (M‐H, Fixed, 95% CI) | 0.06 [0.01, 0.54] |
| 3.7 SCD‐related complications (other) | 1 | Rate Ratio (IV, Fixed, 95% CI) | Totals not selected | |
| 3.7.1 Sequestration (at over 12 months) | 1 | Rate Ratio (IV, Fixed, 95% CI) | Totals not selected | |
| 3.7.2 Haemolytic crisis (at over 12 months) | 1 | Rate Ratio (IV, Fixed, 95% CI) | Totals not selected | |
| 3.7.3 Aplastic crisis (at over 12 months) | 1 | Rate Ratio (IV, Fixed, 95% CI) | Totals not selected | |
| 3.8 Haemoglobin status (g/dL) (at up to 6 months) | 1 | Mean Difference (IV, Fixed, 95% CI) | Totals not selected | |
| 3.9 Haemoglobin % (at over 12 months) | 1 | Mean Difference (IV, Fixed, 95% CI) | Totals not selected | |
| 3.10 Laboratory markers of haemolysis and inflammation | 2 | Mean Difference (IV, Fixed, 95% CI) | Totals not selected | |
| 3.10.1 White blood cells 103/L (at up to 6 months) | 1 | Mean Difference (IV, Fixed, 95% CI) | Totals not selected | |
| 3.10.2 Reticulocyte % (at over 12 months) (mean difference post intervention) | 1 | Mean Difference (IV, Fixed, 95% CI) | Totals not selected | |
| 3.10.3 Platelets 103/L (at up to 6 months) (mean change from baseline) | 1 | Mean Difference (IV, Fixed, 95% CI) | Totals not selected | |
| 3.11 Laboratory markers of haemolysis and inflammation | 1 | Mean Difference (IV, Fixed, 95% CI) | Totals not selected | |
| 3.11.1 Reticulocytes (%) at up to six months (mean change from baseline) | 1 | Mean Difference (IV, Fixed, 95% CI) | Totals not selected | |
| 3.11.2 Reticulocytes (%) at up to 12 months (mean change from baseline) | 1 | Mean Difference (IV, Fixed, 95% CI) | Totals not selected |
3.11. Analysis.

Comparison 3: Zinc versus placebo, Outcome 11: Laboratory markers of haemolysis and inflammation
Comparison 4. Vitamin A versus placebo.
| Outcome or subgroup title | No. of studies | No. of participants | Statistical method | Effect size |
|---|---|---|---|---|
| 4.1 Frequency of crisis (mean change from baseline: number of vaso‐occlusive crises (at up to 12 months)) | 1 | 44 | Mean Difference (IV, Fixed, 95% CI) | 0.10 [‐0.17, 0.37] |
| 4.2 Frequency of hospitalization (mean change from baseline) | 1 | Mean Difference (IV, Fixed, 95% CI) | Totals not selected | |
| 4.2.1 Mean number of hospitalizations at up to 12 months (days) | 1 | Mean Difference (IV, Fixed, 95% CI) | Totals not selected | |
| 4.2.2 Mean number of days in short‐stay medical unit (haematology acute care unit) (at up to 12 months) | 1 | Mean Difference (IV, Fixed, 95% CI) | Totals not selected | |
| 4.2.3 Mean number of emergency visits (at up to 12 months) | 1 | Mean Difference (IV, Fixed, 95% CI) | Totals not selected | |
| 4.3 Frequency of SCD‐related complications (mean change from baseline) | 1 | Mean Difference (IV, Fixed, 95% CI) | Totals not selected | |
| 4.3.1 Mean number of episodes of acute chest syndrome (at up to 12 months) | 1 | Mean Difference (IV, Fixed, 95% CI) | Totals not selected | |
| 4.4 Laboratory markers of haemolysis and inflammation | 1 | Mean Difference (IV, Fixed, 95% CI) | Totals not selected | |
| 4.4.1 Reticulocytes % (mean) at up to 12 months | 1 | Mean Difference (IV, Fixed, 95% CI) | Totals not selected |
Comparison 5. Vitamin A + zinc versus placebo.
| Outcome or subgroup title | No. of studies | No. of participants | Statistical method | Effect size |
|---|---|---|---|---|
| 5.1 Frequency of crisis (mean change from baseline: number of vaso‐occlusive crises (at up to 12 months)) | 1 | Mean Difference (IV, Fixed, 95% CI) | Totals not selected | |
| 5.2 Frequency of hospitalization (mean change from baseline) | 1 | Mean Difference (IV, Fixed, 95% CI) | Totals not selected | |
| 5.2.1 Mean number of hospitalizations (days) (at up to 12 months) | 1 | Mean Difference (IV, Fixed, 95% CI) | Totals not selected | |
| 5.2.2 Mean number of days in short‐stay medical unit (haematology acute care unit) (at up to 12 months) | 1 | Mean Difference (IV, Fixed, 95% CI) | Totals not selected | |
| 5.2.3 Mean number of emergency visits (at up to 12 months) | 1 | Mean Difference (IV, Fixed, 95% CI) | Totals not selected | |
| 5.3 Frequency of SCD‐related complications | 1 | Mean Difference (IV, Fixed, 95% CI) | Totals not selected | |
| 5.3.1 Mean number of episodes of acute chest syndrome (at up to 12 months) | 1 | Mean Difference (IV, Fixed, 95% CI) | Totals not selected | |
| 5.4 Laboratory markers of haemolysis and inflammation | 1 | Mean Difference (IV, Fixed, 95% CI) | Totals not selected | |
| 5.4.1 Reticulocytes % (at up to 12 months) mean change from baseline | 1 | Mean Difference (IV, Fixed, 95% CI) | Totals not selected |
Comparison 6. N‐acetylcysteine (600 mg) versus placebo.
| Outcome or subgroup title | No. of studies | No. of participants | Statistical method | Effect size |
|---|---|---|---|---|
| 6.1 Frequency of crisis | 1 | Rate Ratio (IV, Fixed, 95% CI) | Totals not selected | |
| 6.1.1 Number of vaso‐occlusive episodes (at up to 12 months) | 1 | Rate Ratio (IV, Fixed, 95% CI) | Totals not selected |
Comparison 7. N‐acetylcysteine (1200 mg) versus placebo.
| Outcome or subgroup title | No. of studies | No. of participants | Statistical method | Effect size |
|---|---|---|---|---|
| 7.1 Frequency of crisis | 2 | Rate Ratio (IV, Fixed, 95% CI) | Subtotals only | |
| 7.1.1 Vaso‐occlusive crises at up to six months (event rate per patient year) | 1 | 96 | Rate Ratio (IV, Fixed, 95% CI) | 0.99 [0.51, 1.92] |
| 7.1.2 Pain days at up to six months (event rate per patient year) | 1 | 96 | Rate Ratio (IV, Fixed, 95% CI) | 0.99 [0.53, 1.84] |
| 7.1.3 Number of episodes of vaso‐occlusive crises (at up to 12 months) | 1 | 10 | Rate Ratio (IV, Fixed, 95% CI) | 0.83 [0.72, 0.95] |
| 7.2 Pain severity (pain intensity) | 1 | Mean Difference (IV, Fixed, 95% CI) | Totals not selected | |
| 7.2.1 Mean pain intensity on pain days at up to 6 months (lower is better) | 1 | Mean Difference (IV, Fixed, 95% CI) | Totals not selected | |
| 7.3 Pain severity (home analgesia) | 1 | Rate Ratio (IV, Fixed, 95% CI) | Totals not selected | |
| 7.3.1 Days with home analgesic (event rate per patient‐year at up to six months) | 1 | Rate Ratio (IV, Fixed, 95% CI) | Totals not selected | |
| 7.4 QoL of participants living with SCD and their caregivers (measured using SF‐36 scoring system) | 1 | Mean Difference (IV, Fixed, 95% CI) | Totals not selected | |
| 7.4.1 Mean change in physical component scale (at up to 6 months) | 1 | Mean Difference (IV, Fixed, 95% CI) | Totals not selected | |
| 7.4.2 Mean change in mental component scale (at up to 6 months) | 1 | Mean Difference (IV, Fixed, 95% CI) | Totals not selected | |
| 7.5 Adverse effects | 1 | Risk Ratio (M‐H, Fixed, 95% CI) | Totals not selected | |
| 7.5.1 Number of participants experiencing any adverse effect at up to 6 months | 1 | Risk Ratio (M‐H, Fixed, 95% CI) | Totals not selected | |
| 7.6 Frequency of hospitalization | 1 | Rate Ratio (IV, Fixed, 95% CI) | Totals not selected | |
| 7.6.1 Event rate of hospitalization (per patient year) | 1 | Rate Ratio (IV, Fixed, 95% CI) | Totals not selected | |
| 7.7 Frequency of SCD‐related complications | 1 | Risk Ratio (M‐H, Fixed, 95% CI) | Totals not selected | |
| 7.7.1 Acute chest syndrome | 1 | Risk Ratio (M‐H, Fixed, 95% CI) | Totals not selected | |
| 7.7.2 Priapism | 1 | Risk Ratio (M‐H, Fixed, 95% CI) | Totals not selected | |
| 7.7.3 Sequestration | 1 | Risk Ratio (M‐H, Fixed, 95% CI) | Totals not selected | |
| 7.8 Haemoglobin status (g/dL) | 1 | Mean Difference (IV, Fixed, 95% CI) | Totals not selected | |
| 7.8.1 Mean change from baseline (at up to six months) | 1 | Mean Difference (IV, Fixed, 95% CI) | Totals not selected | |
| 7.9 Laboratory markers of haemolysis and inflammation | 1 | Mean Difference (IV, Fixed, 95% CI) | Totals not selected | |
| 7.9.1 Total white blood cells x109/L (mean change from baseline at up to 6 months) | 1 | Mean Difference (IV, Fixed, 95% CI) | Totals not selected | |
| 7.9.2 Reticulocytes x103/L (mean change from baseline at up to 6 months) | 1 | Mean Difference (IV, Fixed, 95% CI) | Totals not selected | |
| 7.9.3 Platelet count x103/L (mean change from baseline at up to 6 months) | 1 | Mean Difference (IV, Fixed, 95% CI) | Totals not selected | |
| 7.9.4 LDH U/L (mean change from baseline at up to 6 months) | 1 | Mean Difference (IV, Fixed, 95% CI) | Totals not selected | |
| 7.9.5 CRP mg/L (mean change from baseline at up to six months) | 1 | Mean Difference (IV, Fixed, 95% CI) | Totals not selected |
Comparison 8. N‐acetylcysteine (2400 mg) versus placebo.
| Outcome or subgroup title | No. of studies | No. of participants | Statistical method | Effect size |
|---|---|---|---|---|
| 8.1 Frequency of crises | 1 | Rate Ratio (IV, Fixed, 95% CI) | Totals not selected | |
| 8.1.1 Number of vaso‐occlusive crises (at up to 12 months) | 1 | Rate Ratio (IV, Fixed, 95% CI) | Totals not selected |
Comparison 9. L‐arginine versus placebo.
| Outcome or subgroup title | No. of studies | No. of participants | Statistical method | Effect size |
|---|---|---|---|---|
| 9.1 Frequency of crisis | 1 | Risk Ratio (M‐H, Fixed, 95% CI) | Totals not selected | |
| 9.1.1 Number of participants experiencing daily pain (at up to 6 months) | 1 | Risk Ratio (M‐H, Fixed, 95% CI) | Totals not selected | |
| 9.1.2 Number of participants experiencing weekly pain (at up to 6 months) | 1 | Risk Ratio (M‐H, Fixed, 95% CI) | Totals not selected | |
| 9.1.3 Number of participants experiencing monthly pain (at up to 6 months) | 1 | Risk Ratio (M‐H, Fixed, 95% CI) | Totals not selected | |
| 9.1.4 Number of participants experiencing yearly pain (at up to 6 months) | 1 | Risk Ratio (M‐H, Fixed, 95% CI) | Totals not selected | |
| 9.2 Severity of pain | 2 | Mean Difference (IV, Fixed, 95% CI) | Subtotals only | |
| 9.2.1 Mean change from baseline in pain scores using a 10‐cm visual analogue scale, at up to 6 months (lower score is better ) | 2 | 125 | Mean Difference (IV, Fixed, 95% CI) | ‐1.41 [‐1.65, ‐1.18] |
| 9.2.2 Dose of opioid use mg/kg (mean difference post intervention at up to 6 months) | 2 | 125 | Mean Difference (IV, Fixed, 95% CI) | ‐1.77 [‐2.97, ‐0.57] |
| 9.2.3 Rate of decline of worst pain score at up to six months (mean difference post intervention) (more is better) | 1 | 68 | Mean Difference (IV, Fixed, 95% CI) | 0.41 [0.10, 0.72] |
| 9.3 Frequency of hospitalization | 2 | 125 | Mean Difference (IV, Fixed, 95% CI) | ‐0.85 [‐1.87, 0.17] |
| 9.3.1 Mean length of hospitalization in days (at up to 6 months) | 2 | 125 | Mean Difference (IV, Fixed, 95% CI) | ‐0.85 [‐1.87, 0.17] |
| 9.4 Haemoglobin status (g/dL) | 2 | Mean Difference (IV, Fixed, 95% CI) | Subtotals only | |
| 9.4.1 Mean change from baseline in g/dL (at up to 6 months) | 2 | 106 | Mean Difference (IV, Fixed, 95% CI) | 0.40 [‐0.50, 1.30] |
| 9.5 Laboratory markers of haemolysis and inflammation | 2 | Mean Difference (IV, Random, 95% CI) | Subtotals only | |
| 9.5.1 Reticulocytes % (mean change from baseline at up to 6 months) | 2 | 106 | Mean Difference (IV, Random, 95% CI) | ‐0.86 [‐3.56, 1.83] |
| 9.5.2 Platelets (x 109/L) (mean change from baseline at up to 6 months) | 2 | 106 | Mean Difference (IV, Random, 95% CI) | ‐90.44 [‐312.92, 132.04] |
| 9.5.3 Total white blood cells (X 109/L) (mean change from baseline at up to 6 months) | 1 | 56 | Mean Difference (IV, Random, 95% CI) | 0.10 [‐1.92, 2.12] |
| 9.5.4 HbF (g/dL) (mean change from baseline at up to 6 months) | 1 | 50 | Mean Difference (IV, Random, 95% CI) | 0.10 [‐0.27, 0.47] |
Comparison 10. Omega‐3 versus placebo.
| Outcome or subgroup title | No. of studies | No. of participants | Statistical method | Effect size |
|---|---|---|---|---|
| 10.1 Frequency of crisis | 1 | Rate Ratio (IV, Fixed, 95% CI) | Totals not selected | |
| 10.1.1 Number of pain episodes (rate ratio at up to 12 months) | 1 | Rate Ratio (IV, Fixed, 95% CI) | Totals not selected | |
| 10.2 Adverse effects | 2 | Risk Ratio (M‐H, Fixed, 95% CI) | Totals not selected | |
| 10.2.1 Number of participants with any adverse effect (at up to 6 months) | 1 | Risk Ratio (M‐H, Fixed, 95% CI) | Totals not selected | |
| 10.2.2 Number of participants who had serious adverse effects (at up to 6 months) | 1 | Risk Ratio (M‐H, Fixed, 95% CI) | Totals not selected | |
| 10.2.3 Number of participants who had any adverse effect (at up to 12 months) | 1 | Risk Ratio (M‐H, Fixed, 95% CI) | Totals not selected | |
| 10.3 Frequency of SCD‐related complications | 1 | Risk Ratio (M‐H, Fixed, 95% CI) | Totals not selected | |
| 10.3.1 Number of participants who recieved blood transfusion (at up to 12 months) | 1 | Risk Ratio (M‐H, Fixed, 95% CI) | Totals not selected | |
| 10.3.2 Number of participants who had severe anaemia (at up to 12 months) | 1 | Risk Ratio (M‐H, Fixed, 95% CI) | Totals not selected | |
| 10.3.3 Number of participants who had sequestration crisis (at up to 12 months) | 1 | Risk Ratio (M‐H, Fixed, 95% CI) | Totals not selected | |
| 10.3.4 Number of participants who had avascular necrosis (at up to 12 months) | 1 | Risk Ratio (M‐H, Fixed, 95% CI) | Totals not selected | |
| 10.3.5 Number of participants who had stroke (at up to 12 months) | 1 | Risk Ratio (M‐H, Fixed, 95% CI) | Totals not selected | |
| 10.4 Haemoglobin status | 3 | Mean Difference (IV, Fixed, 95% CI) | Subtotals only | |
| 10.4.1 Mean change from baseline in haemoglobin (g/L) (at up to 6 months) | 1 | 67 | Mean Difference (IV, Fixed, 95% CI) | 0.36 [‐0.21, 0.93] |
| 10.4.2 Mean change from baseline in haemoglobin (g/L) (at up to 12 months) | 2 | 150 | Mean Difference (IV, Fixed, 95% CI) | ‐0.17 [‐2.53, 2.19] |
| 10.5 Laboratory markers of haemolysis and inflammation | 3 | Mean Difference (IV, Fixed, 95% CI) | Subtotals only | |
| 10.5.1 Total white blood cells 103/µL (mean count at 6 months) | 1 | 67 | Mean Difference (IV, Fixed, 95% CI) | ‐1.50 [‐3.48, 0.48] |
| 10.5.2 Total white blood cells 103/μL (mean count at up to 12 months) | 2 | 150 | Mean Difference (IV, Fixed, 95% CI) | 0.40 [‐0.87, 1.67] |
| 10.5.3 Reticulocytes % (mean count at up to 6 months) | 1 | 67 | Mean Difference (IV, Fixed, 95% CI) | ‐0.25 [‐1.84, 1.34] |
| 10.5.4 Reticulocytes % (mean count at up to 12 months) | 1 | 10 | Mean Difference (IV, Fixed, 95% CI) | ‐0.43 [‐4.46, 3.60] |
| 10.5.5 Platelet count 103/µL (mean count at up to 6 months) | 1 | 67 | Mean Difference (IV, Fixed, 95% CI) | ‐33.84 [‐118.97, 51.29] |
| 10.5.6 Platelet count 103/μL (mean count at up to 12 months) | 2 | 150 | Mean Difference (IV, Fixed, 95% CI) | 30.63 [‐13.48, 74.74] |
| 10.5.7 Lactic acid dehydrogenase U/L (mean value at up to 6 months) | 1 | 67 | Mean Difference (IV, Fixed, 95% CI) | ‐70.55 [‐151.81, 10.71] |
| 10.5.8 Lactic acid dehydrogenase U/L(mean value at up to 12 months) | 1 | 10 | Mean Difference (IV, Fixed, 95% CI) | 17.60 [‐162.21, 197.41] |
Comparison 11. Folic acid versus placebo.
| Outcome or subgroup title | No. of studies | No. of participants | Statistical method | Effect size |
|---|---|---|---|---|
| 11.1 Severity of pain crises | 1 | Risk Ratio (M‐H, Fixed, 95% CI) | Totals not selected | |
| 11.1.1 Number of participants experiencing painful crisis (at up to 12 months) | 1 | Risk Ratio (M‐H, Fixed, 95% CI) | Totals not selected | |
| 11.2 Frequency of hospitalization | 1 | Rate Ratio (IV, Fixed, 95% CI) | Totals not selected | |
| 11.2.1 Number of hospitalization episodes (clinic visits/child) (at up to 12 months) | 1 | Rate Ratio (IV, Fixed, 95% CI) | Totals not selected | |
| 11.3 Frequency of SCD‐related complications | 1 | Risk Ratio (M‐H, Fixed, 95% CI) | Totals not selected | |
| 11.3.1 Major infections (at up to 12 months) | 1 | Risk Ratio (M‐H, Fixed, 95% CI) | Totals not selected | |
| 11.3.2 Minor infections (at up to 12 months) | 1 | Risk Ratio (M‐H, Fixed, 95% CI) | Totals not selected | |
| 11.3.3 Dactylitis (at up to 12 months) | 1 | Risk Ratio (M‐H, Fixed, 95% CI) | Totals not selected | |
| 11.3.4 Splenic sequestration (at up to 12 months) | 1 | Risk Ratio (M‐H, Fixed, 95% CI) | Totals not selected |
Comparison 12. Extended‐release niacin (niacin‐ER) versus placebo.
| Outcome or subgroup title | No. of studies | No. of participants | Statistical method | Effect size |
|---|---|---|---|---|
| 12.1 Haemoglobin status | 1 | Mean Difference (IV, Fixed, 95% CI) | Totals not selected | |
| 12.1.1 Haemoglobin level g/dL (mean change from baseline at up to six months) | 1 | Mean Difference (IV, Fixed, 95% CI) | Totals not selected | |
| 12.2 Laboratory markers of haemolysis and inflammation | 1 | Mean Difference (IV, Fixed, 95% CI) | Totals not selected | |
| 12.2.1 Total white blood cells K/μL (mean change from baseline at up to 6 months) | 1 | Mean Difference (IV, Fixed, 95% CI) | Totals not selected | |
| 12.2.2 Reticulocytes K/μL (mean change from baseline at up to 6 months) | 1 | Mean Difference (IV, Fixed, 95% CI) | Totals not selected |
Comparison 13. Oral propionyl‐L‐carnitine (PLC) versus placebo.
| Outcome or subgroup title | No. of studies | No. of participants | Statistical method | Effect size |
|---|---|---|---|---|
| 13.1 Frequency of SCD‐related complications | 1 | Mean Difference (IV, Fixed, 95% CI) | Totals not selected | |
| 13.1.1 Leg ulcers area ‐ change in size in cm (at up to 6 months) | 1 | Mean Difference (IV, Fixed, 95% CI) | Totals not selected |
Comparison 14. Vitamin A versus vitamin A + zinc.
| Outcome or subgroup title | No. of studies | No. of participants | Statistical method | Effect size |
|---|---|---|---|---|
| 14.1 Frequency of crisis | 1 | Mean Difference (IV, Fixed, 95% CI) | Totals not selected | |
| 14.1.1 Mean number of vaso‐occlusive crises (at up to 12 months) | 1 | Mean Difference (IV, Fixed, 95% CI) | Totals not selected | |
| 14.2 Frequency of hospitalization (mean change from baseline) | 1 | Mean Difference (IV, Fixed, 95% CI) | Totals not selected | |
| 14.2.1 Mean number hospitalizations (measured as the number of hospitalizations at up to 12 months) | 1 | Mean Difference (IV, Fixed, 95% CI) | Totals not selected | |
| 14.2.2 Mean number of days in short‐stay medical unit (haematology acute care unit) (at up to 12 months) | 1 | Mean Difference (IV, Fixed, 95% CI) | Totals not selected | |
| 14.2.3 Mean number of emergency visits (at up to 12 months) | 1 | Mean Difference (IV, Fixed, 95% CI) | Totals not selected | |
| 14.3 Frequency of SCD‐related complications | 1 | Mean Difference (IV, Fixed, 95% CI) | Totals not selected | |
| 14.3.1 Acute chest events ( mean change from baseline at up to 12 months) | 1 | Mean Difference (IV, Fixed, 95% CI) | Totals not selected | |
| 14.4 Laboratory markers of haemolysis and inflammation | 1 | Mean Difference (IV, Fixed, 95% CI) | Totals not selected | |
| 14.4.1 Reticulocyte count % (mean change from baseline at up to 12 months) | 1 | Mean Difference (IV, Fixed, 95% CI) | Totals not selected |
Comparison 15. Standard local care plus arginine butyrate (500 mg/kg) versus standard local care.
| Outcome or subgroup title | No. of studies | No. of participants | Statistical method | Effect size |
|---|---|---|---|---|
| 15.1 Frequency of SCD‐related complications (improvement in leg ulcer size) | 2 | Mean Difference (IV, Fixed, 95% CI) | Subtotals only | |
| 15.1.1 Mean reduction in leg ulcer areas (cm) (change from baseline at up to six months) | 2 | 46 | Mean Difference (IV, Fixed, 95% CI) | ‐22.87 [‐37.92, ‐7.82] |
| 15.2 Frequency of SCD‐related complications (leg ulcer healing rate) | 2 | Rate Ratio (IV, Fixed, 95% CI) | Subtotals only | |
| 15.2.1 Number of completely‐healed leg ulcers (at up to 6 months) | 2 | 46 | Rate Ratio (IV, Fixed, 95% CI) | 1.38 [0.64, 2.99] |
| 15.2.2 Number of partially‐healed leg ulcers (at up to 6 months) | 1 | 26 | Rate Ratio (IV, Fixed, 95% CI) | 1.67 [0.69, 4.03] |
Comparison 16. Vitamin A (3000 mg) versus vitamin A (6000 mg).
| Outcome or subgroup title | No. of studies | No. of participants | Statistical method | Effect size |
|---|---|---|---|---|
| 16.1 Haemoglobin status (g/dL) | 1 | Mean Difference (IV, Fixed, 95% CI) | Totals not selected | |
| 16.1.1 Haemoglobin (g/dL) mean change from baseline at up to 6 months | 1 | Mean Difference (IV, Fixed, 95% CI) | Totals not selected | |
| 16.2 Laboratory markers of haemolysis and inflammation | 1 | Mean Difference (IV, Fixed, 95% CI) | Totals not selected | |
| 16.2.1 Reticulocytes % (mean change from baseline at up to 6 months) | 1 | Mean Difference (IV, Fixed, 95% CI) | Totals not selected | |
| 16.2.2 Foetal haemoglobin % (mean change from baseline at up to 6 months) | 1 | Mean Difference (IV, Fixed, 95% CI) | Totals not selected |
Comparison 17. N‐acetylcysteine (1200 mg) versus N‐acetylcysteine (2400 mg).
| Outcome or subgroup title | No. of studies | No. of participants | Statistical method | Effect size |
|---|---|---|---|---|
| 17.1 Frequency of crisis | 1 | Rate Ratio (IV, Fixed, 95% CI) | Totals not selected | |
| 17.1.1 Number of VOC episodes (at up to 12 months) | 1 | Rate Ratio (IV, Fixed, 95% CI) | Totals not selected | |
| 17.2 Haemoglobin status (g/dL) | 1 | Mean Difference (IV, Fixed, 95% CI) | Totals not selected | |
| 17.2.1 Mean change from baseline at up to 6 months | 1 | Mean Difference (IV, Fixed, 95% CI) | Totals not selected |
Characteristics of studies
Characteristics of included studies [ordered by study ID]
Arruda 2012.
| Study characteristics | ||
| Methods | Randomized placebo‐controlled trial | |
| Participants | "Homozygous SCA or Sb0‐thalassaemia adult patients regularly attending the Hereditary Anaemias Outpatients Clinic of Federal University of Sao Paulo (UNIFESP) were recruited
to participate". 18 years and above, median age 27 (18 – 68) years. Male = 30 participants Female = 53 participants "A total of 94 patients were initially eligible. Four patients refused to participate and two were excluded due to iron overload not on chelation therapy. Eighty‐eight were then randomized but five were excluded after randomization: one died from SCA‐related complications (randomized to placebo) and four (two randomized to placebo) abandoned follow‐up before first revaluation. Therefore, 83 SCA patients had baseline and post‐treatment data and these were analysed. Forty‐four patients were supplemented with vitamins and 39 received placebo. Seventy‐one patients received treatment for 180 d (34 placebo, 37 vitamins) and 12 received treatment for 90 d (five placebo, seven vitamins). Median age was 27 years (range: 18–68 years), and 53 (64%) were female. Capsule count confirmed optimal adherence to the protocol in 96% of cases. There were no differences between the two groups as regards clinical SCA complications or baseline laboratorial tests." |
|
| Interventions | Participants received either vitamin C 1400 mg/day and vitamin E 800 mg/day or placebo for 6 months. "Vitamins and placebo capsules were supplied by the same pharmacy (Bioformula®, Sao Paulo, Brazil). Participants were asked to return the bottles at the end of the study". Vitamin C (700 mg tablets) in white capsules plus vitamin E (200 mg tablets) in blue capsules versus placebo in identical bottles and capsules. Vitamin: male/female = 15/29 Placebo: male/female = 15/24 |
|
| Outcomes | Clinical complications and laboratory parameters | |
| Notes | Funding source: funded by grants from FAPESP (Fundac~ao de Amparo a Pesquisa do Estado de Sao Paulo) #2010/02933‐6 and CNPq (Conselho Nacional de DesenvolvimentoCientıfico e Tecnologico) #140392/2009‐2 Declaration of interest by authors: no information |
|
| Risk of bias | ||
| Bias | Authors' judgement | Support for judgement |
| Random sequence generation (selection bias) | Unclear risk | Not described in detail. "Patients were randomly assigned into two groups: vitamin supplementation or placebo. Randomization was performed by the technician’s blinded choice of 1 of 100 of identical numbered pairs of bottles (50 containing VitC 700 mg in white capsules plus VitE 200 mg in blue capsules, and 50 containing placebo in identical bottles and capsules). The pairs numbered 1–60 were reserved for allocation of patients taking hydroxycarbamide regularly." |
| Allocation concealment (selection bias) | Unclear risk | No information |
| Blinding of participants and personnel (performance bias) All outcomes | Low risk | Participants were blinded to the interventions received. "Identical numbered pairs of bottles (50 containing VitC 700 mg in white capsules plus VitE 200 mg in blue capsules, and 50 containing placebo in identical bottles and capsules). The pairs numbered 1–60 were reserved for allocation of patients taking hydroxycarbamide regularly. Patients received either VitC 1400 mg/d and VitE 800 mg/d or placebo for 6 months. Vitamins and placebo capsules were supplied by the same pharmacy (Bioformula®, Sao Paulo, Brazil). Patients were asked to return the bottles at the end of the study." |
| Blinding of outcome assessment (detection bias) All outcomes | Low risk | Outcome assessors were blinded. "Identical numbered pairs of bottles (50 containing VitC 700 mg in white capsules plus VitE 200 mg in blue capsules, and 50 containing placebo in identical bottles and capsules). The pairs numbered 1–60 were reserved for allocation of patients taking hydroxycarbamide regularly. Patients received either VitC 1400 mg/d and VitE 800 mg/d or placebo for 6 months. Vitamins and placebo capsules were supplied by the same pharmacy (Bioformula®, Sao Paulo, Brazil). Patients were asked to return the bottles at the end of the study." |
| Incomplete outcome data (attrition bias) All outcomes | Unclear risk | 5/34 participants in placebo and 7/37 in the vitamin group lost to follow‐up, but reasons not given. |
| Selective reporting (reporting bias) | Unclear risk | Although we could not access the trial protocol, the effect of the interventions on outcomes listed in the methods section were reported. |
| Other bias | Low risk | Not suspected. |
Bao 2008.
| Study characteristics | ||
| Methods | RCT | |
| Participants | 36 ambulatory volunteers with SCD Age: mean (SD) = 32.9 (9.7) years; range 18 ‐ 47 years Male: N = 22 Females: N = 14 |
|
| Interventions | Zinc: 25 mg zinc as acetate orally 3 times a day for 3 months
N = 18
Male: 11
Female: 7 Placebo N = 18 Male: N = 11 Female: N = 7 No participants received hydroxyurea |
|
| Outcomes | Vaso‐occlusive pain crisis, haematological parameters, total number of infections, and other laboratory parameters | |
| Notes | Both zinc and placebo capsules were supplied by TEVA Pharmaceuticals (North Wales, Pa). Exclusion "criteria were as follows: (1) nonambulatory, (2) receiving more than 6 transfusions per year or taking hydroxyurea, (3) history of substance abuse, (4) neurological or psychiatric deficits that could affect compliance, (5) use of immunosuppressive drugs, (6) patients who were positive for HIV, and (7) patients who were positive for hepatitis B". Funding source: "Supported by Grant 1‐R01 A150698‐01A1 from the National Institutes of Health (to A.P.) and by Grant FD‐U‐000457‐06 from the Food and Drug Administration (to A.P.)". Declaration of interest by authors: no information. Location: USA |
|
| Risk of bias | ||
| Bias | Authors' judgement | Support for judgement |
| Random sequence generation (selection bias) | Unclear risk | "All patients were randomly divided into 2 groups, the order of assignment (ie, zinc or placebo), within pairs was random". No explanation on how randomisation was carried out; probably done. |
| Allocation concealment (selection bias) | Unclear risk | No information |
| Blinding of participants and personnel (performance bias) All outcomes | Low risk | The personnel who cared for participants were blinded to the assignment. Two identical bottles labelled as study drug, not labelled as zinc or as placebo. It was not mentioned that the participants were blinded, but probably done. This was a placebo‐controlled trial. |
| Blinding of outcome assessment (detection bias) All outcomes | Low risk | "The clinical staff members were blinded observers. They evaluated and managed the patients for vaso‐occlusive pain episodes". |
| Incomplete outcome data (attrition bias) All outcomes | Low risk | All participants were included in the final analysis. |
| Selective reporting (reporting bias) | Low risk | We did not assess the trial protocol. However, all important outcomes listed in the methods section were reported. |
| Other bias | Low risk | Not suspected. |
Brownell 2020.
| Study characteristics | ||
| Methods | RCT | |
| Participants | 22 participants with SCD Age: mean (SD) 13.8 (3.3) years Sex: Male: N = 13 Female: N = 9 |
|
| Interventions | Vitamin A 3000 IU/day doses as capsules in blister packs (N = 10) versus 6000 IU/day doses as capsules in blister packs (N = 11) |
|
| Outcomes | Primary outcomes: vitamin A status as indicated by serum retinol, retinol binding protein (RBP), and transthyretin (TTR, or prealbumin) Secondary outcomes: included concurrent changes in haematologic, nutritional, and immunologic indices, muscle strength, and muscle function |
|
| Notes | ["HbSS 9 to 19 years of age were recruited from the Philadelphia, PA, and Voorhees, NJ clinics of the Comprehensive Sickle Cell Center at CHOP, as well as the Marian Anderson Comprehensive Sickle Cell Care and Research Center at St. Christopher’s Hospital for Children in Philadelphia, PA"]. Exclusion ["criteria for the HbSS group included vaso‐occlusive events or other illness in the 2 weeks preceding enrollment, HU initiation within the 6 weeks preceding enrollment, a history of either overt or silent stroke, or liver function tests >4 times the upper limit of laboratory range in the preceding 3 months"]. "Change values are reported as regression coefficients with 95% confidence intervals based upon mixed effects linear regression models adjusting for hydroxyurea use and including time x dose interaction term". "Significant values are expressed after undergoing correction for multiple comparisons" Funding source: "the North American Society for Pediatric Gastroenterology, Hepatology, and Nutrition Foundation/Abbott Nutrition Advanced Fellowship in Pediatric Nutrition grant provided salary support to J.N.B., with no effect on trial design, data collection, analysis, or interpretation, writing of the manuscript, or the decision to submit for publication. Additional support was provided by the Center for Human Phenomic Science (National Center for Advancing Translational Sciences, National Institutes of Health,UL1TR001878), Comprehensive Sickle Cell Center, Nutrition Center, and Cortner Endowed Chair at Children’s Hospital ofPhiladelphia (V.A.S.)". Declaration of interest by authors: no competing interests. |
|
| Risk of bias | ||
| Bias | Authors' judgement | Support for judgement |
| Random sequence generation (selection bias) | Low risk | "computer‐generated randomization scheme provided by the manufacturer". |
| Allocation concealment (selection bias) | Low risk | "Capsules of 3000IU of vitamin A were provided in sequentially‐labeled blister packs corresponding to the computer‐generated randomization scheme provided by the manufacturer". There was no way the investigators would know the sequence of allocating the intervention (who will get a placebo or real intervention). |
| Blinding of participants and personnel (performance bias) All outcomes | Low risk | "Study staff and participants were blinded to the assigned dose group". Given the allocation concealment described above, participants would not know which tablets they were taking. They were instructed to take 2 capsules per day: two capsules of vitamin A (totalling 6000 IU/day) or one capsule of vitamin A and 1 placebo capsule (totalling 3000 IU/day), depending on randomization group. |
| Blinding of outcome assessment (detection bias) All outcomes | Low risk | "Study staff and participants were blinded to the assigned dose group". |
| Incomplete outcome data (attrition bias) All outcomes | Unclear risk | 1 participant (5%) in the 3000 IU/day of Vitamin A group was lost to follow‐up. Reason not provided. |
| Selective reporting (reporting bias) | Low risk | All outcomes listed in the trial protocol were reported. |
| Other bias | Low risk | Not suspected. |
Daak 2013.
| Study characteristics | ||
| Methods | RCT | |
| Participants | People aged 2 to 24 years with HbSS. | |
| Interventions | Omega‐3 versus placebo capsules containing 277.8 mg DHA and 39.0 mg EPA (all of the participants were receiving regular folate supplementation, and those above 5 years of age were receiving standard oral prophylactic penicillin). Omega‐3: Sex (male/female) = 41/29 Age = mean (SD) 8.1 (4.6) years Placebo Sex (male/female) = 38/32 Age = mean (SD) 7.8 (5.5) years |
|
| Outcomes | Primary outcome: "the annualized rate of clinical vasoocclusive crisis, defined as painful events that lead to hospitalisation (vaso‐occlusive crisis was defined as a painful event characterised by musculoskeletal and/or visceral pain, which is usually associated with mild pyrexia and the passage of dark or red urine)." Secondary outcomes: "Incidence of severe anaemia (hemoglobin concentration, 50 g/L), number of inpatient days due to clinical vaso‐occlusive crisis, rate of blood transfusion, school attendance, mean hemoglobin concentration, and mean corpuscular volume." The number of inpatient days was used as an objective measure of the severity of clinical vaso‐occlusive crisis. |
|
| Notes | Participants who were undergoing regular follow‐up at the outpatient Sickle Cell Disease Referral Clinic, Ibn‐Aoaf Paediatric and Khartoum Teaching Hospitals, Khartoum (Sudan), were enroled between April 2009 and May 2010. The exclusion criteria were as follows: presence of other chronic diseases, blood transfusion in the previous 4 months, hydroxyurea treatment, a history of overt stroke, or pregnancy. Funding source: EU FP6 Marie Curie Transfer of Knowledge Programme (contract no. MTKD‐CT‐2005‐029914; KG), Efamol Limited UK (KG), and the Kitchner Memorial Trust Fund and University of Khartoum (AD). Declaration of interest by authors: "The funding bodies had no influence on the study design, collection and analysis of data, interpretation of results or writing. The authors do not have a conflict of interest or financial relationships with the funding bodies". |
|
| Risk of bias | ||
| Bias | Authors' judgement | Support for judgement |
| Random sequence generation (selection bias) | Low risk | "Randomization was conducted by using a sequence of computer‐generated random numbers at the Faculty of Life Sciences, London Metropolitan University (United Kingdom)." |
| Allocation concealment (selection bias) | Unclear risk | Allocation concealment was not described. |
| Blinding of participants and personnel (performance bias) All outcomes | Low risk | "the staff of the Sickle Cell Disease Referral Clinic, investigators, and participants were blinded until the biochemical and clinical outcome data were analyzed and the database unlocked." |
| Blinding of outcome assessment (detection bias) All outcomes | Low risk | "the staff of the Sickle Cell Disease Referral Clinic, investigators, and participants were blinded until the biochemical and clinical outcome data were analyzed and the database unlocked." |
| Incomplete outcome data (attrition bias) All outcomes | Low risk | 17% lost to follow‐up in the omega‐3 group 21% lost to follow‐up in the placebo group Reasons were given and similar across both groups. |
| Selective reporting (reporting bias) | High risk | All important outcomes listed in the methods were reported. However, data for the placebo group were not reported for some laboratory parameters, such as LDH. |
| Other bias | Low risk | Not suspected. |
Daak 2018.
| Study characteristics | ||
| Methods | RCT | |
| Participants | Children 5 years to 17 years old with SCD (homozygous haemoglobin SS, haemoglobin SC and haemoglobin Sb0‐thalassemia). | |
| Interventions | "SC411 (ϕ‐3 fatty acid docosahexaenoicacid (DHA, 22:6ϕ3) is a novel DHA ethyl ester formulation with a proprietary delivery platform (Advanced Lipid Technology, or ALT) that enhances DHA bioavailability and overcomes the variable absorption related to dietary fat (“food effect”). This was placebo controlled, parallel‐group, dose‐finding trial to evaluate the safety, tolerability, and efficacy of 3 weight‐based dose levels of SC411 (20 [range: 12‐26]; 36 [range: 26‐48], or 60 [range: 51‐72] mg DHA/kg per day) in children with SCD." Acid docosahexaenoicacid (DHA, 22:6ϕ3) (Omega‐3) = 50 participants Placebo = 17 participants |
|
| Outcomes | Primary outcomes: "the primary efficacy endpoint was the percentage change from baseline in the total blood cell membrane DHA and EPA concentration after 4 weeks of treatment." Secondary outcomes: "plasma lactate dehydrogenase, D‐dimer, reticulocyte count, white blood cell count, platelets, indirect bilirubin, high‐sensitivity C‐reactive protein, soluble vascular cell adhesion molecule‐1, soluble E‐selectin, and Hb. The secondary and exploratory laboratory‐based endpoints were assessed as the change from baseline at 2, 4, and 8 weeks. The exploratory clinical endpoints included the rate of visits to a medical facility (hospital, clinic, or emergency room) for cSCC or other SCD‐related complications, the number of hospitalization days for SCC, and number of blood transfusions (acute simple blood transfusions and exchange blood transfusions). Endpoints recorded using the eDiary included rate of painful crises, intensity of painful crises, frequency of analgesic use at home, and school attendance. An eDiary‐recorded painful crisis was defined as a new onset of sickle cell pain accompanied by analgesic use, as recorded in the subject’s daily eDiary. The eDiary recorded pain crises must have been separated by at least 48 hours to be considered as a distinct painful crisis." |
|
| Notes | Funding source: Sancilio Pharmaceuticals Company, Inc. (SCI) Declaration of interest by authors: "A.A.D. and A.L.R. are employees of SCI. O.A.A. has been an advisory board member for Novartis. C.D.D.has been an advisory board member for Novartis, Pfizer, and SCI;worked as a consultant for Novartis, Pfizer, GBT, Eizyme, and Prolong Therapeutics, and Data and Safety Monitoring Committee chair forIronwood; and obtained research funding for Pfizer, SCI, Lilly, Novartis, Katz Foundation, and the National Institutes of Health/Eunice Kennedy ShriverNational Institute ofChildHealth andHumanDevelopment. J.K. has worked as a consultant for Bluebird Bio, Novartis, CRISPR, and AstraZeneca (steering committee), as well as participated in the National Heart, Lung, and Blood Institute Sickle Cell Advisory Committee. L.V.B. has worked as a consultant for Prolong Pharmaceuticals and Mast Therapeutics; been a paid member of the American Society of Pediatric Hematology/Oncology; participated in the advisory committee of Bioverativ; and obtained research funding from the National Institutes of Health, Pfizer, and Mast Therapeutics. M.U.C. participated in the Advisory Board of Shire, Octapharma, Grifols, Pfizer, Bayer, Roche, Bioverativ, and Hema; has been part of the Speakers Bureau of Shire, Roche/ Genentech, Bayer, and Novo Nordisk; has obtained research support from Shire and Pfizer; has participated as site investigator for Pfizer, Roche/Genentech, Novo Nordisk, Global Blood Therapeutics, SCI, and Amgen; and holds stocks in Alnylum Pharmaceuticals. L.N. worked as a consultant for Emmaus, Bayer, CTD Holdings, and Pfizer; is currently on a Data and Safety Monitoring Committee for ApoPharma; is a site principal investigator for Pfizer, Sancilio, and PCORI; is a co‐investigator for ApoPharma, Novartis, Bluebird Bio, Sangamo Therapeutics, Global Blood Therapeutics, Silarus, Celgene, Terumo, La Jolla Pharmaceuticals, and Imara; and also is an investigator on National Heart, Lung, and Blood Institute, Agency for Healthcare Research and Quality, US Food and Drug Administration, Health Resources and Services Administration, Centers for Disease Control and Prevention, Doris Duke, the State of California, University of California Office of the President, and Seattle Children’s Research grants. F.S. has worked as a consultant for Clearway Global, LLC; and is a member of the Board of Directors of SCI; and participated in the Advisory Committees of Noble Financial Company. M.M.H. has worked as a consultant for SCI and AstraZeneca; is part of the Advisory Committees of SCI and Novartis; and received research support from SCI, Pfizer, and Intrinsic Life Sciences. The remaining authors declare no competing financial interests". Location: USA |
|
| Risk of bias | ||
| Bias | Authors' judgement | Support for judgement |
| Random sequence generation (selection bias) | Low risk | "Randomization was done by using an Interactive Response Technology system. Participants were randomly assigned 1:1:1 to 1 of the 3 dose levels. Then, patients at each dose level were randomly assigned 3:1 to SC411 and placebo. Randomization was stratified at baseline by Hydroxyuria (HU) use". |
| Allocation concealment (selection bias) | Unclear risk | Allocation concealment not described |
| Blinding of participants and personnel (performance bias) All outcomes | Low risk | "The subjects, investigators, and assessors were blinded to the treatment assignment. SC411 and a matching placebo were supplied as soft gel mini capsules. SC411 capsules contain 383 mg DHA, and matching placebo capsules contained approximately 410 mg soybean oil." |
| Blinding of outcome assessment (detection bias) All outcomes | Low risk | "The subjects, investigators, and assessors were blinded to the treatment assignment. SC411 and a matching placebo were supplied as soft gel mini capsules. SC411 capsules contain 383 mg DHA, and matching placebo capsules contained approximately 410 mg soybean oil." |
| Incomplete outcome data (attrition bias) All outcomes | Low risk | Intervention: attrition was 6%. Control: attrition was 12%. However, reasons for loss to follow‐up were given: one participant in the intervention was removed because of adverse events due to the intervention. All participants randomized were included in the final analysis. |
| Selective reporting (reporting bias) | High risk | Data for the placebo group were not published for one of the outcomes. |
| Other bias | High risk | Suspected. The trial was sponsored by a pharmaceutical company. When we asked the authors for additional data, we were informed that the funder had the data. |
Dougherty 2012.
| Study characteristics | ||
| Methods | RCT placebo‐controlled | |
| Participants | Participants with SCD‐SS (aged mean (SD) 6.8 (3.1) years) were recruited in Pennsylvania from the Sickle Cell Center. Sex (male/female): 50/46. |
|
| Interventions | "For supplemental vitamin A, subjects in the vitamin A or vitamin A + zinc groups received 300 mg/d (1000 IU) if aged 2.0–3.9 y at baseline, 400 mg/d (1333 IU) if aged 4.0–8.9 y, and 600 mg/d (2000 IU) if aged 9.0–12.9 y The vitamin A supplement was supplied as retinyl palmitate in a dried formulation, which was mixed to the proper dose in a 5‐mL cherry‐flavored liquid compound. For supplemental zinc, subjects in the vitamin A + zinc group received 10 mg/d if aged 2.0–8.9 y and 20 mg/d if aged 9.0–12.9 y. Zinc was supplied as zinc sulfate together with the vitamin A in a 5‐mL cherry‐flavored liquid compound". The placebo was supplied as cherry‐flavoured syrup that was indistinguishable from the vitamin A or vitamin A + zinc supplements. Vitamin A: N = 29 Age: mean (SD) 7.5 (2.9) years Sex (male/female) = 18/11 Vitamin A + zinc: N = 18 Age: mean (SD) 7.6 (2.4) years Sex (male/female) = 11/7 Placebo: N=21 Age: mean (SD) 7.8 (3.2) years Sex (male/female) = 10/11 |
|
| Outcomes | Primary outcome: number of hospitalizations over 12 months amongst children with SCD‐SS Secondary outcomes: laboratory parameters, dark adaptation, hospitalizations and disease events, and adherence to intervention |
|
| Notes | "Zinc was supplied as zinc sulfate together with the vitamin A in a 5 mL cherry‐flavored liquid compound. The placebo was supplied as cherry‐flavored syrup that was indistinguishable from the vitamin A or vitamin A + zinc supplements. Each participant was instructed to take 1 dose (5 mL) orally per day in the morning. Follow‐up trial visits were at 3, 6, 9, and 12 months." Funding source: Sickle Cell Center (5U54 HL070596), Clinical Translational Research Center (UL1RR024134), K12 Mentored Career Development Award (KL2RR024132), and Nutrition Center at the Children’s Hospital of Philadelphia. Declaration of interest by authors: authors declared they had none. |
|
| Risk of bias | ||
| Bias | Authors' judgement | Support for judgement |
| Random sequence generation (selection bias) | Unclear risk | "The randomization scheme was generated by a biostatistician." Not described |
| Allocation concealment (selection bias) | Unclear risk | No information |
| Blinding of participants and personnel (performance bias) All outcomes | Low risk | "The investigators, study staff, and participants were blinded to the assigned group". "The placebo was supplied as a cherry‐flavored syrup that was indistinguishable from the vitamin A or vitamin A + zinc supplements". The interventions were supplied as cherry‐flavoured syrups as well. |
| Blinding of outcome assessment (detection bias) All outcomes | Low risk | "The investigators, study staff, and participants were blinded to the assigned group." "The placebo was supplied as a cherry‐flavored syrup that was indistinguishable from the vitamin A or vitamin A + zinc supplements". The interventions were supplied as cherry‐flavoured syrups as well. |
| Incomplete outcome data (attrition bias) All outcomes | Low risk | "[Longitudinal‐mixed‐effects (LME) analyses (25) were used to examine change over time in serum retinol, hospitalization, and disease events and whether patterns of change were different among the 3 groups. These analyses were made using the intention‐to‐treat model where all subjects are included regardless of adherence to the trial protocol. Similar to multiple linear regression analysis, LME analysis allows for multiple observations per participant. LME assumes that observations measured from the same participant are dependent and, therefore, the regression coefficients vary across subjects and are considered to be random. Also, it allows for unequal intervals between visits, uses data from all participants, even when some trial visits were missed, and accommodates both fixed and random effects. Parameter estimates, as in regression analysis, indicate the contribution of the independent variable to the model. For these LME analyses, the subject was treated as a random effect and measurement and time as fixed effects.]" |
| Selective reporting (reporting bias) | Low risk | All outcomes listed in the methods were reported. Also, outcomes reported were important outcomes prespecified in other trial protocols. |
| Other bias | Low risk | Not suspected. |
Eleuterio 2019.
| Study characteristics | ||
| Methods | RCT | |
| Participants | 50 adults of both sexes with a clinical and molecular diagnosis of SCA | |
| Interventions | HU + L‐arginine at a dose of 500 mg/day
N = 25 versus HU + placebo (starch) N = 25 The HU doses ranged from 500 to 1500 mg/day and were not modified during the trial. |
|
| Outcomes | "The outcome measures were the nitric oxide dose measured by nitrite plus nitrate levels using a nitrite/nitrate, colorimetric assay kit, Roche, foetal haemoglobin levels measured by HPLC; and reticulocyte and complete blood count. To measure pain frequency, a time scale was used to stratify the participants. The scale divided the patients into 5 pain categories: never (absence of pain), every day, every week, every month, and every year. As was done for pain assessment, a scale was created to measure the frequency of hospitalisations. The participants were stratified into the following: never hospitalised, hospitalised 5 years ago, hospitalised 3 years ago, and hospitalised this year. The other clinical and historical data of the participants were obtained from medical records." Time points: baseline, 2 months, 4 months. |
|
| Notes | "The exclusion criteria were the absence of a molecular diagnosis of SCA, pregnancy, presence of renal disease, not using HU, and a history of transfusion in the last six months." "To measure pain frequency, a time scale was used to stratify the patients. The scale divided the patients into 5 pain categories: never (absence of pain), every day, every week, every month, and every year". It is unclear how yearly pain for the outcome 'frequency of pain' was measured, given that the study stated 4 months was the longest follow‐up time point. Funding source: no information Declaration of interest by authors: authors declared they had none. Location: Brazil |
|
| Risk of bias | ||
| Bias | Authors' judgement | Support for judgement |
| Random sequence generation (selection bias) | Low risk | "The patients were randomized by the GraphPad prism program." |
| Allocation concealment (selection bias) | Unclear risk | "The groups were separated in a randomized, double‐blind trial in which only the main author had the information regarding the groups and the respective patients." It is unclear what authors meant by "only the main author had the information regarding the groups and the respective patients." |
| Blinding of participants and personnel (performance bias) All outcomes | Low risk | Participants were blinded to treatment arms. The trial was a placebo‐controlled study in which patients in the intervention group received HU + L‐arginine at a dose of 500 mg/day and the control group received HU + placebo (starch). |
| Blinding of outcome assessment (detection bias) All outcomes | Low risk | Assessors were blinded to treatment arms. The trial was a placebo‐controlled study in which patients in the intervention group received HU + L‐arginine at a dose of 500 mg/day and the control group received HU + placebo (starch). |
| Incomplete outcome data (attrition bias) All outcomes | Unclear risk | 43% of the participants in the intervention group were missing in the analysis and 29% were missing from the placebo group. No explanation was given for the attrition. |
| Selective reporting (reporting bias) | Low risk | Not suspected. All outcomes listed in their methods section were reported, though we did not have access to the trial protocol. |
| Other bias | Unclear risk | It is unclear how yearly pain for the outcome 'frequency of pain' was measured, given that the study stated 4 months was the longest follow‐up time point. |
Fung 2002.
| Study characteristics | ||
| Methods | RCT | |
| Participants | 42 children with SCD‐SS recruited from the Comprehensive Sickle Cell Center at Children’s Hospital of Philadelphia (CHOP). | |
| Interventions | 10 mg/d elemental zinc (as zinc sulfate) in 5 mL cherry syrup
N = 20
Age = mean (SD) = 6.8 (1.5) years
Sex (male/female) = 9/9 versus 5 mL cherry syrup alone (placebo) N = 22 Age = mean (SD) 7.4 (1.8) years Sex (male/female) = 11/9 |
|
| Outcomes | Adherence to treatment, laboratory parameters, anthropometric parameters | |
| Notes | Trial location: USA Funding source: Children’s Hospital of Philadelphia Nutrition Center, General Clinical Research Center (NIH‐RR 00240) and Comprehensive Sickle Cell Center (NIH‐HL 38633). Declaration of interest by authors: no information. Location: USA |
|
| Risk of bias | ||
| Bias | Authors' judgement | Support for judgement |
| Random sequence generation (selection bias) | Low risk | Both formulations and the randomization table were prepared by the research pharmacy at the Children’s Hospital of Philadelphia (CHOP). |
| Allocation concealment (selection bias) | Unclear risk | It was not clear if the allocation sequence remained at the pharmacy during the trial. |
| Blinding of participants and personnel (performance bias) All outcomes | Low risk | Participants were blinded to treatment arms."The children were randomized to receive elemental zinc (as zinc sulfate) in 5 mL cherry syrup or 5 mL cherry syrup alone (placebo)." The intervention and placebo looked the same. It was not reported that the blinding was broken. |
| Blinding of outcome assessment (detection bias) All outcomes | Low risk | Assessors were blinded to treatment arms. "The children were randomized to receive elemental zinc (as zinc sulfate) in 5 mL cherry syrup or 5 mL cherry syrup alone (placebo)." The intervention and placebo looked the same. It was not reported that the blinding was broken. |
| Incomplete outcome data (attrition bias) All outcomes | High risk | 4 children were lost to follow‐up: 2 were randomized to receive zinc and 2 to receive placebo. 2 children moved from the geographical region, and 2 families declined to complete the trial. However, no information was provided to indicate to which group the 2 children who declined to complete the trial belonged. Also, the children lost to follow‐up were not included in the final analysis. |
| Selective reporting (reporting bias) | Low risk | Not suspected. All outcomes listed in their method section were reported, though we did not have access to the trial protocol. |
| Other bias | Low risk | The trial was published in multiple articles, under different citations. |
Gupta 1995.
| Study characteristics | ||
| Methods | RCT | |
| Participants | 145 people with SCD but reported data for only 130 participants. Inclusion criteria: "All patients who had confirmed "SS" disease on haemoglobin electrophoresis and wore [sic] above 5 years of age were included". Exclusion criteria: "patients with chronic persistent infection or exposed to extremes of temperature variation frequently, patients on drug therapy for some other disease and patients with evidence of organ failure were excluded from the study." |
|
| Interventions | Zinc sulphate capsules 220 mg 3 times/day versus placebo (the control group received
placebo capsules of identical appearance 3 times/day). N = 65. "Care was otherwise the same in both groups. Both patients and treating physician were blinded regarding the drug being administered during the trial. Patients were followed once a week." N = 65. |
|
| Outcomes | "The major outcome variable was "sickle cell crisis'. Measures used were number and type of crisis, complications and mortality." "Severity was measured by number of days patient had spent in hospital at the time of having crisis and number of working days lost per crisis." |
|
| Notes | Follow‐up: 1 and 1/2 years Location: India Funding: "IntemiEpidemiological Networi", Rockfeller Foundation, USAIC and Dean, Medical College, Nagpur Declaration of interest by authors: no information |
|
| Risk of bias | ||
| Bias | Authors' judgement | Support for judgement |
| Random sequence generation (selection bias) | Low risk | "At the point of entry, patients were randomly allocated to receive zinc or placebo (using New Castie software for randomization)." |
| Allocation concealment (selection bias) | Unclear risk | Not described. |
| Blinding of participants and personnel (performance bias) All outcomes | Low risk | "The control group received placebo capsules of identical appearance three times a day. Care was otherwise the same in both groups. Both patients and treating physician were blinded regarding the drug being administered during the trial. Patients were followed once a week." |
| Blinding of outcome assessment (detection bias) All outcomes | Low risk | "The control group received placebo capsules of identical appearance three times a day. Care was otherwise the same in both groups. Both patients and treating physician were blinded regarding the drug being administered during the trial. Patients were followed once a week." |
| Incomplete outcome data (attrition bias) All outcomes | Unclear risk | 15 participants were lost to follow‐up. It was not clear to which group(s) they belonged. However, an equal number of participants (65/group) completed the trial. The full text of this trial was not available to verify. |
| Selective reporting (reporting bias) | Low risk | Not suspected. All outcomes listed in their methods section were reported, though we did not have access to the trial protocol. |
| Other bias | Low risk | Not suspected. |
Koshy 2001.
| Study characteristics | ||
| Methods | RCT | |
| Participants | People with SCD with refractory leg ulcers (20 participants with 41 long‐standing ulcers (3 ‐ 30 years duration). | |
| Interventions | Local care + arginine butyrate (500 mg/kg/dose or 750 mg/kg/dose) versus local care Arginine butyrate N = 12 Local care N = 8 |
|
| Outcomes | Mean reduction in ulcer areas, complete healing | |
| Notes | Location: no information. Full text not available. Funding: no information Declaration of interest by authors: no information |
|
| Risk of bias | ||
| Bias | Authors' judgement | Support for judgement |
| Random sequence generation (selection bias) | Unclear risk | "Participants were randomized to receive local care (control group) or local care + butyrate at 500mg/kg/dose or 750 mg/kg/dose (treatment group)". Not described. Full text not available |
| Allocation concealment (selection bias) | Unclear risk | Not described. Full text not available. |
| Blinding of participants and personnel (performance bias) All outcomes | Unclear risk | No information. Full text not available. |
| Blinding of outcome assessment (detection bias) All outcomes | Unclear risk | No information. Full text not available. |
| Incomplete outcome data (attrition bias) All outcomes | Unclear risk | No information. Full text not available. |
| Selective reporting (reporting bias) | Unclear risk | No information. Full text not available. |
| Other bias | High risk | "Participants were randomized to receive local care (control group) or local care + butyrate at 500 mg/kg/dose or 750 mg/kg/dose (treatment group)". Not described. Full text was not available. No P value or SD provided for data analysis. |
Martins 2009.
| Study characteristics | ||
| Methods | RCT | |
| Participants | 20 AA (normal), 20 AS (SCD trait participant), and 20 SS (SCD participant). Data were extracted only for SCD participants. | |
| Interventions | ALA 200 mg:
Age = mean (SD) 17.7 (9.6) years
Sex (male/female) = 6/4 versus Vehicle (placebo) Age = mean (SD) 7.0 (11.0) years Sex (male/female) = 5/5 |
|
| Outcomes | Enzyme activities, total antioxidant status, haematological parameters, anthropometric assessment, and clinical characteristics | |
| Notes | "60 participants were selected and divided into groups according to the haemoglobin profile: AA (normal), AS (SCD trait participant), and SS (SCD participant). They were classified into the groups by ionexchange HPLC; by PCR for the determination of the b‐like globin gene15 and by family history studies." Funding source: the trial was supported by grants from the Fundaça˜o de Amparo a` Pesquisa do Estado do Rio Grande do Sul (grant number 0521456). Declaration of interest by authors: authors declared they had none. |
|
| Risk of bias | ||
| Bias | Authors' judgement | Support for judgement |
| Random sequence generation (selection bias) | Unclear risk | Not described. Quote: "participants were randomized into a placebo‐controlled trial and treated with either ALA (200 mg) or vehicle". |
| Allocation concealment (selection bias) | Unclear risk | Not described. |
| Blinding of participants and personnel (performance bias) All outcomes | Unclear risk | Not described. "Participants were randomized into a placebo‐controlled trial and treated with either ALA (200 mg) or vehicle". The placebo was not described. |
| Blinding of outcome assessment (detection bias) All outcomes | Unclear risk | The vehicle used for placebo was not described. |
| Incomplete outcome data (attrition bias) All outcomes | Low risk | All participants completed the trial. |
| Selective reporting (reporting bias) | Low risk | Not suspected. All the outcomes listed were measured. |
| Other bias | Low risk | Not suspected. |
McMahon 2010.
| Study characteristics | ||
| Methods | RCT | |
| Participants | 23 participants aged >18 years, with sickle cell anaemia or sickle beta thalassaemia, and the presence of one or more leg ulcers. | |
| Interventions | Prescribed standard local care and arginine butyrate 500 mg/kg/dose given (treatment arm) for 5 d/week for 12 weeks. N = 14 Age = 36.6 (range 21 ‐ 60) years Sex (male/female) = 5/6 versus Standard local care alone (control arm) for 5 d/week for 12 weeks N = 12 Age = 34.7 (range 20–57) years Sex (male/female) = 5/7 "The drug formulation consisted of 5% butyric acid (50 g/l) and75% L‐arginine (75 g/l). The Arginine Butyrate was administered by intravenous infusion through a port‐a‐cath or peripheral pass‐port in one subject, generally over 6–8 h/d. The administration rate for Arginine Butyrate did not exceed 85 mg/kg/h and those patients infused with rates >60 mg/kg/h were pre‐medicated with acetaminophen or ibuprofen and an anti‐emetic to prevent headache or nausea. Patients randomized to the intravenous therapy were encouraged and assisted to ambulate frequently during the 6‐h infusion." "Arginine Butyrate could be continued for two additional courses of 8‐week cycles, although the responses to the extended treatment were not analysed as study endpoints. Control Arm subjects could cross‐over to the Treatment Arm if their ulcer did not heal after 12 weeks of closely monitored and supervised standard local care. Their remaining ulcers were then assessed on the Treatment Arm for 12 weeks. During the course of the study, three patients randomized initially on the Control Arm elected to cross‐over to the Treatment Arm after completing 12 weeks as a Control subject, when no significant healing of their refractory ulcers had occurred; healing rates in 11 ulcers, therefore, were evaluated on both Control and Treatment Arms in these subjects." |
|
| Outcomes | Decrease in measured ulcer area by at least 25% of the baseline area. | |
| Notes | Inclusion criteria: "The presence of one or more leg ulcers which had been refractory to healing with National Institutes of Health (NIH)‐defined standard local care, consisting of twice daily cleaning and wet‐to‐dry dressing changes, for at least 6 months. The use of an Unna boot was considered best therapy for one Control Arm subject, and this was continued. Patients were also eligible to participate if an ulcer had recurred and not healed with at least 3 months of standard care. Many of the enrolled subjects had suffered from refractory ulcers for many years and had tried multiple therapies." Exclusion criteria included renal or hepatic compromise or current chronic transfusion therapy. Funding source: grant FD‐R‐000176 from the Food and Drug Administration, Office of Orphan Product Development and grant M01 RR00533 from the General Clinical Research Center at Boston University (S.P. Perrine). Declaration of interest by authors: the other authors declare that they do not have any conflict of interest. |
|
| Risk of bias | ||
| Bias | Authors' judgement | Support for judgement |
| Random sequence generation (selection bias) | Low risk | Participants were randomly assigned to trial arms, following a table of random numbers prepared by a blinded statistician. |
| Allocation concealment (selection bias) | Unclear risk | Not reported. |
| Blinding of participants and personnel (performance bias) All outcomes | Unclear risk | No information |
| Blinding of outcome assessment (detection bias) All outcomes | Low risk | "During the weekly clinical visits, the ulcer was traced on acetate film and photographed. All ulcer areas were then calculated by computerized planimetry, using the image software (NIH, Bethesda, MD, USA) at the central site, separately from personnel who performed the tracings and photography." |
| Incomplete outcome data (attrition bias) All outcomes | Low risk | No participants were lost to follow‐up. |
| Selective reporting (reporting bias) | Low risk | All prespecified outcomes in the trial protocol were reported. |
| Other bias | Unclear risk | Three participants from the control crossed over to treatment arm after 12 weeks because they did not improve: "During the course of the study, three patients randomized initially on the Control Arm elected to cross‐over to the Treatment Arm after completing 12 weeks as a Control subject, when no significant healing of their refractory ulcers had occurred; healing rates in 11 ulcers therefore were evaluated on both Control and Treatment Arms in these subjects." |
Morris 2013.
| Study characteristics | ||
| Methods | RCT | |
| Participants | 57 participants with SCD requiring hospitalization for VOE. Children with an established diagnosis of SCD age 3 ‐ 19 years with VOE requiring parenteral opioids and admission to hospital were recruited from emergency departments, hematology clinics, day hospitals and wards. | |
| Interventions | IV or oral (PO) trial drug, L‐arginine hydrochloride (100 mg/kg/dose 3 times/day with a
maximum dose of 10 g for 15 doses or until discharge, whichever occurred first) versus placebo. L‐arginine hydrochloride N = 28 Age = mean (SD): 13.9 (3) years Sex (male/female) = 11/17 Placebo N = 29 Age = mean (SD) 13.8 (4) years Sex (male/female) = 16/13 |
|
| Outcomes | Data outcome measures included length of stay in hospital (days), total narcotic use and hospitalization (mg/kg), and pain scores (10 cm linear visual analogue scale and Faces Pain Scale). Other outcomes are adverse events and serious adverse events, clinical laboratory assessments, development of ACS, and need for red blood cell transfusion. "Pain scores, based on a 10‐cm visual analogue scale from 0 to 10" (Lower score is better) |
|
| Notes | Exclusion criteria:
"included known hepatic or renal insufficiency, presenting hemoglobin (Hb) <5 g/dL or immediate need for red blood cell transfusion, pregnancy, mental status changes or concern for stroke, >10 hospital admissions per year or a history of dependence on opioids, or a known allergy to arginine. A standardized treatment and monitoring program for VOE, utilized by CHRCO, was followed." Funding source: "This trial was supported in part by NIH‐NHLBI grant K23 HL 04386‐05, FDA grant 1R01FD003531‐04 and CTSA grant UL1 RR024131 (to CRM)." Declaration of interest by authors: no information |
|
| Risk of bias | ||
| Bias | Authors' judgement | Support for judgement |
| Random sequence generation (selection bias) | Low risk | "Block randomization was performed by the hospital pharmacist at Children’s Hospital & Research Center at Oakland." |
| Allocation concealment (selection bias) | Unclear risk | Not described. "Block randomization was performed by the hospital pharmacist at Children’s Hospital & Research Center at Oakland." It was not clear whether randomization was kept with the pharmacist. |
| Blinding of participants and personnel (performance bias) All outcomes | Low risk | Participants were blinded to treatment arms. "Placebo capsules appeared identical to the study drug (700 mg capsules) and were matched to the study drug by Tyson Pharmaceuticals for color and size, while normal saline was used for the IV placebo." |
| Blinding of outcome assessment (detection bias) All outcomes | Low risk | Assessors were blinded to treatment arms. "Placebo capsules appeared identical to the study drug (700 mg capsules) and were matched to the study drug by Tyson Pharmaceuticals for color and size, while normal saline was used for the IV placebo." |
| Incomplete outcome data (attrition bias) All outcomes | Unclear risk | 3 lost to follow‐up in the treatment arm and 2 in the placebo arm, with similar reasons in both groups. One participant in the intervention group developed hives and withdrew while another participant from the placebo group withdrew due to deterioration. One participant randomised into placebo received arginine; this may be the same participant whose condition deteriorated. |
| Selective reporting (reporting bias) | Low risk | All prespecified outcomes in the trial protocol were reported. |
| Other bias | High risk | Two of the three participants that withdrew from the control group were included in the analysis for the primary outcome but not for other outcomes. Neither of the two participants who withdrew from the L‐arginine group were included in the final analysis. |
Morris 2019.
| Study characteristics | ||
| Methods | RCT | |
| Participants | Participants with SCD 100 mg/kg/dose: Age (median, interquartile range) 14.5 (11 ‐ 16) years Sex (male/female) = 12/17 200 mg/kg/dose: Age (median, interquartile range): 13.0 (10 ‐ 16) years Sex (male/female) = 12/15 Placebo: Age (median, interquartile range): 13.5 (8 ‐ 16) years Sex (male/female) = 10/17 |
|
| Interventions | Intravenous arginine 100 mg/kg/dose (standard dose) versus 200 mg/kg/dose followed by standard dose versus placebo | |
| Outcomes | Total parenteral opioid use, length of hospital stay, pain score and biomarkers, patient‐reported outcomes | |
| Notes | Funding source: Pfizer, Global blood therapeutics, research funding from NHLBI and CDC Declaration of interest by authors: "Morris: Pfizer: Consultancy; UCSF‐Benioff Oakland: Patents & Royalties: Patents owned by UCSF‐Benioff Children's Hospital Oakland regarding biomarkers and therapies that target arginine bioavailability; none are licensed and there is no royalties generated; UCSF‐Benioff Children's Hospital Oakland: Patents & Royalties: Patents owned by UCSF‐Benioff Children's Hospital Oakland, licensed by Lifetrients, generating royalties for nutritional supplement for autism/apraxia. Lane:NHLBI: Research Funding; CDC: Research Funding; GA Dept: Other: Contract for newborn screening follow‐up services; Bio Products Laboratory: Other: Sickle Cell Advisory Board; FORMA Therapeutics: Other: Clinical Advisory Board. Dampier:Ironwood: Consultancy; Global Blood Therapeutics: Consultancy; Hudson Publishing Company: Consultancy; Merck: Research Funding; Micelle Biopharma: Consultancy, Research Funding; Pfizer: Consultancy, Research Funding; Novartis: Consultancy, Research Funding; Epizyme: Consultancy; Modus Therapeutics: Consultancy." |
|
| Risk of bias | ||
| Bias | Authors' judgement | Support for judgement |
| Random sequence generation (selection bias) | Unclear risk | Participants were randomised into 1 of 3 arms. Not described. |
| Allocation concealment (selection bias) | Unclear risk | Allocation sequenced not described. |
| Blinding of participants and personnel (performance bias) All outcomes | Unclear risk | Participants were blinded to treatment arms. Placebo‐controlled trial. However, the placebo was not described. |
| Blinding of outcome assessment (detection bias) All outcomes | Unclear risk | Assessors were blinded to treatment arms. Placebo‐controlled trial. However, the placebo was not described. |
| Incomplete outcome data (attrition bias) All outcomes | Low risk | All participants randomised were accounted for in the final analysis. |
| Selective reporting (reporting bias) | Low risk | All important outcomes were reported. |
| Other bias | Low risk | Not detected. |
Niihara 2018.
| Study characteristics | ||
| Methods | RCT | |
| Participants | 230 people with sickle cell anaemia (homozygous haemoglobin S (HbSS)) or sickle β0‐thalassaemia (HbSβ0‐thalassaemia), and had had at least 2 pain crises (no upper limit) documented during the previous year. | |
| Interventions | L‐glutamine powder
N = 152
Age = mean (SD) 22.4 (12.32) years
Sex (male/female) = 73/79 versus Placebo powder (100% maltodextrin) N = 78 Age = mean (SD) 21.4 (12.42) years Sex (male/female) = 33/45 Both administered orally twice daily at approximately 0.3 g per kg of body weight per dose (10 g, 20 g, or 30 g [maximum dose] per day). |
|
| Outcomes | The primary efficacy end point was: the number of pain crises through week 48; ACS, priapism, and splenic sequestration were classified as SCD–related events regardless of the need for narcotics or ketorolac. Secondary efficacy end points: included the number of hospitalizations for SCD–related pain, the number of visits to an ED (or outpatient treatment centre) for SCD–related pain, and changes in haematologic measures (Hb and haematocrit levels and reticulocyte count) from baseline through to week 48. |
|
| Notes | "A pain crisis was defined as pain leading to treatment with a parenterally administered narcotic or ketorolac in an emergency department (ED) or outpatient treatment center or during hospitalization. Patients who were receiving treatment with hydroxyurea at a dose that had been stable for at least 3 months before screening and who intended to continue that treatment were eligible to participate". "A visit to an ED (or outpatient treatment center) on the same calendar day as a hospital admission was counted only as a hospitalization." Funding source: Emmaus Medical Declaration of interest by authors: "Dr. Bellevue reports grants from Emmaus Medical, Inc., during the conduct of the study; grants and other from Novartis, non‐financial support from Arbor Pharmaceuticals, non‐financial support from Amgen, non‐financial support from Genentech, non‐financial support from Merck, non‐financial support from Alexion, non‐financial support from Grifols, nonfinancial support from Gilead, non‐financial support from ER Squibb & Sons, non‐financial support from Millennium Pharmaceuticals, non‐financial support from Octapharma, personal fees from Genzyme, non‐financial support from Mallinckrodt, non‐financial support from Bayer, non‐financial support from AstraZeneca, outside the submitted work." Funder: EMMAUS MEDICAL, INC. 20725 S. Western Avenue, Suite 136 Torrance, CA 90501‐1884 |
|
| Risk of bias | ||
| Bias | Authors' judgement | Support for judgement |
| Random sequence generation (selection bias) | Unclear risk | Not described. Participants were randomly assigned, in a 2:1 ratio, with randomization stratified according to region of participating site and status with respect to hydroxyurea use. |
| Allocation concealment (selection bias) | Unclear risk | Not described. It was reported in the trial protocol that "Randomization information will be concealed from the investigators and the patients until the end of the study with the exception of an emergency situation involving a patient that requires unblinding of the treatment assignment." |
| Blinding of participants and personnel (performance bias) All outcomes | Low risk | Participants were blinded. "The trial medication and placebo were provided in individual, visually identical packets containing 5 g of white unflavored powder." |
| Blinding of outcome assessment (detection bias) All outcomes | Low risk | Assessors were blinded. "The trial medication and placebo were provided in individual, visually identical packets containing 5 g of white unflavored powder." |
| Incomplete outcome data (attrition bias) All outcomes | Low risk | All participants were analysed in the group to which they belonged. However, 36% of the participants in the intervention arm and 24% of the placebo group did not complete the trial for the following reasons: Intervention versus placebo Consent withdrawn = 15.1% versus 11.5% in placebo Non‐compliance = 5.3% versus 1.3% Lost to follow‐up = 3.3% versus 3.8% Adverse event = 3.3% versus 0 Death = 1.3% versus 0 Initiation of anti‐sickling agent = 1.3% versus 0 The authors claimed that the reasons were not related to the trial. "For the patients who discontinued the trial medication or placebo, the number of pain crisis was imputed as either the mean number of crisis (rounded to the nearest integer) in patients in the same trial group who completed the trial or the actual number of crisis the patient had at the time of discontinuation, whichever was greater." |
| Selective reporting (reporting bias) | High risk | All prespecified outcomes were reported in the results. However, haematological parameters were reported in a way that they could not be used in our review. |
| Other bias | Low risk | Not suspected. "To be consistent with the method for calculating sample size, and because pain crises are not normally distributed, a nonparametric analysis of the primary end point (Cochran–Mantel–Haenszel test with the use of modified ridit scores, which is equivalent to a stratified Wilcoxon rank‐sum test) was performed The Cochran–Mantel–Haenszel test compared the standardized ranks within strata (modified ridit scores) of the number of pain crises over 48 weeks between the trial groups. Because the Cochran–Mantel–Haenszel test provides P‐values but not an estimate of treatment effect, descriptive means and medians are presented to give context." |
Nur 2012.
| Study characteristics | ||
| Methods | RCT | |
| Participants | "Consecutive adult (age ≥ 18 years) homozygous sickle cell anemia (HBSS) or HbSβ0‐thalassemia outpatients (high performance liquid chromatography (HPLC) confirmed), at the Academic Medical Center (AMC), Amsterdam, The Netherlands, were eligible for the trial." | |
| Interventions | NAC ‐ participants were randomised to either 1200 mg or 2400 mg of NAC per day, participants started taking NAC (acetylcysteine 600 mg tablets dissolved in water; Pharmachemie B.V. Haarlem, The Netherlands) orally twice daily for 6 weeks. Median age = 23 years (range 20 ‐ 47 years) Sex (male/female) = 6/5 1200 mg NAC N = 6 Sex: not reported 2400 mg NAC N = 5 Sex: not reported |
|
| Outcomes | Primary end point: "reduction of erythrocyte phosphatidylserine (PS) expression as a direct indicator of erythrocyte membrane (oxidative) damage." Secondary end points: "changes in markers of haemolysis (hemoglobin, reticulocytes, LDH, and bilirubin) hypercoagulability, endothelial activation, and inflammation, and tolerability of oral NAC." |
|
| Notes | 6 weeks of follow‐up after NAC cessation Funding source: none Declaration of interest by authors: no information |
|
| Risk of bias | ||
| Bias | Authors' judgement | Support for judgement |
| Random sequence generation (selection bias) | Unclear risk | Not described. "After baseline measurements and randomization to either 1,200 or 2,400 mg of NAC per day, patients started taking NAC." |
| Allocation concealment (selection bias) | Unclear risk | Not reported. |
| Blinding of participants and personnel (performance bias) All outcomes | Unclear risk | Not reported. |
| Blinding of outcome assessment (detection bias) All outcomes | Unclear risk | Not reported. |
| Incomplete outcome data (attrition bias) All outcomes | Unclear risk | One participant had adverse reaction to 2400 mg NAC and was treated with 1200 mg NAC. It was not reported if the participant data were analysed in the 2400 mg group or not. |
| Selective reporting (reporting bias) | High risk | Data for the review outcomes were not properly presented in a way they could be used for analysis. |
| Other bias | Low risk | Not suspected. |
Onalo 2021.
| Study characteristics | ||
| Methods | RCT | |
| Participants | 68 children with SCA‐VOC with or without ACS Age 5 to 17 years, mean (SD) 10.6 (0.4) years Sex (male/female) = 38/30 |
|
| Interventions | Oral L‐arginine‐hydrochloride (100 mg/kg three times/day).
N = 35
Age = mean (SD) 10.7 (3.2) years
Sex (male/female) = 18/17 versus Placebo N = 33 Age = mean (SD) 10.5 (3.5) years Sex (male/female) =20/13 "The study drug (arginine or placebo) was dissolved in red grape juice, mixed in an identical fashion and consumed immediately, administered by the hospital staff to insure compliance." |
|
| Outcomes | The primary outcome measure: "was analgesic usage, quantified by difference in the mean Analgesic Medication Quantification Scale (MQS)." "Secondary outcomes included daily pain scores, time‐to‐crisis‐resolution and length‐of‐hospital‐stay" |
|
| Notes | Location: Nigeria "Children with a known/suspected allergy to arginine, those with kidney disease (serum creatinine >1.2 mg/dL), liver disease (clinical diagnosis of hepatitis or serum glutamic‐pyruvic transaminase (SGPT) > 3 times the upper limit of normal), a metabolic acidosis (serum bicarbonate < 16 mmol/L) or those with non‐VOC pain were excluded from participation." "Patients received institutional standard of care therapy. The cumulative dose of analgesics administered was computed daily and scored using the validated analgesic medication quantification scale (MQS)24 while total opioid intake was computed using morphine‐equivalent units/kilogram". Definition of terms: "change in mean pain scores, time‐to‐crisis‐resolution (defined as time‐from‐study‐drug‐randomization to pain score <4), the total length‐of‐hospital stay across the study arms and re‐admission within 7 days of hospital discharge. Crisis resolution was defined as a worst pain score <4 (using the Numerical Pain Rating Scale). Time‐to crisis‐resolution in patients with missing end‐point data due to early discharge were censored at the actual time of discharge." Funders: "This trial was funded by the Tertiary Education Trust Fund (to RO) and in part by NIH/NCCIHK24AT009893 (to CRM). The funders of the trial had no role in trial design, data collection, data analysis, data interpretation, or writing of the report." Funding source: the Tertiary Education Trust Fund (to RO) and in part by NIH/NCCIH K24AT009893 (to CRM). Declaration of interest by authors: the funders of the trial had no role in trial design, data collection, data analysis, data interpretation, or writing of the report. We obtained additional information not reported in the published article from the authors. The authors informed us they used a visual analogue scale from 0 to 10 (lower score is better). |
|
| Risk of bias | ||
| Bias | Authors' judgement | Support for judgement |
| Random sequence generation (selection bias) | Low risk | "Randomization number sequences were computer‐generated by a Good Clinical Practice certified pharmacist, through Microsoft Office Excel." |
| Allocation concealment (selection bias) | Unclear risk | Not described |
| Blinding of participants and personnel (performance bias) All outcomes | Low risk | "The supplement (L‐arginine‐hydrochloride) and the placebo (sucrose) were provided in visually identical packets with a pre‐determined dose, administered by a blinded pharmacist and/or a nurse" |
| Blinding of outcome assessment (detection bias) All outcomes | Low risk | "The supplement (L‐arginine‐hydrochloride) and the placebo (sucrose) were provided in visually identical packets with a pre‐determined dose, administered by a blinded pharmacist and/or a nurse." |
| Incomplete outcome data (attrition bias) All outcomes | Low risk | All participants randomised were accounted for and included in the final analysis. |
| Selective reporting (reporting bias) | High risk | Not all outcomes prespecified in trial protocol were reported. |
| Other bias | High risk | Pain score used was unclear |
Pace 2003.
| Study characteristics | ||
| Methods | RCT | |
| Participants | 21 participants diagnosed with homozygous sickle cell anaemia or haemoglobin S–beta‐thalassemia, aged 15 years and above. | |
| Interventions | "Randomization into one of 4 treatment groups [0 mg (placebo), 600 mg, 1,200 mg, or 2,400 mg of NAC by mouth divided 3 times a day." "Regardless of drug dose, all subjects received 4 capsules to maintain the double‐blind status. Participants with less than 80% compliance on 2 follow‐up visits were discharged from the study." 600 mg NAC: N = 5 Age = mean (SD) 18.1 (2.9) years Sex (male/female) = 3/2 1200 mg NAC: N = 5 Age = mean (SD) 17.9 (1.2) years Sex (male/female) = 2/3 2400 mg NAC: N = 6 Age = mean (SD) 20.1 (4.9) years Sex (male/female) = 3/3 Placebo: N = 5 Age = mean (SD) 26.1 (12.9) years Sex (male/female) = 3/2 |
|
| Outcomes | Primary outcomes: "Dense cell and ISC levels and the number of acute VOC episodes defined as a visit to a medical facility that lasted more than 4 hr for acute pain related to vaso‐occlusion requiring parenteral narcotics. The occurrence of acute chest syndrome, priapism, splenic, or hepatic sequestration was also counted as a VOC episode. Acute chest syndrome included those subjects with chest wall pain and a new infiltrate on chest X ray. Priapism was defined as a painful erection lasting more than 2 hr requiring medical intervention; splenic or hepatic sequestration was defined as a sudden increase in organ size and a concomitant drop in hemoglobin greater than 2 g/dL from average baseline values. The 4‐hr period excluded time for registration at the medical facility and time spent waiting to be seen by a physician." | |
| Notes | Location: USA "The primary eligibility criteria included individuals at least 15 years old, diagnosed with sickle cell anemia or hemoglobin S–beta‐thalassemia, with dense cells greater than 6% and 2 or more VOC episodes per year for the 2 years prior to enrollment. Exclusion criteria included all other hemoglobinopathies not included in the eligibility criteria, pregnancy, narcotic addition, chronic transfusions, and history of stroke, HIV positive, investigational drug therapy, or known allergy to NAC." "During the first month (visits 1 – 3) of the trial period all subjects were treated with 4 placebo capsules by mouth 3 times a day and were taught to record in diaries to keep track of VOC episodes, other medications, and adverse side effects. Participants were not aware that everyone on trial received placebo during the run‐in period of 1 month. During follow‐up clinic visits a capsule count was completed, diaries reviewed, and urine pregnancy tests were performed for female subjects before the subsequent month’s drug supply was dispensed. Blood samples for laboratory tests were drawn 1 hr after drug dosing in the clinic to obtain steady‐state NAC levels." Funding source: Comprehensive Sickle Cell Center (to S.G.); Contract grant number: HL35680; Contract grant sponsor: Zambon Corporation Declaration of interest by authors: no information |
|
| Risk of bias | ||
| Bias | Authors' judgement | Support for judgement |
| Random sequence generation (selection bias) | Unclear risk | Not described. "Randomization into one of 4 treatment groups [0 mg (placebo), 600 mg, 1,200 mg, or 2,400 mg of NAC by mouth divided 3 times a day." |
| Allocation concealment (selection bias) | Unclear risk | Not reported. |
| Blinding of participants and personnel (performance bias) All outcomes | Low risk | "The participants, investigators, and staff were not aware of the individual treatment group members. The hematologists reviewed all laboratory tests in a blinded fashion. The data collected was analyzed after study closure without interim analyses." |
| Blinding of outcome assessment (detection bias) All outcomes | Low risk | "The participants, investigators, and staff were not aware of the individual treatment group members. The hematologists reviewed all laboratory tests in a blinded fashion. The data collected was analyzed after study closure without interim analyses." |
| Incomplete outcome data (attrition bias) All outcomes | Low risk | All participants completed the trial. |
| Selective reporting (reporting bias) | Low risk | Not suspected. All outcomes listed in the methods were reported. |
| Other bias | Low risk | Not suspected. |
Prasad 1984.
| Study characteristics | ||
| Methods | RCT | |
| Participants | 27 homozygous individuals with sickle cell anaemia Sex (male/female)= 13/14 Age = 14 to 49 years |
|
| Interventions | Zinc supplement (zinc acetate) 15 mg of zinc supplementation as acetate twice a day for 1 year N = not reported Sex = not reported Age = mean (SD) = 12.5 (1.5) years versus Placebo N = not reported Sex = not reported Age = mean (SD) 12.0 (0.5) years |
|
| Outcomes | Diagnostic accuracy of atomic absorption spectrophotometry for measuring zinc in neutrophils. The beneficial effects of zinc supplementation on longitudinal growth and body weight. |
|
| Notes | Did not report our outcomes. Funding source: "In part by a grant from the Sickle Cell Center of the National Heart, Lung and Blood Institute; by grant AM31401‐01 from the National Institute of Arthritis, Diabetes, Digestive and Kidney Diseases; and a grant from the Veterans Administration." Declaration of interest by authors: no information |
|
| Risk of bias | ||
| Bias | Authors' judgement | Support for judgement |
| Random sequence generation (selection bias) | Unclear risk | Not described. 10 males aged between 14 and 17 years with retarded growth were subdivided randomly into 2 groups. 5 participants received placebo twice a day and the other 5 received 15 mg of zinc supplementation as acetate twice a day for 1 year. |
| Allocation concealment (selection bias) | Unclear risk | Not reported. |
| Blinding of participants and personnel (performance bias) All outcomes | Unclear risk | It is unclear whether participants were blinded. The nature of the placebo drug was not described. |
| Blinding of outcome assessment (detection bias) All outcomes | Unclear risk | It is unclear whether assessors were blinded. The nature of the placebo drug was not described. |
| Incomplete outcome data (attrition bias) All outcomes | Low risk | All participants randomised to study arms were accounted for in the final analysis. |
| Selective reporting (reporting bias) | Unclear risk | All outcomes listed in their methods were reported. However, most important outcomes reported by other trials were either not measured or reported. We could not access the trial protocol. |
| Other bias | Low risk | Not suspected. |
Rabb 1983.
| Study characteristics | ||
| Methods | Quasi‐RCT | |
| Participants | Children with SCD N = 115 Sex (male/female)= 64/51 Age = 6 months to 4 years |
|
| Interventions | Folic acid (5 mg) versus calcium lactate (placebo), one tablet was taken daily for at least 1 year. Both interventions in tablets were identical in appearance and neither the participants nor the paediatricians involved in the clinical management of the trial were aware of the code. Folic acid (5 mg) N = 59 Sex = no information Age = no information Placebo N = 56 Sex = no information Age = no information |
|
| Outcomes | "Major or minor infections, acute splenic sequestration, dactylitis or episodes of bone or abdominal pain." | |
| Notes | Location: Jamaica, follow‐up: 1 year Funding source: no information Declaration of interest by authors: no information |
|
| Risk of bias | ||
| Bias | Authors' judgement | Support for judgement |
| Random sequence generation (selection bias) | Unclear risk | Not described. "Each child was allocated to one of two trial groups, one group receiving tablets designated A containing calcium lactate (Placebo) and the other receiving tablets designated B (containing folic acid 5 mg". It was not clear if assignment was by randomization or alternation. |
| Allocation concealment (selection bias) | Unclear risk | No description. |
| Blinding of participants and personnel (performance bias) All outcomes | Low risk | "Tablets A and B were identical in appearance and neither the patients nor the paediatricians involved in the clinical management of the study were aware of the code." |
| Blinding of outcome assessment (detection bias) All outcomes | Low risk | "Tablets A and B were identical in appearance and neither the patients nor the paediatricians involved in the clinical management of the study were aware of the code." |
| Incomplete outcome data (attrition bias) All outcomes | High risk | 117 children were allocated to trial arms. However, 80 children completed the trial. Analysis was done for 115 children. No information was given to support the missing data. |
| Selective reporting (reporting bias) | Unclear risk | All outcomes listed in the methods were reported, but we could not access the trial protocol. |
| Other bias | Low risk | Not suspected. |
Scoffone 2013.
| Study characteristics | ||
| Methods | RCT | |
| Participants | 27 males and females aged between 18 and 65 years of age, electrophoresis or HPLC documentation of homozygous haemoglobin S only phenotype. | |
| Interventions | Extended‐release niacin (niacin‐ER)
N = 12 versus Placebo N = 15 12 weeks of placebo or niacin‐ER. The medication was incrementally dosed in 500 mg steps every 4 weeks as tolerated, to a maximum dose of 1500 mg daily. |
|
| Outcomes | Primary outcome: "the absolute change in HDL‐C after niacin‐ER treatment, i.e. post‐treatment (week 12) HDL‐C minus pre‐treatment (week 0) HDL‐C. Changes in HDL‐C were planned to be compared using a one‐sided Wilcoxon rank‐sum test because our primary hypothesis was that there would be a greater increase in HDL‐C in the subjects taking niacin‐ER, and standard clinical laboratory assays (standard complete blood counts with hemoglobin F levels, iron‐binding studies, serum chemistry, lipid panels, amino terminal brain natriuretic peptide, homocysteine, and C‐reactive protein.)". | |
| Notes | Inclusion criteria: "HDL‐C <39 mg/dL or apoA‐I <99 mg/dL, hemoglobin >5.5 g/dL, or if hemoglobin <9.0 g/dL, absolute reticulocyte count >95,000/μl." Exclusion criteria: "Acute pain crisis requiring intravenous analgesics within 2 weeks prior to enrollment, women who were pregnant, lactating, or not using birth control at the time of enrollment, hemoglobin SC disease or hemoglobin A >20%. In addition, subjects were excluded if they used aspirin or non‐steroidal anti‐inflammatory drugs within 1 week prior to vascular testing, or used caffeine the day of vascular testing. diabetes mellitus, cigarette smoking within one month prior to enrollment, renal failure, gout, and significant cardiovascular disease such as uncontrolled hypertension, peripheral artery disease, or severe hypotension. The use of medications including sildenafil, tadalafil, L‐arginine, fibrates, inhaled nitric oxide, or any prostaglandins such as epoprostenol or treprostinil within one week prior to evaluation, or any statin within 4 weeks prior to enrollment." Location: USA Funding source: National Heart, Lung and Blood Institute Division of Intramural Research (1 ZIA HL006017) Bethesda, MD; The Clinical Research Training Program, a public‐private partnership supported jointly by the NIH and Pfizer Inc (via a grant to the Foundation for NIH from Pfizer, Inc). Declaration of interest by authors: no information |
|
| Risk of bias | ||
| Bias | Authors' judgement | Support for judgement |
| Random sequence generation (selection bias) | Unclear risk | Not described. Simple randomization was used to assign participants to either 12 weeks of placebo or niacin‐ER. |
| Allocation concealment (selection bias) | Unclear risk | Not reported. Simple randomization was used to assign participants to either 12 weeks of placebo or niacin‐ER. |
| Blinding of participants and personnel (performance bias) All outcomes | Unclear risk | Participants were blinded. This was a placebo‐controlled trial. However, the placebo was not described. |
| Blinding of outcome assessment (detection bias) All outcomes | Unclear risk | Assessors were blinded. This was a placebo‐controlled trial. However, the placebo was not described. |
| Incomplete outcome data (attrition bias) All outcomes | High risk | Two participants withdrew from the intervention arm because of adverse events and one from the placebo arm because of distance to the trial location. The authors stated that these reasons were not related to the trial. However, the analysis did not include the missing data. |
| Selective reporting (reporting bias) | Unclear risk | All outcomes in the methods section were reported. However, it is not clear if all prespecified outcomes were reported. |
| Other bias | Low risk | Not suspected. |
Serjeant 1970.
| Study characteristics | ||
| Methods | Quasi‐RCT | |
| Participants | SCD participants with leg ulcers who attended the sickle‐cell clinic of the University Hospital of the West Indies. N = 34 Sex (male/female) = 16/18 Age = no information |
|
| Interventions | Oral zinc sulphate (220 mg zinc sulphate)
N = 17
Age = no information
Sex = no information versus Placebo (220 mg lactose) N = 17 Age = no information Sex = no information Trial period = 6 months |
|
| Outcomes | Rate in improvement of leg ulcers | |
| Notes | "The diagnosis of sickle‐cell anaemia was based on the presence of only haemoglobins S, F and A2 on starch‐gel electrophoresis, and no increase in Hb A2 when measured by column chromatography. Patients with active leg ulcers were admitted to the trial if they lived in the vicinity of Kingston and could attend at 2‐week intervals. At each attendance, the ulcer and an adjacent centimetre scale were photographed and blood was taken for estimation of serum‐zinc levels. All patients received the same topical therapy consisting of eusol and dressings." "The area of the ulcer was assessed by the following technique. The ulcer on the photograph was cut out and weighed. Preliminary testing indicated a linear relationship between the weight and the area of the photographic paper, and therefore the area of the ulcer could be estimated from the weight. The true ulcer size was calculated according to the scale. This technique does not recognise differences in ulcer depth, and ulcers occupying more than a quarter of the circumference of the leg may be underestimated because they diverge from the plane of the photograph." Location: Jamaica Funding source: "This research is supported by a grant from the Wellcome Trust, London." Declaration of interest by authors: no information |
|
| Risk of bias | ||
| Bias | Authors' judgement | Support for judgement |
| Random sequence generation (selection bias) | High risk | Authors allocated participants alternately to treatment and placebo groups. |
| Allocation concealment (selection bias) | Unclear risk | No information |
| Blinding of participants and personnel (performance bias) All outcomes | Low risk | Participants were blinded to the interventions. "Identical‐appearing tablets designated A or B, were given to the groups to be taken three times daily." "Neither person assessing ulcer size (M. C. G. or R. E. G.) knew which tablet contained zinc." |
| Blinding of outcome assessment (detection bias) All outcomes | Low risk | Assessors were blinded to the interventions. "Identical‐appearing tablets designated A or B, were given to the groups to be taken three times daily." "Neither person assessing ulcer size (M. C. G. or R. E. G.) knew which tablet contained zinc." |
| Incomplete outcome data (attrition bias) All outcomes | High risk | Two participants missing from intervention and three from placebo. One of the participants from the intervention was excluded because "a large scab overlying the ulcer area made a reliable assessment of the ulcer size impossible." Data were not analysed as intention‐to‐treat analysis. |
| Selective reporting (reporting bias) | Unclear risk | We did not assess the trial protocol. It is unclear if all prespecified outcomes were reported. |
| Other bias | Low risk | Not suspected. |
Serjeant 1997.
| Study characteristics | ||
| Methods | RCT | |
| Participants | 15 people with SCD with leg ulcers of at least 6 months' duration and at least 3 cm in diameter at the onset of treatment. Age: 17 to 40 years Sex (male/female): 12/3 |
|
| Interventions | Propionyl‐L‐carnitine versus placebo "Routine conservative treatment given to all participants included twice‐daily dressing with 0.01 % potassium permanganate, debridement of dirty ulcers with crushed unripe papaya, and oral zinc sulfate 200 mg three times daily after meals. At the end of the baseline observation period, patients were randomly assigned to receive PLC 2 grn twice daily or an identically packaged placebo containing lactose and microcrystalline cellulose, by a restricted procedure to ensure equal numbers in each group." |
|
| Outcomes | Healing rates | |
| Notes | "Ulcer size was assessed by area (measured in square centimeters), computing an assumed ellipse from long and short axis measurements. When more than one ulcer was present, the average area calculated for that patient was used in the analysis. Healing rate was standardized to a 12‐week period and expressed as (1) absolute change in area (change in ulcer area over treatment period divided by number of weeks on treatment) x 12 and (2) percentage change in area (absolute change in area + area at start of treatment)." Funding: grant from Sigma‐Tau pharmaceuticals, Gaithersburg |
|
| Risk of bias | ||
| Bias | Authors' judgement | Support for judgement |
| Random sequence generation (selection bias) | Unclear risk | "Patients were randomly assigned to receive PLC 2 grn twice daily or an identically packaged placebo containing lactose and microcrystalline cellulose". Generation of the random sequence not described |
| Allocation concealment (selection bias) | Unclear risk | Random allocation not described |
| Blinding of participants and personnel (performance bias) All outcomes | Low risk | Participants were blinded to the interventions. "An identically packaged placebo containing lactose and microcrystalline cellulose". |
| Blinding of outcome assessment (detection bias) All outcomes | Low risk | Assessors were blinded to the interventions. "An identically packaged placebo containing lactose and microcrystalline cellulose". |
| Incomplete outcome data (attrition bias) All outcomes | Low risk | All participants were included in the final analysis. |
| Selective reporting (reporting bias) | Low risk | Not suspected. |
| Other bias | High risk | "These methods compensated for shorter or longer duration of follow‐up in occasional deviations from the protocol". |
Sins 2018.
| Study characteristics | ||
| Methods | RCT | |
| Participants | Individuals ≥ 12 years old with HbSS, HbSC, HbSb⁰ or HbSb⁺ disease and history of ≥1 VOC per year. N = 96 |
|
| Interventions | Oral NAC 600 mg twice daily or placebo. Total treatment duration was 6 months. Oral NAC 600 mg N = 48 Age = mean (SD) 29.6 (8.4) years Sex (male/female) = 25/23 Placebo N = 48 Age = mean (SD) 28.4 (8.9) years Sex = 17/31 |
|
| Outcomes | Primary outcomes: the rate of SCD‐related pain days per patient year, as measured by a daily pain diary ("severity of pain at home (diary‐documented numeric rating scale pain score") Secondary outcomes: "the rate per patient year of days with VOC, admission days for VOC, hospitalizations for VOC and days with home analgesic use. the health‐related quality of life (HRQoL). Data on HRQoL was collected by use of self‐reported questionnaires, respectively the validated SF‐36 questionnaire version 1.0 in adults participants and the PedsQL version 4.0 in minor participants.(Ware & Sherbourne, 1992; Varni et al, 2001)" |
|
| Notes | This trial was initiated in four centres in the Netherlands in 2012, and expanded to six centres in Belgium and one centre in the UK in 2015. Follow‐up = 6 months Individuals were eligible for participation if they were ≥ 12 years old, had either HbSS, HbSC, HbSb⁰ or HbSb⁺ disease, and a history of ≥1 VOC per year. Event rates per treatment arm were compared by Poisson regression analysis. Funding source: "research funding from The Netherlands Organisation for Health Research and Development (ZonMw), the Academic Medical Centre, JANIVO Stichting, Egbers Stichting, Fonds NutsOhra to B.J.B. and K.F., and the Belgian Haematology Society to M.‐A.A." Declaration of interest by authors: "the sponsors of this trial are public or non‐profit organizations that support science in general. They had no role in gathering, analysing or interpreting the data." |
|
| Risk of bias | ||
| Bias | Authors' judgement | Support for judgement |
| Random sequence generation (selection bias) | Low risk | "The randomization sequence was computer generated" and "randomization was performed using a central, password protected, web‐based randomization service which provided each patient with a unique study number linked to one of the treatment arms. Randomization was balanced according to the stratification factors haemoglobin genotype (HbSS/HbSβ⁰ or HbSC/HbSβ⁺), use of hydroxyurea (HU) at time of randomization and study centre, with an allocation ratio of 1:1 and variable block sizes with a maximum of 4." |
| Allocation concealment (selection bias) | Low risk | "The randomization sequence was computer generated and randomization was performed using a central, password protected, web‐based randomization service which provided each patient with a unique study number linked to one of the treatment arms." This implies that randomization order was hidden from the investigators. "Both participants, parents and members of the medical team, including research staff and outcome assessors, were not provided with the randomization key." |
| Blinding of participants and personnel (performance bias) All outcomes | Low risk | Participants were blinded to treatment arms. "The 2 treatments, NAC and placebo, were identical in appearance. Upon randomization (ALEA® software, TenALEA Consortium, Amsterdam, The Netherlands), each patient was provided with a unique study number linked to one of the treatment arms. The randomization key of these study numbers was available at all the participating pharmacies, allowing the distribution of the correct treatment." |
| Blinding of outcome assessment (detection bias) All outcomes | Low risk | Assessors were blinded to treatment arms. "The 2 treatments, NAC and placebo, were identical in appearance. Upon randomization (ALEA® software, TenALEA Consortium, Amsterdam, The Netherlands), each patient was provided with a unique study number linked to one of the treatment arms. The randomization key of these study numbers was available at all the participating pharmacies, allowing the distribution of the correct treatment." |
| Incomplete outcome data (attrition bias) All outcomes | High risk | A prespecified per‐protocol analysis was performed on a subset of patients with ≥ 80% adherence to the assigned trial medication, as checked by tablet counts. Not all randomized participants were included in the final analysis. 12 withdrew (4 withdrew because of AE and 8 = participant's decision) and 5 lost to follow‐up in the intervention group. 4 withdrew (AE = 1, participant decision = 1, doctor's decision = 1) from the placebo group and 4 lost to follow‐up. |
| Selective reporting (reporting bias) | Low risk | All outcomes listed in the protocol were reported. |
| Other bias | Low risk | Not suspected. |
Styles 2007.
| Study characteristics | ||
| Methods | RCT | |
| Participants | 51 children Male/female: no information Age: no information |
|
| Interventions | Children were treated for three months with one of two doses of arginine (0.05 g/kg/day or 0.1 g/kg/day) or a placebo. Male/female= no information. Total number of participants:
|
|
| Outcomes | Primary outcomes: nitric oxide level, Gardos channel activity, RBC density, sVCAM‐1, nitrotyrosine, ektacytometry, endothelin‐I and foetal haemoglobin | |
| Notes | Funding source: "supported by NHLBI U5HL070587" Declaration of interest by authors: no information because full text was not accessible; only abstract available. |
|
| Risk of bias | ||
| Bias | Authors' judgement | Support for judgement |
| Random sequence generation (selection bias) | Unclear risk | Inadequate information to make judgement. No full text was available. |
| Allocation concealment (selection bias) | Unclear risk | Inadequate information to make judgement. No full text was available. |
| Blinding of participants and personnel (performance bias) All outcomes | Unclear risk | This was a placebo‐controlled trial. No information was provided to know whether participants and personnel were blinded. |
| Blinding of outcome assessment (detection bias) All outcomes | Low risk | This was a placebo‐controlled trial. No information was provided to know whether assessors were blinded. |
| Incomplete outcome data (attrition bias) All outcomes | Unclear risk | Inadequate information to make judgement. No full text was available. |
| Selective reporting (reporting bias) | Unclear risk | Inadequate information to make judgement. No full text available. |
| Other bias | Unclear risk | Inadequate information to make judgement. No full text available. |
Tomer 2001.
| Study characteristics | ||
| Methods | RCT | |
| Participants | Adults with sickle cell syndromes and frequent pain episodes (≥ 3 events/year) who were not on hydroxyurea. N = 10 Sex and age, not reported. |
|
| Interventions | "Dietary n‐3FAs as menhaden fish oil (0.25 g/kg/d, containing 0.1 g/kg/d n‐3FAs): Menhaden fish oil, containing 30% n‐3FAs (12% EPA and 18% DHA), was given as 1‐gram capsules divided into three daily doses with meals."
N = 5
Sex = not reported versus Olive oil (0.25 g/kg/d) in capsule N = 5 Sex = not reported |
|
| Outcomes | Primary outcome: frequency of pain episodes ("A pain episode was defined as an acute painful event involving extremities, back, chest, and/or abdomen, that was consistent with prior sickle pain episodes experienced by the patients without any other precipitating factors. Only the pain episodes requiring parenteral analgesics were counted.") Secondary outcome: changes in blood markers of thrombosis |
|
| Notes | "Menhaden fish oil and olive oil capsules were prepared by the National Marine Fisheries Service, Charleston Laboratory, Charleston, SC. " "Participants were selected based on their history of compliance with previous therapy." "Subjects were studied baseline and at 1, 3, 6 and 12 months following treatment for flow cytometric platelet activation markers, platelet secretion, and expression of procoagulant activity by platelets and erythrocytes." "Compliance to dietary n‐3FAs was assessed by both independent group t‐tests and Wilcoxon rank sum tests for the continuous measures of fatty acids. If there were discrepancies between the parametric and non‐parametric statistics, distributional assumptions were checked, and the single most appropriate statistic was used for reporting results." Funding source: no information Conflict of interest: no information |
|
| Risk of bias | ||
| Bias | Authors' judgement | Support for judgement |
| Random sequence generation (selection bias) | Unclear risk | Not described. "Randomization was based on age and sex and was performed by a research nurse who was not directly interacting with these subjects." |
| Allocation concealment (selection bias) | Unclear risk | Not described. |
| Blinding of participants and personnel (performance bias) All outcomes | Low risk | Participants were blinded. "The intervention and the control were similar in appearance. "Menhaden fish oil and olive oil capsules were prepared by the National Marine Fisheries Service, Charleston Laboratory, Charleston, SC." |
| Blinding of outcome assessment (detection bias) All outcomes | Low risk | Assessors were blinded. "The intervention and the control were similar in appearance. "Menhaden fish oil and olive oil capsules were prepared by the National Marine Fisheries Service, Charleston Laboratory, Charleston, SC." |
| Incomplete outcome data (attrition bias) All outcomes | Low risk | All randomized participants were analysed in the results. |
| Selective reporting (reporting bias) | Unclear risk | We could not access the trial protocol to verify that the authors reported all prespecified outcomes. |
| Other bias | Low risk | Not suspected. |
ACS: acute chest syndrome; ALA: alpha‐lipoic acid; DHA: docosahexaenoic acid; ED: emergency department; EPA: eicosapentaenoic acid; d: day(s); Hb: haemoglobin; HbSS: haemoglobin homozygous S; HPLC: high‐performance liquid chromatography; HU: hydroxyurea; LDH: lactate dehydrogenase; NAC: N‐acetylcysteine; ϕ‐3: omega‐3; PCR: polymerase chain reaction amplification; RBC: red blood cell; RCT: randomized controlled trial; Sb0 thalassaemia: sickle beta 0 thalassaemia; SCA: sickle cell anaemia; SCD: sickle cell disease; sVCAM‐1: circulating vascular cell adhesion molecule‐1; VOC: vaso‐occlusive crises; VOE: vaso‐occlusive pain events
Characteristics of excluded studies [ordered by study ID]
| Study | Reason for exclusion |
|---|---|
| Ajayi 1993 | Ineligible study design |
| Eberhardt 2002 | Ineligible study design |
| Elias 2013 | Ineligible study design |
| Ghahramanlu 2014 | Ineligible study design |
| Gordeuk 2018 | Ineligible study design |
| Guddati 2018 | Ineligible study design |
| Jaja 2002 | Ineligible study design |
| Marealle 2018 | Ineligible study design |
| Mirhosseini 2011 | Ineligible study design |
| NCT00131508 | Trial terminated due to slow recruitment |
| Prasad 1999 | Ineligible study design |
| Shiva 2018 | Ineligible study design |
| Tschumi 1981 | Ineligible participants |
Characteristics of studies awaiting classification [ordered by study ID]
Abdelhalim 2022.
| Methods | RCT |
| Participants | The target population was paediatric patients attending the Beni‐Suef and Giza governmental hospitals for their regular care at the paediatric haematology clinic. Children aged 7 to 18 years old who presented with sickle cell anaemia (HbSS mutation diagnosed with haemoglobin electrophoresis). |
| Interventions | "Omega‐3 supplementation (300 mg to 400 mg eicosapentaenoic acid (EPA) and 200 mg to 300 mg of docosahexaenoic acid (DHA)) per day for 10 consecutive months or vitamin D 1500 IU to 3500 IU" plus standard therapy |
| Outcomes | The impact of the experimental interventions and treatment duration on vaso‐occlusive painful crises |
| Notes |
Akinkugbe 1983.
| Methods | We could not access the full text. No information on methods provided in the abstract. |
| Participants | No abstract available |
| Interventions | No abstract available |
| Outcomes | No abstract available |
| Notes |
Brewer 1977.
| Methods | No full‐text publication was available. |
| Participants | No full‐text publication was available. |
| Interventions | Zinc |
| Outcomes | No full‐text publication was available. |
| Notes |
Friedrisch 2016.
| Methods | RCT |
| Participants | Sixty‐eight patients with SCD |
| Interventions | L‐arginine (0.1 g/kg/day) versus placebo for 6 months N = 68 L‐arginine Number of participants, age, and sex/group were not stated in the abstract (only abstract was available) |
| Outcomes | "leg ulcers, priapism, pulmonary arterial hypertension (PAH), and vaso‐occlusive pain episodes, and the degree of hemolysis rate" |
| Notes | No full‐text publication available; data obtained from abstract |
Gupta 1987a.
| Methods | No abstract available |
| Participants | No abstract available |
| Interventions | No abstract available |
| Outcomes | No abstract available |
| Notes |
Gupta 1987b.
| Methods | No information, only title available |
| Participants | No abstract available |
| Interventions | No abstract available |
| Outcomes | No abstract available |
| Notes |
Koh 2005.
| Methods | Prospective randomized crossover double‐blind trial of L‐glutamine for the therapy of sickle cell disease [abstract] |
| Participants | No information provided in the abstract |
| Interventions | No information provided in the abstract |
| Outcomes | No information provided in the abstract |
| Notes | Presented in a conference. No information provided in the abstract |
Namazzi 2023.
| Methods | RCT |
| Participants | Children with sickle cell disease |
| Interventions | Zinc versus placebo |
| Outcomes | Severe or invasive infections |
| Notes |
NCT00513617.
| Methods | RCT |
| Participants | 128 particpants with SCD |
| Interventions | Arginine versus placebo |
| Outcomes |
|
| Notes | Completed January 2008 |
NCT00586209.
| Methods | No information, only title available |
| Participants | Sickle cell anaemia |
| Interventions | L‐glutamine |
| Outcomes | Effect of L‐glutamine therapy on exercise endurance of sickle cell anemia |
| Notes |
NCT01054768.
| Methods | RCT, placebo‐controlled |
| Participants | Sickle cell patients |
| Interventions | Dietary supplement: alpha‐lipoic acid and acetyl‐L‐carnitine Placebo |
| Outcomes | Primary outcome measures: C‐reactive protein (time frame: 6 months)
Secondary outcome measures
|
| Notes |
NCT01849016.
| Methods | RCT |
| Participants | People 12 years and older with SCD |
| Interventions | N‐acetylcysteine versus placebo |
| Outcomes | The incidence rate of SCD‐related pain in daily life per patient year The severity of SCD‐related pain in daily life, using a 0‐10 numerical rating scale (NRS) in the study pain diary |
| Notes | Completed June 2016. Results not available |
NCT03293641.
| Methods | Randomized controlled pilot trial |
| Participants | 40 children aged 6 months to less than 13 years |
| Interventions | Zinc plus standard of care versus standard of care management for sickle cell disease |
| Outcomes | Primary outcome measures: zinc levels in plasma, measurement of change in zinc levels from baseline at study conclusion (time frame: 6 months). Secondary outcome measures
|
| Notes | Completed, no results available |
NCT04684381.
| Methods | RCT |
| Participants | People aged 5 years and older with SCD |
| Interventions | L‐glutamine |
| Outcomes |
|
| Notes | Completed June 2021 |
NCT05371184.
| Methods | RCT |
| Participants | Aged 2 to 18 years with sickle cell disease (SCD) |
| Interventions | L‐glutamine, oral powder for reconstitution |
| Outcomes |
|
| Notes | Completed in January 2024 |
HbSS: haemoglobin SS; IM: intramuscular; NAC: N‐acetylcysteine; PCR: polymerase chain reaction; RCT: randomized controlled trial; RDT: rapid diagnostic tests; SCA: sickle cell anaemia; SCD: sickle cell disease; VOC: vaso‐occlusive crisis; VWF: von Willebrand factor; WHO: World Health Organization
Characteristics of ongoing studies [ordered by study ID]
Datta 2019.
| Study name | Zinc for infection prevention in sickle cell anemia (zips): study protocol for a randomized placebo‐controlled trial in ugandan children with sickle cell anemia |
| Methods | RCT |
| Participants | 250 Ugandan children 1.00‐4.99 years of age with SCA |
| Interventions | Dietary supplement: zinc Other: placebo |
| Outcomes | The investigators will assess reduction in incidence of severe or invasive infections, with or without culture or PCR confirmation |
| Starting date | March 2019 |
| Contact information | Ryan White Center for Pediatric Infectious Disease and Global Health, Department of Pediatrics, Indiana University School of Medicine, 1044 W. Walnut St, R4 402D, Indianapolis, IN, 46202, USA. chjohn@iu.edu |
| Notes | This is a study protocol (study completed). |
EUCTR 2006‐005889‐40.
| Study name | N‐acetylcysteine for treatment of sickle cell disease |
| Methods | RCT |
| Participants | Participants with sickle cell disease (aged 18 to 65 years) |
| Interventions | N‐acetylcysteine |
| Outcomes | "Primary outcome measures are the effects of NAC [N‐acetylcysteine] on the laboratory markers described below.
|
| Starting date | 2 November 2006 (date on which this record was first entered in the EudraCT database) |
| Contact information | Academic Medical Centre, the Netherlands |
| Notes | Sponsor's Protocol Code Number: ABR‐15108 |
IRCT20210715051904N1.
| Study name | The effect of combination therapy of L‐glutamine and hydroxyurea in patients with sickle cell anemia |
| Methods | RCT |
| Participants | Patients aged 5 years and above with sickle‐cell syndrome |
| Interventions | L‐glutamine and hydroxyurea |
| Outcomes | Number of pain crises, number of hospitalizations for pain associated with sickle cell anemia |
| Starting date | 19 February 2022 |
| Contact information | Nader Shakibazad, Tabib Medical Building (9th floor), Keshtirani Crossroads, Boushehr, Iran, 7514799621 Boushehr, Iran (Islamic Republic of), email: shakibn@bpums.ac.ir |
| Notes | Boushehr University of Medical Sciences Information updated 3 April 2023 |
NCT01202812.
| Study name | A randomized trial of LOVAZA in pediatric sickle cell disease (SCD) |
| Methods | RCT |
| Participants | People aged 10 years to 19 years with sickle cell disease, and beta‐0 thalassaemia |
| Interventions | Omega‐3 fatty acids versus placebo |
| Outcomes | Primary: "to determine whether supplementation with LOVAZA will exert an anti‐inflammatory effect by decreasing levels of the inflammatory biomarker high sensitivity C Reactive Protein (hsCRP) in children and adolescents with sickle cell disease (SCD) (time frame: 6 months)" Secondary: "to determine whether supplementation with LOVAZA will increase health‐associated quality of life (QoL) responses as they relate to clinical vasocclusive events (VOC) in children and adolescents with sickle cell disease (SCD) (time frame: 6 months)" |
| Starting date | October 2010 |
| Contact information | Thomas Jefferson University |
| Notes |
NCT01891292.
| Study name | A phase 2 study of the efficacy of antioxidant therapy compared with enalapril in slowing the progression of sickle nephropathy in children |
| Methods | RCT |
| Participants | 30 children with sickle cell disease |
| Interventions | Enalapril versus N‐acetylcysteine |
| Outcomes | Primary outcome measure: urinary albumin excretion rate (time frame: 12 months) Secondary outcome measures: glomerular filtration rate, measurement of glomerular filtration rate by iohexol (time frame: 12 months) |
| Starting date | Not yet recruiting |
| Contact information | Lesley King, MB.BS; 976‐927‐2471; lesley.king@uwimona.edu.jm Marvin Reid, University of The West Indies |
| Notes | The purpose of this study is to determine whether enalapril or antioxidant therapy (N‐acetylcysteine) is effective in reducing microalbuminuria in children with sickle cell disease and and its progression to sickle nephropathy |
NCT02525107.
| Study name | Omega 3 fatty acid therapy for prevention of vaso‐occlusive crisis and manifestations in Omani patients with sickle cell disease |
| Methods | RCT |
| Participants | SCD patients 13 years to 70 years old |
| Interventions | Omega‐3 |
| Outcomes | Primary outcomes:
Secondary outcome measures: measurement of red blood cell membrane ethanolamine phosphoglyceride (DHA, EPA, AA) at baseline and after the 52‐week intervention period. Red blood cells membrane fatty acids profile (time frame: 52 weeks) |
| Starting date | September 2015 |
| Contact information | Salam Alkindi, MD, FRCPI +968‐99353188; sskindi@squ.edu.om; sskindi@yahoo.com Anil Pathare, MD, PhD +968‐99384951; pathare@squ.edu.om; avp16@hotmail.com |
| Notes | Status: unknown |
NCT04011345.
| Study name | Folic acid supplementation in children with sickle‐cell disease: a randomized double‐blind cross‐over trial |
| Methods | Cross‐over assignment |
| Participants | Children with sickle cell disease |
| Interventions | Folic acid supplementation (1 mg/d) |
| Outcomes | "Primary outcome measures:
Secondary outcome measures:
|
| Starting date | 3 January 2020 |
| Contact information | Brock Williams, MSc, RD905‐999‐3710 brock.williams@ubc.ca Crystal Karakochuk, PhD, RD604‐710‐8496 crystal.karakochuk@ubc.ca |
| Notes | Location: British Columbia, Canada |
NCT04301336.
| Study name | Different treatment modalities in the management of the painful crisis in pediatric sickle‐cell anemia |
| Methods | RCT |
| Participants | Sickle cell patients |
| Interventions |
All four experimental arms also receive standard care (e.g. hydroxyurea, folic acid supplementation, morphine sulfate) Control: standard care |
| Outcomes | Primary outcomes
|
| Starting date | 1 November 2019 |
| Contact information | Shaimaa Mahmoud Nashat Shayed Abdelhalim, Beni‐Suef University |
| Notes | Active, not recruiting. Four experimental groups, one control group. Procedure: blood transfusion session ‐ regular blood transfusion session based on patient haematological profile starts from one session every 2 weeks. |
NCT04839354.
| Study name | Sickle cell disease treatment with arginine therapy (STArT) trial (STArT) |
| Methods | RCT |
| Participants | People 3 to 21 years old with SCD |
| Interventions | Arginine hydrochloride versus placebo |
| Outcomes | Primary outcome measures: change in time‐to‐crisis resolution (time frame: date and time of first study drug administration and last IV opioid treatment ‐ up to 2 months); time in hours from study drug delivery to time of last dose of parenteral opioid delivery Secondary outcome measures:
|
| Starting date | 21 June 2021 |
| Contact information | Claudia R. Morris MD, Emory University |
| Notes | Still recruiting, estimated completion date is April 2027 |
NTR3806.
| Study name | N‐acetylcysteine in patients with sickle cell disease |
| Methods | RCT |
| Participants | Patients with sickle cell disease |
| Interventions | N‐acetylcysteine |
| Outcomes | Frequency of pain in patients |
| Starting date | 1 March 2013 |
| Contact information | Address: Amsterdam, the Netherlands Telephone: +31 (0)20 5661693 Email: j.w.sins@amc.nl Affiliation: Department of Hematology & Pediatric Hematology, Academic Medical Center, Amsterdam |
| Notes | Still recruiting |
RBR‐10r7d6f3.
| Study name | Clinical, anti‐inflammatory and antioxidant effects of fish oil and vitamin D supplementation in sickle cell disease patients: a randomized, blinded, placebo‐controlled study |
| Methods | RCT |
| Participants | Sickle cell disease patients |
| Interventions | Fish oil and vitamin D supplementation versus placebo |
| Outcomes | "Reduction in the number of hospitalizations, reduction in the frequency of pain episodes, reduction in pain intensity, blood count evaluation, lipid profile, C‐reactive protein, lactate dehydrogenase, tumor necrosis factor alpha (TNF‐a), VCAM, P‐selectin, HbS and HbF concentration, indirect oximetry." |
| Starting date | January 2018 |
| Contact information | Arianni Di Petta Address: Avenida Dr. Romeu Tortima, 452 City: Campinas / Brazil Zip code: 13083897 Phone: +55‐11‐979985081 Email: arianni.petta@grupoinvestiga.com.br |
| Notes |
Williams 2020.
| Study name | Folic acid supplementation in children with sickle cell disease: study protocol for a double‐blind randomized cross‐over trial. |
| Methods | RCT |
| Participants | Children with SCD |
| Interventions | 1 mg/d folic acid, standard care, placebo |
| Outcomes | RBC folate concentrations and secondary (UMFA) outcomes |
| Starting date | Not provided |
| Contact information | Not provided |
| Notes |
AA: amino acids; DHA: docosahexaenoic acid; EPA: eicosapentaenoic acid; HbF: foetal haemoglobin; HbS: sickle haemoglobin; HDL: high‐density lipoprotein; IV: intravenous(ly); LDL: low‐density lipoprotein; NAC: N‐acetylcysteine; PCR: polymerase chain reaction; RBC: red blood count; RCT: randomised controlled trial; SCA: sickle cell anaemia; SCD: sickle cell disease; VCAM: vascular cell adhesion molecule; VOC: vaso‐occlusive crisis; UMFA: unmetabolized folic acid
Differences between protocol and review
We prespecified the frequency of hospitalization as one of our secondary outcomes. However, our review also reported the mean number of hospitalization days/crisis, because the review team believes this information is clinically relevant.
We had planned to use the standardized mean difference (SMD) and corresponding 95% CIs if included studies had used different scales for measuring the same outcome.
As recommended in Chapter 23 of the Cochrane Handbook for Systematic Reviews of Interventions, for studies with multiple treatment groups of the same intervention (i.e. dose, route of administration), had study arms been sufficiently homogeneous to be combined, we would have included each pairwise comparison separately, but split the ‘shared’ group into two or more groups with a smaller sample size, creating two or more independent comparisons. We would have divided the number of events and the total number of participants for dichotomous outcomes, and for continuous outcomes, we would have divided the total number of participants without altering their means and standard deviations (Higgins 2022d).
Had we found any cross‐over trials that had included a 'washout' period in the trial design and investigators performed an appropriate paired analysis, then we would have included the effect estimate of the intervention for each outcome in a meta‐analysis using the generic inverse‐variance method (Deeks 2022). If a 'washout' period was not included or investigators had not analysed the data appropriately (i.e. paired analyses), we would have included data from the first phase of the cross‐over and analysed these as if the trial had a parallel‐group design (Deeks 2022; Higgins 2022d).
We had planned to combine the results from both individually‐randomized studies and cluster‐randomized studies if there was no heterogeneity between the studies. If possible, we also would have performed a sensitivity analysis to investigate the effects of the randomization unit. Had the authors of the cluster‐randomized studies ignored the clustering effect in their analyses, we would have calculated the studies' effective sample sizes using an estimate of the intracluster correlation coefficient (ICC). We had planned to derive the ICC from a study (if available in the publication or by contacting the authors) or from similar studies, and we would have calculated the design effect using the formula given in Section 23.1 in the Cochrane Handbook of Systematic Reviews of Interventions (Higgins 2022d).
In the case of missing data, we would have assumed that data were missing at random when there was no difference in the proportion of missing data between intervention and control groups. If there were too much missing data for one treatment group compared to another group, we would have performed an ‘as‐treated analysis’, using data for those participants who completed the trial, and an ITT analysis by analysing participants in the group to which they were randomized, and we would have assumed that the missing data had a poor outcome, irrespective of whether participants completed the trial. We would have compared the two results and used the result that is most representative of the true effect (Higgins 2022a).
Had there been at least substantial heterogeneity, we would have investigated possible causes through the following subgroup analyses.
Types of antioxidants
Age of participants (children up to 18 years versus adults)
Trial location (comparing the effect of race and nationality on the outcome of the trial)
Types of treatment (steady‐state treatment versus acute‐care treatment)
Had we conducted any meta‐analyses with sufficient numbers of trials, we would have conducted sensitivity analyses, to assess for the effect of the overall risk of bias by including or excluding those trials with an overall high risk of bias. We also would have assessed the effect of including or excluding cross‐over trials (Deeks 2022).
We had planned to present summary of findings tables for all comparisons. However, because this review had too many comparisons, we only present those comparisons that we believe are most important for decision‐makers.
Contributions of authors
OO is the guarantor (contact author for the review)
ABB and OO conceived the review.
ABB, JO, and OO developed the protocol.
ABB and OEO screened search outputs for inclusion, JO resolved conflicts in eligibility of studies.
ABB and ATO extracted data, OO resolved conflicts.
ABB and AAO assessed included studies for risk of bias, OO resolved conflicts.
OO entered data into RevMan Web.
OO and JO graded the certainty of the evidence.
OO wrote the first draft of the review.
All authors critically appraised and approved the final draft of the review.
Sources of support
Internal sources
-
Achievers University, Nigeria
For giving Olabisi Oduwole permission to have dedicated time for the review.
-
Lagos University Teaching Hospital, Nigeria
For giving Abiola Bolarinwa permission to travel for a mentoring retreat while working on this review
External sources
-
National Institute for Health Research, UK
This systematic review was supported by the National Institute for Health Research (NIHR), via Cochrane Infrastructure funding to the Cochrane Cystic Fibrosis and Genetic Disorders Group up to April 2023. The views and opinions expressed therein are those of the authors and do not necessarily reflect those of the NIHR, NHS or the Department of Health and Social Care.
-
Cochrane SA, South Africa
Aubrey Sheiham Evidence‐Based Health Care in Africa Leadership Award, UK. Financial support for meetings, travels and capacity building
Declarations of interest
ABB declares that he works as a health professional at Lagos University Teaching Hospital, Lagos, Nigeria.
OO declares that she has no conflicts of interest.
JO declares that he has no conflicts of interest.
AAO declares that she has no conflicts of interest.
OEO declares that she has no conflicts of interest.
ATO declares that she works as a health professional at Lagos University Teaching Hospital, Lagos, Nigeria.
New
References
References to studies included in this review
Arruda 2012 {published data only}
- Arruda MM, Mecabo G, Rodrigues CA, Matsuda SS, Rabelo IB, Figueiredo MS. Antioxidant vitamins C and E supplementation increases markers of haemolysis in sickle cell anaemia patients: a randomized, double-blind, placebo-controlled trial. British Journal of Haematology 2013;160(5):688-700. [CFGD REGISTER: SC251] [DOI: ] [DOI] [PubMed] [Google Scholar]
Bao 2008 {published data only}
- Bao B, Prasad A, Beck FW, Swerdlow P, Suneja AB. Beneficial effect of zinc supplementation on oxidative stress, cytokines and NF-KB DNA binding in sickle cell disease patients. Blood 2006;108(11):1203. [CFGD REGISTER: SC198a] [Google Scholar]
- Bao B, Prasad AS, Beck FW, Snell D, Suneja A, Sarkar FH, et al. Zinc supplementation decreases oxidative stress, incidence of infection, and generation of inflammatory cytokines in sickle cell disease patients. Translational Research 2008;152(2):67-80. [CFGD REGISTER: SC198b] [DOI] [PubMed] [Google Scholar]
Brownell 2020 {published data only}
- Brownell JN, Schall JI, Mcanlis CR, Smith-Whitley K, Norris CF, Stallings VA. Effect of high-dose vitamin a supplementation in children with sickle cell disease: a randomized, double-blind, dose-finding pilot study. Journal of Pediatric Hematology/Oncology 2020;42(2):83-91. [CFGD REGISTER: SC389] [DOI] [PubMed] [Google Scholar]
- NCT03632876. Nutritional outcomes after vitamin A supplementation in subjects with SCD. clinicaltrials.gov/ct2/show/NCT03632876 (first received 16 August 2018).
Daak 2013 {published data only}
- Daak AA, Elderdery AY, Elbashir LM, Mariniello K, Mills J, Scarlett G, et al. Omega 3 (n− 3) fatty acids down-regulate nuclear factor-kappa B (NF-κB) gene and blood cell adhesion molecule expression in patients with homozygous sickle cell disease. Blood Cells, Molecules, and Diseases 2015;55(1):48-55. [CFGD REGISTER: SC227c] [DOI: ] [DOI] [PubMed] [Google Scholar]
- Daak AA, Ghebremeskel K, Hassan Z, Attallah B, Azan HH, Elbashir MI, et al. Effect of omega-3 (n− 3) fatty acid supplementation in patients with sickle cell anemia: randomized, double-blind, placebo-controlled trial. American Journal of Clinical Nutrition 2013;97(1):37-44. [CFGD REGISTER: SC227a] [DOI] [PubMed] [Google Scholar]
- Daak AA, Ghebremeskel K, Mariniello K, Attallah B, Clough P, Elbashir MI. Docosahexaenoic and eicosapentaenoic acid supplementation does not exacerbate oxidative stress or intravascular haemolysis in homozygous sickle cell patients. Prostaglandins, Leukotrienes and Essential Fatty Acids 2013;89(5):305-11. [CFGD REGISTER: SC227b] [DOI] [PubMed] [Google Scholar]
Daak 2018 {published data only}
- Daak A, Heeney M, Dampier C, Fuh B, Kanter J, Alvarez O, et al. Clinical effect of SC411 (Altemia TM) on children with sickle cell disease in the scot trial: a phase 2 randomized, double-blind, placebo-controlled, parallel-group, dose-finding multi-center study. Pediatric Blood & Cancer 2018;65(Suppl 1):S8. [CFGD REGISTER: SC338a] [Google Scholar]
- Daak A, Heeney M, Dampier C, Fuh B, Kanter J, Alvarez O, et al. Effects of SC411 (altemiatm) on blood cell membrane omega-3 index and select sickle cell disease biomarkers in the scot trial: a phase 2 randomized, doubleblind, placebo-controlled, parallel-group, multi-center study. Pediatric Blood & Cancer 2018;65(Suppl 1):S122-3. [CFGD REGISTER: SC338b] [Google Scholar]
- Daak AA, Dampier CD, Fuh B, Kanter J, Alvarez OA, Black LV, et al. Double-blind, randomized, multicenter phase 2 study of SC411 in children with sickle cell disease (SCOT trial). Blood Advances 2018;2(15):1969-79. [CFGD REGISTER: SC338c] [DOI: ] [DOI] [PMC free article] [PubMed] [Google Scholar]
Dougherty 2012 {published data only}
- Dougherty KA, Schall JI, Kawchak DA, Green MH, Ohene-Frempong K, Zemel BS, et al. No improvement in suboptimal vitamin A status with a randomized, double-blind, placebo-controlled trial of vitamin A supplementation in children with sickle cell disease. American Journal of Clinical Nutrition 2012;96(4):932-40. [CFGD REGISTER: SC388] [DOI] [PMC free article] [PubMed] [Google Scholar]
Eleuterio 2019 {published data only}
- Eleuterio RM, Nascimento FO, Araujo TG, Castro MF, Filho TP, Filho PA, et al. Double-blind clinical trial of arginine supplementation in the treatment of adult patients with sickle cell anaemia. Advances in Hematology 2019;2019:4397150. [CFGD REGISTER: SC383] [DOI: 10.1155/2019/4397150] [DOI] [PMC free article] [PubMed] [Google Scholar]
Fung 2002 {published data only}
- Fung E, Kawchak D, Zemel B, Ohene-Frempong K, Stallings V. Plasma zinc is not a sensitive indicator of zinc status in children with sickle cell disease. In: National Sickle Cell Disease Program Annual Meeting Conference Proceedings; 2001 April; New York (NY). 2001. [ABSTRACT NO.: 82] [CENTRAL: CN-00342149] [CFGD REGISTER: SC122b]
- Fung EB, Kawchak DA, Zemel BS, Ohene-Frempong K, Stallings VA. Plasma zinc is an insensitive predictor of zinc status: use of plasma zinc in children with sickle cell disease. Nutrition in Clinical Practice 2002;17(6):365-72. [DOI] [PubMed] [Google Scholar]
- Zemel B, Kawchak D, Fung E, Ohene-Frempong K, Stallings V. Zinc supplementation and linear growth in children with sickle cell disease: a pilot study. In: National Sickle Cell Disease Program Annual Meeting Conference Proceedings; November 10-12, 2001. Sedona, Arizona, USA: the National Sickle Cell Disease Program, April 2001. [ABSTRACT NO.: 232] [CENTRAL: CN-00342218] [CFGD REGISTER: SC122a]
- Zemel BS, Kawchak DA, Fung EB, Ohene-Frempong K, Stallings VA. Effect of zinc supplementation on growth and body composition in children with sickle cell disease. American Journal of Clinical Nutrition 2002;75(2):300-7. [ABSTRACT NO.: SC122c] [CENTRAL: CN-00377436] [PMID: ] [DOI] [PubMed] [Google Scholar]
Gupta 1995 {published data only}
- Gupta VL, Chaubey BS. Efficacy of zinc therapy in prevention of crisis in sickle cell anemia: a double blind, randomized controlled clinical trial. Journal of the Association of Physicians of India 1995;43(7):467-9. [CFGD REGISTER: SC47] [PubMed] [Google Scholar]
Koshy 2001 {published data only}
- Koshy M, Askin M, McMahon L, Adams-Graves P, Halloway L, Faller DV, et al. Arginine butyrate in sickle cell leg ulcers: interim findings of a phase II trial. In: National Sickle Cell Disease Program 24th Annual Meeting; 2000 April . New Orleans, Louisiana, USA.: American Society of Hematology 4 1 st Anriual Meeting ,December 3-7, 1999, 2000:175a. [CFGD REGISTER: SC106b]
- Koshy M, Askin M, McMahon L, Adams-Graves P, Halloway L, Faller DV, et al. Arginine butyrate in sickle cell leg ulcers: interim findings of a randomized phase II trial. In: National Sickle Cell Disease Program 25th Annual meeting; 2001 April; New York (NY). 2001. [ABSTRACT NO.: 124] [CFGD REGISTER: SC106c]
- Koshy M, Edinburgh L, McMahon L, Adams-Graves P, Halloway L, Faller DV, et al. Arginine butyrate in sickle cell leg ulcers: interim findings of a phase II trial. Blood 1999;94(10 Suppl 1):417a. [CFGD REGISTER: SC106a] [Google Scholar]
Martins 2009 {published data only}
- Martins VD, Manfredini V, Peralba MC, Benfato MS. Alpha-lipoic acid modifies oxidative stress parameters in sickle cell trait subjects and sickle cell patients. Clinical Nutrition 2009;28(2):192-7. [CENTRAL: CN-00702638] [CFGD REGISTER: SC244] [EMBASE: 354411312] [PMID: ] [DOI] [PubMed] [Google Scholar]
McMahon 2010 {published data only}
- McMahon L, Tamary H, Askin M, Adams-Graves P, Eberhardt RT, Sutton M, et al. A randomized phase II trial of Arginine Butyrate with standard local therapy in refractory sickle cell leg ulcers. British Journal of Haematology 2010;151(5):516-24. [CFGD REGISTER: SC106e] [DOI] [PubMed] [Google Scholar]
- McMahon LC, Askin M, Koshy M, Tamary H, Atweh GF, Adam-Graves P, et al. A phase II trial of arginine butyrate in refractory sickle cell leg ulcers. Blood 2002;100(11 Pt 1 of 2):10a-11a. [CFGD REGISTER: SC106d] [Google Scholar]
- NCT00004412. Phase II randomized trial: arginine butyrate plus standard local therapy in patients with refractory sickle cell ulcers [Phase II trial of arginine butyrate for treatment of refractory leg ulcers in sickle cell disease or beta thalassemia]. clinicaltrials.gov/show/NCT00004412 (first received 19 October 1999).
Morris 2013 {published data only}
- Morris CR, Ansari M, Lavrisha L, Sweeters N, Kuypers F, Vichinsky EP. Arginine therapy for vaso-occlusive pain episodes in sickle cell disease. Blood 2009;114(22):573. [ABSTRACT NO.: 573] [CFGD REGSITER: SC214a] [DOI] [PMC free article] [PubMed] [Google Scholar]
- Morris CR, Kuypers FA, Lavrisha L, Ansari M, Sweeters N, Stewart M, et al. A randomized, placebo-controlled trial of arginine therapy for the treatment of children with sickle cell disease hospitalized with vaso-occlusive pain episodes. Haematologica 2013;98(9):1375-82. [CFGD REGISTER: SC214b] [DOI] [PMC free article] [PubMed] [Google Scholar]
Morris 2019 {published data only}
- Morris CR, Figueroa J, Watt A, Khemani K, Kumari P, Barnett M, et al. Safety of intravenous arginine therapy in children with sickle cell disease hospitalized for vaso-occlusive pain: a randomized placebo-controlled trial in progress. Blood 2019;134:995. [CFGD REGISTER: SC385] [DOI] [PMC free article] [PubMed] [Google Scholar]
Niihara 2018 {published data only}
- Gordeuk NY, Gordeuk VR. Consistent compliance with hydroxyurea and hematology measures during L-glutamine therapy for sickle cell anemia. Blood 2018;132:3657. [CFGD REGISTER: SC330g] [Google Scholar]
- Lam H, Becerra JM, Stark CW, Niihara Y, Callaghan M. The evaluation of transfusion data from the phase 3 clinical study of L-glutamine in sickle cell disease. Blood 2021;138:3116. [Google Scholar]
- NCT01179217. A phase III safety and efficacy study of l-glutamine to treat sickle cell disease or sickle βo-thalassemia [A phase III, prospective, randomized, double-blind, placebo-controlled, parallel-group, multicenter study of l glutamine therapy for sickle cell anemia and sickle ß0-thalassemia]. clinicaltrials.gov/show/NCT01179217 (first received 2010 August 2011). [CENTRAL: CN-01530932] [CFGD REGISTER: SC330e]
- Niihara Y, Miller ST, Kanter J, Lanzkron S, Smith WR, Hsu LL, et al. A phase 3 trial of L-glutamine in sickle cell disease. New England Journal of Medicine 2018;379(3):226-35. [CFGD REGISTER: SC330d] [DOI: 10.1056/NEJMoa1715971] [EMBASE: 623114951] [PMID: ] [DOI] [PubMed] [Google Scholar]
- Niihara Y, Razon R, Majumdar S, Claggett B, Onyekwere OC, Ikeda A, et al. Phase 3 study of l-glutamine in sickle cell disease: analyses of time to first and second crisis and average cumulative recurrent events. Blood 2017;130(1):685. [CFGD REGISTER: SC330c] [Google Scholar]
- Niihara Y, Stark CW, Razon R, Tran LT Becerra JM, Panosyan EH, et al. Consistent benefit of L-glutamine observed across patients with low, medium, and high number of crises reported in the year prior to screening-analysis from the phase 3 study of L-glutamine in sickle cell anemia. Blood 2018;132(Suppl 1):1065. [CFGD REGISTER: SC330f] [Google Scholar]
- Niihara Y, Tran L, Razon R, Stark C, Macan H. Decrease in the severity of painful sickle cell crises with oral PGLG. Blood 2015;126(23):2175. [CENTRAL: CN-01199454] [CFGD REGISTER: SC330b] [EMBASE: 72172471] [Google Scholar]
- Niihara Y, Viswanathan K, Miller ST, Guillaume E, Blackwood M, Razon R, et al. Phase 3 study of l-glutamine therapy in sickle cell anemia and sickle beta0 -thalassemia subgroup analyses show consistent clinical improvement. Blood 2016;128(22):1318. [CENTRAL: CN-01335155] [CFGD REGISTER: SC330a] [EMBASE: 614247445] [Google Scholar]
- Niihara Y, Viswanathan K, Miller ST, Guillaume E, Blackwood M, Razon R, et al. Phase 3 study of l-glutamine therapy in sickle cell anemia and sickle beta0-thalassemia subgroup analyses show consistent clinical improvement. Blood 2016;128:1318. [Google Scholar]
Nur 2012 {published data only}
- Nur E, Brandjes D, Teerlink T, Elferink RO, Muskiet F, et al. N-acetylcysteine reduces oxidative stress in sickle cell patients. Annals of Hematology 2010;92(Suppl 2):719. [CFGD REGISTER: SC249b] [DOI] [PMC free article] [PubMed] [Google Scholar]
- Nur E, Dees P, Brandjes D, Teerlink T, Elferink RO, Muskiet F, et al. N-acetylcysteine reduces oxidative stress in sickle cell patients. Annals of Hematology 2012;91:1097-105. [CFGD REGISTER: SC249a] [DOI: 10.1007/s00277-011-1404-z] [DOI] [PMC free article] [PubMed] [Google Scholar]
Onalo 2021 {published data only}
- Onalo R, Cilliers A, Cooper P, Morris CR. Arginine therapy and cardiopulmonary hemodynamics in hospitalized children with sickle cell anemia: a prospective, double-blinded, randomized placebo-controlled clinical trial. American Journal of Respiratory and Critical Care Medicine 2022;206(1):70-80. [DOI] [PMC free article] [PubMed] [Google Scholar]
- Onalo R, Cooper P, Cilliers A, Nnebe-Agumadu U, Oniyangi O, Oladimeji D, et al. Oral arginine therapy as a novel adjuvant in the management of acute pain in children with sickle cell anemia in Nigeria: a randomized placebo-controlled trial. Blood 2019;134:613. [CFGD REGISTER: SC384a] [Google Scholar]
- Onalo R, Cooper P, Cilliers A, Vorster BC, Uche NA, Oluseyi OO, et al. Randomized control trial of oral arginine therapy for children with sickle cell anemia hospitalized for pain in Nigeria. American Journal of Hematology 2021;96(1):89-97. [CFGD REGISTER: SC384b] [DOI: 10.1002/ajh.26028] [DOI] [PubMed] [Google Scholar]
- Onalo R, Cooper P, Vorster BC, Dercksen M, Cilliers A, Nnebe-Agumadu U, et al. Impact of oral arginine therapy on global arginine bioavailability in Nigerian children sickle cell anemia and vaso-occlusive pain. Blood 2020;136(Suppl 1):22-3. [DOI: 10.1182/blood-2020-134123] [DOI] [Google Scholar]
Pace 2003 {published data only}
- Pace BS, Shartava A, Pack-Mabien A, Mulekar M, Ardia A, Goodman SR. Effects of N-acetylcysteine on dense cell formation in sickle cell disease. American Journal of Hematology 2003;73(1):26-32. [CFGD REGISTER: SC153] [DOI] [PubMed] [Google Scholar]
Prasad 1984 {published data only}
- Prasad AS, Cossack ZT. Zinc in sickle cell disease. Transactions of the Association of American Physicians 1983;96:246-51. [CENTRAL: CN-00385759] [CFGD REGISTER: SC139a] [PubMed] [Google Scholar]
- Prasad AS, Cossack ZT. Zinc supplementation and growth in sickle cell disease. Annals of Internal Medicine 1984;100(3):367-71. [CFGD REGISTER: SC139b] [DOI] [PubMed]
- Prasad AS. Zinc deficiency in sickle cell disease. Progress in Clinical and Biological Research 1984;165:49-58. [PubMed] [Google Scholar]
Rabb 1983 {published data only}
- Rabb LM, Grandison Y, Mason K, Hayes RJ, Serjeant B, Serjeant GR. A trial of folate supplementation in children with homozygous sickle cell disease. British Journal of Haematology 1983;54(4):589-94. [CFGD REGISTER: SC74] [DOI] [PubMed] [Google Scholar]
Scoffone 2013 {published data only}
- Scoffone HM, Krajewski M, Zorca S, Bereal-Williams C, Littel P, Seamon C, et al. Effect of extended-release niacin on serum lipids and on endothelial function in adults with sickle cell anemia and low high-density lipoprotein cholesterol levels. American Journal of Cardiology 2013;112(9):1499-504. [CFGD REGISTER: SC252] [DOI] [PMC free article] [PubMed] [Google Scholar]
Serjeant 1970 {published data only}
Serjeant 1997 {published data only}
- Serjeant BE, Harris J, Thomas P, Serjeant GR. Propionyl-L-carnitine in chronic leg ulcers of homozygous sickle cell disease: a pilot study. Journal of the American Academy of Dermatology 1997;37(3):491-3. [CFGD REGISTER: SC82] [DOI] [PubMed] [Google Scholar]
Sins 2018 {published data only}
- Sins JW, Fijnvandraat K, Rijneveld AW, Boom M B, Kerkhoffs JL, Van Meurs AH, et al. N-acetylcysteine in patients with sickle cell disease: a randomized controlled trial. Blood 2016;128(22):123. [CFGD REGISTER: SC310a] [Google Scholar]
- Sins JW, Fu X, Fijnvandraat K, Dominguez M, Rijneveld AW, Kerkhoffs JL, et al. Effect of N-acetylcysteine on pain in daily life in patients with sickle cell disease: a randomised clinical trial. Blood 2017;130:2244. [DOI] [PubMed] [Google Scholar]
- Sins JW, Fu X, Fijnvandraat K, Dominguez M, Rijneveld AW, Kerkhoffs JL, et al. Effect of N-acetylcysteine on pain in daily life in patients with sickle cell disease: a randomised clinical trial. British Journal of Haematology 2018;182(3):444-8. [CFGD REGISTER: SC310b] [DOI] [PubMed] [Google Scholar]
- Sins JW, Fu X, Fijnvandraat K, Dominguez M, Rijneveld AW, Kerkhoffs JL, et al. Effects of oral N-acetylcysteine on oxidative stress in patients with sickle cell disease. Blood 2017;130(Suppl 1):2244. [CFGD REGISTER: SC310c] [Google Scholar]
Styles 2007 {published data only}
- Fabry ME, Romero JR, Rivera A, Styles L, Kesler K, Reiss UM, et al. Characterization of hyperdense cells in a pediatric cohort of sickle cell disease patients-results of the CSCC multi-institution study of arginine supplementation. In: 35th Anniversary Convention of the National Sickle Cell Disease Program; 2007 Sep 17-22; Washington DC, USA. 2007:280. [CFGD REGISTER: SC203b]
- Styles L, Kuypers F, Kesler K, Reiss U, Lebeau P, Nagel R, et al. Arginine therapy does not benefit children with sickle cell anemia - results of the CSCC clinical trial consortium multi-institutional study. Blood 2007;110(11):2252. [ABSTRACT NO.: 2252] [CFGD REGISTER: SC203a] [Google Scholar]
- Styles L, Kuypers F, Kesler K, Reiss U, Lebeau P, Nagel R, et al. Arginine therapy does not benefit children with sickle cell anemia- results of the cscc multi-center. In: 35th Anniversary Convention of the National Sickle Cell Disease Program; 2007 Sep 17-22; Washington DC, USA. Washington DC, USA, 2007:194. [CFGD REGISTER: SC203c]
Tomer 2001 {published data only}
- Tomer A, Harker LA, Kasey S, Eckman JR. Dietary n-3 fatty acid treatment reduces the frequency of pain episodes and the prothrombic state in sickle cell disease. Blood 1997;90(10 Suppl 1 (Pt 1 of 2)):445a. [CFGD REGISTER: SC101a] [Google Scholar]
- Tomer A, Harker LA, Kasey S, Eckman JR. Reduced predisposition to thrombosis in sickle cell disease (SCD) patients treated with dietary n-3 fatty acids (n-3FA). Blood 1995;86(10 Suppl 1):299a. [CFGD REGISTER: SC101b] [Google Scholar]
- Tomer A, Kasey S, Connor WE, Clark S, Harker LA, Eckman JR. Reduction of pain episodes and prothrombotic activity in sickle cell disease by dietary n-3 fatty acids. Thrombosis and Haemostasis 2001;85(6):966-74. [CFGD REGISTER: SC101c] [PubMed] [Google Scholar]
References to studies excluded from this review
Ajayi 1993 {published data only}
- Ajayi OA, George BO, Ipadeola T. Clinical trial of riboflavin in sickle cell disease. East African Medical Journal 1993;70(7):418-21. [PubMed] [Google Scholar]
Eberhardt 2002 {published data only}
- Eberhardt RT, McMahon L, Steinberg MH, Perrine SP, Denson C, Vita JA. Effect of vitamin C and L-arginine on vascular function in sickle cell disease. In: National Sickle Cell Disease Program 30th Annual Meeting Conference Proceedings; 2002 Sept 17-21. 2002:199. [CENTRAL: CN-00404030] [CFGD REGISTER: SC144]
Elias 2013 {published data only}
- Elias DB, Barbosa MC, Rocha LB, Dutra LL, Silva HF, Martins AM, et al. L-arginine as an adjuvant drug in the treatment of sickle cell anaemia. British Journal of Haematology 2013;160(3):410-2. [DOI] [PubMed] [Google Scholar]
Ghahramanlu 2014 {published data only}
- Ghahramanlu E, Banihashem A, Mirhossini NZ, Hosseini G, Mostafavi-Toroghi H, Tavallaie S, et al. Effect of zinc supplementation on serum antibody titers to heat shock protein 27 in patients with thalassemia major. Hematology 2014;19(2):113-9. [CENTRAL: CN-00985356] [CFGD REGISTER: TH132a] [EMBASE: 2014179647] [PMID: ] [DOI] [PubMed] [Google Scholar]
Gordeuk 2018 {published data only}
- Gordeuk NY, Gordeuk VR. Consistent compliance with hydroxyurea and hematology measures during L-glutamine therapy for sickle cell anemia. Blood 2018;132:3657. [Google Scholar]
Guddati 2018 {published data only}
- Guddati AK, Kota V. A phase 3 trial of l-glutamine in sickle cell disease. New England Journal of Medicine 2018;379(19):1879. [DOI: 10.1056/NEJMc1811050] [DOI] [PubMed] [Google Scholar]
Jaja 2002 {published data only}
- Jaja SI, Ikotun AR, Gbenebitse S, Temiye EO. Blood pressure, hematologic and erythrocytefragility changes in children suffering from sicklecell anemia following ascorbic acid supplementation. Journal of Tropical Pediatrics 2002;48:366–70. [DOI] [PubMed] [Google Scholar]
Marealle 2018 {published data only}
- Marealle AI, Siervo M, Wassel S, Bluck L, Prentice AM, Minzi O, et al. A pilot study of a non-invasive oral nitrate stable isotopic method suggests that arginine and citrulline supplementation increases whole-body NO production in Tanzanian children with sickle cell disease. Nitric Oxide 2018;74:19-22. [DOI] [PMC free article] [PubMed] [Google Scholar]
Mirhosseini 2011 {published data only}
- Mirhosseini NN, Ghayour-Mobarhan M, Shasar S, Mohdyusoff NA, Banihashem A, Kamarudin AN. The effect of zinc supplementation on growth and bone health in Iranian paediatric patients with transfusion-dependent beta thalassemia. Clinical Biochemistry 2011;44(13 Suppl 1):S18-9. [CENTRAL: CN-01020611] [CFGD REGISTER: TH132b] [EMBASE: 70595967]
NCT00131508 {published data only}
- NCT00131508. Trial of oral glutamine in patients with sickle cell anemia [A randomized controlled trial of oral glutamine supplementation versus a placebo supplement in children with sickle cell anemia]. clinicaltrials.gov/show/NCT00131508 (first received 18 August 2005).
Prasad 1999 {published data only}
- Prasad AS, Beck FW, Kaplan J, Chandrasekar PH, Ortega J, Fitzgerald JT, et al. Effect of zinc supplementation on incidence of infections and hospital admissions in sickle cell disease (SCD). American Journal of Hematology 1999;61(3):194-202. [DOI] [PubMed] [Google Scholar]
- Prasad AS, Beck FW, Kaplan J, Chandrasekar PH, Ortega J, Fitzgerald JT, et al. Effect of zinc supplementation on incidence of infections and hospital admissions in sickle cell disease (SCD). American Journal of Hematology 1999;61(3):194-202. [CENTRAL: CN-00165076] [CFGD REGISTER: SC96] [EMBASE: 1999225154] [PMID: ] [DOI] [PubMed] [Google Scholar]
Shiva 2018 {published data only}
- Shiva S, Brown LA, Wang Y, Dampier C, Watt A, Tripathi V, et al. Parenteral L-arginine improves mitochondrial function in children with sickle cell disease admitted for vaso-occlusive pain episodes. Blood 2018;132(Suppl 1):508. [Google Scholar]
Tschumi 1981 {published data only}
- Tschumi P, Floersheim GL. Tolerance of large doses of oral zinc sulfate [Zur Vertraglichkeit von hochdosiertem peroralem Zinksulfat]. Schweizerische Medizinische Wochenschrift 1981;111(42):1573-7. [CENTRAL: CN-00026642] [CFGD REGISTER: SC87] [PMID: ] [PubMed] [Google Scholar]
References to studies awaiting assessment
Abdelhalim 2022 {published data only}
- Abdelhalim SM, Murphy JE, Meabed MH, Elberry AA, Gamaleldin MM, Shaalan MS. Comparative effectiveness of adding omega-3 or vitamin D to standard therapy in preventing and treating episodes of painful crisis in pediatric sickle cell patients. European Review for Medical and Pharmacological Sciences 2022;26(14):5043-52. [DOI: 10.26355/eurrev_202207_29290] [DOI] [PubMed] [Google Scholar]
Akinkugbe 1983 {published data only}
- Akinkugbe FM, Ette SI. Ascorbic acid in sickle cell disease: results of a pilot therapeutic trial. East African Medical Journal 1983;60(10):683-7. [PMID: ] [PubMed] [Google Scholar]
Brewer 1977 {published data only}
- Brewer GJ, Schoomaker EB, Leichtman DA, Kruckeberg WC, Brewer LF, Meyers N. The use of pharmacological doses of zinc in the treatment of sickle cell anemia. Progress in Clinical and Biological Research 1977;14:241-58. [PMID: ] [PubMed] [Google Scholar]
Friedrisch 2016 {published data only}
- Friedrisch JR, Bittar CM, Bittar CM, Meirelles MC, Daudt LE, Paz AA, et al. L-arginine supplementation decreases hemolysis and pulmonary arterial hypertension in sickle cell disease patients: a randomized, double-blinded, placebo-controlled trial. Haematologica 2016;101 Suppl 1:618-9. [Google Scholar]
Gupta 1987a {published data only}
- Gupta VL, Choubey BS. RBC survival, zinc deficiency, and efficacy of zinc therapy in sickle cell disease. Birth Defects Original Article Series 1987;23(5A):477-83. [PMID: ] [PubMed] [Google Scholar]
Gupta 1987b {published data only}
- Gupta VL, Chaubey BS. Efficacy of oral zinc therapy in the management of sickle cell crises. Indian Journal of Medical Research 1987;86:803-7. [PMID: ] [PubMed] [Google Scholar]
Koh 2005 {published data only}
- Koh H, Sungar M, Macan H, Johnson C, Tanaka K, Niihara Y. Prospective randomized crossover double-blind trial of L-glutamine for the therapy of sickle cell disease. In: National Sickle Cell Disease Program 28 Annual Meeting; 2005 April 9-13; Cincinnati, Ohio. 2005:146.
Namazzi 2023 {published data only}
- Namazzi R, Opoka R, Conroy AL, Datta D, Tagoola A, Bond C. Zinc for infection prevention in children with sickle cell anemia: a randomized double-blind placebo-controlled trial. Blood Advances 2023;7(13):3023-31. [DOI: 10.1182/bloodadvances.2022008539] [DOI] [PMC free article] [PubMed] [Google Scholar]
NCT00513617 {published data only}
- NCT00513617. Effectiveness of arginine as a treatment for sickle cell anemia (Arginine) [Arginine supplementation in sickle cell anemia: physiological and prophylactic effects]. clinicaltrials.gov/study/NCT00513617 (first received 8 August 2007).
NCT00586209 {published data only}
- NCT00586209. L-glutamine therapy for sickle cell anemia [A phase II, prospective, randomized, double-blind, placebo-controlled, parallel-group, study of L glutamine therapy for sickle cell anemia and sickle ß0-thalassemia]. clinicaltrials.gov/study/NCT00586209 (first received 4 January 2008).
NCT01054768 {unpublished data only}
- NCT01054768. Antioxidant therapy to reduce inflammation in sickle cell disease. clinicaltrials.gov/ct2/show/NCT01054768 (first received 22 January 2010). [CLINICALTRIALS.GOV ID: NCT01054768]
NCT01849016 {published data only}
- NCT01849016. N-acetylcysteine in patients with sickle cell disease [N-acetylcysteine in patients with sickle cell disease - reducing the incidence of daily life pain]. clinicaltrials.gov/show/NCT01849016 (first received 8 May 2013).
NCT03293641 {published data only}
- NCT03293641. Zinc supplementation in children with sickle cell disease in Western Kenya [The effects of zinc supplementation in children with sickle cell disease in Western Kenya: a pilot study]. clinicaltrials.gov/ct2/show/NCT03293641 (first received 26 September 2017).
NCT04684381 {published data only}
- NCT04684381. Pharmacokinetics and safety of endari (L-glutamine) in sickle cell disease patients [A phase 4, open-label, single-center study to assess pharmacokinetic characteristics and safety of endari in patients with sickle cell disease]. clinicalTrials.gov/show/NCT04684381 (first received 24 December 2020). [CLINICALTRIALS.GOV ID: NCT04684381]
NCT05371184 {published data only}
- NCT05371184. Glutamine role in preventing vaso-occlusive crisis among SCD patients (Glu_SCD_Egy) [Safety and efficacy of glutamine in preventing vaso-occlusive crisis among sickle cell disease patients: randomized controlled study]. clinicaltrials.gov/show/NCT05371184 (first received 12 May 2022). [CENTRAL: 24086516] [CLINICALTRIALS.GOV ID: NCT05371184]
References to ongoing studies
Datta 2019 {published data only}
- Datta D, Namazzi R, Conroy AL, Cusick SE, Hume HA, Tagoola A, et al. Zinc for infection prevention in sickle cell anemia (zips): study protocol for a randomized placebo-controlled trial in ugandan children with sickle cell anemia. Trials 2019;20(1):460. [DOI: 10.1186/s13063-019-3569-z] [DOI] [PMC free article] [PubMed] [Google Scholar]
- NCT03528434. Zinc for infection prevention in sickle cell anemia (ZIPS) (ZIPS) [For infection prevention in sickle cell anemia (ZIPS)]. clinicaltrials.gov/study/NCT03528434 (first received 17 May 2018).
EUCTR 2006‐005889‐40 {published data only}
- EUCTR 2006-005889-40. N-acetylcystein for sickle cell disease [N-Acetylcysteine for treatment of sickle cell disease]. www.clinicaltrialsregister.eu/ctr-search/trial/2006-005889-40/NL (first received 2 November 2006).
IRCT20210715051904N1 {published data only}
- IRCT20210715051904N1. The effect of combination therapy of L-glutamine and hydroxyurea in patients with sickle cell anemia [Efficacy of combination therapy of L-glutamine and hydroxyurea in comparison with hydroxyurea alone in patients with sickle cell anemia: a randomized, double-blinded clinical trial]. trialsearch.who.int/Trial2.aspx?TrialID=IRCT20210715051904N1 (first received 19 February 2022). [IRANIAN REGISTER OF CLINICAL TRIALS ID: IRCT20210715051904N1]
NCT01202812 {published and unpublished data}
- NCT01202812. Randomized trial of LOVAZA in pediatric sickle cell disease (SCD) [Phase ii randomized double-blind placebo-controlled trial of the omega-3 fatty acids eicosapentaenoic (EPA) and docosahexaenoic acid (DHA) in pediatric sickle cell disease (SCD)]. clinicaltrials.gov/show/NCT01202812 (first received 16 September 2010).
NCT01891292 {published data only}
- NCT01891292. Efficacy of antioxidant therapy compared with enalapril in sickle nephropathy [A phase 2 study of the efficacy of antioxidant therapy compared with enalapril in slowing the progression of sickle nephropathy in children]. clinicaltrials.gov/show/NCT01891292 (first received 3 July 2013).
NCT02525107 {published data only}
- NCT02525107. Prevention of vaso-occlusive painful crisis by using omega-3 fatty acid supplements (OM3FA) [Omega 3 fatty acid therapy for prevention of vaso-occlusive crisis and manifestations in Omani patients with sickle cell disease]. clinicaltrials.gov/show/nct02525107 (first received 17 August 2015).
NCT04011345 {published data only}
- NCT04011345. Folic acid supplementation in children with sickle cell disease [Folic acid supplementation in children with sickle-cell disease: a randomized double-blind cross-over trial]. clinicaltrials.gov/study/NCT04011345 (first received 8 July 2019).
NCT04301336 {published data only}
- NCT04301336. Different treatment modalities in the management of the painful crisis in pediatric sickle-cell anemia [Comparative effectiveness of the different treatment modalities for management of vaso-occlusive painful crisis in pediatric sickle cell disease]. clinicaltrials.gov/ct2/show/NCT04301336 (first received 10 March 2020).
NCT04839354 {published and unpublished data}
- NCT04839354. Sickle cell disease treatment with arginine therapy (STArT) trial (STArT). clinicaltrials.gov/ct2/show/NCT04839354 (first received 9 April 2021).
NTR3806 {published data only}
- NTR3806. NAC trial [N-Acetylcysteine in patients with sickle cell disease]. www.onderzoekmetmensen.nl/en/trial/28196 (first received 22 January 2013). [DUTCH TRIAL REGISTER ID: NTR3806]
RBR‐10r7d6f3 {published data only}RBR‐10r7d6f3
- RBR-10r7d6f3. Omega-3 and vitamin D supplementation in adults with sickle cell anemia. ensaiosclinicos.gov.br/rg/RBR-10r7d6f3 (first received 20 July 2021).
Williams 2020 {published data only}
- NCT04011345. Folic acid supplementation in children with sickle cell disease [Folic acid supplementation in children with sickle-cell disease: a randomized double-blind cross-over trial]. clinicaltrials.gov/show/NCT04011345 (first received 8 July 2019).
- Williams BA, McCartney H, Adams E, Devlin AM, Singer J, Vercauteren S, et al. Folic acid supplementation in children with sickle cell disease: study protocol for a double-blind randomized cross-over trial. Trials 2020;21(1):593. [DOI: 10.1186/s13063-020-04540-7] [DOI] [PMC free article] [PubMed] [Google Scholar]
Additional references
Abdel‐Hadi 2023
- Abdel-Hadi L, Ventura CY, Castillo-Aleman YM, Sheikh S, Zakaria A, Phillips J. Treatment of sickle cell disease - options and perspective. American Journal of Blood Research 2023;13(2):61-70. [PMC free article] [PubMed] [Google Scholar]
Amiri 2022
- Amiri P, Arefhosseini S, Bakhshimoghaddam F, Jamshidi GH, Hosseini SA. Mechanistic insights into the pleiotropic effects of butyrate as a potential therapeutic agent on NAFLD management: a systematic review. Frontiers in Nutrition 2022;9:1037696. [DOI: 10.3389/fnut.2022.1037696] [DOI] [PMC free article] [PubMed] [Google Scholar]
Antwi‐Boasiako 2019
- Antwi-Boasiako C, Dankwah GB, Aryee R, Hayfron-Benjamin C, Donkor ES, Campbell AD. Oxidative profile of patients with sickle cell disease. Medical Sciences 2019;7(2):17. [DOI] [PMC free article] [PubMed] [Google Scholar]
Aslan 2000
- Aslan M, Thornley-Brown D, Freeman BA. Reactive species in sickle cell disease. Annals of the New York Academy of Sciences 2006;899(1):375-91. [DOI] [PubMed] [Google Scholar]
Ballas 2012
- Ballas SK, Gupta K, Adams-Graves P. Sickle cell pain: a critical reappraisal. Blood 2012;120(18):3647-56. [DOI] [PubMed] [Google Scholar]
Belini 2012
- Belini Junior E, da Silva DG, Torres Lde S, Almeida EA, Cancado RD, Chiattone C, et al. Oxidative stress and antioxidant capacity in sickle cell anaemia patients receiving different treatments and medications for different periods of time. Annals of Hematology 2012;91(4):479-89. [DOI] [PubMed] [Google Scholar]
Biswas 2016
- Biswas SK. Does the interdependence between oxidative stress and inflammation explain the antioxidant paradox? Oxidative Medicine and Cellular Longevity 2016;2016. [DOI] [PMC free article] [PubMed]
Brandow 2017
- Brandow AM, Zappia KJ, Stucky CL. Sickle cell disease: a natural model of acute and chronic pain. Pain 2017;158 Suppl 1:S79-84. [DOI] [PMC free article] [PubMed] [Google Scholar]
Brewer 2011
- Brewer MS. Natural antioxidants: sources, compounds, mechanisms of action, and potential applications. Comprehensive Reviews in Food Science and Food Safety 2011;10(4):221-47. [Google Scholar]
Chies 2001
- Chies JA, Nardi NB. Sickle cell disease: a chronic inflammatory condition. Medical Hypotheses 2001;57(1):46-50. [DOI] [PubMed] [Google Scholar]
Chirico 2012
- Chirico EN, Pialoux V. Role of oxidative stress in the pathogenesis of sickle cell disease. IUBMB Life 2012;64(1):72-80. [DOI] [PubMed] [Google Scholar]
Cieri‐Hutcherson 2019
- Cieri-Hutcherson NE, Hutcherson TC, Conway-Habes EE, Burns BN, White NA. Systematic review of L-glutamine for prevention of vaso-occlusive pain crisis in patients with sickle cell disease. Pharmacotherapy 2019;39(11):1095-1104. [DOI: 10.1002/phar.2329] [DOI] [PubMed] [Google Scholar]
Conran 2018
- Conran N, Belcher JD. Inflammation in sickle cell disease. Clinical Hemorheology and Microcirculation 2018;68(2-3):263-99. [DOI] [PMC free article] [PubMed] [Google Scholar]
Covidence 2019 [Computer program]
- Covidence. Melbourne, Australia: Veritas Health Innovation, accessed 29 July 2019. Available at covidence.org.
Deeks 2022
- Deeks JJ, Higgins JP, Altman, DG editor(s). Chapter 10: Analysing data and undertaking meta-analyses. In: Higgins JP, Thomas J, Chandler J, Cumpston M, Li T, Page MJ, Welch VA, editor(s). Cochrane Handbook for Systematic Reviews of Interventions version 6.3 (updated February 2022). Cochrane, 2022. Available from www.training.cochrane.org/handbook.
Dekker 2012
- Dekker LH, Fijnvandraat K, Brabin BJ, Van Hensbroek MB. Micronutrients and sickle cell disease, effects on growth, infection and vaso-occlusive crisis: a systematic review [Micronutrients and sickle cell disease, effects on growth, infection and vaso-occlusive crisis]. Pediatric Blood & Cancer 2012;59(2):211-5. [DOI: 10.1002/pbc.24163] [DOI] [PubMed] [Google Scholar]
Delesderrier 2020
- Delesderrier E, Curioni C, Omena J, Macedo CR, Cople-Rodrigues C, Citelli M. Antioxidant nutrients and hemolysis in sickle cell disease. Clinica Chimica Acta; International Journal of Clinical Chemistry 2020;510:381-90. [DOI: 10.1016/j.cca.2020.07.020] [DOI] [PubMed] [Google Scholar]
Didier 2023
- Didier AJ, Stiene J, Fang L, Watkins D, Dworkin LD, Creeden JF. Antioxidant and Anti-Tumor Effects of Dietary Vitamins A, C, and E. Antioxidants 2023;12(3):632. [DOI: 10.3390/antiox12030632] [DOI] [PMC free article] [PubMed] [Google Scholar]
Fusco 2007
- Fusco D, Colloca G, Monaco MRL, Cesari M. Effects of antioxidant supplementation on the aging process. Clinical Intervntions in Ageing 2007;2(3):377-87. [PMC free article] [PubMed] [Google Scholar]
Ginter 2014
- Ginter E, Simko V, Panakova V. Antioxidants in health and disease. Bratislavske lekarske listy (Bratislava Medical Journal) 2014;115(10):603-6. [DOI: 10.4149/bll_2014_116] [DOI] [PubMed] [Google Scholar]
Gizi 2011
- Gizi A, Papassotiriou I, Apostolakou F, Lazaropoulou C, Papastamataki M, Kanavaki I, et al. Assessment of oxidative stress in patients with sickle cell disease: the glutathione system and the oxidant-antioxidant status. Blood Cells, Molecules, and Diseases 2011;46(3):220-5. [DOI] [PubMed] [Google Scholar]
Goodman 2004
- Goodman SR. The irreversibly sickled cell: a perspective. Cellular and Molecular Biology 2004;50(1):53-8. [PubMed] [Google Scholar]
GRADEpro GDT 2015 [Computer program]
- GRADEpro GDT. Version accessed 14 January 2019. Hamilton (ON): McMaster University (developed by evidence Prime), 2015. Available at gradepro.org.
Grosse 2011
- Grosse SD, Odame I, Atrash HK, Amendah DD, Piel FB, Williams TN. Sickle cell disease in Africa: A neglected cause of early childhood mortality. American Journal of Preventive Medicine 2011;41(6 Suppl 4):S398. [DOI] [PMC free article] [PubMed] [Google Scholar]
Gyamfi 2021
- Gyamfi J, Ojo T, Epou S, Diawara A, Dike L, Adenikinju D, et al. Evidence-based interventions implemented in low-and middle-income countries for sickle cell disease management: a systematic review of randomized controlled trials. PLoS One 2021;16(2):e0246700. [DOI] [PMC free article] [PubMed] [Google Scholar]
Higgins 2003
- Higgins JP, Thompson SG, Deeks JJ, Altman DG. Measuring inconsistency in meta-analyses. British Medical Journal 2003;327(7414):557-60. [DOI] [PMC free article] [PubMed] [Google Scholar]
Higgins 2017
- Higgins JP, Altman DG, Sterne JA, editor(s). Chapter 8: Assessing risk of bias in included studies. In: Higgins JP, Churchill R, Chandler J, Cumpston MS, editor(s), Cochrane Handbook for Systematic Reviews of Interventions version 5.2.0 (updated June 2017). Cochrane, 2017. Available from www.training.cochrane.org/handbook/PDF/v5.2/.
Higgins 2022a
- Higgins JP, Thomas J, Chandler J, Cumpston M, Li T, Page MJ, Welch VA, editor(s). Cochrane Handbook for Systematic Reviews of Interventions Version 6.3 (updated February 2022). Cochrane, 2022. Available from training.cochrane.org/handbook.
Higgins 2022b
- Higgins JP, Li T, Deeks JJ, editor(s). Chapter 6: Choosing effect measures and computing estimates of effect. In: Higgins JP, Thomas J, Chandler J, Cumpston M, Li T, Page MJ, Welch VA, editor(s). Cochrane Handbook for Systematic Reviews of Interventions Version 6.3 (updated February 2022), Cochrane. Available from www.training.cochrane.org/handbook.
Higgins 2022c
- Higgins JP, Savović J, Page MJ, Elbers RG, Sterne JA. Chapter 8: Assessing risk of bias in a randomized trial. In: Higgins JPT, Thomas J, Chandler J, Cumpston M, Li T, Page MJ, Welch VA (editors). Cochrane Handbook for Systematic Reviews of Interventions version 6.3 (updated February 2022). Cochrane, 2022. Available from www.training.cochrane.org/handbook.
Higgins 2022d
- Higgins JP, Eldridge S, Li T, editor(s). Chapter 23: Including variants on randomized trials. In: Higgins JP, Thomas J, Chandler J, Cumpston M, Li T, Page MJ, Welch VA, editor(s). Cochrane Handbook for Systematic Reviews of Interventions version 6.3 (updated February 2022). Cochrane, 2022. Available from www.training.cochrane.org/handbook.
Horiuchi 1996
- Horiuchi K, Onyike AE, Osterhout ML. Sickling in vitro of reticulocytes from patients with sickle cell disease at venous oxygen tension. Experimental Hematology 1996;24(1):68-76. [PubMed] [Google Scholar]
Ilkhani 2016
- Ilkhani F, Hosseini B, Saedisomeolia A. Niacin and oxidative stress: a mini-review. Journal of Nutritional Medicine and Diet Care 2016;2(1):014. [Google Scholar]
Ingram 1958
- Ingram VM. Abnormal human haemoglobins. Biochimica et Biophysica Acta 1958;28:539-45. [DOI] [PubMed] [Google Scholar]
Johnson 2016
- Johnson CS. Sickle-Cell Disease. In: International Encyclopedia of Public Health. Elsevier Inc., 2016:506-12. [Google Scholar]
Joshi 2001
- Joshi R, Adhikari S, Patro BS, Chattopadhyay S, Mukherjee T. Free radical scavenging behavior of folic acid: evidence for possible antioxidant activity [Free radical scavenging behavior of folic acid]. Free Radical Biology & Medicine 2001;30(12):1390-1399. [DOI: 10.1016/s0891-5849(01)00543-3] [DOI] [PubMed] [Google Scholar]
Kurutas 2016
- Kurutas EB. The importance of antioxidants which play the role in cellular response against oxidative/nitrosative stress: current state. Nutrition Journal 2016;15:71. [DOI] [PMC free article] [PubMed] [Google Scholar]
Lefebvre 2022
- Lefebvre C, Glanville J, Briscoe S, Featherstone R, Littlewood A, Marshall C, et al. Chapter 4: Searching for and selecting studies. In: Higgins JP, Thomas J, Chandler J, Cumpston M, Li T, Page MJ, Welch VA, editor(s). Cochrane Handbook for Systematic Reviews of Interventions version 6.3 (updated February 2022). Cochrane, 2022. Available from www.training.cochrane.org/handbook.
Li 2017
- Li X, Dao M, Lykotrafitis G, Karniadakis GE. Biomechanics and biorheology of red blood cells in sickle cell anemia. Journal of Biomechanics 2017;50:34-41. [DOI] [PMC free article] [PubMed] [Google Scholar]
Li 2022
- Li T, Higgins JP, Deeks JJ, editor(s). Chapter 5: Collecting data. In: Higgins JP, Thomas J, Chandler J, Cumpston M, Li T, Page MJ, Welch VA, editor(s). Cochrane Handbook for Systematic Reviews of Interventions version 6.3 (updated February 2022). Cochrane, 2022. Available from www.training.cochrane.org/handbook.
Liang 2018
- Liang M, Wang Z, Li H, Cai L, Pan J, He H, et al. l-Arginine induces antioxidant response to prevent oxidative stress via stimulation of glutathione synthesis and activation of Nrf2 pathway. Food and Chemical Toxicology 2018;115:315-28. [DOI: ] [DOI] [PubMed] [Google Scholar]
Macharia 2018
- Macharia AW, Mochamah G, Uyoga S, Ndila CM, Nyutu G, Makale J, et al. The clinical epidemiology of sickle cell anemia In Africa. American Journal of Hematology 2018;93(3):363-70. [DOI] [PMC free article] [PubMed] [Google Scholar]
Marreiro 2017
- Marreiro DD, Cruz KJ, Morais JB, Beserra JB, Severo JS, Oliveira AR. Zinc and oxidative stress: current mechanisms. Antioxidants 2017;6(2):24. [DOI] [PMC free article] [PubMed] [Google Scholar]
Masella 2005
- Masella R, Di Benedetto R, Varì R, Filesi C, Giovannini C. Novel mechanisms of natural antioxidant compounds in biological systems: involvement of glutathione and glutathione-related enzymes. Journal of Nutritional Biochemistry 2005;16(10):577-86. [DOI] [PubMed] [Google Scholar]
Meital 2019
- Meital LT, Windsor MT, Perissiou M, Schulze K, Magee R, Kuballa A, et al. Omega-3 fatty acids decrease oxidative stress and inflammation in macrophages from patients with small abdominal aortic aneurysm. Scientific Reports 2019;9(1):12978. [DOI: 10.1038/s41598-019-49362-z] [DOI] [PMC free article] [PubMed] [Google Scholar]
Moher 2015
- Moher D, Shamseer L, Clarke M, Ghersi D, Liberati A, Petticrew M, et al. Preferred reporting items for systematic review and meta-analysis protocols (PRISMA-P) 2015 statement. Systematic Reviews 2015;4(1):1. [DOI: 10.1186/2046-4053-4-1] [DOI] [PMC free article] [PubMed] [Google Scholar]
Morris 2008
- Morris CR, Suh JH, Hagar W, Larkin S, Bland DA, Steinberg MH, et al. Erythrocyte glutamine depletion, altered redox environment, and pulmonary hypertension in sickle cell disease. Blood 2008;111(1):402-10. [DOI] [PMC free article] [PubMed] [Google Scholar]
Nawar 1996
- Nawar WW. Lipids. In: Fennema OR, editors(s). Food Chemistry. Marcel Dekker, Inc., New York, 1996:279-89. [Google Scholar]
Nur 2011
- Nur E, Biemond BJ, Otten HM, Brandjes DP, Schnog JJ, Group CS. Oxidative stress in sickle cell disease; pathophysiology and potential implications for disease management. American Journal Hematology 2011;86(6):484-9. [DOI] [PubMed] [Google Scholar]
Padilla 1973
- Padilla F, Bromberg PA, Jensen WN. The sickle-unsickle cycle: a cause of cell fragmentation leading to permanently deformed cells. Blood 1973;41(5):653-60. [DOI: 10.1182/blood.V41.5.653.653] [DOI] [PubMed] [Google Scholar]
Page 2022
- Page MJ, Higgins JP, Sterne JA. Chapter 13: Assessing risk of bias due to missing results in a synthesis. In: Higgins JP, Thomas J, Chandler J, Cumpston M, Li T, Page MJ, Welch VA, editor(s). Cochrane Handbook for Systematic Reviews of Interventions version 6.3 (updated February 2022). Cochrane, 2022. Available from www.training.cochrane.org/handbook.
Pall 2015
- Pall ML, Levine S. Nrf2, a master regulator of detoxification and also antioxidant. Acta Physiologica Sinica 2015;67(1):1-18. [PubMed] [Google Scholar]
Pauling 1949
- Pauling L, Itano HA, Singer SJ, Wells IC. Sickle cell anemia, a molecular disease. Science 1949;110(2865):548-53. [DOI] [PubMed] [Google Scholar]
Piel 2010
- Piel FB, Patil AP, Howes RE, Nyangiri OA, Gething PW, Williams TN, et al. Global distribution of the sickle cell gene and geographical confirmation of the malaria hypothesis. Nature Communications 2010;1(8):104. [DOI] [PMC free article] [PubMed] [Google Scholar]
Piel 2013
- Piel FB, Hay SI, Gupta S, Weatherall DJ, Williams TN. Global burden of sickle cell anaemia in children under five, 2010–2050: modelling based on demographics, excess mortality, and interventions. PLoS medicine 2013;7(10):e1001484. [DOI: 10.1371/journal.pmed.1001484] [DOI] [PMC free article] [PubMed] [Google Scholar]
Powell 2000
- Powell SR. The antioxidant properties of zinc. Journal of Nutrition 2000;130(5):1447S-54S. [DOI] [PubMed] [Google Scholar]
Review Manager 5 [Computer program]
- Review Manager 5 (RevMan 5). Version 5.4. Copenhagen: The Cochrane Collaboration, 2020.
RevMan 2023 [Computer program]
- Review Manager (RevMan). Version 4.24. The Cochrane Collaboration, 2023. Available at revman.cochrane.org.
Schünemann 2022a
- Schünemann HJ, Higgins JP, Vist GE, Glasziou P, Akl EA, Skoetz N, et al. Chapter 14: Completing ‘Summary of findings’ tables and grading the certainty of the evidence. In: Higgins JP, Thomas J, Chandler J, Cumpston M, Li T, Page MJ, Welch VA, editor(s). Cochrane Handbook for Systematic Reviews of Interventions version 6.3 (updated February 2022). Cochrane, 2022. Available from www.training.cochrane.org/handbook.
Schünemann 2022b
- Schünemann HJ, Vist GE, Higgins JP, Santesso N, Deeks JJ, Glasziou P, et al. Chapter 15: Interpreting results and drawing conclusions. In: Higgins JP, Thomas J, Chandler J, Cumpston M, Li T, Page MJ, Welch VA, editor(s). Cochrane Handbook for Systematic Reviews of Interventions version 6.3 (updated February 2022). Cochrane, 2022. Available from www.training.cochrane.org/handbook.
Sherman 1978
- Sherman PR, Anita S. Irreversibly sickled cells and red cell survival in sickle cell anemia: a study with both DF32P and 51CR. American Journal of Medicine 1978;64(2):253-8. [DOI] [PubMed] [Google Scholar]
Silva 2013
- Silva DG, Belini Junior E, Almeida EA, Bonini-Domingos CR. Oxidative stress in sickle cell disease: An overview of erythrocyte redox metabolism and current antioxidant therapeutic strategies. Free Radical Biology and Medicine 2013;65:1101-9. [DOI] [PubMed] [Google Scholar]
Sins 2017
- Sins JW, Mager DJ, Davis SC, Biemond BJ, Fijnvandraat K. Pharmacotherapeutical strategies in the prevention of acute, vaso-occlusive pain in sickle cell disease: a systematic review. Blood Advances 2017;1(19):1598-1616. [DOI: 10.1182/bloodadvances.2017007211] [DOI] [PMC free article] [PubMed] [Google Scholar]
Soe 2020
- Soe HH, Abas ABL, Than NN, Ni H, Singh J, Said AR, Osunkwo I. Vitamin D supplementation for sickle cell disease. Cochrane Database of Systematic Reviews 2020, Issue 5. Art. No: CD010858. [DOI: 10.1002/14651858.CD010858.pub3] [DOI] [PMC free article] [PubMed] [Google Scholar]
Sundd 2018
- Sundd P, Gladwin MT, Novelli EM. Pathophysiology of sickle cell disease. Annual Review of Pathology 2018;14(Oct):261-90. [DOI] [PMC free article] [PubMed] [Google Scholar]
Swe 2013
- Swe KM, Abas AB, Bhardwaj A, Barua A, Nair NS. Zinc supplements for treating thalassaemia and sickle cell disease. Cochrane Database of Systematic Reviews 2013, Issue 6. Art. No: CD009415. [DOI: 10.1002/14651858.CD009415.pub2] [DOI] [PMC free article] [PubMed] [Google Scholar]
Thyagarajan 2018
- Thyagarajan A, Sahu RP. Potential contributions of antioxidants to cancer therapy:immunomodulation and radiosensitization. Integrative Cancer Therapies 2018;17(2):210-6. [DOI] [PMC free article] [PubMed] [Google Scholar]
Vona 2021
- Vona R, Sposi NM, Mattia L, Gambardella L, Straface E, Pietraforte D. Sickle cell disease: role of oxidative stress and antioxidant therapy. Antioxidants 2021;10(2):296. [DOI: 10.3390/antiox10020296] [DOI] [PMC free article] [PubMed] [Google Scholar]
Wang 2021
- Wang Q, Zennadi R. The role of RBC oxidative stress in sickle cell disease: from the molecular basis to pathologic implications. Antioxidants 2021;10(10):1608. [DOI: 10.3390/antiox10101608] [DOI] [PMC free article] [PubMed] [Google Scholar]
Ware 2017
- Ware RE, Montalembert M, Tshilolo L, Abboud MR. Sickle cell disease. Lancet 2017;390:311-23. [DOI] [PubMed] [Google Scholar]
WHO 2010
- World Health Organization (WHO). Sickle-Cell Disease: a strategy for the WHO African Region. Report of the Regional Director. apps.who.int/iris/handle/10665/1682 (accessed 28 February 2020).
References to other published versions of this review
Bolarinwa 2020
- Bolarinwa AB, Oduwole O, Okebe J, Ogbenna AA, Otokiti OE, Olatinwo AT. Antioxidant supplementation for sickle cell disease. Cochrane Database of Systematic Reviews 2020, Issue 4. Art. No: CD013590. [DOI: 10.1002/14651858.CD013590] [DOI] [PMC free article] [PubMed] [Google Scholar]