Abstract
Purpose
This study aimed to investigate the glycometabolism, fat mass, and lean mass in primary aldosteronism (PA) during disease progression.
Patients and Methods
Patients diagnosed with PA and healthy controls (HCs) were enrolled. A flash glucose monitoring system (FGMS) and dual-energy X-ray absorptiometry (DEXA) were used to measure glucose variability and glucose target rate along with fat mass and lean mass. Comparative analysis of FGMS- or DEXA-derived parameters along with correlation analyses between these parameters and PA progression were performed.
Results
Increased glucose variability and poor glucose target rate, along with an increased proportion of truncal fat mass, and decreased proportion of appendicular lean mass, were identified in PA group compared to those in HCs. Plasma aldosterone concentration was positively correlated with glucose variability and poor glucose target rate. Plasma renin concentration was positively correlated with the proportion of truncal fat mass and lean mass, and negatively correlated with the proportion of appendicular fat mass. Aldosterone-to-renin ratio was negatively correlated with the proportion of truncal fat mass and lean mass, and positively correlated with the proportion of appendicular fat mass.
Conclusion
Patients with PA presented significant differences in glycometabolism, fat mass, and lean mass compared with HCs, and these alterations correlated with PA progression.
Keywords: glucose variability, fat mass, lean mass, aldosterone, renin, ARR, correlation analysis
Introduction
Clinical and experimental models have conclusively documented the central and indispensable role of the renin-angiotensin-aldosterone system (RAAS) in maintaining homeostasis of intravascular volume and electrolytes. In the recent few years, there has been a growing awareness of the exponentially increasing occurrence of renin-dependent or renin-independent aldosteronism, wherein primary aldosteronism (PA) is one of the most investigated targets of researchers. Autonomous aldosterone secretion is the core feature of PA, accompanied by suppressed secretion of renin and angiotensin.1 Patients with PA are typically associated with hypertension, hypokalaemia, and metabolic alkalosis, followed by an increased risk of cardiovascular disease (CVD), atrial fibrillation, and mortality. Owing to the higher occurrence of cardiovascular events in patients with PA than in those with essential hypertension, there is now a growing emphasis on the pathogenesis underlying the development of CVD.2,3
A significant body of evidence gathered from studies indicates the extensive prevalence of impaired glycometabolism, obesity, and muscle loss in patients with PA,4–6 all of which are widely accepted risk factors involved in the pathogenesis of CVD.7 Several groups have also reported that aldosterone levels are correlated with plasma glucose levels, islets β-cell function, and visceral fat mass.8,9 Further studies followed, showing a correlation between renin or aldosterone-to-renin ratio (ARR) and diabetes prevalence, glucose metabolism indices, or visceral fat mass.10,11
Collectively, the relationship between PA and distribution of body fat mass (FM), lean mass (LM) is relatively unexplored area. There is growing support for the notion that regional FM and LM are related to distinct effects on metabolic syndrome and CVD.12–14 Whether PA patients with poor body FM or LM distribution contribute to the increasing prevalence of cardiovascular events is an open question, actively being pursued. In addition, glucose variability (GV) and glucose target rate are in spotlight as emerging risk factors for cardiovascular events, pioneered by the breakthroughs in continuous glucose monitoring in recent years.15,16
In this study, a flash glucose monitoring system (FGMS) was used to record continuous glucose values during the day, providing information on GV and glucose target rate, and dual-energy X-ray absorptiometry (DEXA) was used to measure regional FM and LM. The objective of the current study included two aspects: comparing parameters derived from FGMS and DEXA between PA group and age-, sex-, and body mass index (BMI)-matched healthy controls (HCs); investigating whether these parameters derived from FGMS and DEXA are related to aldosterone, renin, and ARR in PA group.
Materials and Methods
This study was conducted at the First Hospital of the Shanxi Medical University between December, 2019 and February, 2023. The study protocol complied with the Declaration of Helsinki and was approved by the Ethics Committee at the First Hospital of Shanxi Medical University. Written informed consent was obtained from all participants before their enrollment in this study. The workflow of this study is shown in Supplementary Figure 1.
Subjects
Patients diagnosed with PA were enrolled in this study. PA was diagnosed according to the following criteria:17 increased plasma aldosterone concentration (PAC, >150 pg/mL); suppressed plasma renin concentration (PRC, <4 ng/mL/h); ARR>40; hypokalaemia (<3.5 mmol/L), hypertension (>130/80 mmHg), and adrenal adenoma identified on adrenal computed tomography, as demonstrated by the postoperative pathological report. Confirmatory test was performed in suspected PA. Those who were administered medications influencing glucose metabolism (such as glucocorticoids and growth hormone) and diagnosed with other diseases influencing glucose metabolism (such as hyperthyroidism and nonalcoholic fatty liver) were excluded out.
In addition, age-, sex-, and BMI-matched HCs with no history of hypertension, diabetes, obesity, and electrolyte disturbance, were recruited. Information regarding age, sex, BMI, disease duration, and blood pressure was collected. Conventional clinical and anthropometric parameters, including waist circumference (WC), hip circumference (HC), waist-to-hip ratio (WHR), glycosylated haemoglobin (HbA1c), fasting blood glucose (FBG), fasting insulin (FINS), and parameters of islet β-cell function and insulin resistance were collected and compared between PA group and HCs.
FGMS
FGMS (FreeStyle Libre, Abbott Diabetes Care, Oxfordshire, United Kingdom) was applied to record continuous glucose values every 15 minutes during the day. Participants in PA and HC groups were instructed to scan a real-time glucose value at least every eight hours during monitoring to avoid imperfect data recording. During monitoring, all subjects maintained similar intake and physical activities.
The FGMS was used to record a 14-day continuous glucose profile. Due to accidental dropping of sensors or other unavoidable factors, such as participants requiring computed tomography, nuclear magnetic resonance imaging, or surgery, complete 14-day glucose monitoring data were not obtained. Finally, a total of 257-day and 153-day glucose monitoring data were obtained from PA group (three patients, 4 days; two patients, 5 days; six patients, 6 days; one patients, 7 days; four patients, 8 days; five patients, 9 days; two patients, 10 days; three patients, 11 days; three patients, 12 days; and two patients, 13 days) and HCs (five subjects, 7 days; one subject, 8 days; three subjects, 10 days; four subjects, 11 days; and three subjects, 12 days), respectively.
Based on FGMS recording data, parameters of GV and glucose target rate were calculated by referring to a previously published paper.18 The normal range of the sensor glucose was set as 3.9–7.8 mmol/L. GV parameters from general, within-day, and day-to-day levels were calculated: 24-hour mean glucose (24hMG) and glucose variable coefficient (CV) representing general GV, standard deviation of sensor glucose (SD) and mean amplitude of glucose excursion (MAGE) indicating within-day GV, along with mean of daily difference (MODD) and area of interquartile range (IQR) representing day-to-day GV. The following parameters representing glucose target rate were calculated: percentile time 1 (PT1, percentage of glucose value less than 3.9 mmol/L during the day), PT2 (percentage of glucose value within 3.9–7.8 mmol/L during the day), PT3 (percentage of glucose value greater than 7.8 mmol/L during the day), time in range (TIR, time of glucose value within range of 3.9–7.8 mmol/L during the day), and time out of range (TOR, time of glucose value less than 3.9 mmol/L or greater than 7.8 mmol/L).
DEXA
DEXA (Hologic device Discovery® QDR Series, Waltham, MA, USA) was used to measure FM and LM in different body parts. Specifically, FM and LM were measured in the limbs and trunk. Participants in PA and HCs groups were scanned early in the morning with an empty stomach. All participants were instructed to wear comfortable and light indoor clothes without metal components. All participants were evaluated by one technologist, who was blinded to patients with PA and HCs. The region of interest was automatically generated and adjusted by the technologist as necessary.
Based on DEXA data, certain parameters relevant to FM and LM distribution were calculated, including appendicular FM/LM, total FM/LM, appendicular FM percentage (FMP)/LMP, truncal FMP/LMP, truncal-to-appendicular FM ratio (FMR)/LM ratio (LMR), truncal-to-total FMR/LMR, appendicular-to-total FMR/LMR, percentage of body mass (PBF, total FM adjusted by body weight), fat mass index (FMI, total FM adjusted by square of height), lean mass index (LMI, total LM adjusted by square of height), and relative skeletal muscle index (RSMI, appendicular LM adjusted by square of height). The corresponding formulas were used to calculate these parameters (see the footnote in Supplementary Table 1).
Statistical Analysis
SPSS software for Windows (version 19.0; SPSS Inc., Chicago, IL, USA) and R software for Windows (version 4.2.3; R Foundation for Statistical Computing, Vienna, Austria) were used for data analysis and graph plotting. The indices derived from FGMS and DEXA were compared between PA group and HCs using the t–test (normally distributed data) or the Mann–Whitney U-test (skewed data); P < 0.050 was considered statistically significant. In PA group, the relationship between PAC, PRC, or ARR and parameters derived from FGMS or DEXA was analysed using Spearman correlation; r values within the range of zero to one represented positive correlation; r values within minus one to zero represented negative correlation; and P < 0.050 was considered a significant correlation. Data are indicated as mean ± standard error. Some data are denoted as median (first quartile, third quartile) owing to their wide distribution. The Spearman correlation data are shown as r (95% confidence interval).
Results
Thirty-one patients diagnosed with PA were included in PA group. Sixteen age-, sex-, and BMI-matched healthy volunteers were recruited as HCs. The endocrine assessment data of patients in PA group is shown in Table 1. Conventional clinical and anthropometric parameters, along with some FGMS and DEXA parameters, are listed in Table 1 and Supplementary Table 1. WC and HC were identified significant difference between PA group and HCs, while WHR, FBG, FINS, HbA1c and parameters representing islet β-cell function and insulin resistance were comparable between PA group and HCs.
Table 1.
Characteristics of PA Group and HCs
| Parameters | PA | HCs | Normal Range |
|---|---|---|---|
| Age (years old) | 49.7±11.8 | 51.6±8.8 | – |
| Sex (male, female) | 15, 16 | 7, 9 | – |
| BMI (kg/m2) | 25.9±6.1 | 23.4±2.5 | – |
| Blood pressure (mmHg) | 169.7±13.8/106.6±13.2 | 110.8±6.4/74.8±4.2 | – |
| Disease duration (days) | 2555 (912.5, 3650) | – | – |
| ACTH (pmol/L) | 6.0±2.6 | – | 1.6–13.9 |
| Cortisol at 8am (nmol/L) | 334.5±79.0 | – | 171–536 |
| Cortisol at 4pm (nmol/L) | 219.3±89.5 | – | 64–327 |
| Cortisol at 0am (nmol/L) | 92.0±55.9 | – | – |
| PRC upright (ng/mL/h) | 1.9 (0.3, 2.8) | – | 4–38 |
| PAC upright (pg/mL) | 274.1 (186.3, 467.3) | – | 40–310 |
| ARR upright | 220.5 (93.2, 589) | – | <40 |
| Plasma potassium (mmol/L) | 2.9±0.5 | – | 3.5–5.5 |
Abbreviations: PA, primary aldosteronism; HCs, normal controls; BMI, body mass index; ACTH, adrenocorticotropin; PRC, plasma renin concentration; PAC, plasma aldosterone concentration; ARR, aldosterone-to-renin ratio.
Comparison Analysis
FGMS Parameters
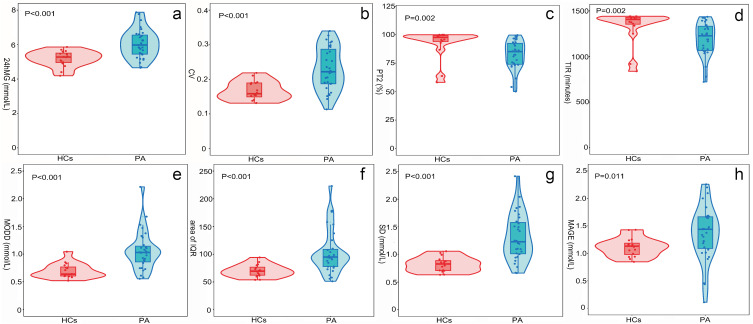
Comparison analysis identified significant differences in general GV, within-day GV, day-to-day GV, and glucose target rate. Specifically, increased GV levels were found in PA group than in HCs according to the reported significance in all the parameters of GV, including 24hMG, CV, SD, MAGE, MODD, and area of IQR (Figure 1). All the parameters of glucose target rate in PA group, except for PT1, were significantly different from those in HCs (Figure 1 and Supplementary Table 1), indicating poorer glucose target rate in PA group than that in HCs.
Figure 1.
Comparison of FGMS parameters between PA group and HCs. General GV: (a) 24hMG; (b) CV. Glucose target rate: (c) PT2; (d) TIR. Day-to-day GV: (e) MODD; (f) area of IQR. Within-day GV: (g) SD; (h) MAGE. P < 0.050 was considered a significant difference.
DEXA Parameters
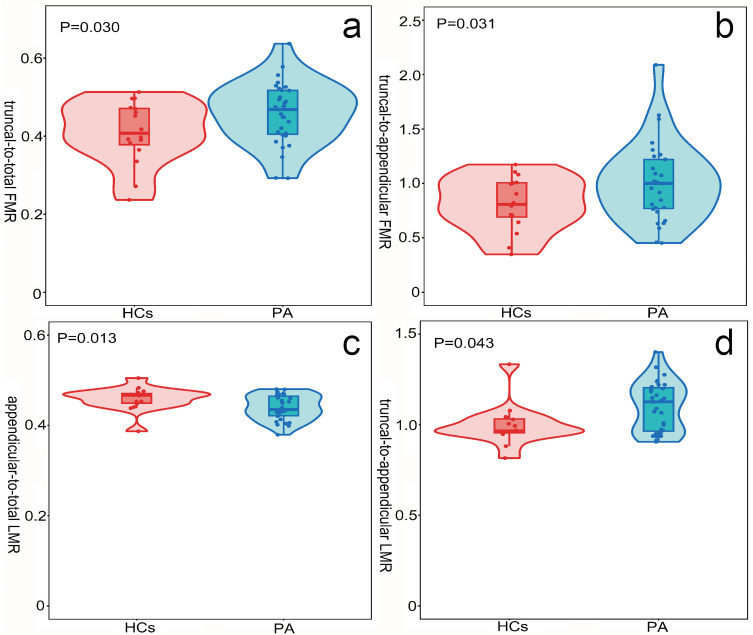
No significant differences were identified when comparing FM and LM in any of the measured body parts between PA group and HCs (Supplementary Table 1). With respect to body FM or LM distribution parameters, truncal-to-total FMR and truncal-to-appendicular FMR were significantly higher in PA group than that in HCs; appendicular-to-total LMR was significantly lower, while truncal-to-appendicular LMR was significantly higher in PA group compared with those in HCs (Figure 2); other parameters did not show significant differences between PA group and HCs (Supplementary Table 1).
Figure 2.
Comparison of DEXA parameters between PA group and HCs. (a) truncal-to-total FMR; (b) truncal-to-appendicular FMR; (c) appendicular-to-total LMR; (d) truncal-to-appendicular LMR. P < 0.050 was considered a significant difference.
Correlation Analysis
Plasma Aldosterone Concentration (PAC)
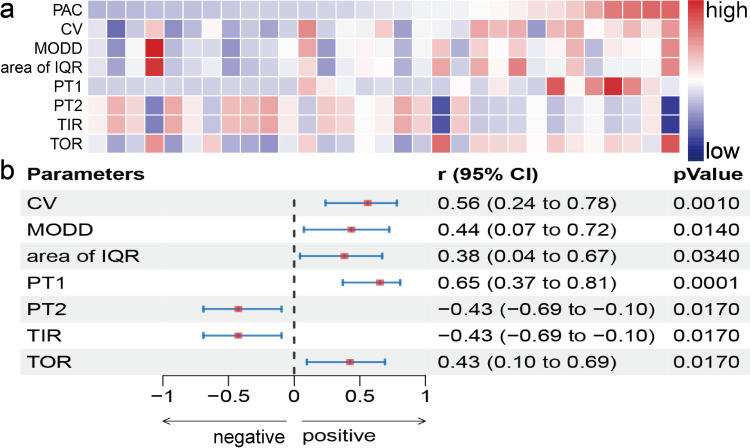
Correlation analysis indicated an association between PAC and FGMS parameters (Figure 3). PAC was positively correlated with general and day-to-day GV, namely, GV level was increased with increasing PAC. A positive correlation was identified between PAC and PT1 or TOR, whereas PT2 and TIR were inversely correlated with PAC, suggesting that an increased PAC is usually accompanied by a poor glucose target rate. No significant correlation was identified between PAC and DEXA parameters.
Figure 3.
Correlation between PAC and FGMS parameters. (a) heat map of PAC and FGMS parameters landscape, the red background represents high value, the blue background represents low value. (b) forest map of correlation between PAC and FGMS parameters, square dots denote r, error bars indicated 95% CI. P < 0.050 was considered a significant correlation.
Plasma Renin Concentration (PRC)
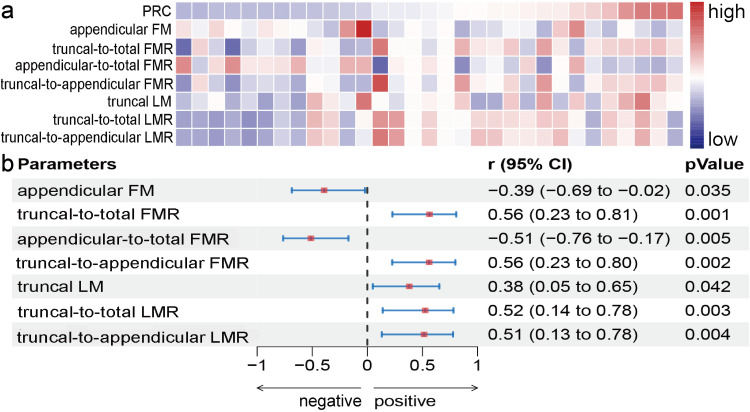
Correlation analysis did not identify significant correlations between PRC and FGMS parameters, however, an association between PRC and DEXA parameters were observed (Figure 4). Specifically, a negative correlation was identified between PRC and FM in the limbs, suggesting increased FM in the limbs as PA progressed; truncal LM was positively correlated with PRC, from which we can infer that greater renin suppression was accompanied by decreased truncal LM.
Figure 4.
Correlation between PRC and DEXA parameters. (a) heat map of PRC and DEXA parameters landscape, the red background represents high value, the blue background represents low value. (b) forest map of correlation between PRC and DEXA parameters, square dots in denotes r, error bars indicated 95% CI. P < 0.050 was considered a significant correlation.
Regarding body distribution parameters, PRC was positively correlated with truncal-to-total FMR and truncal-to-appendicular FMR, while it was negatively correlated with appendicular-to-total FMR. Accordingly, we assumed that FM was more susceptible to accumulation in the limbs than in the trunk as PA progressed. In addition, a positive correlation was found between PRC and truncal-to-total LMR or truncal-to-appendicular LMR. Based on these results, hypothesis was established that greater renin suppression would be accompanied by a decreased proportion of truncal LM.
Aldosterone-to-Renin Ratio (ARR)
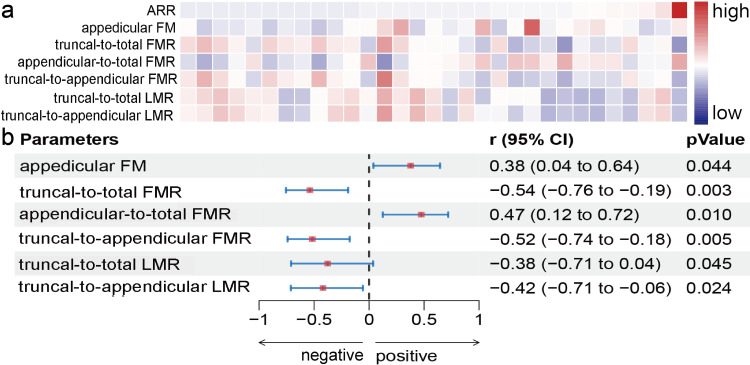
Correlation analysis identified an association between ARR and DEXA parameters (Figure 5). Specifically, ARR was positively correlated with FM in the limbs, suggesting increased FM in the limbs as PA progressed. Analysis of ARR and body distribution parameters identified a positive correlation in appendicular-to-total FMR along with negative correlation in truncal-to-total FMR, truncal-to-appendicular FMR, truncal-to-total LMR, and truncal-to-appendicular LMR, indicating that a greater ARR was accompanied by a decreased proportion of truncal FM and LM. No significant correlation was identified between ARR and FGMS parameters.
Figure 5.
Correlation between ARR and DEXA parameters. (a) heat map of ARR and DEXA parameters landscape, the red background represents high value, the blue background represents low value. (b) forest map of correlation between ARR and DEXA parameters, square dots in denotes r, error bars indicated 95% CI. P < 0.050 was considered a significant correlation.
Discussion
The present study was built on and inspired by previous observations suggesting the influence of aldosterone on glycometabolism, FM, and LM, contributing to cardiovascular diseases and accidental death.10,19 Based on the negative feedback theory, autonomous aldosterone secretion in PA usually suppresses RAAS, resulting in decreased PRC. Greater PRC suppression characterizes the severity of renin-dependent aldosteronism.20 ARR is the screening indicator of PA, calculated by aldosterone-to-renin ratio.17 The increased ARR suggests increased PAC, decreased PRC, or both, reflecting the severity of the disease. The current study is the first to compare FM and LM distribution between patients with PA and HCs and to explore the trend of alterations in glycometabolism, FM, and LM as PA progresses.
According to the results of comparison analysis, patients in PA group presented with increased GV levels and poor glucose target rate. Further correlation analysis revealed that a higher PAC was accompanied by increased GV levels and a poorer glucose target rate. We did not find a significant correlation between FGMS parameters and PRC or ARR.
Over the past decade, it has fueled considerable interest in the possibility that GV and TIR are associated with CVD progression. The correlated data suggest that patients with increased GV and decreased TIR are prone to suffer CVD.15,16 Therefore, the increased GV and poor glucose-target-rate found in PA group may underlie the pathogenesis of CVD, and those with higher PAC levels are inclined to experience undesirable cardiovascular outcomes.
Generalising the results of correlation analysis with respect to FM and FM distribution, the proportion of truncal FM was positively associated with PRC and negatively associated with ARR, whereas the proportion of appendicular FM was negatively associated with PRC and positively associated with ARR. Accordingly, it allowed us to hypothesise that FM is more inclined to accumulate in the limbs more than in the trunk as PA progresses. The proportion of truncal FM in PA group was significantly higher than that in HCs, whereas no significant difference was observed in the proportion of appendicular FM between these two groups.
An abundance of data suggest that greater FM contributes to IR, metabolic disorders, and CVD.21,22 It is also worth taking note that FM in different body parts is associated with different effects on cardiovascular system. Central fat accumulation exerts a prominent impact on adverse cardiovascular profile.23 Even though there was a tendency towards fat accumulation in the limbs than in the trunk in our PA group, their fat proportion in the trunk was significantly higher than those in HCs and fat proportion in the limbs was comparable to those of HCs. One can speculate that patients with PA present greater fat accumulation in the trunk than HCs, leading to an increased risk of CVD, and fat accumulation might transfer to the limbs during disease progression. Increasing attention should be paid to fat distribution in patients with PA to evaluate cardiovascular risk.
The results relevant to LM analysis provided suggestive evidence that truncal LM appeared to be easily affected when PA progressed, whereas LM in the limbs did not show a correlation with PAC, PRC, and ARR. In comparison with HCs, the proportion of appendicular LM was significantly lower in PA group, whereas no significant difference was identified in the proportion of truncal LM. Accordingly, we assumed that PA has a significant impact on appendicular muscle, which is unrelated to disease duration, and truncal LM shows a gradual downward trend as PA progresses.
Data on LM distribution in patients with PA are limited. Recent data from experimental observations demonstrate that aldosterone induces myocyte loss, while aldosterone receptor blocking could reverse this effect.24 There are consistent data from clinical studies that reveal lower appendicular muscle mass in patients with PA than in that of age- and sex-matched controls with nonfunctional adrenal incidentaloma using bioelectrical impedance analysis.5 Consistently, the present study used DEXA, a well-accepted and standard method for body composition evaluation, also indicated a lower proportion of appendicular LM in PA group than that in HCs. There are convincing data in the literature that muscle mass is inversely associated with metabolic disorders and CVD incidence.25,26 Therefore, it is still a subject of discussion regarding LM and LM distribution in PA, and further investigations are warranted owing to a dearth of information on this issue and its significant implications in adverse disease outcomes as yet.
The present study carried certain limitations. The findings were obtained from a small sample of Chinese individuals. Further studies with larger sample sizes in other regions of China and worldwide are required to confirm our results. In addition, we failed to recruited the same number of HCs as that in PA group. In this study, the ratio of enrolled participants in PA group and HCs was 2:1.
Conclusions
The present study illustrated significantly altered GV, glucose target rate, the proportion of truncal FM, and the proportion of appendicular LM in PA group when compared with those of HCs. Furthermore, GV, appendicular FM, and the proportion of appendicular FM increased, while glucose target rate, the proportion of truncal FM and LM, and truncal LM decreased with PA progression. As the detection rate of PA increases, a multidisciplinary research effort is needed to fill the knowledge gap around its comorbidity and CVD risk and to foster the clinical strategies against adverse disease outcomes. The results identified in the current study open new research perspectives, and ongoing research is required towards a better understanding in this scenario.
Acknowledgments
The authors thank the National Natural Science Foundation of China (grant numbers: 82073909), Four “Batches” Innovation Project of Invigorating Medical through Science and Technology of Shanxi Province (2023XM022), and The Shanxi Provincial Central Leading Local Science and Technology Development Fund Project (grant numbers: YDZJSX2022A059. YDZJSX20231A059) for their support.
Funding Statement
This study was funded by the National Natural Science Foundation of China (grant numbers: 82073909), Four “Batches” Innovation Project of Invigorating Medical through Science and Technology of Shanxi Province (2023XM022), and The Shanxi Provincial Central Leading Local Science and Technology Development Fund Project (grant numbers: YDZJSX2022A059, YDZJSX20231A059).
Data Sharing Statement
The data that support the findings of this study are available from the corresponding author upon reasonable request.
Ethics Approval and Informed Consent
Approval of the research protocol: The study protocol was reviewed and approved by the Ethics Committee at the First Hospital of Shanxi Medical University (approval number 2018K006). Written informed consent was obtained from all participants involved in the study.
Author Contributions
All authors made a significant contribution to the work reported, whether that is in the conception, study design, execution, acquisition of data, analysis and interpretation, or in all these areas; took part in drafting, revising or critically reviewing the article; gave final approval of the version to be published; have agreed on the journal to which the article has been submitted; and agree to be accountable for all aspects of the work.
Disclosure
The authors have no conflicts of interest to declare in this work.
References
- 1.Conn JW. Plasma renin activity in primary aldosteronism. Importance in differential diagnosis and in research of essential hypertension. JAMA. 1964;190(3):222–225. doi: 10.1001/jama.1964.03070160046009 [DOI] [PubMed] [Google Scholar]
- 2.Ohno Y, Sone M, Inagaki N, et al. Prevalence of cardiovascular disease and its risk factors in primary aldosteronism: a multicenter study in Japan. Hypertension. 2018;71(3):530–537. doi: 10.1161/HYPERTENSIONAHA.117.10263 [DOI] [PubMed] [Google Scholar]
- 3.Monticone S, D’Ascenzo F, Moretti C, et al. Cardiovascular events and target organ damage in primary aldosteronism compared with essential hypertension: a systematic review and meta-analysis. Lancet Diabetes Endocrinol. 2018;6(1):41–50. doi: 10.1016/S2213-8587(17)30319-4 [DOI] [PubMed] [Google Scholar]
- 4.Hanslik G, Wallaschofski H, Dietz A, et al. Increased prevalence of diabetes mellitus and the metabolic syndrome in patients with primary aldosteronism of the German Conn’s Registry. Eur J Endocrinol. 2015;173(5):665–675. doi: 10.1530/EJE-15-0450 [DOI] [PubMed] [Google Scholar]
- 5.Kwak MK, Lee SE, Cho YY, et al. The differential effect of excess aldosterone on skeletal muscle mass by sex. Front Endocrinol. 2019;10:195. doi: 10.3389/fendo.2019.00195 [DOI] [PMC free article] [PubMed] [Google Scholar]
- 6.Huang WC, Chen YY, Yang SY, et al. Fat mass as an important predictor of persistent hypertension in patients with primary aldosteronism after adrenalectomy. Hypertens Res. 2023;46(6):1375–1384. doi: 10.1038/s41440-023-01203-3 [DOI] [PubMed] [Google Scholar]
- 7.Chen LK, Lee WJ, Peng LN, et al. Recent advances in sarcopenia research in Asia: 2016 update from the Asian Working Group for Sarcopenia. J Am Med Dir Assoc. 2016;17(8):767.e1–7. doi: 10.1016/j.jamda.2016.05.016 [DOI] [PubMed] [Google Scholar]
- 8.Colussi G, Catena C, Lapenna R, et al. Insulin resistance and hyperinsulinemia are related to plasma aldosterone levels in hypertensive patients. Diabetes Care. 2007;30(9):2349–2354. doi: 10.2337/dc07-0525 [DOI] [PubMed] [Google Scholar]
- 9.Er LK, Lin MC, Tsai YC, et al. Association of visceral adiposity and clinical outcome among patients with aldosterone producing adenoma. BMJ Open Diabetes Res Care. 2020;8(1):e001153. doi: 10.1136/bmjdrc-2019-001153 [DOI] [PMC free article] [PubMed] [Google Scholar]
- 10.Then C, Ritzel K, Herder C, et al. Association of renin and aldosterone with glucose metabolism in a Western European population: the KORA F4/FF4 study. BMJ Open Diabetes Res Care. 2022;10(1):e002558. doi: 10.1136/bmjdrc-2021-002558 [DOI] [PMC free article] [PubMed] [Google Scholar]
- 11.Chen KM, Lee BC, Chen PT, et al. Evaluation of abdominal computed tomography scans for differentiating the discrepancies in abdominal adipose tissue between two major subtypes of primary aldosteronism. Front Endocrinol. 2021;12:647184. doi: 10.3389/fendo.2021.647184 [DOI] [PMC free article] [PubMed] [Google Scholar]
- 12.Kogure GS, Ribeiro VB, Mendes MC, et al. Dual-energy X-ray absorptiometry and adiposity index are sensitive methods to evaluate central fat accumulation in women with polycystic ovary syndrome and normal body mass index. Arch Endocrinol Metab. 2023;67(5):e000627. doi: 10.20945/2359-3997000000627 [DOI] [PMC free article] [PubMed] [Google Scholar]
- 13.Kim Y, Han BD, Han K, et al. Optimal cutoffs for low skeletal muscle mass related to cardiovascular risk in adults: the Korea National Health and Nutrition Examination Survey 2009–2010. Endocrine. 2015;50(2):424–433. doi: 10.1007/s12020-015-0577-y [DOI] [PubMed] [Google Scholar]
- 14.Lu Z, Tilly MJ, Aribas E, et al. Imaging-based body fat depots and new-onset atrial fibrillation in general population: a prospective cohort study. BMC Med. 2022;20(1):317. doi: 10.1186/s12916-022-02505-y [DOI] [PMC free article] [PubMed] [Google Scholar]
- 15.Lu J, Wang C, Shen Y, et al. Time in range in relation to all-cause and cardiovascular mortality in patients with type 2 diabetes: a prospective cohort study. Diabetes Care. 2021;44(2):549–555. doi: 10.2337/dc20-1862 [DOI] [PMC free article] [PubMed] [Google Scholar]
- 16.Tang X, Li S, Wang Y, et al. Glycemic variability evaluated by continuous glucose monitoring system is associated with the 10-y cardiovascular risk of diabetic patients with well-controlled HbA1c. Clin Chim Acta. 2016;461:146–150. doi: 10.1016/j.cca.2016.08.004 [DOI] [PubMed] [Google Scholar]
- 17.Naruse M, Katabami T, Shibata H, et al. Japan Endocrine Society clinical practice guideline for the diagnosis and management of primary aldosteronism 2021. Endocr J. 2022;69(4):327–359. doi: 10.1507/endocrj.EJ21-0508 [DOI] [PubMed] [Google Scholar]
- 18.Han M, Cao X, Zhao C, et al. Assessment of glycometabolism impairment and glucose variability using flash glucose monitoring system in patients with adrenal diseases. Front Endocrinol. 2020;11:544752. doi: 10.3389/fendo.2020.544752 [DOI] [PMC free article] [PubMed] [Google Scholar]
- 19.Luther JM, Wei DS, Ghoshal K, et al. Treatment of primary aldosteronism increases plasma epoxyeicosatrienoic acids. Hypertension. 2021;77(4):1323–1331. doi: 10.1161/HYPERTENSIONAHA.120.14808 [DOI] [PMC free article] [PubMed] [Google Scholar]
- 20.Baudrand R, Guarda FJ, Torrey J, et al. Dietary sodium restriction increases the risk of misinterpreting mild cases of primary aldosteronism. J Clin Endocrinol Metab. 2016;101(11):3989–3996. doi: 10.1210/jc.2016-1963 [DOI] [PMC free article] [PubMed] [Google Scholar]
- 21.Gowri SM, Antonisamy B, Geethanjali FS, et al. Distinct opposing associations of upper and lower body fat depots with metabolic and cardiovascular disease risk markers. Int J Obes. 2021;45(11):2490–2498. doi: 10.1038/s41366-021-00923-1 [DOI] [PubMed] [Google Scholar]
- 22.Goossens GH. The metabolic phenotype in obesity: fat mass, body fat distribution, and adipose tissue function. Obes Facts. 2017;10(3):207–215. doi: 10.1159/000471488 [DOI] [PMC free article] [PubMed] [Google Scholar]
- 23.Pischon T, Boeing H, Hoffmann K, et al. General and abdominal adiposity and risk of death in Europe. N Engl J Med. 2008;359(20):2105–2120. doi: 10.1056/NEJMoa0801891 [DOI] [PubMed] [Google Scholar]
- 24.Kouda K, Fujita Y, Ohara K, et al. Associations between trunk-to-peripheral fat ratio and cardiometabolic risk factors in elderly Japanese men: baseline data from the Fujiwara-kyo Osteoporosis Risk in Men (FORMEN) study. Environ Health Prev Med. 2021;26(1):35. doi: 10.1186/s12199-021-00959-9 [DOI] [PMC free article] [PubMed] [Google Scholar]
- 25.Tyrovolas S, Panagiotakos D, Georgousopoulou E, et al. Skeletal muscle mass in relation to 10 year cardiovascular disease incidence among middle aged and older adults: the ATTICA study. J Epidemiol Community Health. 2020;74(1):26–31. doi: 10.1136/jech-2019-212268 [DOI] [PMC free article] [PubMed] [Google Scholar]
- 26.Moon SS. Low skeletal muscle mass is associated with insulin resistance, diabetes, and metabolic syndrome in the Korean population: the Korea National Health and Nutrition Examination Survey (KNHANES) 2009–2010. Endocr J. 2014;61(1):61–70. doi: 10.1507/endocrj.EJ13-0244 [DOI] [PubMed] [Google Scholar]


