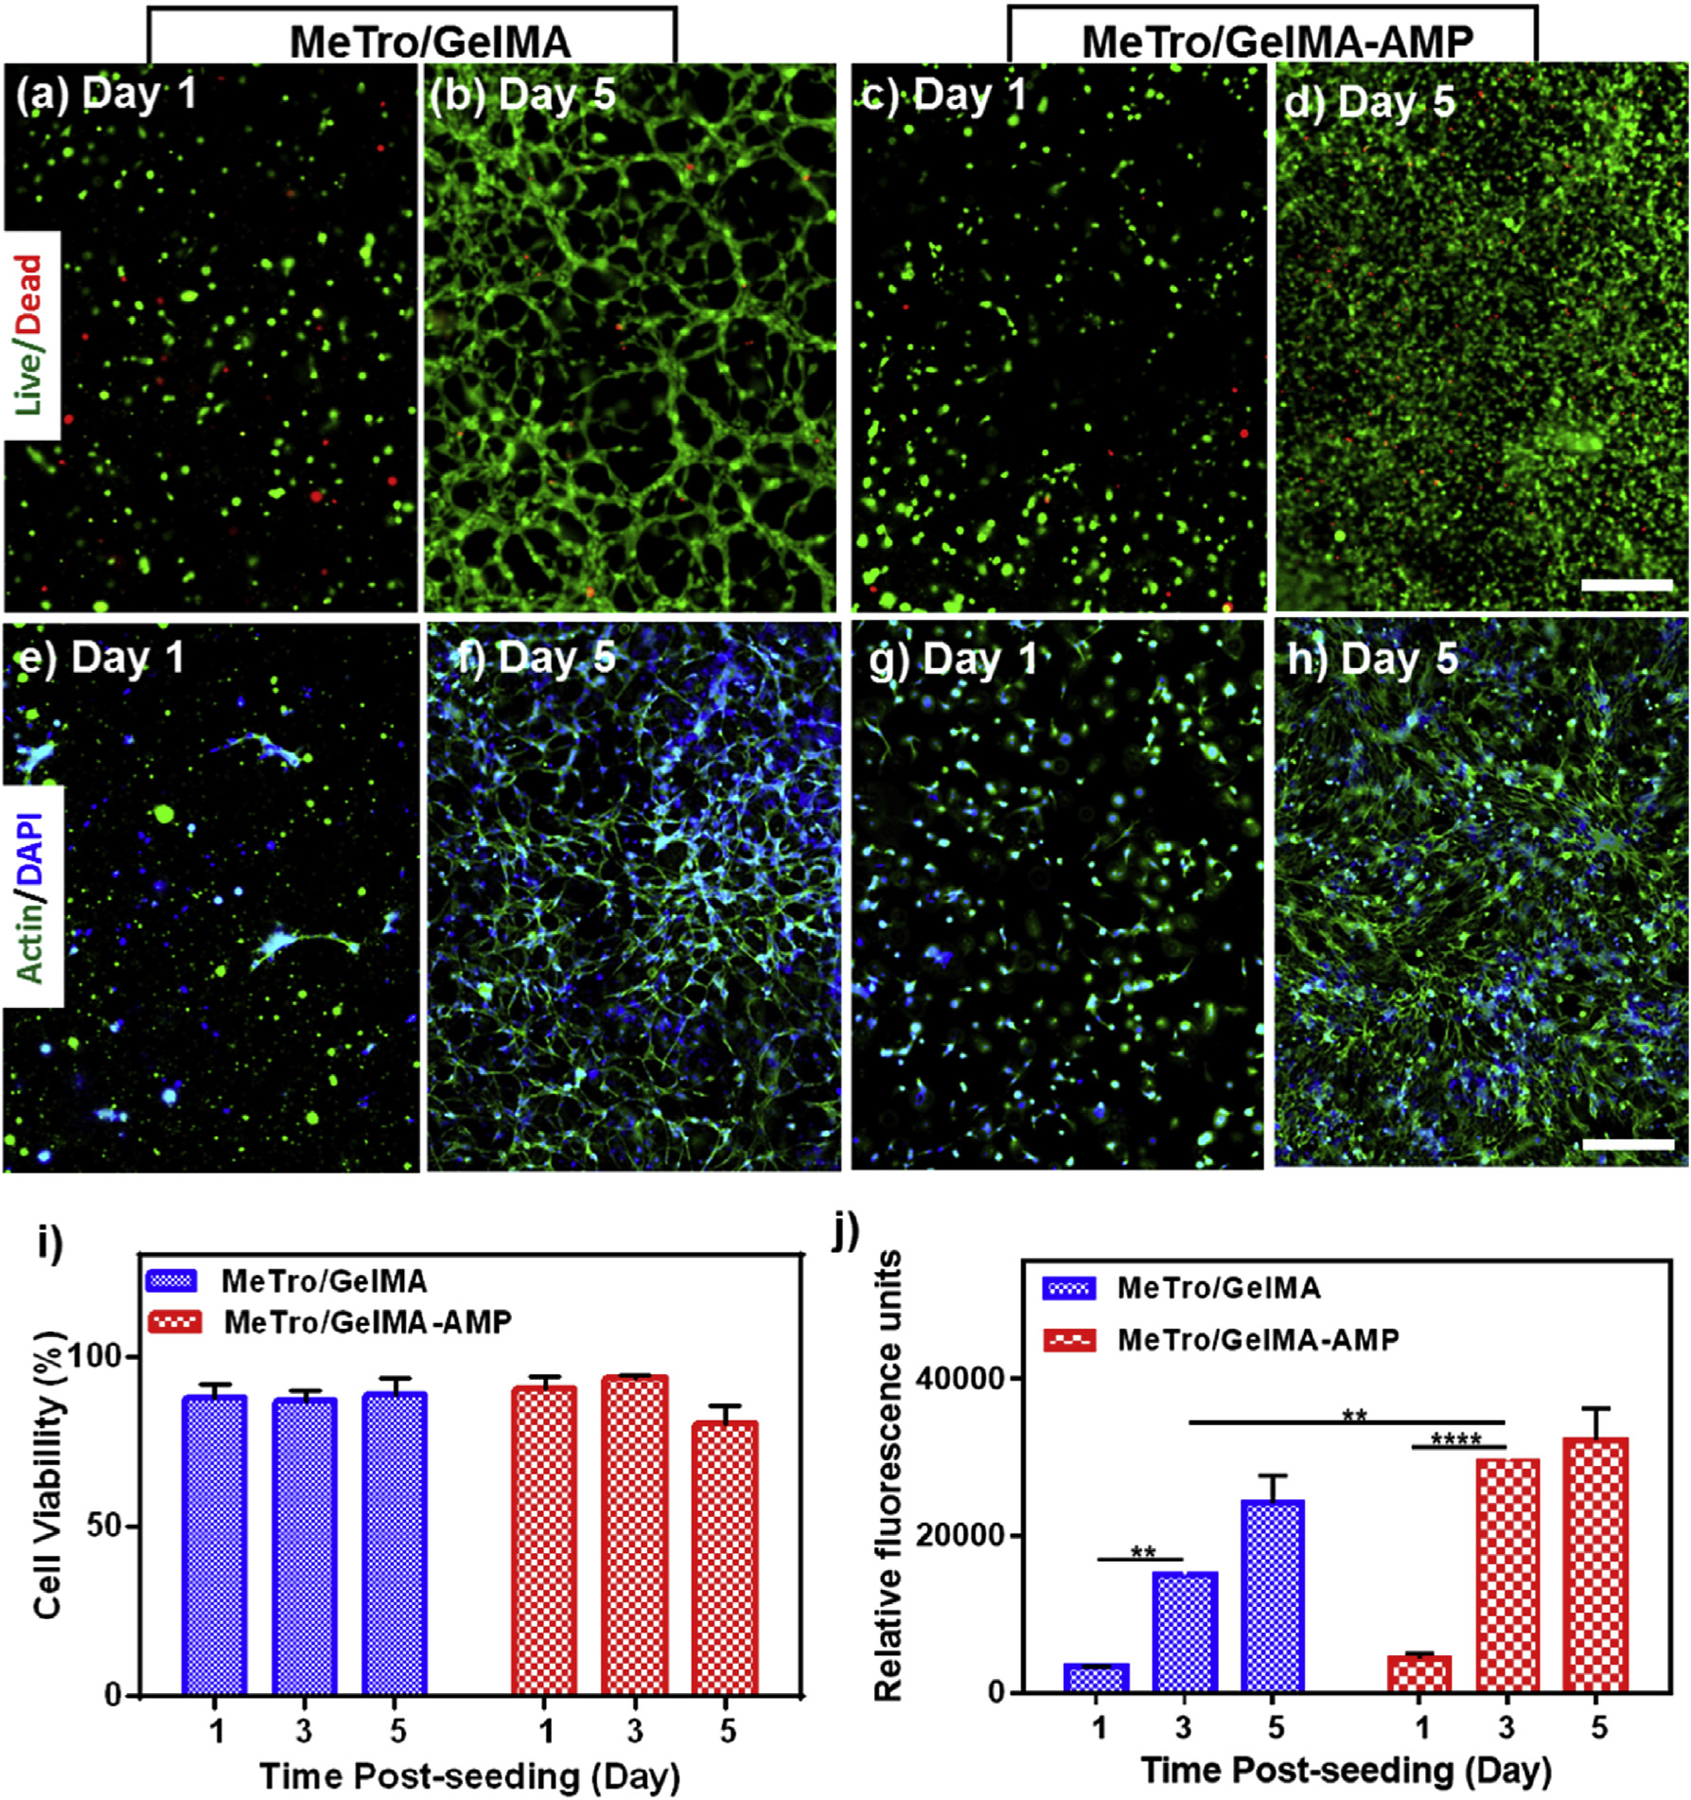
Fig. 6. In vitro 3D cell encapsulation in MeTro/GelMA and MeTro/GelMA-AMP (0.1% (w/v) AMP) hydrogels using 3T3 cells.

Representative live/dead images from 3T3 encapsulated within the (a–b) MeTro/GelMA (c–d) and MeTro/GelMA-AMP hydrogels on days 1 and 5. Representative Actin/DAPI stained images for 3T3 cells encapsulated within (e–f) MeTro/GelMA (g, h) and MeTro/GelMA-AMP hydrogels on days 1 and 5 (scale bar = 200 μm). (i) Quantification of cell viability encapsulated in MeTro/GelMA and MeTro/GelMA-AMP hydrogels after 1, 3, and 5 days of encapsulation. (j) Quantification of metabolic activity of 3T3 cells encapsulated in MeTro/GelMA and MeTro/GelMA-AMP hydrogels after 1, 3, and 5 days. 30/70 MeTro/GelMA hydrogels at 10% (w/v) total polymer concentration were used for 3D cell encapsulation. Data is represented as mean ± SD (*p < 0.05, **p < 0.01, ***p < 0.001 and ****p < 0.0001, n ≥ 3).
