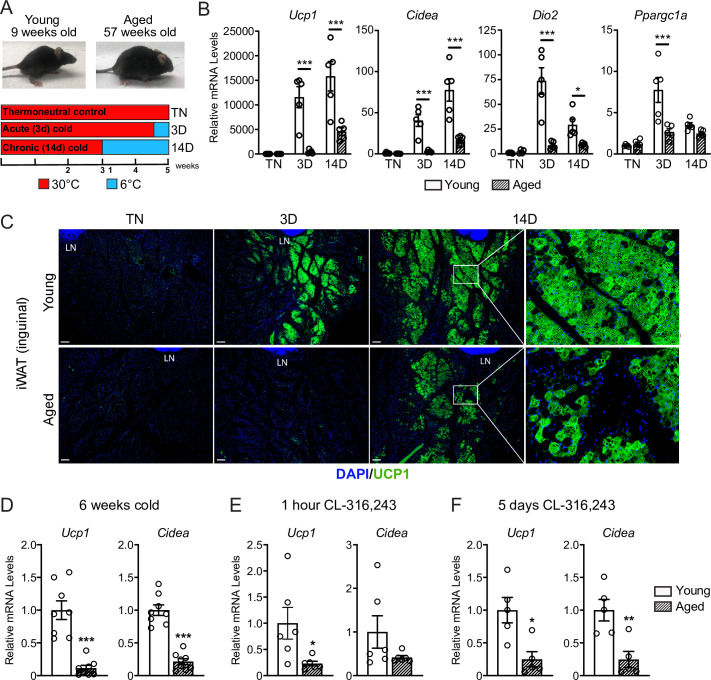
Figure 1. Aged mice exhibit decreased iWAT beiging in response to cold exposure or β3-agonist treatment.
(A) Young (9-week-old) and aged (57-week-old) C57BL/6 mice were acclimated to 30 °C for 3 weeks, followed by two additional weeks either remaining at 30 °C (TN, thermoneutral), spending the last 3 days at 6 °C (3D, acute cold) or the last 14 days at 6 °C (14D, chronic cold). (B) Relative mRNA levels of thermogenic marker genes in mouse iWAT from (A), n=5. (C) Immunofluorescence analysis of UCP1 (green) and DAPI (blue) in iWAT sections from mice in (A), LN = lymph node. Scale bar 100 μm. (D–F) Relative mRNA levels of Ucp1 and Cidea in iWAT from separate groups of young and aged mice that were either: exposed to 6 °C cold for 6 weeks (D), treated with CL-316,243 for 1 hr (E) or treated with CL 316,243 for 5 days (F). Data represent mean ± SEM, points represent biological replicates, two groups analyzed using a Student’s t-test, and multiple conditions analyzed using a two-way ANOVA with a Tukey correction for multiple comparisons. Significance: not significant, p>0.05; * p<0.05 ** p<0.01; *** p<0.001.


