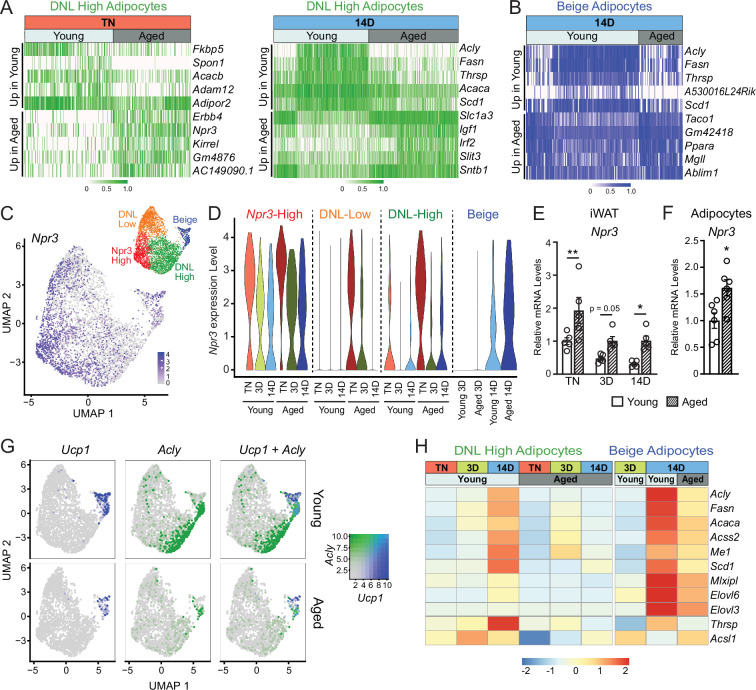
Figure 6. Aging blocks activation of the lipogenic gene program in adipocytes.
(A) Expression heatmap of the top aging-regulated genes in DNL-high adipocytes at TN (left) and after 14 days of cold exposure (right). (B) Expression heatmap of the top aging-regulated genes in beige adipocytes after 14 days of cold exposure. (C) UMAP of Npr3 mRNA levels in adipocyte populations (from Figure 5D). (D) Violin plots showing Npr3 mRNA levels in adipocyte populations at TN (T), and at 3 and 14 days of cold exposure, Y-axis=log-scale normalized read count. (E) Npr3 mRNA levels in iWAT from mouse groups described in Figure 1A, n=5. (F) Npr3 mRNA levels in isolated adipocytes from TN- acclimated young and aged mice, n=6. (G) UMAPs of Ucp1, Acly, and their co-expression in adipocyte populations from young and aged mice. (H) Heatmap showing average expression of DNL genes in all nuclei from DNL-high and beige adipocytes per condition indicated in the top table. Data represent mean ± SEM, points represent biological replicates, two groups analyzed using a Student’s t-test, and multiple conditions analyzed with a two-way ANOVA with a Tukey correction for multiple comparisons. Significance: not significant, p>0.05; * p<0.05 ** p<0.01; *** p<0.001.


