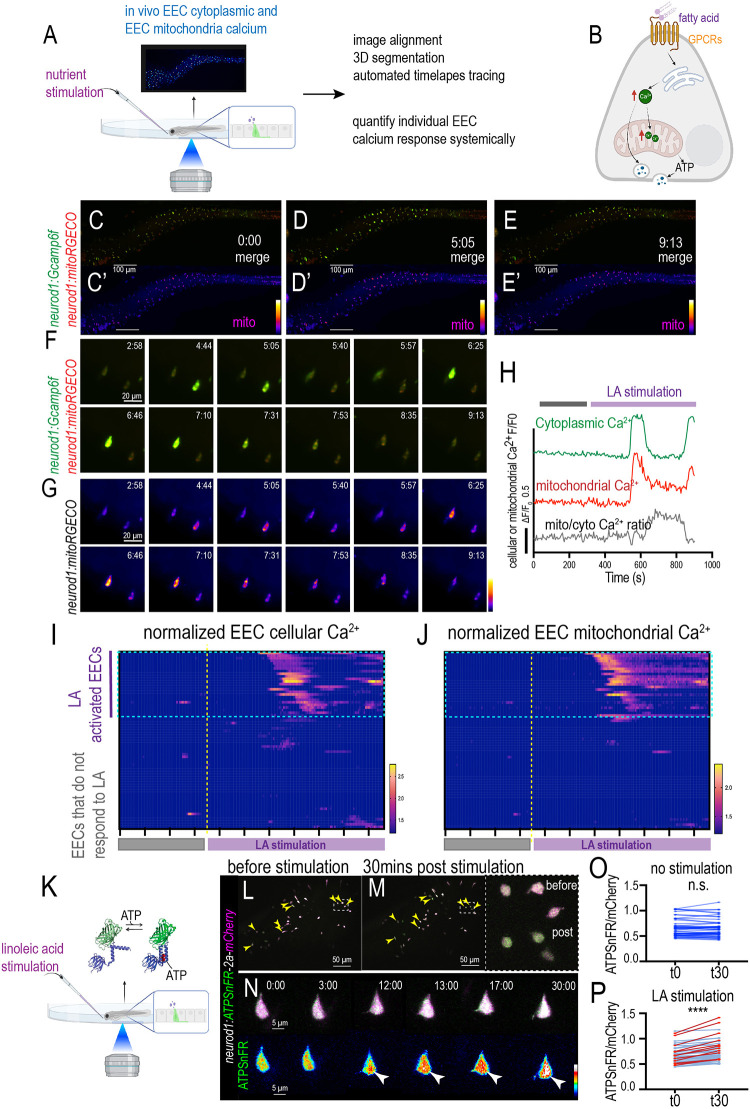
Fig. 7.
Analysis of individual EEC cellular and mitochondrial activity in response to nutrient stimulation in live zebrafish. (A) Schematic showing in vivo imaging of EEC cellular and mitochondrial Ca2+ activity in response to nutrient stimulation. (B) The hypothesis model figure shows that fatty acid increases both cytoplasmic and mitochondrial Ca2+, which powers the hormone vesicle secretion from EECs. (C-E′) Time-lapse images of the whole zebrafish intestinal EEC cytoplasmic and mitochondrial Ca2+ change post linoleic acid stimulation. The EEC cytoplasmic Ca2+ was labeled by Gcamp6f (green) and the EEC mitochondrial Ca2+ was labeled by mitoRGECO (magenta). (F,G) Magnification shows two representative EECs that are activated by linoleic acid. (H) Analysis of fluorescence change of Gcamp, mitoRGECO and mitoRGECO/Gcamp ratio in a representative linoleic acid-activated EEC. (I,J) Analysis of fluorescence change of Gcamp and mitoRGECO of 68 EECs in one zebrafish before and after linoleic acid stimulation. The EECs that increase cytoplasmic Ca2+ were defined as ‘LA-activated EECs’. Most of the LA-activated EECs also exhibited increased mitochondrial Ca2+. (K) Schematic showing measurement of EEC ATP concentration using zebrafish injected with neurod1:ATPSnFR-2a-mCherry plasmid. The ATPSnFR/mCherry ratio is used to measure the ATP concentration within EECs. (L,M) Confocal projection of the zebrafish intestine before and 30 min after linoleic acid stimulation. The yellow arrowheads indicate the EECs that exhibit a significant increase in the ATPSnFR/mCherry ratio upon linoleic acid stimulation. (N) Time-lapse imaging of a representative EEC that increased ATPSnFR/mCherry ratio after linoleic acid stimulation. White arrowheads indicate, at 12, 13, 17 and 30 min post linoleic acid stimulation, a representative EEC displaying an increased ATPSnFR fluorescence level. (O-P) The ATPSnFR/mCherry ratio of the EECs at 0 min (t0) and 30 min (t30) in unstimulated (O) and linoleic acid-stimulated (P) zebrafish. The red lines in P indicate the EECs that increased the ATPSnFR/mCherry ratio by more than 15%. More than 100 EECs from three zebrafish were analyzed for K-P. ****P<0.0001 (paired, two-tailed Student's t-test). Scale bars: 100 μm (C-E′); 20 μm (F,G); 50 μm (L,M); 5 μm (N).

