

Abstract
Laser-based haematology analysers are routinely used in veterinary clinical pathology laboratories, and are available to practitioners. However, feline haematological reference intervals (RIs) determined according to international recommendations are, to our knowledge, not available. Furthermore, platelet count RI is difficult to establish in cats because of the frequent occurrence of platelet aggregation in blood specimens. The purpose of this study was to establish feline haematological RIs with the Sysmex XT-2000iV and ProCyte DX analysers, in ethylenediamine tetra-acetic acid (EDTA) and in citrate, theophylline, adenosine and dipyridamole (CTAD), which is a combination of anticoagulants limiting platelet aggregation. Blood specimens from 120 healthy cats were analysed in duplicate, and the degree of platelet aggregation was assessed on blood smears. After exclusion of inadequate specimens, 81 sets of results (from 44 males and 37 females, aged from 6 to 116 months) were available for the determination of RIs by the non-parametric method. The effects of the anticoagulant, analyser and aggregation score were assessed. When the aggregation effect was significant, the RIs were determined using the subgroup of blood specimens with no or little aggregation. The effects of sex, age and weight were also investigated, but were moderate. The different RIs obtained with the Sysmex XT-2000iV and ProCyte DX analysers, and the two anticoagulants, were very similar to previous RIs established in EDTA with the ADVIA 120, another laser-based analyser, except for the platelet count in CTAD specimens. Its lower reference limit was higher in CTAD vs EDTA specimens, which confirms the interest in this anticoagulant in cats.
Introduction
Specific reference intervals (RIs) are essential to interpret clinical data in veterinary medicine. RIs are specific to a clearly defined population and to the analyser used to perform the analysis. To our knowledge, there is only one report describing haematology feline reference values by flow cytometric analysis, with the ADVIA 120 analyser (Bayer), based on 61 ethylenediamine tetra-acetic acid (EDTA) feline blood specimens. 1 To our knowledge, no RIs have been established in cats for two other frequently used blood analysers: the Sysmex XT-2000iV (Sysmex), a reference laboratory haematology analyser, and the ProCyte DX (IDEXX Laboratories), an in-house haematology analyser. The few studies on haematological RIs in cats might be due to the difficulty of obtaining a good blood specimen, especially without platelet clumping. Correct blood sampling has been shown to be facilitated by use of a microtube system to reduce stress and the sampled volume (about 200–500 µl). 2 It has also been demonstrated that platelet aggregation can be limited for at least 48 h by using a combination of citrate, theophylline, adenosine and dipyridamole (CTAD) alone or added to classic EDTA tubes.3–5
The objective of this study was to establish the RIs of feline blood specimens collected in EDTA and CTAD microtubes for the Sysmex XT-2000iV and the ProCyte DX haematology systems, in accordance with the guidelines of the American Society of Veterinary Clinical Pathology (ASVCP), the International Federation of Clinical Chemistry (IFCC), and the Clinical and Laboratory Standards Institute (CLSI).6,7
Materials and methods
This prospective study was performed between October 2010 and July 2011 at the Laboratoire Central de Biologie Médicale of the Veterinary School of Toulouse. The experimental protocol was designed according to ASVCP and IFCC–CLSI guidelines on the de novo establishment of RIs.6,7 The initial aim was to collect at least 120 feline blood specimens. Unfortunately, owing to some analytical difficulties and the a posteriori exclusion of certain specimens, 81 results were finally available for RI determination. However, this number conformed with the IFCC–CLSI recommendation that ‘if a laboratory has adequate statistical and computing competence, the working group encourages consideration of procedures that do not require 120 individuals to estimates reference limits and confidence interval’. 7
Inclusion and exclusion criteria
The cats included in the study had been presented at the preventive medicine department of the Veterinary School of Toulouse for vaccination, the owners requiring screening of their cats for retroviral infection, that is, feline leukemia virus (FeLV) and feline immunodeficiency virus (FIV). Before sampling, all owners signed an informed consent to allow the use of the blood specimen for this study. Inclusion criteria were as follows: cats older than 6 months and healthy based on a detailed questionnaire (including queries about vaccination status, fasted condition, general behaviour, history of previous illness and treatments), and a complete physical examination performed by an experienced clinician. Cats were excluded a priori if any of the following were present: lactation, history of diseases or surgery within the last month, any treatment within the last month except for external anti-parasitic treatment, any abnormality found during the physical examination, and a positive result for FeLV or FIV (Rapid FIV Ab, FeLV Ag; Kitvia).
Specimen collection
Blood was collected without sedation in a quiet environment and with minimal restraint. Venipuncture was performed in the cephalic vein with a 23 gauge needle (0.6 × 25 mm: 23GNeolus; Terumo Europe), a microcapillary (microcapillary system EDTA 200 µl; Microvette, Sarstedt) and a microtube. The EDTA microtubes (0.5 ml K3EDTA: Minicollect; Greiner Bio-One) were ready prepared, whereas the CTAD microtubes were prepared just before each sampling by adding 50 µl of CTAD solution to dry microtubes (0.5 ml: Z No additive Minicollect; Greiner Bio-One). The CTAD and EDTA microtubes were filled in a randomised order determined by coin tossing. Tubes were gently homogenised by 10 inversions immediately after specimen collection. Incorrectly filled tubes (> ± 5% error) or tubes with macroscopic clots were excluded. The microtubes were then placed for 20 mins on a mechanical mixer (Speci Mix, CT06478; Drew) before being processed within 1 h of sampling.
A semi-quantitative method of scoring, ranging from 1 to 5 (low to high difficulty), was used to evaluate sampling [difficulty in filling the microtubes (direct vs interrupted flow, slow vs quick flow) and stress of the cats as perceived by the phlebotomist].
Haematological analyses
Complete blood cell counts (CBCs) were obtained with both the Sysmex XT-2000iV and ProCyte DX analysers. Quality controls were performed with the manufacturers’ control solutions (Sysmex e-check L2 for the Sysmex XT-2000iV and ProCyte DX QC levels 1 and 2 for the ProCyte DX).
Duplicate analyses of each tube were performed with both analysers in a randomised order determined by coin tossing. The CBC obtained with the Sysmex XT-2000iV analyser (with the software version 00-10 Sysmex and the corresponding species settings), included white blood cell (WBC) count, red blood cell (RBC) count (RBC-I: RBC count by impedance measurement; RBC-O: RBC count by optical measurement), platelet (PLT) count (PLT-I: PLT count by impedance measurement; PLT-O: PLT count by optical measurement), haemoglobin (HGB), haematocrit (HTE), mean corpuscular volume (MCV), mean corpuscular haemoglobin (MCH), mean corpuscular haemoglobin concentration (MCHC), RBC distribution width as a percentage (RDW-CV), RBC distribution width as a coefficient of variation (RDW-SD), reticulocyte percentage (RET%) and reticulocyte count (RETc), the reticulocyte indexes [low fluorescence ratio (LFR), medium fluorescence ratio (MFR), high fluorescence ratio (HFR) and immature reticulocyte fraction (IRF)] and the leukocyte differential count. Analyses performed by the ProCyte DX (with the software version 00-25-18) included WBC, RBC-I, PLT-O, HGB, HTE, MCV, MCH, MCHC, RDW-CV, RET% and RETc, and the leukocyte differential count. The basophil count has never been validated with any analyser in feline blood specimens, and was not examined here.8,9 The results for the CTAD tubes were multiplied by a factor (1.1) to compensate for dilution of HGB, RBC, HTE, WBC, neutrophil count, lymphocyte count, monocyte count, eosinophil count, PLT and RETc.
Two blood films were prepared from each EDTA and CTAD tube. The blood films were air-dried and stained with modified May–Grünwald–Giemsa (Aerospray Haematology Slide Stainer Cytocentrifuge 7150; Wescor), fixed, coverslip-mounted and stored in darkness. The blood films were retrospectively examined by the same trained veterinarian under light microscopy (BX60 microscope WH10X/22; Olympus) to estimate the score of platelet aggregation (SPA-F) according to Norman et al, 3 as previously described.4,5 They were then classified as not or little aggregated (NLA) vs highly aggregated (HA) at the arbitrary previously used threshold SPA-F < 2 vs ≥2, respectively.4,5
Data analyses
The distribution of each variable was first inspected visually to check for normality and possible outliers. The latter were tested by Dixon’s criterion and the eliminated values are reported in the footnotes to Tables 1–4. Normality was then tested by Anderson–Darling test. Reference limits were determined by the non-parametric method and their 90% confidence interval (CI) by a bootstrap method. Possible effects of the analyser (Sysmex XT-2000iV versus ProCyte DX), the order of the duplicate analysis (first vs second analysis by the same analyser), the anticoagulant (EDTA vs CTAD), the platelet aggregation score (SPA-F), age, sex and weight were tested using a general linear model analysis (significant effect was considered for P <0.05). When the observed effects of analysers, anticoagulants or SPA-F were statistically significant, the distributions were compared by Harris and Boyd’s z-test. When │z│> │z*│, the RIs and 90% CI were calculated accordingly. Effects of age and weight were investigated by a regression-based analysis.10,11 Calculations were done using Microsoft Excel, Analyse-it, Reference Value Advisor (v. 2.1) and Systat.12–14
Table 1.
Reference intervals for feline specimens collected in EDTA and determined with the ProCyte DX analyser
| Analyte | SPA-F group | n | Normality, P | Median and range | Mean | 2.5th percentile (90% CI) | 97.5th percentile (90% CI) |
|---|---|---|---|---|---|---|---|
| WBC (× 109/l) * | NLA + HA | 80 a | 0.082 | 8.7 3.8–17.2 |
9.1 | 4.0 (3.8; 4.6) |
15.2 (14.0; 17.2) |
| Neutrophils (× 109/l) * | NLA + HA | 80 † | 0.000 | 3.2 1.5–10.8 |
3.7 | 1.7 (1.5; 1.8) |
8.8 (7.5; 10.8) |
| Lymphocytes (× 109/l)* | NLA + HA | 80 † | 0.019 | 4.3 1.2–10.4 |
4.4 | 1.2 (1.2; 1.5) |
10.2 (8.1; 10.4) |
| Monocytes (× 109/l)* | NLA + HA | 79b,† | 0.024 | 0.3 0.1–0.7 |
0.3 | 0.1 (0.1; 0.1) |
0.6 (0.5; 0.7) |
| Eosinophils (× 109/l)* | NLA + HA | 76c,d,e,f,† | 0.007 | 0.5 0.1–1.2 |
0.6 | 0.1 (0.1; 0.3) |
1.2 (1.0; 1.2) |
| RBC-I (× 1 012/l)* | NLA + HA | 81 | 0.035 | 9.7 6.5–11.5 |
9.6 | 6.7 (6.5; 7.7) |
11.2 (11.1; 11.5) |
| HGB (g/l) | NLA | 40 | 0.726 | 130.3 94.0–161.5 |
129.0 | 94.1 (94.0; 106.5) |
161.4 (153.9; 161.5) |
| HTE (l/l) | NLA | 40 | 0.458 | 0.39 0.30–0.55 |
0.40 | 0.30 (0.30; 0.33) |
0.54 (0.49; 0.55) |
| MCV (fl) | NLA + HA | 81 | 0.246 | 43.6 37.2–56.3 |
43.5 | 37.3 (37.2; 38.0) |
52.6 (50.2; 56.3) |
| MCH (pg) | NLA + HA | 81 | 0.064 | 14.0 11.8–16.5 |
13.9 | 12.0 (11.8; 12.2) |
15.8 (15.4; 16.5) |
| MCHC (g/dl) | NLA + HA | 81 | 0.550 | 32.0 27.3–35.2 |
32.0 | 28.8 (27.3; 29.8) |
34.9 (34.0; 35.2) |
| RDW-CV (%) | NLA + HA | 81 | 0.055 | 24.6 19.7–34.7 |
24.9 | 20.2 (19.7; 21.9) |
30.2 (29.4; 34.7) |
| RET (× 109/l) | NLA + HA | 80 g | 0.000 | 16.0 2.0–48.9 |
18.1 | 3.8 (2.0; 4.7) |
48.6 (42.8; 48.9) |
| RET (%) | NLA + HA | 80 h | 0.000 | 0.2 0.0–0.7 |
0.2 | 0.0 (0.0; 0.1) |
0.5 (0.4; 0.7) |
| PLT-O (× 109/l) | NLA | 40 | 0.358 | 286 86–615 |
281 | 87 (86; 154) |
610 (437; 615) |
SPA-F = score of platelet aggregation; CI = confidence interval; WBC = white blood cells; RBC-I = red blood cell count by impedance measurement; HGB = haemoglobin; HTE = haematocrit; MCV = mean corpuscular volume; MCH = mean corpuscular haemoglobin; MCHC = MCH concentration; RDW-CV = red blood cell distribution width as a percentage; RET = reticulocytes; PLT-O = platelet count by optical measurement; NLA = not or little aggregated; HA = highly aggregated
Outliers: a24.5 × 109/l; b1.2 × 109/l; c1.83 × 109/l; d1.62 × 109/l; e1.67 × 109/l; f1.62 × 109/l; g86.9 × 109/l; h0.8%
No effect of analyser and anticoagulant
One missing datum
Table 2.
Reference intervals for feline specimens collected in CTAD and determined with the ProCyte DX analyser
| Analyte | SPA-F group | n | Normality, P | Median and range | Mean | 2.5th percentile (90% CI) | 97.5th percentile (90% CI) |
|---|---|---|---|---|---|---|---|
| WBC (× 109/l)* | NLA + HA | 80 a | 0.082 | 8.7 3.8–17.2 |
9.1 | 4.0 (3.8; 4.6) |
15.2 (14.0; 17.2) |
| Neutrophils (× 109/l)* | NLA + HA | 80 † | 0.000 | 3.2 1.5–10.8 |
3.7 | 1.7 (1.5; 1.8) |
8.8 (7.5; 10.8) |
| Lymphocytes (× 109/l)* | NLA + HA | 80 † | 0.019 | 4.3 1.2–10.4 |
4.4 | 1.2 (1.2; 1.5) |
10.2 (8.1; 10.4) |
| Monocytes (× 109/l)* | NLA + HA | 79b,† | 0.024 | 0.3 0.1–0.7 |
0.3 | 0.1 (0.1; 0.1) |
0.6 (0.5; 0.7) |
| Eosinophils (× 109/l)* | NLA + HA | 76c,d,e,f,† | 0.007 | 0.5 0.1–1.2 |
0.6 | 0.1 (0.1; 0.3) |
1.2 (1.0; 1.2) |
| RBC-I (× 1012/l)* | NLA + HA | 81 | 0.035 | 9.7 6.5–11.5 |
9.6 | 6.7 (6.5; 7.7) |
11.2 (11.1; 11.5) |
| HGB (g/l) | NLA | 80 | 0.657 | 133.4 96.3–170.5 |
133.0 | 96.9 (96.3; 109.5) |
166.1 (157.2; 170.5) |
| HTE (l/l) | NLA | 80 | 0.450 | 0.41 0.30–0.56 |
0.42 | 0.30 (0.30; 0.33) |
0.55 (0.51; 0.56) |
| MCV (fl) | NLA + HA | 81 | 0.246 | 43.6 37.2–56.3 |
43.5 | 37.3 (37.2; 38.0) |
52.6 (50.2; 56.3) |
| MCH (pg) | NLA + HA | 81 | 0.064 | 14.0 11.8–16.5 |
13.9 | 12.0 (11.8; 12.2) |
15.8 (15.4; 16.5) |
| MCHC (g/dl) | NLA + HA | 81 | 0.550 | 32.0 27.3–35.2 |
32.0 | 28.8 (27.3; 29.8) |
34.9 (34.0; 35.2) |
| RDW-CV (%) | NLA + HA | 80 g | 0.231 | 23.6 19.7–30.2 |
23.6 | 19.5 (18.2; 20.8) |
28.7 (26.7; 29.1) |
| RET (× 109/l) | NLA + HA | 80 h | 0.000 | 16.0 2.0–48.9 |
18.1 | 3.8 (2.0; 4.7) |
48.6 (42.8; 48.9) |
| RET (%) | NLA + HA | 80 i | 0.000 | 0.2 0.0–0.7 |
0.2 | 0.0 (0.0; 0.1) |
0.5 (0.4; 0.7) |
| PLT-O (× 109/l) | NLA | 80 | 0.042 | 288 130–601 |
298 | 139 (130; 149) |
527 (465; 601) |
SPA-F = score of platelet aggregation; CI = confidence interval; WBC = white blood cells; RBC-I = red blood cell count by impedance measurement; HGB = haemoglobin; HTE = haematocrit; MCV = mean corpuscular volume; MCH = mean corpuscular haemoglobin; MCHC = MCH concentration; RDW-CV = red blood cell distribution width as a percentage; RET = reticulocytes; PLT-O = platelet count by optical measurement; NLA = not or little aggregated; HA = highly aggregated
Outliers: a24.5 × 109/l; b1.2 × 109/l; c1.8 × 109/l; d1.6 × 109/l; e1.7 × 109/l; f1.6 × 109/l; g35.1%; h86.9 × 109/l; i0.8%
No effect of analyser and anticoagulant
One missing datum
Table 3.
Reference intervals (RIs) for feline specimens collected in EDTA and determined with the Sysmex XT-2000iV analyser
| Analyte | SPA-F group | n | Normality, P | Median and range | Mean | 2.5th percentile (90% CI) | 97.5th percentile (90% CI) | Previously reported RIs ADVIA 120 1 2.5th–97.5th percentiles |
|---|---|---|---|---|---|---|---|---|
| WBC (× 109/l)* | NLA + HA | 80 a | 0.082 | 8.7 3.8–17.2 |
9.1 | 4.0 (3.8; 4.6) |
15.2 (14.0; 17.2) |
7.73–18.6 |
| Neutrophils (× 109/l)* | NLA + HA | 80 † | 0.000 | 3.2 1.5–10.8 |
3.7 | 1.7 (1.5; 1.8) |
8.8 (7.5; 10.8) |
3.14–12.52 |
| Lymphocytes (× 109/l)* | NLA + HA | 80 † | 0.019 | 4.3 1.2–10.4 |
4.4 | 1.2 (1.2; 1.5) |
10.2 (8.1; 10.4) |
1.31–7.46 |
| Monocytes (× 109/l)* | NLA + HA | 79b,† | 0.024 | 0.3 0.1–0.7 |
0.3 | 0.1 (0.1; 0.1) |
0.6 (0.5; 0.7) |
0.13–1.08 |
| Eosinophils (× 109/l)* | NLA + HA | 76c,d,e,f,† | 0.007 | 0.5 0.1–1.2 |
0.6 | 0.1 (0.1; 0.3) |
1.2 (1.0; 1.2) |
0.06–2.21 |
| RBC-I (× 1012/l)* | NLA + HA | 81 | 0.035 | 9.7 6.5–11.5 |
9.6 | 6.7 (6.5; 7.7) |
11.2 (11.1; 11.5) |
– |
| RBC-O (× 1012/l) | NLA + HA | 81 | 0.021 | 9.4 6.3–11.2 |
9.2 | 6.6 (6.3; 7.4) |
10.8 (10.5; 11.2) |
5.92–11.16 |
| HGB (g/l) | NLA | 40 | 0.356 | 136.3 99.0–166.0 |
133.9 | 99.1 (99.0; 113.0) |
165.9 (158.4; 166.0) |
8.17–15.26 |
| HTE (l/l) | NLA + HA | 81 | 0.511 | 0.39 0.29–0.52 |
0.39 | 0.29 (0.29; 0.33) |
0.51 (0.47; 0.52) |
0.24–0.46 |
| MCV (fl) | NLA + HA | 81 | 0.609 | 41.1 34.3–53.2 |
41.3 | 34.4 (34.3; 35.3) |
49.3 (47.5; 53.2) |
36.96–54.98 |
| MCH (pg) | NLA + HA | 81 | 0.176 | 14.6 12.3–17.2 |
14.5 | 12.3 (12.3; 12.7) |
16.4 (16.1; 17.2) |
11.28–17.24 |
| MCHC (g/dl) | NLA + HA | 81 | 0.873 | 35.7 30.8–39.5 |
35.7 | 32.5 (30.8; 33.2) |
39.2 (38.5; 39.5) |
26.24–35.91 |
| RDW-CV (%) | NLA + HA | 81 | 0.129 | 24.0 19.6–33.0 |
24.1 | 19.7 (19.6; 21.0) |
29.3 (27.7; 33.0) |
13.81–21.11 |
| RDW-SD (fl) | NLA + HA | 81 | 0.000 | 28.0 24.8–48.1 |
28.6 | 24.9 (24.7; 25.8) |
40.6 (34.0; 48.1) |
– |
| RET (× 109/l) | NLA + HA | 80 g | 0.000 | 45.8 10.3–107.8 |
49.7 | 19.1 (10.3; 24.9) |
107.1 (90.3; 107.8) |
3.66–94.06 |
| RET (%) | NLA + HA | 80 h | 0.000 | 0.5 0.1–1.3 |
0.5 | 0.2 (0.1; 0.3) |
1.1 (1.0; 1.3) |
0.05–1.17 |
| IRF (%) | NLA | 40 | 0.037 | 6.8 0.7–18.8 |
8.0 | 0.7 (0.7; 1.5) |
18.7 (16.7; 18.8) |
– |
| LFR (%) | NLA | 40 | 0.037 | 93.2 81.3–99.3 |
92.0 | 81.3 (81.3; 83.6) |
99.3 (98.5; 99.3) |
– |
| MFR (%) | NLA | 40 | 0.081 | 5.6 0.0–13.9 |
6.1 | 0.0 (0.0; 1.5) |
13.8 (12.6; 13.9) |
– |
| HFR (%) | NLA + HA | 81 | 0.030 | 2.2 0.0–7.6 |
2.3 | 0.0 (0.0; 0.3) |
5.9 (5.0; 7.6) |
– |
| PLT-O (× 109/l) | NLA | 40 | 0.358 | 286 86–615 |
281 | 87 (86; 154) |
610 (437; 615) |
41.92–629.85 |
| PLT-I (× 109/l) | NLA | 40 | 0.233 | 180 33–520 |
189 | 33 (33; 76) |
516 (345; 520) |
– |
SPA-F = score of platelet aggregation; CI = confidence interval; WBC = white blood cell; RBC-I = red blood cell count by impedance measurement; RBC-O = red blood cell count by optical measurement; HGB = haemoglobin; HTE = haematocrit; MCV = mean corpuscular volume; MCH = mean corpuscular haemoglobin; MCHC = MCH concentration; RDW-CV = red blood cell distribution width as a percentage; RDW-SD = red blood cell distribution width as a coefficient of variation; RET = reticulocyte; IRF = immature reticulocyte fraction; LFR = low fluorescence ratio; MFR = medium fluorescence ratio; HFR = high fluorescence ratio; PLT-O = platelet count by optical measurement; PLT-I = platelet count by impedance measurement; NLA = not or little aggregated; HA = highly aggregated
Outliers: a24.5 × 109/l; b1.2 × 109/l; c1.8 × 109/l; d1.6 × 109/l; e1.7 × 109/l; f1.6 × 109/l; g149.5 × 109/l; h1.4%
No effect of analyser and anticoagulant
One missing datum
Table 4.
Reference intervals for feline specimens collected in CTAD and determined with the Sysmex XT-2000iV analyser
| Analyte | SPA-F group | n | Normality, P | Median and range | Mean | 2.5th percentile (90% CI) | 97.5th percentile (90% CI) |
|---|---|---|---|---|---|---|---|
| WBC (× 109/l)* | NLA + HA | 80 a | 0.082 | 8.7 3.8–17.2 |
9.1 | 4.0 (3.8; 4.6) |
15.2 (14.0; 17.2) |
| Neutrophils (× 109/l)* | NLA + HA | 80 † | 0.000 | 3.2 1.5–10.8 |
3.7 | 1.7 (1.5; 1.8) |
8.8 (7.5; 10.8) |
| Lymphocytes (× 109/l)* | NLA + HA | 80 † | 0.019 | 4.3 1.2–10.4 |
4.4 | 1.2 (1.2; 1.5) |
10.2 (8.1; 10.4) |
| Monocytes (× 109/l)* | NLA + HA | 79b, † | 0.024 | 0.3 0.1–0.7 |
0.3 | 0.1 (0.1; 0.1) |
0.6 (0.5; 0.7) |
| Eosinophils (× 109/l)* | NLA + HA | 76c,d,e,f,† | 0.007 | 0.5 0.1–1.2 |
0.6 | 0.1 (0.1; 0.3) |
1.2 (1.0; 1.2) |
| RBC-I (× 1012/l)* | NLA + HA | 81 | 0.035 | 9.7 6.5–11.5 |
9.6 | 6.7 (6.5; 7.7) |
11.2 (11.1; 11.5) |
| RBC-O (× 1012/l) | NLA + HA | 81 | 0.021 | 9.4 6.3–11.2 |
9.2 | 6.6 (6.3; 7.4) |
10.8 (10.5; 11.2) |
| HGB (g/l) | NLA | 80 | 0.556 | 139.7 100.1–177.1 |
138.5 | 103.5 (100.1; 114.0) |
173.2 (161.6; 177.1) |
| HTE (l/l) | NLA + HA | 81 | 0.511 | 0.39 0.29–0.52 |
0.39 | 0.29 (0.29; 0.33) |
0.51 (0.47; 0.52) |
| MCV (fl) | NLA + HA | 81 | 0.609 | 41.1 34.3–53.2 |
41.3 | 34.4 (34.3; 35.3) |
49.3 (47.5; 53.2) |
| MCH (pg) | NLA + HA | 81 | 0.176 | 14.6 12.3–17.2 |
14.5 | 12.3 (12.3; 12.7) |
16.4 (16.1; 17.2) |
| MCHC (g/dl) | NLA + HA | 81 | 0.445 | 34.8 30.4–38.3 |
34.7 | 31.5 (30.4; 32.4) |
38.2 (37.5; 38.3) |
| RDW-CV (%) | NLA + HA | 81 | 0.094 | 22.8 18.4–32.9 |
22.9 | 18.8 (18.4; 20.0) |
28.1 (27.1; 32.9) |
| RDW-SD (fl) | NLA + HA | 81 | 0.000 | 28.0 24.8–48.1 |
28.6 | 24.9 (24.7; 25.8) |
40.6 (34.0; 48.1) |
| RET (× 109/l) | NLA + HA | 80 g | 0.000 | 45.8 10.3–107.8 |
49.7 | 19.1 (10.3; 24.9) |
107.1 (90.3; 107.8) |
| RET (%) | NLA + HA | 80 h | 0.000 | 0.5 0.1–1.3 |
0.5 | 0.2 (0.1; 0.3) |
1.1 (1.0; 1.3) |
| IRF (%) | NLA | 80 | 0.000 | 5.8 0.7–21.2 |
6.5 | 1.0 (0.7; 1.4) |
20.6 (13.3; 21.2) |
| LFR (%) | NLA | 80 | 0.000 | 94.2 78.8–99.3 |
93.5 | 79.4 (78.8; 86.7) |
99.0 (98.6; 99.3) |
| MFR (%) | NLA | 80 | 0.002 | 4.5 0.4–17.1 |
5.2 | 0.5 (0.4; 0.7) |
16.5 (10.3; 17.1) |
| HFR (%) | NLA + HA | 81 | 0.000 | 1.2 0.0–5.3 |
1.3 | 0.0 (0.0; 0.0) |
4.9 (4.1; 5.3) |
| PLT-O (× 109/l) | NLA | 80 | 0.042 | 288 130–601 |
298 | 139 (130; 149) |
527 (465; 601) |
| PLT-I (× 109/l) | NLA | 80 | 0.179 | 213 20–535 |
220 | 44 (20; 70) |
452 (410; 535) |
SPA-F = score of platelet aggregation; CI = confidence interval; WBC = white blood cell; RBC-I = red blood cell count by impedance measurement; RBC-O = red blood cell count by optical measurement; HGB = haemoglobin; HTE = haematocrit; MCV = mean corpuscular volume; MCH = mean corpuscular haemoglobin; MCHC = MCH concentration; RDW-CV = red blood cell distribution width as a percentage; RDW-SD = red blood cell distribution width as a coefficient of variation; RET = reticulocyte; IRF = immature reticulocyte fraction; LFR = low fluorescence ratio; MFR = medium fluorescence ratio; HFR = high fluorescence ratio; PLT-O = platelet count by optical measurement; PLT-I = platelet count by impedance measurement; NLA = not or little aggregated; HA = highly aggregated
Outliers: a24.5 × 109/l; b1.2 ×109/l; c1.8 × 109/l; d1.6 × 109/l; e1.7 × 109/l; f1.6 × 109/l; g149.5 × 109/l ; h1.4%
No effect of analyser and anticoagulant
One missing datum
Results
Pre-analytical effects and a posteriori exclusion
Thirty-nine pairs of specimens had to be excluded because of inadequate tube-filling, presence of macroscopic clots or technical mishaps regarding at least one of the two sampled tubes. Thus, only 81 pairs of specimens could be used for RI determination. The platelet aggregation score was higher in EDTA than in CTAD tubes, with 41/81 and only 1/81 HA specimens, respectively. As platelet aggregation had significant effects on certain variables, only the NLA specimens were used to determine the RIs of these latter variables. The difficulty of sampling had a significant effect on SPA-F [analysis of variance (ANOVA) P <0.05); however, the differences were <0.5 (results not shown) and no trend could be seen.
Characteristics of the reference sample group
The reference sample group (n = 81) consisted of 37 females (17 intact and 20 neutered) and 44 males (12 intact and 32 neutered). The breed distribution was as follows: 75 domestic shorthair (92.7%), two Siamese (2.5%), one Blue Russian (1.2%), one Persian (1.2%), one crossbreed Birman (1.2%) and one cross-breed Siamese (1.2%). The median age was 25 months (ranging from 6 to 116 months). There was no effect of sex on age (Student’s t-test, P = 0.218), and the median ages in females and males were 28.0 and 22.5 months, respectively (Figure 1). Weight was only reported for 67 cats. The overall median weight was 4.4 kg (ranging from 1.9 to 9.5 kg), with females significantly lighter than males (Mann–Whitney test, P <0.001), and the medians in females and males were 3.7 and 4.9 kg, respectively. Weight was positively correlated with the age of the cats (ANOVA, P = 0.023).
Figure 1.
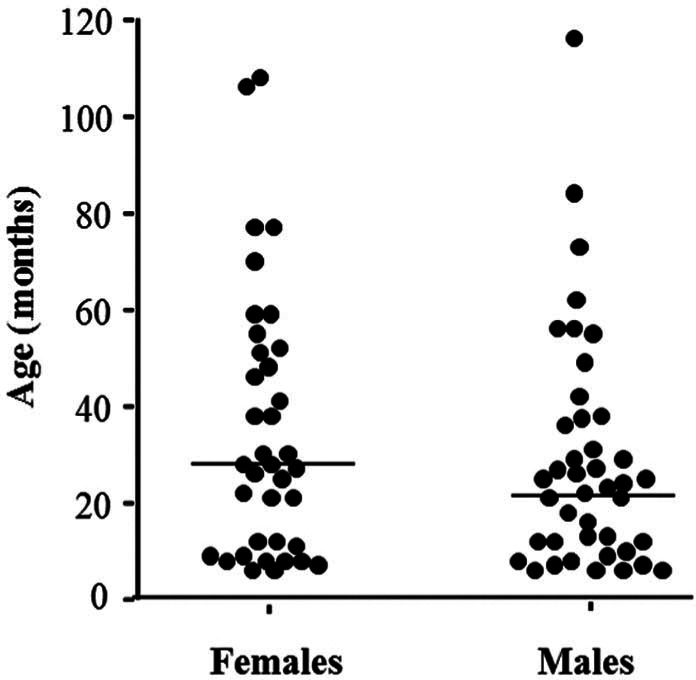
Distribution of ages and sexes of 81 cats (37 females and 44 males) sampled to establish haematological reference intervals for the Sysmex XT-2000iV (Sysmex) and ProCyte DX (IDEXX Laboratories) analysers. The horizontal bars indicate medians
RIs
No statistically significant difference was detected between duplicates, so the mean of each variable was used in the calculations. To facilitate subsequent use, the RIs are presented in Tables 1–4 for each analyser and anticoagulant. However, when no difference according to instrument and anticoagulant was observed for an analyte (highlighted with an asterisk in Tables 1–4), the results were pooled and the same RI indicated. When different RIs are indicated, the observed differences were statistically significant (Harris and Boyd test’s, │z│>│z*│). An effect of platelet aggregation was observed for HGB, HTE, LFR, MFR, IRF, PLT-I and PLT-O, so only NLA specimens were used to calculate the corresponding RI (see above). All values for outliers are indicated as footnotes to each table.
Effect of sex, age and weight
Statistically significant effects of sex were observed for the means of WBC, neutrophil, lymphocyte, monocyte, RBC-I and PLT-O counts, MCV, MCHC and RDW-CV (ANOVA, P <0.05). However, the only (male–female) differences higher than the arbitrarily selected threshold of 2% were observed for WBC, neutrophil, monocyte and lymphocyte counts (+7%, + 65%, + 50% and −18%, respectively). The effect of age was studied only within a subset of the feline population [cats up to the age of 5 years (n = 72)] because of the very low number of older cats. Age had statistically significant effects on WBC, lymphocyte, eosinophil and monocyte counts, MCV, MCH, RDW-CV and RETc (ANOVA, P <0.05). However, on visual inspection of the regression curves, notable changes were only observed for WBC, lymphocyte and monocyte counts, and for RDW-CV, with a negative correlation. A positive correlation with age was detected for MCV and MCH (Figures 2 and 3). The effect of weight was also studied in the same subset of cats ≤5 years old, and showed statistically significant changes for WBC, neutrophil, monocyte, RBC-I and RBC-O counts, HGB, HTE, RDW-SD, RETc, RET%, IRF, LFR and MFR (ANOVA, P <0.05). Similarly, visual inspection of the regression curves revealed notable changes only for WBC, neutrophil and monocyte counts (which were inversely correlated with weight), and RBC-I, RBC-O, HGB and HTE (which were positively correlated with weight) (see Figure 4).
Figure 2.
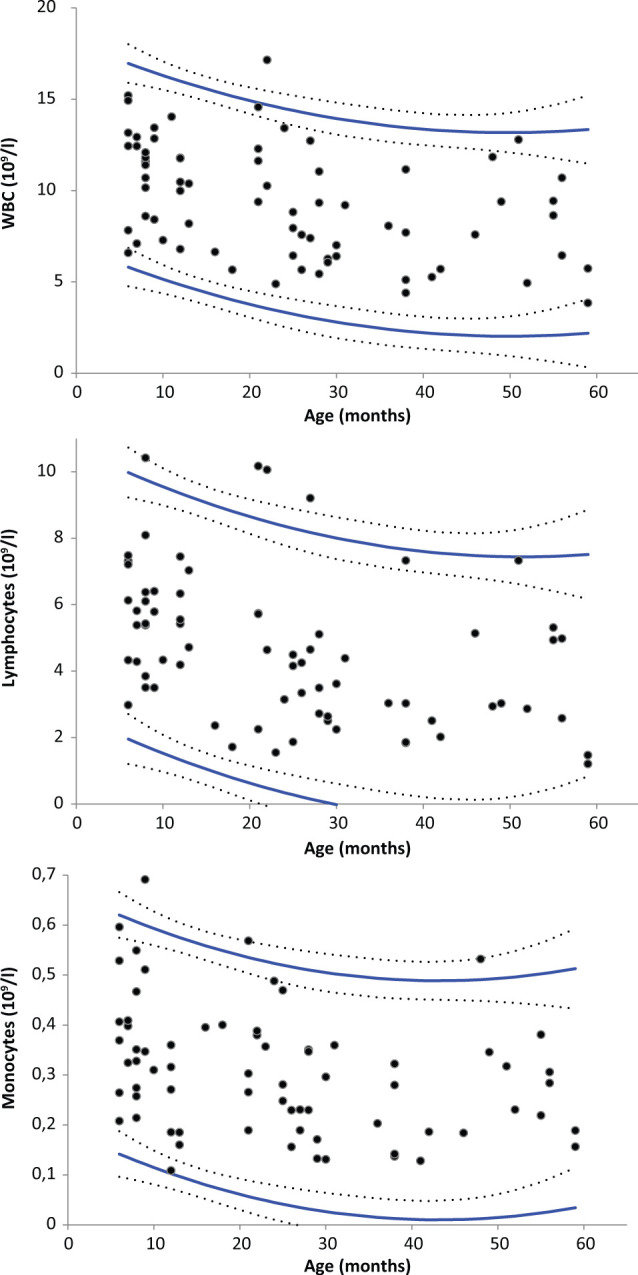
Regression-based reference intervals of feline white blood cell (WBC), lymphocyte and monocyte counts according to age with the Sysmex XT-2000iV (Sysmex) and the ProCyte DX (IDEXX Laboratories) analysers in EDTA and CTAD blood specimens. Reference limits (solid lines) and 90% confidence intervals (dotted lines). The outliers are the same as those listed in Tables 1–4
Figure 3.
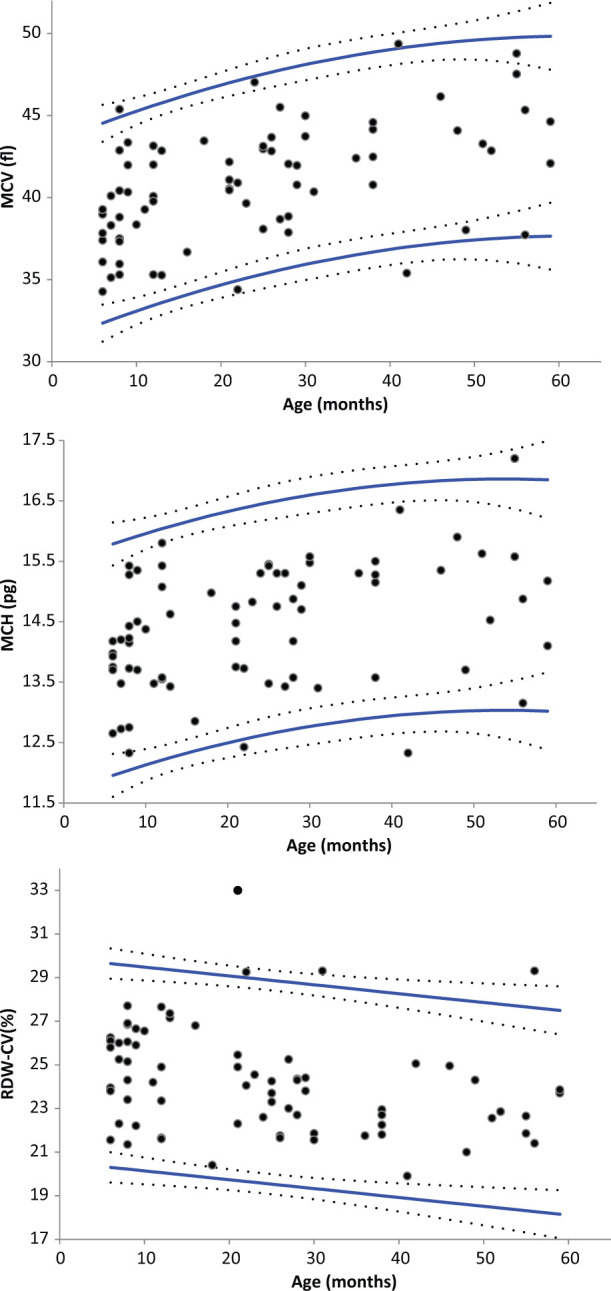
Regression-based reference intervals of feline mean corpuscular volume (MCV) and mean corpuscular haemoglobin (MCH) according to age with the Sysmex XT-2000iV analyser (Sysmex) in EDTA and CTAD blood specimens, and feline red blood cell distribution width as a percentage (RDW-CV) with the Sysmex XT-2000iV analyser in EDTA blood specimens. Reference limits (solid lines) and 90% confidence intervals (dotted lines). The outliers are the same as those listed in Tables 1–4
Figure 4.
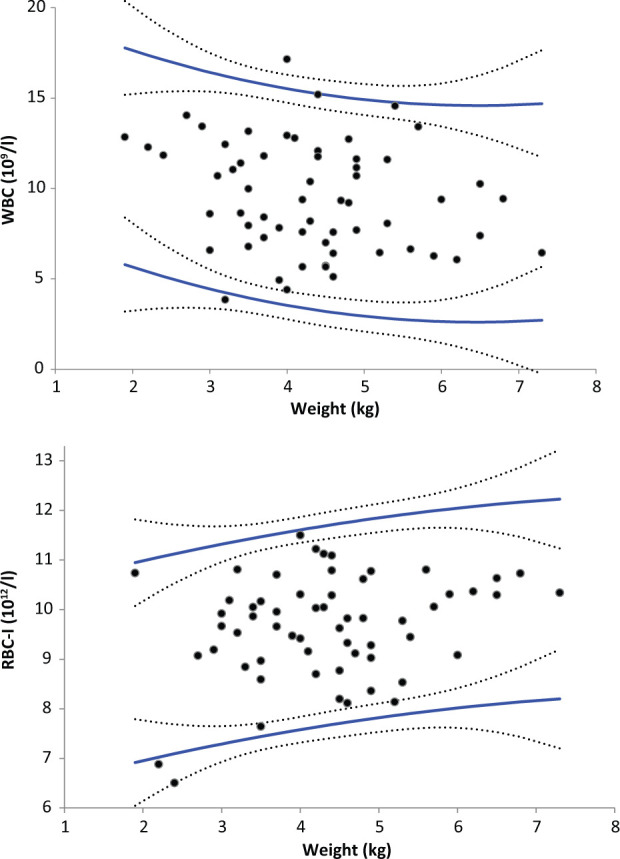
Regression-based reference intervals of feline white blood cell (WBC) and red blood cell by impedance measurement (RBC-I) counts according to weight with the Sysmex XT-2000iV (Sysmex) and the ProCyte DX (IDEXX Laboratories) analysers in EDTA and CTAD blood specimens. Reference limits (solid lines) and 90% confidence intervals (dotted lines). The outliers are the same as those listed in Tables 1–4
Discussion
This prospective study was designed according to ASVCP and IFCC–CLSI guidelines for the de novo establishment of RIs, and is the first one to integrate the score of platelet aggregation into the calculation of RIs for haematological analytes in cats.6,7
The determination of health status was based on multiple objective criteria, including a complete physical examination, a negative result in the diagnostic test for retroviral infection (FeLV and FIV), and a detailed questionnaire to eliminate any sick or subclinically ill animals. In summary, the studied population included mainly young, medicalised domestic shorthair cats, as the majority of cats were 6 months to 5 years old, but was quite representative of domestic healthy cats in France.
The total number of specimens was less than the 120 specimens usually considered as a minimum for the determination of RIs. However, this is a false interpretation of the recommendations, which state only that 120 is the minimal number to determine the CI of limits by a non-parametric method. Moreover, in the latest update of these recommendations, it is acknowledged that RIs can be determined with a smaller number of specimens, preferably with a non-parametric method for determination of the limits. This was the case here, where most RIs were determined in the reference sample group of 81 cats or in specific subsets (≥40 specimens) when the platelet aggregation score had an effect. In consequence, the CIs of RIs calculated for these subpopulations are also wider. In fact, only specimens that were NLA, that is, specimens associated with the arbitrary threshold of SPA-F <2 used in previous studies,4,5 were used to calculate the RIs for platelet aggregation-dependent analytes.
In this study, the difficulty of handling and sampling was statistically significant, but no clear trend could be highlighted. This statistically significant result was therefore considered as not clinically relevant. Also, susceptibility to platelet aggregation in cats seems to be more complex than a simple equation of stress and/or tube-filling. However, this scoring was subjective and could be improved by using objective criteria such as clinical and biological assessments of stress. 15
The two analysers used in this study have very similar technology (a mix of optical and impedance technology). However, some statistical differences were observed between the RIs obtained with the Sysmex XT-2000iV and the ProCyte DX analysers used in this study. The main differences concerned the MCV values, which were lower with the Sysmex XT-2000iV than with the ProCyte DX, and the RETc values, which were higher with the Sysmex XT-2000iV than with the ProCyte DX. Other, more moderate, differences were observed for MCH, MCHC, HGB and RET% values, which were higher with the Sysmex XT-2000iV than with the ProCyte DX, and for the HTE values, which were lower with the Sysmex XT-2000iV than with the ProCyte DX.
The RIs obtained in different studies are difficult to compare because of the different characteristics of the reference sample groups, and possible differences in pre-analytical conditions and analytical performances of the instruments. Nevertheless, we have chosen to compare the RIs obtained in our study with the Sysmex XT-2000iV analyser to the RIs obtained with the ADVIA 120 (data given in Table 3) — the analyser based on the most comparable technology and the closest reference population (by geographical location) to our analyser and study design, respectively. 1 All the differences concerning the leukocyte and erythrocyte populations could result from: (1) the number of cats included in the calculation of the RIs; (2) the selected reference sample group; and (3) the different technology, manufacturer’s calibration and software version. The lower limit of platelet count obtained with the Sysmex XT-2000iV is somewhat higher than with the ADVIA 120, whereas the upper limits are very similar, and this is probably owing to the more stringent procedure of eliminating specimens with platelet clumps adopted in this study.
The RIs obtained in CTAD cannot be compared with previous results, as this anticoagulant is not yet frequently used.
The most obvious differences between the RIs obtained in EDTA and CTAD specimens were quite similar for the ProCyte DX and the Sysmex XT-2000iV analysers, and were especially observed for platelet count, with (1) a high percentage of EDTA specimens showing platelet aggregation (these specimens being excluded from the calculations of the RIs); and (2) a lower reference limit with a wider 90% CI in NLA EDTA specimens than in CTAD specimens. These differences could be explained by the fact that (1) some platelet clumps could be present in this subset (particularly for specimens with 1 <SPA-F <2, which still exhibited some aggregation, that is, 15/40 in the EDTA group vs only 5/80 in the CTAD group); and (2) the RI in EDTA specimens was calculated on a subpopulation of cats that only included NLA specimens and was smaller (n = 40) than the same subpopulation of NLA CTAD specimens (n = 80).
No breed effect could be investigated as very few purebred cats were included in this study (4/81). The effect of sex was only significant for the WBC, neutrophil, monocyte and lymphocyte counts in our study. Moderate sex differences have been previously observed, with males having a higher HGB concentration and RBC count; there is some controversy regarding WBC counts. 16 The clearest difference reported in the literature is for the HGB concentration, but our results did not confirm this observation. 16 For the effect of age, this study showed a decrease of WBC, lymphocyte and monocyte counts, and RDW-CV, and an increase of MCV and MCH with age within a population composed solely of cats younger than 5 years of age. To our knowledge, very few studies have been performed on the effect of age on haematology in cats older than 1 year, but the similar variations of WBC and lymphocyte counts with age were also observed in a previous study performed on canine specimens. 17 This latter study also showed a decrease in neutrophil count with age in canine specimens, whereas our study did not reveal any variation of neutrophil count, but a decrease in monocyte count with age in feline specimens. Even if a tendency can be observed in our study, a new investigation needs to be carried out on older healthy cats to provide valuable information about the consequences of age on CBC variables. The effect of weight has not been mentioned before. We observed a relevant effect of weight on WBC, neutrophil, monocyte counts, RBC-I, and RBC-O counts, HGB and HTE. However, as weight was positively correlated with age in our study, it is not possible to confirm the sole effect of weight, and these observations require further investigation.
Conclusions
This is the first study to establish haematological RIs of feline blood specimens collected in CTAD and EDTA for two laser-based analysers, the Sysmex XT-2000iV and the ProCyte DX. Both analysers give very similar results, except for MCV and RETc, which could result, at least in part, from manufacturer ‘calibration’ and the software version used. The RIs in CTAD are almost the same as in EDTA, except for PLT count, thus confirming the interest of using this anticoagulant for feline blood samples. These RIs can be directly applied in veterinary laboratories or clinics where these analysers and anticoagulants are used in a similar population of cats. Breed effect could not be investigated in this study, but may exist, as reported for some biochemical analytes. 18 Moreover, this study underlines the importance for a laboratory to establish RIs either de novo or by transfer method when a new instrument is introduced in the laboratory.
Footnotes
Funding: This research received no specific grant from any funding agency in the public, commercial, or not-for-profit sectors.
The Sysmex XT-2000iV analyser and the ProCyte DX analyser used in this study were made available as a free loan by the manufacturers, which were not involved in any step or funding of this study.
Accepted: 14 October 2013
References
- 1. Moritz A, Fickenscher Y, Meyer K, et al. Canine and feline hematology reference values for the ADVIA 120 hematology system. Vet Clin Pathol 2004; 33: 32–38. [DOI] [PubMed] [Google Scholar]
- 2. Reynolds BS, Boudet KG, Faucher MR, et al. Comparison of a new device for blood sampling in cats with a vacuum tube collection system – plasma biochemistry, haematology and practical usage assessment. J Feline Med Surg 2007; 9: 382–386. [DOI] [PMC free article] [PubMed] [Google Scholar]
- 3. Norman EJ, Barron RC, Nash AS, Clampitt RB. Evaluation of a citrate-based anticoagulant with platelet inhibitory activity for feline blood cell counts. Vet Clin Pathol 2001; 30: 124–132. [DOI] [PubMed] [Google Scholar]
- 4. Granat F, Geffré A, Braun JP, Trumel C. Comparison of platelet clumping and complete blood count results with Sysmex XT-2000iV in feline blood sampled in EDTA or EDTA plus CTAD. J Feline Med Surg 2011; 13: 953–958. [DOI] [PMC free article] [PubMed] [Google Scholar]
- 5. Granat F, Geffré A, Bourgès-Abella N, et al. Changes in haematology measurements with the Sysmex XT-2000iV during storage of feline blood sampled in EDTA or EDTA plus CTAD. J Feline Med Surg 2013; 15: 433–444. [DOI] [PMC free article] [PubMed] [Google Scholar]
- 6. Friedrichs KR, Harr KE, Freeman KP, et al. ASVCP reference interval guidelines: determination of de novo reference intervals in veterinary species and other related topics. Vet Clin Pathol 2012; 41: 441–453. [DOI] [PubMed] [Google Scholar]
- 7. Clinical and Laboratory Standards Institute (CSLI). Defining, establishing, and verifying reference intervals in the clinical laboratory; approved guideline, document C28-A3. 3rd ed. Wayne: CLSI, 2008. [Google Scholar]
- 8. Lilliehook I, Tvedten H. Validation of the Sysmex XT-2000iV hematology system for dogs, cats and horses. II. Differential leukocyte counts. Vet Clin Pathol 2009; 38: 175–182. [DOI] [PubMed] [Google Scholar]
- 9. Lilliehöök I, Tvedten HW. Errors in basophil enumeration with 3 veterinary hematology systems and observations on occurrence of basophils in dogs. Vet Clin Pathol 2011; 40: 450–458. [DOI] [PubMed] [Google Scholar]
- 10. Virtanen A, Kairisto V, Irjala K, et al. Regression-based reference limits and their reliability: example on hemoglobin during the first year of life. Clin Chem 1998; 44: 327–335. [PubMed] [Google Scholar]
- 11. Virtanen A, Kairisto V, Irjala K, et al. Regression-based reference limits: determination of sufficient sample size. Clin Chem 1998; 44: 2353–2358. [PubMed] [Google Scholar]
- 12. Geffré A, Friedrichs K, Harr K, et al. Reference values: a review. Vet Clin Pathol 2009; 38: 288–298. [DOI] [PubMed] [Google Scholar]
- 13. Geffré A, Concordet D, Braun JP, Trumel C. Reference Value Advisor: a new freeware set of macroinstructions to calculate reference intervals with Microsoft Excel. Vet Clin Pathol 2011; 40: 107–112. [DOI] [PubMed] [Google Scholar]
- 14. Anon. Reference Value Advisor macroinstructions. http://www.biostat.envt.fr/spip/spip.php?article63 (2009, accessed September 2012).
- 15. Rand JS, Kinnaird E, Baglioni A, et al. Acute stress hyperglycemia in cats is associated with struggling and increased concentrations of lactate and norepinephrine. J Vet Intern Med 2002; 16: 123–132. [DOI] [PubMed] [Google Scholar]
- 16. Schalm OW. Normal values in blood morphology. In: Schalm OW. (ed). Veterinary hematology. Philadelphia: Lea & Febiger, 1961, pp 143–150. [Google Scholar]
- 17. Bourgès-Abella N, Geffré A, Concordet D, et al. Canine hematology reference intervals for the XT-2000iV analyzer. Vet Clin Pathol 2011; 40: 303–315. [DOI] [PubMed] [Google Scholar]
- 18. Reynolds BS, Concordet D, Germain CA, et al. Breed dependency of reference intervals for plasma biochemical values in cats. J Vet Intern Med 2010; 24: 809–818. [DOI] [PubMed] [Google Scholar]