

Abstract
Rapid and accurate identification of the intracellular pH is critical in the field of biomedicine. In this work, we effectively identified and quantified the intracellular pH and its distribution at the single-cell level using an image sensor based on an ordinary bright-field optical microscope that divided the cell staining images into their red (R) and blue (B) channels. The grayscale of the R and B channels was subjected to a ratiometric operation to generate ratiometric grayscale cell images of the microscope. A standard curve of pH against ratiometric grayscale curve was then obtained by incubating HeLa cells at pH 6.00–7.60 in a high concentration K+ ion buffer solution containing nigericin for obtaining certain intracellular pH values. A good correlation was evidenced between pH and the ratiometric grayscale of the R and B channels in the pH range of 6.00–7.60. Subsequently, the intracellular pH value of the A549 cells under the experimental conditions was measured to be 7.22 ± 0.01 by the method. Furthermore, the changes in the intracellular pH of HeLa cells stimulated with hydrogen peroxide were sensitively monitored, which demonstrated the applicability of the method. Due to its ease of use, the developed colorimetric microscopy pH detection and monitoring method provide prospects for pH-related single-cell studies.
1. Introduction
Cell pH value is an important index, involved in the regulation of several basic physiological and pathological processes within cells, including cell proliferation, apoptosis, and ion transport.1−3 Abnormalities in the intracellular pH can disrupt pH homeostasis and impede normal cellular activity, leading to the development of a variety of disorders such as Alzheimer’s disease, stroke, and cancer.4−6 It has been reported that in cancer tissues, glycolytic actions within cancer cells cause a pH reversal, with cancer cells having a higher pHi (pH intracellular) and a lower pHe (pH extracellular) than normally differentiated cells.7,8 As a result, quick and effective monitoring of pHi is critical for understanding illness pathophysiology and creating appropriate therapeutic methods.
To date, diverse pHi detection technologies, such as nuclear magnetic resonance, electrochemical approaches, and fluorescence imaging, have been developed for extensive studies on pH-related disease processes and therapeutic methods.9−11 Because of their visibility, specificity, and ease of operation, ratiometric fluorescence methods based on fluorescent dyes for pHi measurement have been frequently employed.12 Fluorescent dyes convert an input chemical signal into an optical signal output and have become an important tool in biomedical research, particularly for visual detection of cell activities.13 Especially, the ratiometric fluorescence approach yields two distinct emission peaks that can be used to generate self-calibrated ratiometric fluorescence signals and hence increase detection accuracy.14 For example, Feng’s group15 created a lysosomal pH-detecting ratiometric fluorescence nanosensor, which is capable of responding sensitively to the pH range (3.0–8.0) under illumination at 415 and 555 nm and has a lysosome-targeting capability. Ghosh et al.16 built a pH nanoprobe based on FRET using nanoparticles as the donors (excitation/emission 980/540 nm, green channel) and orange fluorescent protein as an acceptor (excitation/emission 548/566 nm, red channel), the probe of which can penetrate deeply at 980 nm excitation, overcoming the limits imposed by the limited penetration depth of the UV excitation, phototoxicity, and interference from background autofluorescence.
In addition, a variety of biochemical indicator tests often use image-color-based analysis techniques. Yu et al.17 developed a method for measuring the intracellular serum glucose concentration using R-CDs (Rhodamine B carbon dots) and B2O3. The approach involves the use of a smartphone’s RGB feature to process the intensity of the green channel of color photos and UV lamps to monitor the color change of the R-CDs and B2O3 gel’s fluorescence. By using bromothymol blue (BTB) as a pH indicator, Jin’s group18 developed a colorimetric imaging method for pH detection at the subcellular level based on ordinary visible light bright-field microscope with single-cell spectral resolution. The method acquires cell staining images and determines the pH profiling of cells and subcellular pH values based on the color difference of these images combined with the displacement of the UV-absorption spectroscopy peak positions.
Inspired by these studies, in this study, we propose herein a method for detecting cell pHi, using the grayscale ratio of R to B color channels from BTB-stained HeLa images. Through analysis of the relationship between the pHi of HeLa cells and the grayscale ratio of the two channels, the working curve of grayscale ratio with pH can be obtained to enable sensitive pHi recognition and detection at the single-cell level. By using the method, the distribution of pH in the cytoplasm, organelles, and other regions of cells can be easily identified in the grayscale pseudocolor pictures of stained cells. Furthermore, pH fluctuations in HeLa cells stimulated with H2O2 were observed. The developed approach has great promise for differentiating and diagnosing cancers on the cell level due to the variation in the intracellular pH between healthy and cancer cells.
2. Experimental Section
2.1. Cell Culture and Cytotoxicity Assay
The cell viability was determined by the CCK-8 assay according to the manufacturer’s instructions. HeLa cells were cultured in Dulbecco’s modified Eagle’s medium (DMEM) including high glucose supplemented with 10% fetal bovine serum (FBS), 1% penicillin–streptomycin with 5% CO2 at 37 °C. The cytotoxicity of bromothymol blue indicator (BTB) on HeLa cells was evaluated by the CCK-8 assay. Briefly, HeLa cells were seeded in a 96-well plate in a cell medium overnight. After incubated with different concentrations of BTB (0.10, 0.25, 0.50, and 1.00 μg/mL) for 24 h, the culture media were replaced with the DMEM (200 μL) containing CCK-8 (10 μL). One hour later, the absorbance at 450 nm was determined using an enzyme meter. Every experiment was run in triplicate, and the results were averaged.
2.2. Ratio Grayscale Imaging and Static Analysis
Bright field images of the BTB-stained cells were captured and stored in TIF format by using an ordinary optical microscope (OLYMPUS CKX53) with an image sensor (Sony IMX178). The light intensity was adjusted, and the magnification was fixed to 20×. The steps for processing images of the BTB-stained cells for quantitative and qualitative analysis of pHi are shown in Figure S1. All images were processed by threshold segmentation to remove background area, red (R) and blue (B) color channel splitting; grayscale ratio images were obtained from R dividing B channels; and pseudocolor color assignment was performed via the Fiji software.
2.3. Calibration of Intracellular pH
The cells were incubated with five sets of high concentration K+ solutions (120 mM KCl, 30 mM NaCl, 1 mM NaH2PO4, 5 mM glucose, and 20 mM HEPES) containing 10 μM nigericin (an ion carrier that equalizes the concentration of potassium ions inside and outside the cell, thereby equalizing the pH inside and outside the cell)19 at pH 6.00, 6.40, 6.80, 7.20, and 7.60 for cell staining and colorimetric analysis of the stained cells. After the high concentration of K+ buffer solution was added to six-well plates with uniform cell density, the cells were stained for 10 min with 0.25 mg/mL BTB indicator. The indicator was then removed, and the cells were photographed under an optical microscope. To extract the grayscale of the cells under the R and B channels of the cells images and compute the ratio of the grayscale of the two channels (GR/GB), the R and B channels of the images were split using Fiji software. This approach allows for the construction of a standard curve that plots GR/GB against pHi.
2.4. Intracellular pH Determination
We chose A549 cells for the experiment. When the cells suspension reached a uniform density and was in good condition, the media was withdrawn from a six-well plate. Then, 0.25 mg/mL of the BTB indicator was added, the mixture was incubated in the CO2 incubator, and the excess indicator solution was aspirated after 10 min. Then, the images of the stained A549 and HeLa cells were obtained by using the optical microscope. The average intracellular pH of the cells was examined after splitting the R and B channels of the images and calculating the grayscale ratios of these two channels by using the obtained curve of pH versus grayscale ratio.
2.5. Monitoring of the pHi of HeLa Cells under Drug Stimulation
HeLa cells were stimulated with 100 μM H2O2 for 20, 40, and 60 min, respectively, in order to examine the changes in pHi under H2O2 stimulation. The cells were then incubated with the blank control (no drug stimulation was applied) and then stained with BTB. To examine the variations in pHi under H2O2 stimulation, cell staining images were obtained, and the grayscale ratios of R and B channels at various times under H2O2 stimulation were calculated.
3. Results and Discussion
3.1. Detection Method and Principle
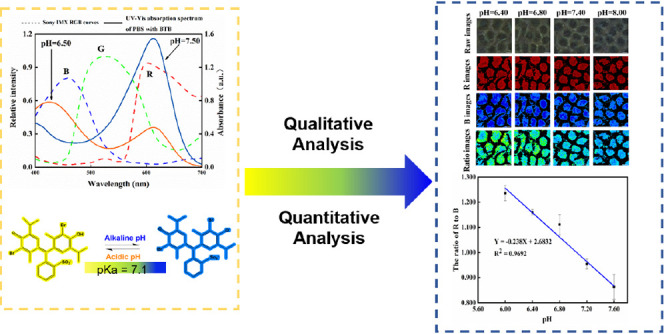
As shown in Scheme 1, cancer cells have a unique pH regulatory mechanism that causes pHi to be alkaline in comparison to that of normal cells. This mechanism is mediated by plasma pumps on the cell membrane, such as NHE1 and MCT, which pump excess acid out of the cell.20 When BTB is protonated or deprotonated, it manifests as yellow or blue in solution,21 while it appears blue-green in neutral solution. The interaction of the visible area BTB with cells offers new insights into cellular imaging pH detection as well as early cancer cell identification because of the variations in intracellular pH and the heterogeneity between cells.
Scheme 1. Schematic of Microscopic Colorimetric Single-Cell pH Imaging and Detection with Bromothymol Blue as an Indicator.

BTB is a triphenylmethane-type dye with a dissociation constant pKa of 7.1,22 and a pH range of 6.0–7.6, covering the pH range of most cell physiological conditions.23 The color of the solutions containing BTB changes from yellow to green and finally to dark blue when the solution is oxidized to acidic basic. As depicted in Figure 1A, there are two BTB absorption peaks in the visible region when the solution pH switched from alkaline to acidic. The two peaks are located at approximately wavelengths of 440–400 and 615 nm, and the intensity of the absorption also varies with the solution pH. As a result, the effect of difference amplification in pH can be realized by quantifying pH using the absorption intensity of a single peak, or by quantifying pH using the ratio of the absorption intensities of the two absorption peaks (Figure S2). The three-dimensional reconstruction of HeLa cells with and without BTB stained under a confocal laser scanning microscope is presented in Figure S3, which was manifested that the BTB indicator penetrated through the cell membrane into the cell. In the experiment, the SONY IMX178 image sensor was used to capture the cells images, as illustrated in Figure 1B. The sensor’s front is coated in an orderly distributed color filter array (CFA), which allows only particular light wavelengths to pass through and reach the sensor.24 In the imaging, each pixel point is assigned a single-color component for the red, green, and blue colors. The distinct wavelength range of the three colors are 700–605, 560–500, and 480–435 nm,25 respectively. The blue and yellow colors of BTB wavelengths in the UV–visible absorption spectrum, as depicted in Figure 1A, match the R and B channels of the photosensitivity curve of the image sensor.
Figure 1.

(A) Spectral sensitivity characteristic curves of the image sensors plotted against the UV–Vis absorption spectra of 10 mM PBS with BTB (pH = 6.5, pH = 7.5); (B) diagram showing how a color filter array (CFA) transmits light selectively in certain areas.
As a result, light falling within this wavelength band can pass through the RGB filter array of the image sensor and be detected, forming color images. Through the differentiating treatment of image colors, the image sensor can perform the same function as the UV spectrophotometer for monitoring the absorption intensity at a particular wavelength. It may also be used as an alternative for detecting light intensity at a particular wavelength. In this study, in doing so, the local pH variation of cells could correlate with the cell images by the method. Therefore, the color corresponding to the BTB UV–visible absorption peak can be amplified and used to indicate the pHi, and the cellular pH can be quantified by the ratio of the R to B channel grayscale of the cell images.
3.2. pH Response of BTB
In the experiment, eight sets of 0.1 mM PBS solutions were prepared in six-well plates with the final concentration of BTB of 0.25 mg/mL, and varied pH values of 6.00, 6.40, 6.60, 6.80, 7.00, 7.2, 7.40, and 7.60.
The images were acquired using the microscope, which maintained a dark environment and changed the light source from dark to bright for 10 groups. This was done in order to investigate the pH responsiveness of the BTB and the impact of the microscope light source on image analysis during image acquisition. After the R and B channels of each batch of the images were split out, a ratio operation was carried out. As illustrated in Figure 2, the GR/GB decreased when the PBS solution was changed from acidic to alkaline. As a result, the pH of the solution can be determined by using the color ratios of the images produced with BTB staining. However, when the light source of the microscope was changed, the grayscale ratio value remained constant at pH 7.00 for the PBS solution, and the variability in the grayscale ratios under the various light sources was 0.22. It demonstrated that the microscope light source intensity had no bearing on the analysis of the grayscale ratios of the images. To guarantee consistency of the experiments, images were taken by consistently adjusting the light source to the specified brightness, as the cell outlines were not covered and the contours of the cells were clearly discernible.
Figure 2.
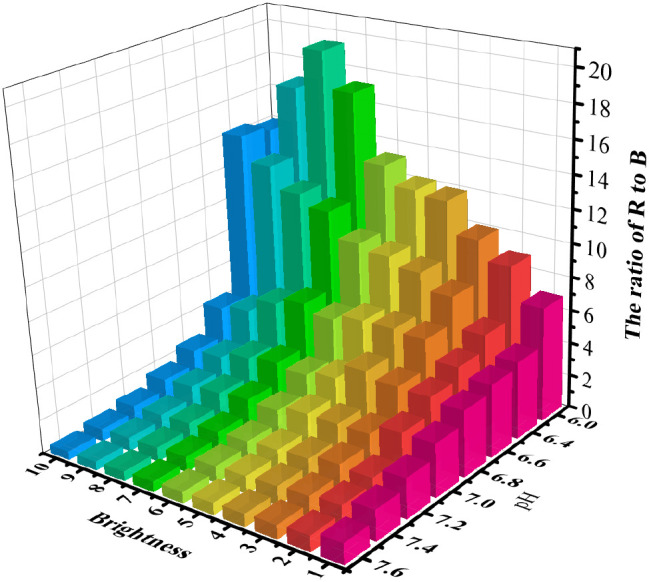
Histograms of the grayscale ratio of PBS buffer solution at gradient pH values from acidic to alkaline stained with BTB under various microscope light source intensities.
3.3. Optimization of Cell Staining Conditions
As the level of toxicity and cell coloration of BTB are critical for its biological applications, the cells were incubated with four concentrations of the BTB indicator to determine the ideal working concentration of BTB. The concentration effect of BTB on cell viability at 0.10, 0.25, 0.50, and 1.00 mg/mL was investigated using the standard CCK-8 test. As shown in Figure 3A, BTB has minimal toxicity toward HeLa cells and be useful for determining the pHi. The cell viability maintained over 90% when the HeLa cells were incubated with BTB at concentrations of 0.10, 0.25, 0.50, and 1.00 mg/mL.
Figure 3.

(A) Histogram of cell viability of four concentrations of BTB acting on HeLa cells; (B) Stained images of HeLa cells incubated with BTB at concentrations of 0.10, 0.25, 0.50, and 1.00 mg/mL for 5, 10, 30, and 60 min.
The BTB staining in HeLa cells gradually became obvious with increasing BTB concentration and incubation time, as shown in Figure 3B. As the BTB concentration and incubation period increased, the degree of color development and cell viability were observed. After 1 h of incubation, the cells were exposed to the varied concentrations of BTB. At BTB concentration of 0.25 mg/mL, the majority of the cells remained viable and the BTB was evenly distributed within the cells. At BTB concentration of 0.10 mg/mL, the level of BTB internalization was superficial and comparable to that of the control group, while at BTB concentrations of 0.50 and 1.00 mg/mL, the degree of yellowness of certain regions tended to be the extent of the color of the BTB itself within the majority of the cells. However, the majority of the cells were spherical at BTB concentration of 1.00 mg/mL, indicating some toxicity to the cells.18 Based on cell viability and BTB-stained intensity, the ideal BTB working concentration for cells was ultimately found to be 0.25 mg/mL with an incubation time of 10 min.
3.4. Calibration of Intracellular pH
We further evaluated the pH responsiveness of BTB in HeLa cells in the presence of nigericin. Experimentally, the pH levels within and outside the cells were constant in the presence of nigericin, since the concentration of sodium ions inside and outside the cells reached equilibrium after 10 min.26 HeLa cells were first incubated and stained by BTB for 10 min, and the excess indicator solution was then removed for cell imaging. In the experiment, the high concentration K+ buffer solutions containing 10 μM nigericin were prepared, and the pH values were adjusted to 6.00, 6.40, 6.60, 6.80, 7.20, 7.60, and 8.00, respectively. One milliliter of each of the high concentration K+ buffer and 0.50 mg/mL BTB indicator at different pH values were subsequently added to the six-well plate, respectively.
The high concentration of K+ buffer solution was used to reach intracellular pH values of 6.60 and 7.60, and the cells were stained with BTB to check the extent of deviation of the average grayscale ratio of multiple cells from that of individual cells when processing the cells images. The R and B channels of the BTB-stained images were split and subjected to grayscale ratio analysis to determine the differences in grayscale ratios between images containing multiple cells and individual cells. The cells images were acquired and intercepted at a 500 × 500-pixel size. Typically, 30 individual cells images were obtained from the two sets of cells staining images after the pH incubation. As shown in Figure 4A, the distribution of grayscale ratios within a single cell was more concentrated at 0.923 when the intracellular pH was 7.60. It is possible to perform the averaged operation directly on the grayscale ratios of the images containing multiple cells when processing and analyzing the stained images, as shown in Figure 4B, where the results of the grayscale ratios of the stained images containing multiple and single cells were highly consistent when the external intracellular pH was 6.60 and 7.60.
Figure 4.

(A) Scatterplot of the GR/GB distribution for individual cell pictures of HeLa cells at pH 7.60; (B) HeLa cells at pH 6.60 and 7.60 displayed as GR/GB histograms of images compared with single-cell screenshots; (C) Plot of pH versus grayscale ratios of cell staining images of HeLa cells; (D) Staining images and ratiometric grayscale pseudocolor maps of HeLa cells incubated in gradient pH high concentration potassium ion buffer solution, scale bar: 20 μm.
Subsequently, the intracellular pH was measured through BTB staining using high concentration K+ buffer solutions containing nigericin at pH 6.00, 6.40, 6.80, 7.20, and 7.60, respectively, to investigate the viability of the image grayscale ratio approach for measuring the pHi at the single-cell level. As shown in Figure 4C, the correlation curve of the ratios of grayscale R and B channels with pH shows that the GR/GB values were 1.25 at pH 6.00 and 0.85 at pH 7.60, respectively. In other words, the grayscale ratio of BTB-stained cell images at pH 6.00 is approximately 1.5 times greater than that at pH 7.60. The GR/GB of BTB-stained cell images showed a strong correlation with pH in the range of 6.00–7.60. As the pHi increases from 6.40 to 7.60, the degree of redness in the R-channel cytosol gradually decreases, while the degree of blueness in the B-channel cytosol gradually increases. However, the degree of change was not evident when analyzed from the change in the grayscale value from a single channel. The images of R, B, and GR/GB were then subjected to pseudocolor assignment, as shown in Figure 4D. When the degree of blue increases, the degree of green progressively weakness, as a result, the GR/GB considerably changed inside the ratiometric grayscale pseudocolor image, as illustrated in Figure 4D. As the pH of cells increased, the ratiometric grayscale of the R and B channels in the HeLa cell images stained with BTB decreased gradually. Consequently, a good correlation was observed between the pHi and the grayscale ratios of the stained cells images, and the BTB enabled reliable sensing of the pH signal at the single-cell level.
3.5. pHi Identification of A549 Cells
In this study, the pHi of the A549 cells was further determined by the BTB staining in order to investigate the generalizability of the method. The HeLa pseudocolor map shows a slightly greater degree of blue coloration than that of the A549 pseudocolor map, as shown in Figure 5. The pH values of the two cell types were found to be 7.31 ± 0.03 and 7.22 ± 0.01, respectively, while the average pH values obtained from single intact cells were more in line with previously reported values,27,28 indicating the variability and diversity of pH within different cell types. Due to intracellular glycolytic reactions in cancer cells, where lactate, pyruvate, and protons accumulate as a result of anaerobic respiration of glycogen and are pumped out of the cell in response to altered metabolism in cancer cells, resulting in a weakly alkaline intracellular profile, and HeLa and A549 cells have slightly different weakly alkaline pH levels.29
Figure 5.
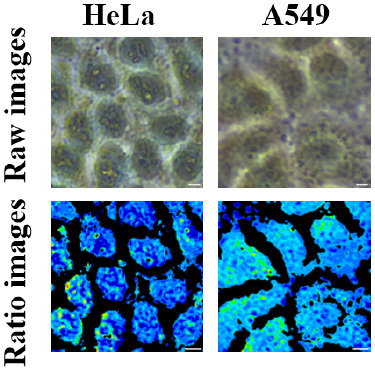
Images stained and pseudocolor maps in ratiometric grayscale for pH detection of HeLa and A549 cells, scale bar: 10 μm.
3.6. Monitoring pHi of Cells under Drug Stimulation
To explore the potential applications of the approach for cell pH sensing, the intracellular pH variation of HeLa cells was measured after stimulation with H2O2. According to a previous report,30 H2O2 causes lysosomal permeability increase in HeLa cells, and as a result, the pH of the lysosomes will steadily increase upon the external addition of H2O2. The UV–vis absorption spectra of BTB at H2O2 concentration of 0.1 mM was measured in 15 min. It can be seen from Figure S4 that the absorption peaks of BTB with and without 0.1 mM H2O2 at different times did not shift or decrease, which indicated the mixture of BTB and 0.1 mM H2O2 did not disrupt the structure of BTB to change pH tested. In the experiments, subsequently, following an increasing 20–40–60 min incubation with 100 μM H2O2, cell staining images were obtained using 0.25 mg/mL BTB staining. The intracellular grayscale ratio images of the tested cells showed that the green areas were greater than the blue areas in the absence of H2O2 stimulation. As the duration of H2O2 stimulation increased, the degree of blue region in the pseudocolor images of the HeLa cells steadily increased, while the degree of green gradually increased (Figure 6A).
Figure 6.

(A) Images stained and pseudocolor maps in ratiometric grayscale for pH detection of HeLa cells after 100 μM H2O2 stimulation, scale bar: 20 μm; (B) Plots of intracellular pH changes in HeLa cells stimulated with 100 μM H2O2 for time periods of 0, 20, 40, and 60 min.
Based on the obtained working curve, after 40 min of H2O2 induction, the intracellular pH of HeLa cells stimulated with H2O2 was found increased to 7.51. As shown in Figure 6B, the intracellular pH increased rapidly and dramatically compared with that at 0 min, and the change in pH leveled off during the stimulation time ranging from 20 to 60 min. The results are consistent with the trend of changes reported by Lee et al.,31 who demonstrated the applicability and reliability of the grayscale ratio-based microscope method for pH detection of cells.
4. Conclusions
Important activities including cell division, death, and ion transport depend on pHi. The typical physiological activities of a cell can be affected by even minute variations in pH. Monitoring pHi can improve the efficacy of illness diagnosis and treatment by more clearly revealing physiological and pathological processes. We used the BTB as a pH indicator to measure intracellular pH by ordinary optical microscopy and by comparing the grayscale of R with that of B channels. Indeed, prior research32 has demonstrated that the ambient conditions can impact the pKa of the indicator, and numerous biomolecules within the cell play a more intricate function. However, based on the experimental findings, BTB can still be used to represent pHi. With a typical pKa value of 7.1, the visible area pH indicator BTB is appropriate for physiological pH sensing in vitro at most cellular levels. Considering its low cytotoxicity, low cost, and large grayscale contrast, the method was successfully applied for imaging of intracellular pH, and monitoring intracellular pH fluctuations during H2O2 treatment, the pHi of HeLa and A549 cells were determined to 7.31 ± 0.03 and 7.22 ± 0.01, which were consistent with previous studies, with good accuracy. Also, this approach can be expanded for use in detecting and resolving the subcellular pH because of its tiny 0.13 μm × 0.13 μm pixel dot size, and the BTB is very useful for differentiating cancer cells from healthy cells since the pHi and pHe are opposite for cancer cells and healthy cells. By presenting high-contrast color signals, the exceptional “differentiating” ability of the BTB will allow it to distinguish between the tumor from the surrounding healthy cells. Potential biomedical applications of the method include early cancer differentiation and intracellular pH monitoring during medication stimulation or treatment.
Acknowledgments
This work was supported by the National Natural Science Foundation of China (21974097 and 21675147).
Supporting Information Available
The Supporting Information is available free of charge at https://pubs.acs.org/doi/10.1021/acsomega.4c01153.
Details about the reagent, apparatus, and preparation for the BTB indicator; additional Figures (S1 to S4) are also provided (PDF)
The authors declare no competing financial interest.
Supplementary Material
References
- Zheng S. P.; Jiang J. J.; Van Der Lee A.; Barboiu M. A voltage-responsive synthetic cl–-channel regulated by pH. Angew. Chem., Int. Ed. 2020, 132 (43), 19082–19088. 10.1002/anie.202008393. [DOI] [PubMed] [Google Scholar]
- Zhang K.; Ma Y.; Wang D.; Liu J.; An J.; Li Y.; Ma C.; Pei Y.; Zhang Z.; Liu J.; et al. In vivo activation of T-cell proliferation by regulating cell surface receptor clustering using a pH-driven interlocked DNA nano-spring. Nano Lett. 2022, 22 (5), 1937–1945. 10.1021/acs.nanolett.1c04562. [DOI] [PubMed] [Google Scholar]
- Yang R.; He X.; Niu G.; Meng F.; Lu Q.; Liu Z.; Yu X. A single fluorescent pH probe for simultaneous two-color visualization of nuclei and mitochondria and monitoring cell apoptosis. ACS Sens. 2021, 6 (4), 1552–1559. 10.1021/acssensors.0c02372. [DOI] [PubMed] [Google Scholar]
- Decker Y.; Németh E.; Schomburg R.; Chemla A.; Fülöp L.; Menger M. D.; Liu Y.; Fassbender K. Decreased pH in aging brain and Alzheimer’s disease. Neurobiol. Aging 2021, 101, 40–49. [DOI] [PubMed] [Google Scholar]
- Mao G.-J.; Liang Z.-Z.; Gao G.-Q.; Wang Y.-Y.; Guo X.-Y.; Su L.; Zhang H.; Ma Q.-J.; Zhang G. A photostable Si-rhodamine-based near-infrared fluorescent probe for monitoring lysosomal pH during heat stroke. Anal. Chim. Acta 2019, 1092, 117–125. 10.1016/j.aca.2019.09.053. [DOI] [PubMed] [Google Scholar]
- Schwartz L.; Peres S.; Jolicoeur M.; Da Veiga Moreira J. Cancer and Alzheimer’s disease: intracellular pH scales the metabolic disorders. Biogerontology 2020, 21, 683–694. 10.1007/s10522-020-09888-6. [DOI] [PubMed] [Google Scholar]
- Boedtkjer E.; Pedersen S. F. The Acidic Tumor microenvironment as a driver of cancer. Annu. Rev. Physiol. 2020, 82, 103–126. 10.1146/annurev-physiol-021119-034627. [DOI] [PubMed] [Google Scholar]
- Li Z.; Yu C.; Chen Y.; Zhuang Z.; Tian B.; Liu C.; Jia P.; Zhu H.; Sheng W.; Zhu B. A novel water-soluble fluorescent probe with ultra-sensitivity over a wider pH range and its application for differentiating cancer cells from normal cells. Analyst 2019, 144 (23), 6975–6980. 10.1039/C9AN01504C. [DOI] [PubMed] [Google Scholar]
- Phyo P.; Gu Y.; Hong M. Impact of acidic pH on plant cell wall polysaccharide structure and dynamics: Insights into the mechanism of acid growth in plants from solid-state NMR. Cellulose 2019, 26, 291–304. 10.1007/s10570-018-2094-7. [DOI] [Google Scholar]
- Song R.; Xiong Q.; Wu T.; Ning X.; Zhang F.; Wang Q.; He P. Real-time monitoring of extracellular pH using a pH-potentiometric sensing SECM dual-microelectrode. Anal. Bioanal. Chem. 2020, 412, 3737–3743. 10.1007/s00216-020-02625-5. [DOI] [PubMed] [Google Scholar]
- Xu W.; Lu S.; Chen Y.; Zhao T.; Jiang Y.; Wang Y.; Chen X. Simultaneous color sensing of O2 and pH using a smartphone. Sens. Actuators, B 2015, 220, 326–330. 10.1016/j.snb.2015.05.088. [DOI] [Google Scholar]
- Banik D.; Manna S. K.; Maiti A.; Mahapatra A. K. Recent advancements in colorimetric and fluorescent pH chemosensors: From design principles to applications. Crit. Rev. Anal. Chem. 2023, 53 (6), 1313–1373. 10.1080/10408347.2021.2023002. [DOI] [PubMed] [Google Scholar]
- Kazan J. M.; Lukacs G. L.; Apaja P. M.; Pause A. Single Cell Fluorescence ratio image analysis for studying ESCRT function in receptor trafficking. Methods Mol. Biol. 2019, 1998, 93–103. 10.1007/978-1-4939-9492-2_7. [DOI] [PubMed] [Google Scholar]
- Diwu Z. W.; Chen C. S.; Zhang C.; Klaubert D. H.; Haugland R. P. A novel acidotropic pH indicator and its potential application in labeling acidic organelles of live cells. Chem. Biol. 1999, 6 (7), 411–418. 10.1016/S1074-5521(99)80059-3. [DOI] [PubMed] [Google Scholar]
- Li S.; Song X.; Wang Y.; Hu Z.; Yan F.; Feng G. Developed a ratiometric fluorescence pH nanosensor based on label-free carbon dots for intracellular lysosome imaging and water pH monitoring with a smartphone. Dyes Pigm. 2021, 193, 109490. 10.1016/j.dyepig.2021.109490. [DOI] [Google Scholar]
- Ghosh S.; Chang Y.-F.; Yang D.-M.; Chattopadhyay S. Upconversion nanoparticle-morange protein FRET nanoprobes for self-ratiometric/ratiometric determination of intracellular pH, and single cell pH imaging. Biosens. Bioelectron. 2020, 155, 112115. 10.1016/j.bios.2020.112115. [DOI] [PubMed] [Google Scholar]
- Yu Q. H.; Jiang J. H.; Chen Z. Q.; Han C. Y.; Zhang X. M.; Yang S. Y.; Zhou P.; Deng C.; Yu C. A multilevel fluorometric biosensor based on boric acid embedded in carbon dots to detect intracellular and serum glucose. Sens. Actuators, B 2022, 350, 130898. 10.1016/j.snb.2021.130898. [DOI] [Google Scholar]
- Hou H.; Zhao Y. Y.; Li C. P.; Wang M. M.; Xu X. L.; Jin Y. D. Single-cell pH imaging and detection for pH profiling and label-free rapid identification of cancer-cells. Sci. Rep. 2017, 7 (1), 1759. 10.1038/s41598-017-01956-1. [DOI] [PMC free article] [PubMed] [Google Scholar]
- Bao L.; Liu K. J.; Chen Y. L.; Yang G. H. Construction of a Rational-Designed Multifunctional Platform Based on a Fluorescence Resonance Energy Transfer Process for Simultaneous Detection of pH and Endogenous Peroxynitrite. Anal. Chem. 2021, 93 (26), 9064–9073. 10.1021/acs.analchem.1c00264. [DOI] [PubMed] [Google Scholar]
- Chiche J.; Brahimi-Horn M. C.; Pouysségur J. Tumour hypoxia induces a metabolic shift causing acidosis: A common feature in cancer. J. Cell. Mol. Med. 2010, 14 (4), 771–794. 10.1111/j.1582-4934.2009.00994.x. [DOI] [PMC free article] [PubMed] [Google Scholar]
- Smith M. E.; Stastny A. L.; Lynch J. A.; Yu Z.; Zhang P.; Heineman W. R. Indicator Dyes and Catalytic Nanoparticles for Irreversible Visual Hydrogen Sensing. Anal. Chem. 2020, 92 (15), 10651–10658. 10.1021/acs.analchem.0c01769. [DOI] [PubMed] [Google Scholar]
- Puschett J. B.; Rao B. S.; Karandikar B. M.; Matyjaszewski K. Indicator characteristics of bromothymol blue derivatives. Talanta 1991, 38 (3), 335–338. 10.1016/0039-9140(91)80058-8. [DOI] [PubMed] [Google Scholar]
- Casey J. R.; Grinstein S.; Orlowski J. Sensors and regulators of intracellular pH. Nat. Rev. Mol. Cell Biol. 2010, 11 (1), 50–61. 10.1038/nrm2820. [DOI] [PubMed] [Google Scholar]
- Mohebbian M. R.; Chafjiri F. S.; Vedaei S. S.; Wahid K. A. CFA image compression using an efficient cascaded overlapping color transformation. Multimed. Tools Appl. 2023, 82 (28), 43233–43250. 10.1007/s11042-023-15352-7. [DOI] [Google Scholar]
- Griffiths J.Colour and constitution of organic molecules; New York Academic Press: London, 1976; Vol. 1; p 5. [Google Scholar]
- Yue X. M.; Qiao Y. Q.; Gu D. N.; Qi R.; Zhao H. J.; Yin Y. M.; Zhao W.; Xi R. M.; Meng M. DNA-based pH nanosensor with adjustable FRET responses to track lysosomes and pH fluctuations. Anal. Chem. 2021, 93 (19), 7250–7257. 10.1021/acs.analchem.1c00436. [DOI] [PubMed] [Google Scholar]
- Shi W.; Li X. H.; Ma H. M. A tunable ratiometric pH sensor based on carbon nanodots for the quantitative measurement of the intracellular pH of whole cells. Angew. Chem., Int. Ed. Engl. 2012, 51 (26), 6432–6435. 10.1002/anie.201202533. [DOI] [PubMed] [Google Scholar]
- Sakata T.; Sugimoto H.; Saito A. Live monitoring of microenvironmental pH based on extracellular acidosis around cancer cells with cell-coupled gate ion-sensitive field-effect transistor. Anal. Chem. 2018, 90 (21), 12731–12736. 10.1021/acs.analchem.8b03070. [DOI] [PubMed] [Google Scholar]
- Satake H.; Saito A.; Sakata T. Elucidation of interfacial pH behaviour at the cell/substrate nanogap for in situ monitoring of cellular respiration. Nanoscale 2018, 10 (21), 10130–10136. 10.1039/C8NR02950D. [DOI] [PubMed] [Google Scholar]
- Chen Q.; Zhai J.; Li J.; Wang Y.; Xie X. Exploring ratiometric endolysosomal pH nanosensors with hydrophobic indicators responding at the nanoscale interface and multiple fluorescence resonance energy transfers. Nano Res. 2022, 15, 3471–3478. 10.1007/s12274-021-3870-5. [DOI] [Google Scholar]
- Lee M. H.; Han J. H.; Lee J. H.; Park N.; Kumar R.; Kang K.; Kim J. S. Two-Color probe to monitor a wider ange of pH values in cells. Angew. Chem., Int. Ed. 2013, 125, 6326–6329. 10.1002/ange.201301894. [DOI] [PubMed] [Google Scholar]
- Xie X. J.; Zhai J. Y.; Jarolimova Z.; Bakker E. Determination of p K a values of hydrophobic colorimetric pH sensitive probes in nanospheres. Anal. Chem. 2016, 88 (6), 3015–3018. 10.1021/acs.analchem.5b04671. [DOI] [PubMed] [Google Scholar]
Associated Data
This section collects any data citations, data availability statements, or supplementary materials included in this article.