Abstract
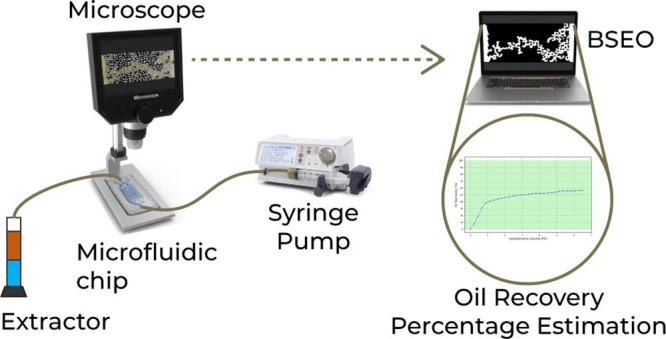
Microfluidic models have become essential instruments for studying enhanced oil recovery techniques through fluid and chemical injection into micromodels to observe interactions with pore structures and resident fluids. The widespread use of cost-effective lab-on-a-chip devices, known for efficient data extraction and minimal reagent usage, has driven demand for efficient data management methods crucial for high-performance data and image analyses. This article introduces a semiautomatic method for calculating oil recovery in polymeric nanofluid flooding experiments based on the background subtraction (BSEO). It employs the background subtraction technique, generating a foreground binary mask to detect injected fluids represented as pixel areas. The pixel difference is then compared to a threshold value to determine whether the given pixel is foreground or background. Moreover, the proposed method compares its performance with two other representative methods: the ground truth (manual segmentation) and Fiji-ImageJ software. The experiments yielded promising results. Low values of mean-squared error (MSE), mean absolute error (MAE), and root-mean-squared error (RMSE) indicate minimal prediction errors, while a substantial coefficient of determination (R2) of 98% highlights the strong correlation between the method’s predictions and the observed outcomes. In conclusion, the presented method emphasizes the viability of BSEO as a robust alternative, offering the advantages of reduced computational resource usage and faster processing times.
1. Introduction
Micromodels have been broadly used for over 50 years to visualize the behavior of fluids in distinct research areas, including chemical, biological, and physical research.1 In petroleum engineering, micromodels are commonly employed to study enhanced oil recovery (EOR) processes and a variety of flow systems, including microfluidics, reservoir characterization, and multiphase flow. They have proven to be valuable tools for investigating these complex processes and have led to a deeper understanding of the behavior of fluids in porous media.2,3
Researchers can inject fluids and chemicals into the micromodel and observe how they interact with the pore structure and the resident fluids, allowing them to evaluate the effectiveness of different EOR techniques and fluid/chemical additives. EOR techniques employ several mechanisms to achieve this goal. Controlling mobility ratio,4−6 changing wettability,7−9 altering the topographic properties of pores, decreasing the interfacial tension,10−12 and increasing the miscibility between the displaced and displacing fluids13,14 are the main mechanisms employed during EOR processes. These studies aim to improve the understanding of flow mechanisms and phase interactions between reservoir fluids that may contribute to increased oil recovery from hydrocarbon reservoirs.15 Moreover, microfluidics is not entirely unfamiliar or disregarded by the oil industry; instead, it has emerged as a valuable method for studying EOR through injection flooding.16−18 Modern microfluidic models of the porous medium, featuring characteristic channel sizes ranging from several microns to hundreds of microns, are actively employed in research to enhance oil recovery.19−21 Recently, with the boom of nanofluids and nanoparticles application in the oil and gas industry,22,23 microfluidic systems have acquired special importance due to their easiness and rapid execution regarding core-flooding measurements, which allows a systematic evaluation of different parameters of importance for the nano-EOR process.24−26
Despite the valuable insights that microfluidics provides into EOR, it is important to recognize the existing limitations and challenges in its application. These challenges include the need for standardization and testing protocols and difficulties in scaling up experiments and fully replicating reservoir conditions.17,27−29 Nevertheless, microfluidics remains a promising tool for studying and optimizing enhanced oil recovery techniques as researchers in the petroleum industry persistently explore its use in studying fluid flow behavior in porous media and developing improved models for upscaling findings to the reservoir scale.
Imaging processing techniques play a pivotal role in visualizing fluid flow behavior in microfluidic experiments and studying oil recovery. They enable dynamic visualization of the pore-scale fluid flow behavior, quantitative analysis, seamless integration with microfluidic devices, and precise interpretation of the results. As a result, these techniques provide valuable information for understanding complex fluid flow phenomena and developing effective strategies for enhanced oil recovery. However, challenges and issues related to the images from microfluidic experiments can have an adverse effect on the accuracy of the analysis, hindering the precise visualization of fluid flow behavior.
One of the key issues is related to the resolution of the images, which may not be sufficient to capture fine details when dealing with nanofluids or nanoparticles. Therefore, the precision and accuracy of the visualizations can be limited. Another critical aspect is image segmentation, which is crucial for comprehensive analysis of fluid flow behavior. Complex fluids or multiphase flow patterns, particularly when nanoparticles or other dispersed phases are involved, can significantly complicate the segmentation process, leading to potentially less accurate results.30
Additionally, implementing imaging processing techniques might introduce artifacts or noise into the images, thereby distorting the visualization of fluid flow behavior. Furthermore, the large volume of data generated by imaging techniques poses challenges in processing and analyzing images effectively, requiring significant computational resources and expertise.
Advances in computational modeling and imaging techniques have facilitated overcoming some of the challenges associated with the analysis of microfluidic experiments. Applying an automated image-based computational technique offered by various programming languages enables researchers to obtain more accurate results from micromodel experiments. Rostami et al.31 employed a Fiji plug-in for the drop shape analysis to measure the equilibrium interfacial tensions of the crude oil/nanofluid system under laboratory conditions.
Also, Omran et al.32 used Fiji to crop the images, remove the holder and boundaries of the microchip, and improve the brightness and contrast between phases by applying a bandpass filter. The images were in the RGB format. The difference between the red and blue (DR-B) atoms for every pixel in the image produced a unique distribution, enabling a tool to distinguish the oil from the other phases. The images were segmented into binary images, where pixels could have a value of either zero or one by selecting a threshold value from the (DR-B) distribution.
Vavra et al.33 reported an image analysis toolbox and algorithms in MATLAB to analyze the footage from an experiment. Furthermore, Fan et al.34 developed a MATLAB program to count the black pixels and compare the number of black pixels in the original binary image after crude oil fulfillment, which enabled the calculation of the displacing rate by analyzing the transition of black pixels to white during water flooding. According to Mahmoodi et al.,35 the viability of automating image processing functions in LabVIEW is demonstrated by employing a sample image processing code. The algorithm developed consists of several essential steps: initialization, monochrome plane extraction, nonuniform background correction, segmentation, particle analysis, and calculation. These integrated steps are crucial in effectively interpreting visual data obtained during multiphase fluid flow experiments conducted in a micromodel. Although several software packages and methods focusing on EOR have been developed, most of them require manual inputs from the experimenter and are designed for further processing, which restricts both accuracy and performance. Therefore, it is necessary to improve the performance of the image analysis when addressing a specific application such as EOR experiments with and without nanofluids in micromodels.
Microfluidic devices generate a large amount of data, necessitating the evolution of new methods to efficiently analyze data and images while reducing reliance on manual inputs and achieving more accurate results. This improvement is necessary to achieve high-performance analysis and facilitate the profitable use of computational capabilities.
To overcome the challenges mentioned previously, a semiautomatic method called BSEO (background subtraction (BS) in flooding experiments for oil recovery techniques) was developed to calculate the oil recovery percentage. BSEO utilizes a BS technique that aims to detect the moving fluids in a sequence of frames. The pixel difference is then compared with a threshold value to determine whether the given pixel is foreground or background. As a result of this, the binary image returned is a mask that should contain mostly foreground pixels. Thus, the difference between the initial state of the black pixels and the final state was interpreted as recovered oil. The proposed method offers several advantages, including its highly adaptive background model and minimal computation load, which result in a significant reduction in processing time.
2. Materials and Methods
2.1. Materials Employed for Microfluidic Tests
For the microfluidic tests, a Colombian crude oil with an API gravity of 21° was employed. Three different displacement phases were employed for the EOR process in the microdevice including a 5000 mg/L KCl brine (98%, Sigma-Aldrich, St. Louis, MO, USA) and an HPAM (molecular weight between 6 and 8 MDa, hydrolysis percentage = 30%, Nalco SA, Colombia) solution and a polymeric nanofluid composed of HPAM and SiO2 nanoparticles (Sigma-Aldrich Co., St. Louis, MO, USA). More details about the materials employed for the experiments can be found in a previous study.24
2.2. Design and Fabrication of Microfluidic Devices
Following the protocols from Olmos et al.,36 the microdevices were meticulously designed using Layout Editor software and transferred to a TIL (Transparent Intermediate Lithography) with a 2400 PPI infrared source. Next, the TIL was carefully laminated onto an unexposed photopolymer plate. The photopolymer plate underwent exposure to UVA light at the back, with an energy of 0.45 J, for 10 s. A specific portion of the photopolymer was covered with a mask plate at the back, and then the plate received an additional 0.45 J UVA light exposure at the back for 20 s. Each of these exposures was systematically repeated.
In the subsequent step, the front part was exposed to UVA light for 360 s at an energy level of 19 J. After removing the TIL, the plate was washed with PROSOL N-1 solvent (supplied by Eastman Kodak) at a flow rate of 360 mm min–1, and then it was dried in an oven for 30 min at 50 °C. Moreover, the plate had a final exposure to UVC light at 10 J for 17 min, and UVA light was applied at 4 J for 2 min on the cold side, where the mold was briefly manufactured. A mixture of epoxy resin and curing agent (Crystal-Tack, Novarchem, Villa Martelli, Argentina) was applied to the female mold to replicate the high-relief design. Upon completion of the curing process, the epoxy resin mold (ERmold) was separated from the Fmold to form the male mold. Afterward, a mixture of PDMS and curing agent in a 10:1 weight ratio (Sylgard 184 silicone elastomer kit, Dow Corning, Midland, MI, USA) was poured onto the ER mold and cured in an oven at 40 °C overnight.37 In Figure 1, the final design and microfluid device PDMS used in the experiments are presented.
Figure 1.
PDMS device used during experiments. (a) Design view and (b) physical view. Own source.
2.3. Microfluidics Experiments
To determine the effect of the KCl brine, HPAM solution, and the polymeric nanofluid, an injection rate of 1 ft/d (0.19 μL/min) was employed, and experiments were performed at 25 °C. First, the microdevice was saturated with crude oil. This was followed by KCl brine injection, until no oil was observed in the production outlet. Further, the HPAM solution was injected until oil production equal to zero was reached, and finally, the polymeric nanofluid is injected to evaluate any additional oil recovery.24
3. BSEO Method Description and Implementation
To assess its performance, 426 images were used. These images were captured during the sequential flooding of both the polymer solution and the polymeric nanofluids. In this work, BSEO is proposed as an alternative method for segmenting images from flooding experiments, and it was implemented in Python38 using the Jupyter Notebook within the Anaconda environment.
3.1. Image Processing Algorithm
A semiautomatic algorithm was developed to calculate the oil recovery percentage of the flooding experiments. Considering the high contrast between the oil and the injection fluids present in the acquired images, differentiation between the two phases became possible through the establishment of an appropriate threshold value and the conversion of the images into the binary form. Consequently, the difference between the initial state of the black pixels and the final state was interpreted as a recovered oil. As an example, data from Santamaria et al.24 are employed. Here, the authors evaluated different mechanisms of nanoCEOR using polymeric solutions in the presence of nanofluids.
3.2. Preprocessing Operations
The proposed algorithm has a preprocessing stage, which is an important step in image analysis. Automatic cropping techniques were used to properly extract the most relevant areas from the images, removing the unnecessary ones. Additionally, a Gaussian filter39 was applied to smoothen and enhance the image quality. The output of the image cropping and applied filter is shown in Figure 2.
Figure 2.
Image cropping. (a) Original image. (b) Cropped image.
Also, the flowchart is presented in Figure 3, where the main processes are (a) conversion of RGB image to a grayscale image; (b) BS for generating a binary foreground mask using a proper threshold value; and (c) morphological operations are applied over the binary image to delete noninterest regions.
Figure 3.
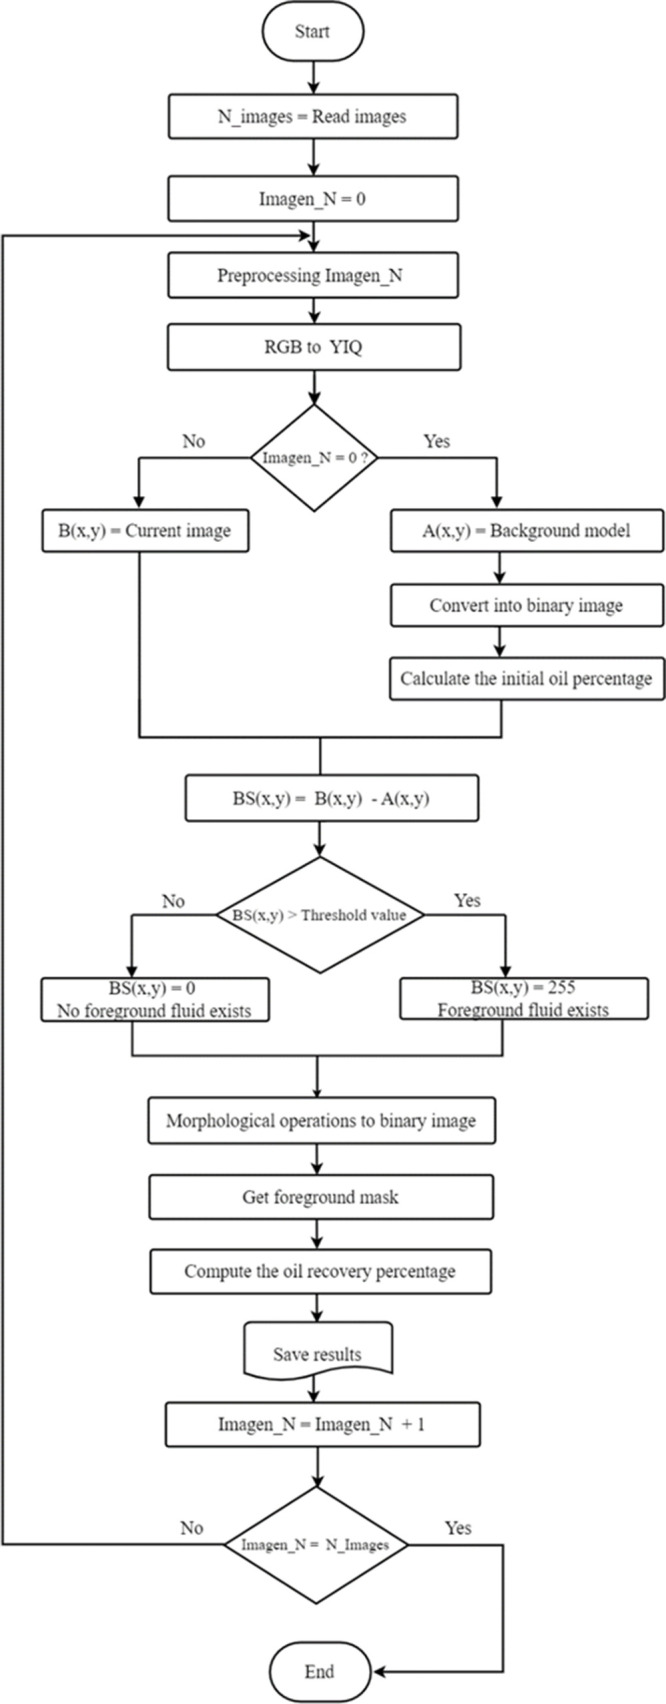
BSEO method flowchart for oil recovery calculation.
3.3. Grayscale Image
The RGB color space is converted into YIQ color space.40,41 In this format, the Y component represents luminance, where the value of each pixel is represented as a single value carrying only the intensity information, composing an image exclusively formed from different shades of gray,42 while the remaining two components I and Q represent the chrominance or color information. Eyes are very sensitive to intensity variation; consequently, it is easier to perceive more information from luminance than from any other components. YIQ space exploits this property to attain an efficient representation of images. The RGB to YIQ conversion43 is defined as
 |
The method to convert an RGB image to grayscale is computed according to eq 1:
| 1 |
The Y, I, and Q components are assumed to be in the [0, 1] or [0, 255] range. In Figure 4, the image conversion from RGB to grayscale is presented.
Figure 4.
Grayscale conversion. (a) Original image. (b) Grayscale image (pixel values 0–255).
3.4. Background Subtraction
BS44 is a common and widely used method for generating a foreground mask, namely a binary image containing the pixels belonging to moving fluids in a sequence of images. In this approach, the foreground mask is calculated by subtracting between the current image and a reference image, often called a background model holding the static part of the scene. This process is presented in Figure 5.
Figure 5.
Steps in the BS.
It is worth mentioning that the removed parts of
the photograph
correspond to the space out of the chip and the area of analysis.
Hence, the volume quantification is unaffected and can be directly
correlated by the photo number (at a constant photo taking) vs injection
rate. The pixel difference is compared with a threshold value to resolve
whether the given pixel is foreground or background. If the difference
between the two images is greater than the threshold value given,
then the pixel will be assumed as part of the foreground. Otherwise,
it will be considered to be a background pixel. The details are presented
as follows: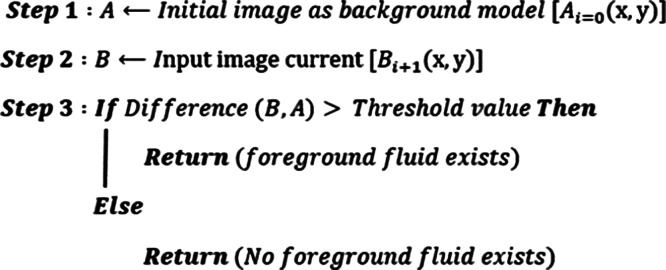
where (x, y) represents the coordinates pixels values corresponding to images (Ai= 0, Bi+1) with i = 0,..., n, and n is the length of frames presented.
3.5. Threshold Value and Morphological Operations
The appropriate threshold value for binarization is computed according to the evolution of the flooding experiments. This parameter will take values in the interval Y = [0, 1]. Finally, to enhance the variation of pixel intensity in each neighborhood, morphological operators are used,45 such as opening operation utilizing OpenCV-Python.46 To accurately calculate the oil recovery percentage this operator tends to remove unnecessary small objects on images that are processed using a structuring element47 as seen in the foreground mask presented in Figure 4.
4. Results and Discussion
4.1. Oil Recovery Percentage Estimation: A Comparative Analysis of Fiji-ImageJ Software and BSEO Method
Each image possesses a specific area that is dependent on its height and width, which is considered as 100%. Every foreground mask image enables the computation of the area occupied by the detected injection fluids within the image, expressed as a percentage of white pixels, as demonstrated in eq 2.
| 2 |
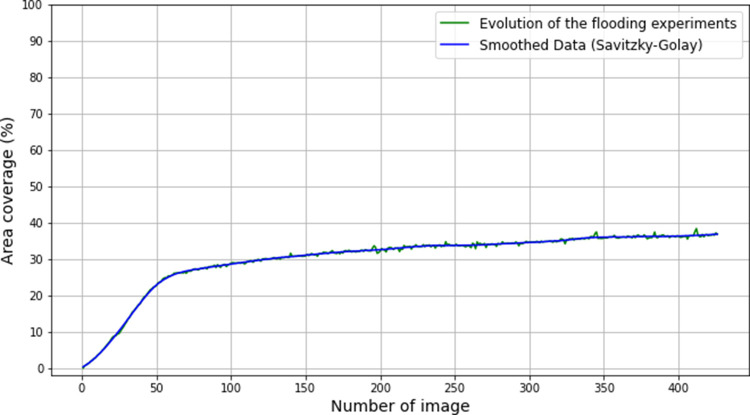
where Aif represents the area in pixels of the detected injection fluids, Aimg is the total area in pixels of the image, and Pif indicates the percentage of injection fluids detected in each image, describing the evolution of the experiment. In Figure 6, the evolution of the flooding experiments is presented through the percentage of area occupied by the injection fluids in each foreground mask, which is calculated via BS. These data are stored in a data set for computing the oil recovery and testing the proposed method’s performance. Images can be successfully binarized during the preprocessing stage using a threshold value greater than 0.04, based on the luminance values and a kernel size of 3 × 3. Additionally, Savitzky–Golay (S–G) filters48 are employed for denoising and data smoothing.
Figure 6.
Results from the data set. The green solid line represents the evolution of the flooding experiments, and the blue solid line indicates the data smoothed with the Savitzky–Golay filters.
From the background model image, it was possible to calculate the initial percentage of black pixels and white pixels, as shown in eq 3:
| 3 |
where Npix represents either white or black pixel count in the image, depending on the case, Aimg is the total area of the image in pixels. This equation enables the computation of two separate values: Ppix for the percentages of black and white pixels, respectively.
In eqs 4 and 5, mathematical expressions for computing the percentage of black pixels and white pixels totals in every image are presented:
| 4 |
| 5 |
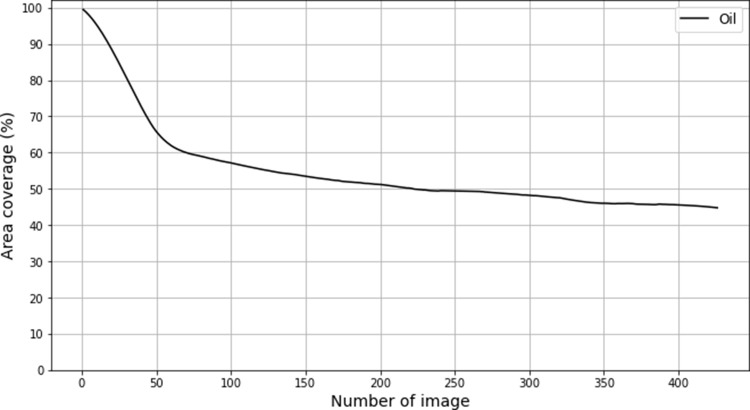
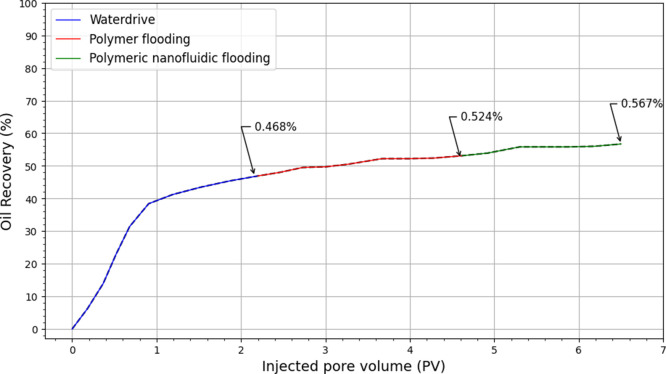
where Pwp and Pbp represent the percentage of white pixels and black pixels counts, respectively, in every image. In Figure 7, Pbp represents the percentage of the area occupied by oil in each image. In Figure 8, the amount of recovered oil was determined by calculating the difference between the initial state of the black pixels and the final state. This figure depicts the microscopic sweep efficiency during successive injections of polymer and nanofluids. Initially, the microdevice was saturated with injected oil and brine.
Figure 7.
Figure 8.
Percentage of recovered oil. Injected pore volumes are calculated from the injection rate of the fluids and the photo shooting rate during microfluidic experiments.
Several mechanisms that lead to an increase in oil recovery in the presence of nanoparticles. However, microfluidic experiments provide useful information regarding microscopic oil displacement and residual oil distribution in the form of cluster types, oil droplets, oil films coats, and dead-end.24,25 In this case, SiO2 nanoparticles can maximize the capillary number by increasing the solution viscosity, reducing the interfacial tension, and change the wettability to a strong water-wet system.24 The main interactions of the nanoparticles and the HPAM is through hydrogen bonds between silanol groups and carboxylic groups in the HPAM,49 which increases the viscosity of the solution by strengthening the system microstructure.
Regarding the interfacial forces, nanoparticles can locate in both the oil–water interface and the surface of the porous medium. At the oil–water interface, the nanoparticles reduce Gibbs energy by their targeted location and wider coverage in comparison with polymer molecules.22−25
Also, on the porous medium surface a two-dimensional layered is formed, leading to the porous medium decoration and structural disjoining pressure mechanisms.24,50,51 On the other hand, mechanisms related to the HPAM solution in the absence of nanomaterials are mainly limited to increase in viscosity of the displacement phase. The efficiency in oil recovery during the waterflooding stage was low, with a value of 46.8%. However, the application of HPAM solution and polymeric nanofluid by flooding resulted in improved recoveries of 52.4 and 56.7%, respectively.
This represents a difference of about <1% in comparison with the recovery values reported by Santamaria et al.,24 showing the high agreement between the proposed model and the visual estimation of oil recovery. It is also important to highlight that there is a change in the slope at the beginning of the polymeric nanofluid injection in comparison to the HPAM solution, being 3.3 and 3.9% in the absence and presence of nanoparticles, respectively. This is an indicative of inhibition of polymer retention in the porous medium that is adequately represented by the proposed model and agrees with the previous polymer retention tests24 performed during core-flooding tests that showed a reduction of about 42% in the retention due to the presence of nanoparticles.
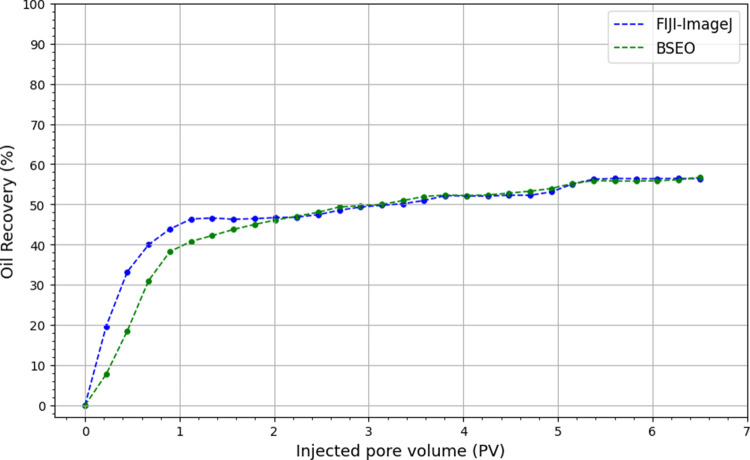
In Figure 9, a comparative analysis between two outcomes representing the oil recovery percentage of the flooding experiments is presented: one was obtained through the utilization of conventional image analysis techniques employing Fiji-ImageJ software, while the other was generated via the implementation of the BSEO method developed in this work.
Figure 9.
Oil recovery percentage estimation of flooding experiments: comparative analysis of Fiji-ImageJ software and BSEO method.
4.2. Result Validation: Manual Segmentation for Ground Truth Images
The proposed method primarily involved using Fiji-ImageJ software for comparison rather than solely for validation. It is crucial to acknowledge the potential flaws and uncertainties inherent in the Fiji-ImageJ analysis.
These uncertainties, combined with the possibility of human error and subjective judgments or misinterpretations due to software limitations, can affect the accuracy of conclusions drawn from image data.52 Therefore, they emphasize the need for a cautious interpretation.
In addition, experts have performed manual segmentation to separate the total area occupied by the evolution of the flooding experiments from the image background to obtain the ground truth. These images were used to validate the results obtained by both the BSEO method and Fiji-ImageJ software. The VGG Image Annotator (VIA) software enabled manual annotation to define regions of interest within images.53
These regions can be delineated using geometric shapes, such as rectangles, circles, ellipses, polygons, etc. In this case, the polygonal shape was employed to select and enclose the regions depicting the evolution of the flooding experiments, as illustrated in Figure 10.
Figure 10.
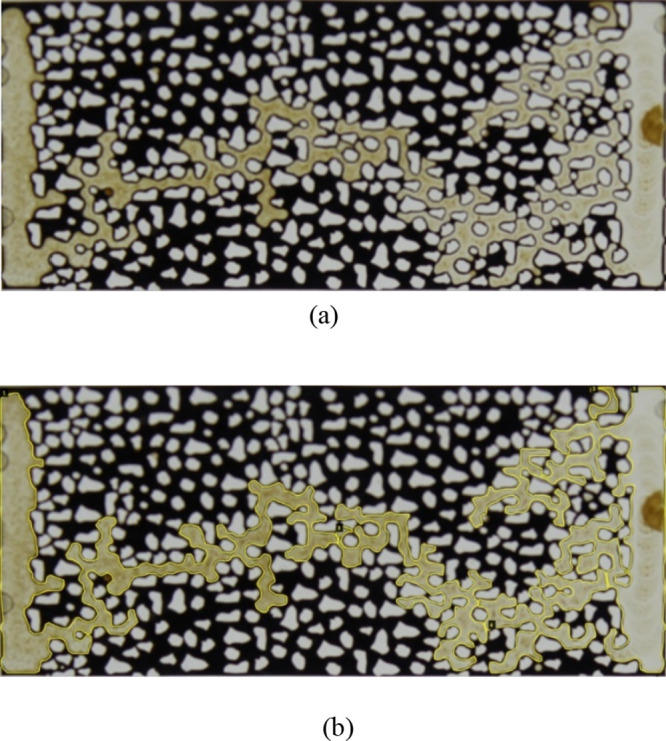
Evolution of the flooding experiments. (a) Image 100 from a data set. (b) Manual segmentation.
The total segmented area (measured in pixels) is calculated using the formula of Gaussian area.54 This mathematical algorithm is particularly effective for computing the area of irregular polygons with any number of sides, including both concave and convex polygons, as demonstrated in eq 6:
| 6 |
where A is the area, n is the number of sides, and (xi, yi) with i = 1,..., n are the sorted
vertices of the polygon. Every manually segmented image enables for computing the area occupied by the evolution of the flooding experiments detected in the image expressed as a percentage, as shown in eq 7:
| 7 |
where Afe is the area of the flooding experiments detected, Aimg is the total area in pixels of image, and Pfe indicates the percentage of the flooding experiments in each image.
4.3. Comparison of BSEO, Manual Segmentation, and Fiji Methods Using Ground Truth Standard Data Set
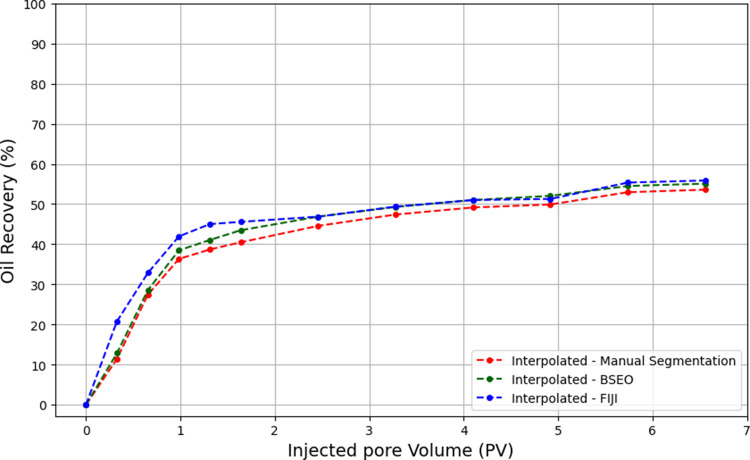
In Figure 11, the oil recovery percentage estimation of the flooding experiments is presented through the recovery percentage in each image from the data set established as the ground truth for testing the methods. A comparative analysis is conducted between three outcomes representing the oil recovery percentage: one obtained through conventional image analysis techniques employing Fiji-ImageJ software and the other generated via the implementation of the BSEO method developed in this work, with both methods compared to manual segmentation.
Figure 11.
Comparing methods: ground truth data set evaluation with interpolation and error metrics.
A comprehensive comparison of these three curves, along with error metric calculations, provided a robust evaluation of the proposed method. This procedure involved aligning data points along the x-axis through interpolation, after which differences were assessed using these metrics. Interpolating all three curves ensured that corresponding data points shared identical x-coordinates, thereby facilitating a meaningful and accurate comparison.
Error metrics, such as mean squared error (MSE), mean absolute error (MAE), and root mean squared error (RMSE), were employed to quantify the discrepancies among the corresponding data points. These metrics provided a quantitative assessment of the performance of both the BSEO method and the Fiji-ImageJ software in approximating the results obtained from manual segmentation, and their expressions are as follows55:
| 8 |
| 9 |
| 10 |
where yi and xi represent the observed and predicted values, respectively, of the ith sample in the data set, and n denotes the total number of samples. Here, ″xi″ refers to the estimated values provided by both the BSEO method and Fiji-ImageJ software, and ″yi″ refers to the actual values obtained from the flooding experiments using manual segmentation. MAE measures the average absolute difference between the values predicted by a model and the corresponding actual values. It is interpreted as the average error when predictions are made with the model. MSE measures the average squared difference between the predicted and actual values, with a greater penalty for larger errors. RMSE is the square root of the mean of the squared differences between the predicted and actual values. It serves as a standard method for measuring the error of a model in predicting quantitative data, especially when significant deviations impact the model’s performance. Lower values of MAE, MSE, and RMSE indicate robust method performance as they represent smaller differences between the predicted and actual outcomes. The provided error metrics demonstrate that the BSEO method exhibits significantly superior performance in approximating the results obtained through manual segmentation compared to Fiji-ImageJ software. For the BSEO (MSE: 0.0462, MAE: 0.0198, RMSE: 0.0215) were recorded, whereas for the Fiji-ImageJ software (MSE: 0.2302, MAE: 0.0396, RMSE: 0.048) MSE were obtained. These results indicate that the BSEO achieves higher accuracy and a better approximation to the values obtained through manual segmentation compared with the Fiji-ImageJ software.
In Figures 12 and 13, the application of the coefficient of determination (R2) is presented to assess the proportion of variance in the observed data explained by both method’s predictions. The R2 value ranges from 0 to 1, where 0 indicates no explanation of variability in the dependent variable and 1 indicates complete explanation of variability. A value of R2 closer to 1 signifies a better fit of the methods to the data, indicating that they effectively capture a larger portion of the data’s variability. The determination of R2 was computed according to the following expression:
| 11 |
where yi and  denote observed and estimated values at
the ith data point, and y̅ is the mean of observed values.
Figure 12.
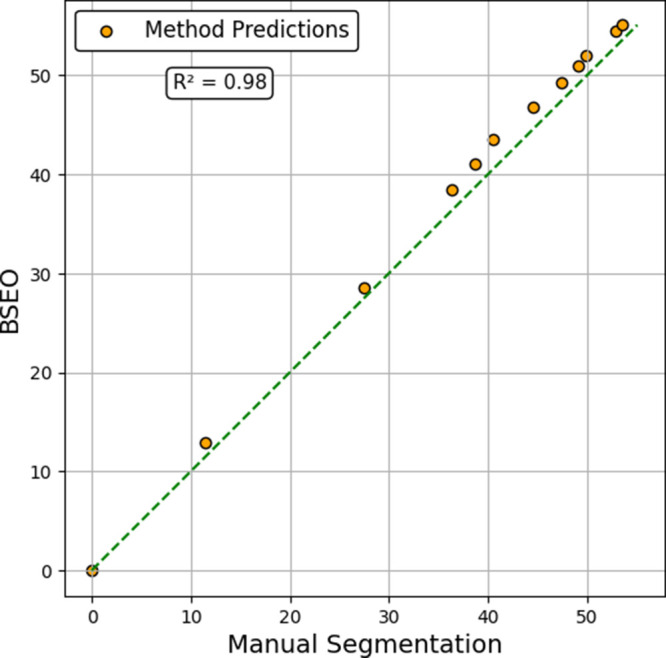
Coefficient of determination (R2) analysis for BSEO method predictions.
Figure 13.
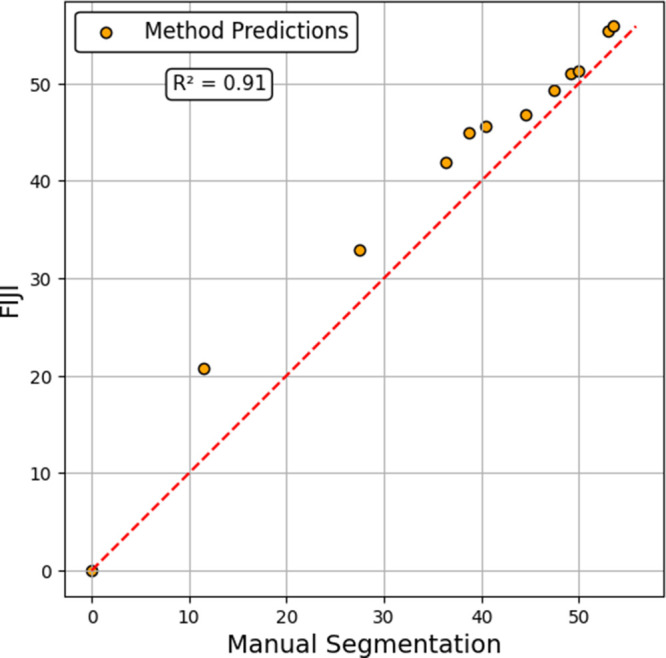
Coefficient of determination (R2) analysis for Fiji-ImageJ method predictions.
The results of the analysis show that the BSEO achieved an R2 value of 0.98, while Fiji obtained an R2 value of 0.91. This high R2 indicates that the BSEO method is effective in capturing and explaining the variations in the oil recovery outcomes, demonstrating its capability to model the data well compared with the Fiji-ImageJ software.
Taken together, these results demonstrate that the proposed method has a high level of accuracy in predicting oil recovery percentages from the flooding experiments as compared to the results obtained through Fiji-ImageJ analysis. The low values of MSE, MAE, and RMSE indicate small prediction errors, while the substantial R2 value highlights the strong correlation between BSEO’s predictions and the observed outcomes.
These differences in accuracy can be largely attributed to the varying thresholds used by FIJI-ImageJ for image segmentation, in contrast to BSEO, which employs a consistent threshold value. FIJI-ImageJ offers the flexibility to use predefined or user-adjusted thresholds, and the selection of these thresholds is subjective. It may depend on factors such as image quality and specific user preferences. Consequently, even minor differences in threshold values can result in variations in how objects of interest are identified and segmented within the images. These variations can, in turn, propagate through the analysis and impact the results, contributing to the observed disparities between the two methods.
Furthermore, BSEO presents an additional advantage in terms of reduced computational resource usage and faster processing times when compared with the Fiji-ImageJ software. Deficiencies observed in the Fiji-ImageJ software, particularly regarding processing time and utilization of computational resources, arise from its reliance on single-threaded processing and the lack of GPU acceleration,56 which consequently affects memory usage patterns. There is also limited optimization for parallel execution, necessitating various plugins for numerous processing steps.57
5. Conclusions
Based on the study, the following conclusions can be drawn:
The proposed method offers an efficient approach to detect moving fluids in image sequences, reducing human error by eliminating the need for manual identification of regions of interest and providing more precise results compared to manual interpretations.
The adaptive background model employed by the BSEO enables it to handle diverse background conditions, making it applicable to a wide range of experimental settings.
The accuracy of the BSEO method in predicting oil recovery percentages is demonstrated through low values of error metrics (MSE, MAE, RMSE) and a substantial R2 value.
BSEO offers advantages such as reduced resource consumption and expedited processing times compared to the Fiji-ImageJ software.
Deficiencies observed in Fiji-ImageJ highlight the viability of BSEO as a robust alternative for calculating oil recovery percentages in microfluidic devices.
BSEO showcases a low computation load, indicating efficient resource utilization. This advantage is of particular importance when handling extensive microfluidic data sets, ensuring high-performance analysis while optimizing computational resources.
The proposed method provides a streamlined implementation approach. This approach leads to a smoother learning curve and improved user-friendliness. As a result, it becomes accessible to researchers who may not possess extensive expertise in programming or familiarity with a particular software environment.57
Future work will involve analyzing image sequences from different flooding experiments to enhance accurate oil recovery calculations. This optimization aims to improve the proposed method’s performance by integrating advanced machine learning techniques such as deep learning for superior results.
Acknowledgments
The authors acknowledge Gustavo Rosero-Yánez, Steven Martinez-Vargas, CONICET, UTN, and Universidad Nacional de Colombia—Sede Medellín, for the financial and logistical support.
Data Availability Statement
The data presented in this study are not included due to privacy restrictions. However, data are available on request from the corresponding author.
Author Contributions
Conceptualization, B.L., M.S.P., C.A.F., and E.M.-Y.; Methodology, B.L., M.S.P., C.A.F., F.B.C., and E.M.-Y.; Software, E.M.-Y.; Validation, B.L., M.S.P., C.A.F. and E.M.-Y.; Formal analysis, E.M.-Y., and C.A.F.; Investigation, B.L., M.S.P., E.M.-Y., and C.A.F; Resources, B.L., M.S.P., and C.A.F; Data curation, C.A.F, F.B.C.; Writing—original draft preparation, E.M.-Y.; Writing—review and editing, C.A.F, F.B.C., E.M.-Y., B.L., and M.S.P.; Visualization, E.M.-Y.; Supervision, B.L., C.A.F., and M.S.P.; Project administration, B.L., M.S.P. All authors have read and agreed to the published version of the manuscript.
This work was supported by grants from National Scientific and Technical Research Argentinian Council (CONICET) and National Agency for the Promotion of Research, Technological Development, and Innovation (ANPCyT), Mertelsmann Foundation gGmbH, Biothera. This study was funded by Fondo Francisco José de Caldas, MINCIENCIAS and Agencia Nacional de hidrocarburos (ANH) through contract No. 112721-282-2023 (Project 282-2023) with Universidad Nacional de Colombia—Sede Medellín and PAREX RESOURCES COLOMBIA AG SUCURSAL.
The authors declare no competing financial interest.
References
- Karadimitriou N. K.; Hassanizadeh S. M. A review of micromodels and their use in two-phase flow studies. Vadose Zone J. 2012, 11, 3. 10.2136/vzj2011.0072. [DOI] [Google Scholar]
- Yang W.; Lu J.; Wei B.; Yu H.; Liang T. Micromodel Studies of Surfactant Flooding for Enhanced Oil Recovery: A Review. ACS Omega 2021, 6 (9), 6064–6069. 10.1021/acsomega.0c05750. [DOI] [PMC free article] [PubMed] [Google Scholar]
- Gogoi S.; Gogoi S. B. Review on microfluidic studies for EOR application. J. Pet. Explor. Prod. Technol. 2019, 9 (3), 2263–2277. 10.1007/s13202-019-0610-4. [DOI] [Google Scholar]
- Green D. W.; Willhite G. P.; The adoption of secondary recovery techniques. In Enhanced Oil Recovery; 2nd ed.; In Doherty H.L.. Memorial Fund of AIME; Society of Petroleum Engineers: Richardson, Texas, USA, 2018, Vol. 6, pp. 143–154. [Google Scholar]
- Sun Z.; Wu X.; Kang X.; Lu X.; L Q.; Jiang W.; Zhang J. Comparison of oil displacement mechanisms and performances between continuous and dispersed phase flooding agents. Pet. Explor. Dev. 2019, 46, 121–129. 10.1016/S1876-3804(19)30011-4. [DOI] [Google Scholar]
- Liu W.; Luo L.; Liao G.; Zuo L.; Wei Y.; Jiang W. Experimental study on the mechanism of enhancing oil recovery by polymer – surfactant binary flooding. Pet. Explor. Dev. 2017, 44, 636–643. 10.1016/S1876-3804(17)30072-1. [DOI] [Google Scholar]
- Khajepour H.; Mahmoodi M.; Biria D.; Ayatollahi S. Investigation of wettability alteration through relative permeability measurement during MEOR process: A micromodel study. J. Pet. Sci. Eng. 2014, 120, 10–17. 10.1016/j.petrol.2014.05.022. [DOI] [Google Scholar]
- Yuan S.; Liang T.; Zhou F.; Liang X.; Yu F.; Li J.; A microfluidic study of wettability alteration rate on enhanced oil recovery in oil-wet porous media; In Abu Dhabi International Petroleum Exhibition & Conference, Abu Dhabi, UAE, 2019. [Google Scholar]
- Parra J. E.; Pope G. A.; Mejia M.; Balhoff M. T.; New approach for using surfactants to enhance oil recovery from naturally fractured oil-wet carbonate reservoirs; In SPE Annual Technical Conference and Exhibition, Dubai, UAE, 2016. [Google Scholar]
- Sedaghat M.; Mohammadzadeh O.; Kord S.; Chatzis I. Heavy oil recovery using ASP flooding: A pore-level experimental study in fractured five-spot micromodels. Canadian Journal of Chemical Engineering 2016, 94, 779–791. 10.1002/cjce.22445. [DOI] [Google Scholar]
- Lake L. W.; Arnold K.; Clegg J. D.; Fanchi J. R.; Holstein E. D.; Mitchell R. F.; Warner H. R.; Petroleum engineering handbook; Society of Petroleum Engineers: Richardson, Texas, USA, 2018. [Google Scholar]
- Lacey M.; Hollis C.; Oostrom M.; Shokri N. Effects of pore and grain size on water and polymer flooding in micromodels. Energy Fuels 2017, 31, 9026–9034. 10.1021/acs.energyfuels.7b01254. [DOI] [Google Scholar]
- Mahdavi S.; James L. A. High pressure and high-temperature study of CO2 saturated-water injection for improving oil displacement; mechanistic and application study. Fuel 2020, 262, 116442 10.1016/j.fuel.2019.116442. [DOI] [Google Scholar]
- Jiang J.; James S. C.; Mojarab M. A Multiphase, Multicomponent Reservoir-Simulation Framework for Miscible Gas and Steam Coinjection. SPE Reservoir Evaluation & Engineering 2020, 23, 551–565. 10.2118/198905-PA. [DOI] [Google Scholar]
- James L. A.; Rezaei N.; Chatzis I. VAPEX, Warm VAPEX and Hybrid VAPEX - The State of Enhanced Oil Recovery for In Situ Heavy Oils in Canada. J. Can. Pet. Technol. 2008, 47, 7. 10.2118/08-04-12-tb. [DOI] [Google Scholar]
- Saadat M.; Tsai P. A.; Ho T.-H.; Øye G.; Dudek M. Development of a Microfluidic Method to Study Enhanced Oil Recovery by Low Salinity Water Flooding. ACS Omega 2020, 5, 17521–17530. 10.1021/acsomega.0c02005. [DOI] [PMC free article] [PubMed] [Google Scholar]
- Pryazhnikov M. I.; Minakov A. V.; Pryazhnikov A. I.; Denisov I. A.; Yakimov A. S. Microfluidic Study of the Effect of Nanosuspensions on Enhanced Oil Recovery. Nanomaterials 2022, 12, 520. 10.3390/nano12030520. [DOI] [PMC free article] [PubMed] [Google Scholar]
- Lifton V. A. Microfluidics: an enabling screening technology for enhanced oil recovery (EOR). Lab Chip 2016, 16, 1777–1796. 10.1039/C6LC00318D. [DOI] [PubMed] [Google Scholar]
- Tetteh J. T.; Cudjoe S. E.; Aryana S. A.; Barati ghahfarokhi R. Investigation into fluid-fluid interaction phenomena during low salinity waterflooding using a reservoir-on-a-chip microfluidic model. J. Pet. Sci. Eng. 2021, 196, 108074 10.1016/j.petrol.2020.108074. [DOI] [Google Scholar]
- Yun W.; Chang S.; Cogswell D. A.; Eichmann S. L.; Gizzatov A.; Thomas G.; Al-hazza N.; Abdel-fattah A.; Wang W. Toward Reservoir-on-a-Chip: Rapid Performance Evaluation of Enhanced Oil Recovery Surfactants for Carbonate Reservoirs Using a Calcite-Coated Micromodel. Sci. Rep. 2020, 10, 782. 10.1038/s41598-020-57485-x. [DOI] [PMC free article] [PubMed] [Google Scholar]
- Gaol C. L.; Wegner J.; Ganzer L. Real structure micromodels based on reservoir rocks for enhanced oil recovery (EOR) applications. Lab Chip 2020, 20, 2197–2208. 10.1039/D0LC00257G. [DOI] [PubMed] [Google Scholar]
- Franco C. A.; Zabala R.; Cortés F. B. Nanotechnology applied to the enhancement of oil and gas productivity and recovery of Colombian fields. J. Pet. Sci. Eng. 2017, 157, 39–55. 10.1016/j.petrol.2017.07.004. [DOI] [Google Scholar]
- Franco C. A.; Franco C. A.; Zabala R. D.; Bahamón I.; Forero A.; Cortés F. B. Field Applications of nanotechnology in the oil and gas industry: Recent advances and perspectives. Energy Fuels 2021, 35, 19266–19287. 10.1021/acs.energyfuels.1c02614. [DOI] [Google Scholar]
- Santamaria O.; Lopera S. H.; Riazi M.; Minale M.; Cortés F. B.; Franco C. A. Phenomenological study of the micro-and macroscopic mechanisms during polymer flooding with SiO2 nanoparticles. J. Pet. Sci. Eng. 2021, 198, 108135 10.1016/j.petrol.2020.108135. [DOI] [Google Scholar]
- Betancur S.; Olmos C. M.; Pérez M.; Lerner B.; Franco C. A.; Riazi M.; Cortés F. B. A microfluidic study to investigate the effect of magnetic iron core-carbon shell nanoparticles on displacement mechanisms of crude oil for chemical enhanced oil recovery. J. Pet. Sci. Eng. 2020, 184, 106589 10.1016/j.petrol.2019.106589. [DOI] [Google Scholar]
- Céspedes S.; Molina A.; Lerner B.; Pérez M. S.; Franco C. A.; Cortés F. B. A selection flowchart for micromodel experiments based on computational fluid dynamic simulations of surfactant flooding in enhanced oil recovery. Processes 2021, 9, 1887. 10.3390/pr9111887. [DOI] [Google Scholar]
- Fani M.; Pourafshary P.; Mostaghimi P.; Mosavat N. Application of microfluidics in chemical enhanced oil recovery: A review. Fuel 2022, 315, 123225 10.1016/j.fuel.2022.123225. [DOI] [Google Scholar]
- Pryazhnikov M.; Pryazhnikov A.; Skorobogatova A.; Minakov A.; Ivleva Y. Microfluidic Study of Enhanced Oil Recovery during Flooding with Polyacrylamide Polymer Solutions. Micromachines 2023, 14, 1137. 10.3390/mi14061137. [DOI] [PMC free article] [PubMed] [Google Scholar]
- Lei W.; Liu T.; Xie C.; Yang H.; Wu T.; Wang M. Enhanced oil recovery mechanism and recovery performance of micro-gel particle suspensions by microfluidic experiments. Energy Science & Engineering 2020, 8, 986–998. 10.1002/ese3.563. [DOI] [Google Scholar]
- Jahanbakhsh A.; Wlodarczyk K. L.; Hand D. P.; Maier R. R. J.; Maroto-valer M. M. Review of Microfluidic Devices and Imaging Techniques for Fluid Flow Study in Porous Geomaterials. Sensors 2020, 20, 4030. 10.3390/s20144030. [DOI] [PMC free article] [PubMed] [Google Scholar]
- Rostami P.; Sharifi M.; Aminshahidy B.; Fahimpour J. Enhanced oil recovery using silica nanoparticles in the presence of salts for wettability alteration. J. Dispersion Sci. Technol. 2020, 41, 402–413. 10.1080/01932691.2019.1583575. [DOI] [Google Scholar]
- Omran M.; Akarri S.; Torsaeter O. The Effect of Wettability and Flow Rate on Oil Displacement Using Polymer-Coated Silica Nanoparticles: A Microfluidic Study. Processes 2020, 8, 991. 10.3390/pr8080991. [DOI] [Google Scholar]
- Vavra E. D.; Zeng Y.; Xiao S.; Hirasaki G. J.; Biswal S. L. Microfluidic devices for characterizing pore-scale event processes in porous media for oil recovery applications. J. Vis. Exp. 2018, 131, 56592 10.3791/56592. [DOI] [PMC free article] [PubMed] [Google Scholar]
- Fan Y.; Gao K.; Chen J.; Li W.; Zhang Y. Low-cost PMMA-based microfluidics for the visualization of enhanced oil recovery. Oil Gas Sci. Technol. 2018, 73, 26. 10.2516/ogst/2018026. [DOI] [Google Scholar]
- Mahmoodi M.; James L. A.; Johansen T. Automated advanced image processing for micromodel flow experiments; an application using labVIEW. J. Pet. Sci. Eng. 2018, 167, 829–843. 10.1016/j.petrol.2018.02.031. [DOI] [Google Scholar]
- Olmos C. M.; Rosero G.; Fernández-cabada T.; Booth R.; Der M.; Cabaleiro J. M.; Debut A.; Cumbal L.; Pérez M. S.; Lerner B. Hybrid microchannel-solid state micropore device for fast and optical cell detection. RSC Adv. 2020, 10, 5361–5370. 10.1039/C9RA09939E. [DOI] [PMC free article] [PubMed] [Google Scholar]
- Wang K.; Zhan B.; Zu C.; Wu X.; Zhou J.; Zhou L.; Wang Y. Semi-supervised medical image segmentation via a tripled-uncertainty guided mean teacher model with contrastive learning. Med. Image Anal. 2022, 79, 102447 10.1016/j.media.2022.102447. [DOI] [PubMed] [Google Scholar]
- Villán A. F.; Mastering OpenCV 4 with Python: a practical guide covering topics from image processing, augmented reality to deep learning with OpenCV 4 and Python 3.7, 1ra ed.; Pack Publishing Ltd: Birmingham, United Kingdom, 2019, pp. 26–43. [Google Scholar]
- Szeliski R.; Computer Vision - Algorithms and Applications (Texts in Computer Science), 2nd ed.; Springer: Cham, Switzerland, 2022, pp. 100–110. [Google Scholar]
- Liu Z.; Liu C. Fusion of the complementary Discrete Cosine Features in the YIQ color space for face recognition. Computer Vision and Image Understanding 2008, 111, 249–262. 10.1016/j.cviu.2007.12.002. [DOI] [Google Scholar]
- Ouerghi H.; Mourali O.; Zagrouba E. Non-subsampled shearlet transform based MRI and PET brain image fusion using simplified pulse coupled neural network and weight local features in YIQ colour space. IET Image Processing 2018, 12, 1873–1880. 10.1049/iet-ipr.2017.1298. [DOI] [Google Scholar]
- Garcia G. B.; Suarez O. D.; Espinosa J. L.; Tercero J.; Gracia I.; Learning Image Processing with Open CV, 1ra ed.; Pack Publishing Ltd: Birmingham, United Kingdom, 2015, pp. 177–183. [Google Scholar]
- Russ J. C.; Neal F. B.; The Image Processing Handbook, 7th ed.; CRC Press: Boca Raton, FL, USA, 2016, pp. 164–178. [Google Scholar]
- Piccardi M.; Background Subtraction Techniques: A Review; In Proceedings of the IEEE International Conference on Systems, Man and Cybernetics, The Hague, Netherlands, 2004, pp. 3099–3104 [Google Scholar]
- Haralick R. M.; Sternberg S. R.; Zhuang X. Image analysis using mathematical morphology. IEEE Trans. Pattern Anal. Mach. Intel. 1987, 9, 532–550. [DOI] [PubMed] [Google Scholar]
- Sandipan D.; Hands-On Image Processing with Python: Expert Techniques for Advanced Image Analysis and Effective Interpretation of Image Data; 1ra ed.; Pack Publishing Ltd: Birmingham, United Kingdom, 2018, pp. 222–247. [Google Scholar]
- Yadav G.; Maheshwari S.; Agarwal A.; Contrast limited adaptive histogram equalization-based enhancement for real time video system; In Proceedings of the 2014 International Conference on Advances in Computing; Communications and Informatics (ICACCI): Delhi, India, 2014, pp. 2392–2397. [Google Scholar]
- Schafer R. W.; On the frequency-domain properties of Savitzky-Golay filters; In Digital Signal Processing and Signal Processing Education Meeting (DSP/SPE), Sedona, AZ, USA, 2011, pp. 54–59. [Google Scholar]
- Hu Z.; Haruna M.; Gao H.; Nourafkan E.; Wen D. Rheological Properties of Partially Hydrolyzed Polyacrylamide Seeded by Nanoparticles. Ind. Eng. Chem. Res. 2017, 56, 3456–3463. 10.1021/acs.iecr.6b05036. [DOI] [Google Scholar]
- Lim S.; Horiuchi H.; Nikolov A. D.; Wasan D. Nanofluids Alter the Surface Wettability of Solids. Langmuir 2015, 31, 5827–5835. 10.1021/acs.langmuir.5b00799. [DOI] [PubMed] [Google Scholar]
- Gbadamosi A. O.; Junin R.; Manan M. A.; Yekeen N.; Agi A.; Oseh J. O. Recent advances and prospects in polymeric nanofluids application for enhanced oil recovery. J. Ind. Eng. Chem. 2018, 66, 1–19. 10.1016/j.jiec.2018.05.020. [DOI] [Google Scholar]
- Schindelin J.; Arganda-carreras I.; Frise E.; Kaynig V.; Longair M.; Pietzsch T.; Cardona A. Fiji: an open-source platform for biological-image analysis. Nat. Methods 2012, 9 (7), 676–682. 10.1038/nmeth.2019. [DOI] [PMC free article] [PubMed] [Google Scholar]
- Dutta A.; Zisserman A.; The VIA Annotation Software for Images, Audio and Video; Proceedings of the 27th ACM International Conference on Multimedia, 2019, pp. 2392–2397. [Google Scholar]
- Braden B. The Surveyor’s Area Formula. Coll. Math. J. 1986, 17, 326–337. 10.1080/07468342.1986.11972974. [DOI] [Google Scholar]
- Barnston A. G. Correspondence among the Correlation, RMSE, and Heidke Forecast Verification Measures, Refinement of the Heidke Score. Weather Forecast 1992, 7, 699–709. . [DOI] [Google Scholar]
- Haase R.; Royer L. A.; Steinbach P.; Schmidt D.; Dibrov A.; Schmidt U.; Weigert M.; Maghelli N.; Tomancak P.; Jug F.; et al. CLIJ: GPU-accelerated image processing for everyone. Nat. Methods 2020, 17, 5–6. 10.1038/s41592-019-0650-1. [DOI] [PubMed] [Google Scholar]
- Thiele F.; Windebank A. J.; Siddiqui A. M. Motivation for using data-driven algorithms in research: A review of machine learning solutions for image analysis of micrographs in neuroscience. J. Neuropathol. & Exp. Neurol 2023, 82, 595–610. 10.1093/jnen/nlad040. [DOI] [PMC free article] [PubMed] [Google Scholar]
Associated Data
This section collects any data citations, data availability statements, or supplementary materials included in this article.
Data Availability Statement
The data presented in this study are not included due to privacy restrictions. However, data are available on request from the corresponding author.


