

Summary
The mechanisms of hepatic stellate cell (HSC) activation and the development of liver fibrosis are not fully understood. Here, we show that deletion of a nuclear seven transmembrane protein, TM7SF3, accelerates HSC activation in liver organoids, primary human HSCs, and in vivo in MASH mice, leading to activation of the fibrogenic program and HSC proliferation. Thus, TM7SF3 knockdown promotes alternative splicing of the Hippo pathway transcription factor, TEAD1, by inhibiting the splicing factor hnRNPU. This results in the exclusion of the inhibitory exon 5, generating a more active form of TEAD1 triggering HSC activation. Furthermore, inhibiting TEAD1 alternative splicing with a specific antisense oligomer (ASO) deactivates HSCs in vitro and reduces MASH diet-induced liver fibrosis. In conclusion, by inhibiting TEAD1 alternative splicing, TM7SF3 plays a pivotal role in mitigating HSC activation and the progression of MASH-related fibrosis.
Keywords: TM7SF3, MASH, NASH, fibrosis, Hippo pathway, TEAD1, alternative splicing, hepatic stellate cells, ASO
eTOC blurb
Isaac et al. discover that deletion of the nuclear protein TM7SF3 accelerates hepatic stellate cell activation, promoting fibrosis in liver organoids, human cells and MASH mice by inducing alternative splicing of TEAD1. Targeting TEAD1 splicing with a specific ASO deactivates HSCs and reduces MASH fibrosis, pointing to a potential therapeutic avenue.
Graphical Abstract

Introduction
Metabolic dysfunction-associated steatosis liver disease (MASLD), previously termed non-alcoholic fatty liver disease (NAFLD)1, is characterized by excessive fat accumulation in the liver with mild or no inflammation, and is the most common chronic liver condition in Western populations 2. An estimated ~25% of patients with MASLD will develop metabolic dysfunction-associated steatohepatitis (MASH; previously termed NASH), characterized by steatosis, liver inflammation, hepatocyte damage (ballooning), and fibrosis 3. MASH can also lead to cirrhosis, hepatocellular carcinoma, and eventually increased liver-related mortality 4.
Hepatic fibrosis is a primary predictor of mortality and adverse liver events in MASH patients and is caused by activation of hepatic stellate cells (HSCs) 5. Thus, in MASH, quiescent HSCs undergo activation and can become proliferative, fibrogenic, contractile myofibroblasts, depositing a fibrous extracellular matrix (ECM), leading to liver scarring 5. A complex signaling network, including inflammation, cellular stress, exosomes, ECM interactions, and free cholesterol, 6,7 promotes the activation of HSCs. Thus, inhibiting activated HSCs is pivotal to the prevention and reduction of fibrosis in MASH 5.
TEAD1 is a member of the TEA DNA-binding domain transcription factor family (TEAD1–4) 8. TEAD1 is a Hippo pathway component, which is implicated in diseases such as inflammation, fibrosis, and cancer 9. TEAD1 interacts with Yes-associated protein (YAP) and transcriptional coactivator with PDZ-binding motif (TAZ), the primary effectors of the Hippo pathway, to promote gene expression, cell growth, and survival. This tightly regulated signaling cascade involves phosphorylation of YAP/TAZ, restricting their nuclear translocation and interaction with TEAD1, thereby influencing target gene expression 10. TEAD1 target genes, including CTGF (Connective Tissue Growth Factor) and Cyr61, contribute to fibrogenesis by promoting fibrotic tissue remodeling and enhancing cell proliferation and differentiation 11. While studies have established a connection between fibrosis-related genes like CTGF and Cyr61 12,13, the role of TEAD1 in activating HSCs remains unexplored.
The seven-transmembrane superfamily member three protein (TM7SF3) is a nuclear protein that can attenuate the development of ER stress and the unfolded protein response 14. TM7SF3 forms complexes with several RNA-binding proteins/splicing factors such as HNRNPU, HNRNPK, and RBM14. Hence, TM7SF3 inhibits alternative splicing (AS) under basal and stress conditions 15. Unlike most seven-transmembrane proteins, TM7SF3 is ubiquitously expressed, including in the liver 16. To assess the role of TM7SF3 in HSC activation, we employed HSCs from TM7SF3 knockout mice, as well as human HSCs. We found that the deletion of TM7SF3 in HSCs promotes activation and fibrosis in primary cultures and liver organoids. Additionally, in the in vivo setting, studies of TM7SF3 HSC-specific KO mice showed exaggerated liver fibrosis and inflammation in both liver injury CCl4 treatment, and MASH models. Moreover, we show that TM7SF3 inhibits TEAD1 AS, promoting expression of the less active form of TEAD1. Finally, antisense oligomers (ASOs) targeting TEAD1 pre-mRNA prevent AS into the active form of TEAD1. This inhibits the fibrogenic program in HSCs in vitro and mitigates the development of MASH in vivo.
Results
TM7SF3 regulates liver fibrosis and activation of HSCs
TM7SF3 is a nuclear seven-transmembrane protein that modulates AS 15. Given its prominent presence within the liver 15,16, our previous studies included pathway analysis of human RNA sequencing data 15 showing that knockdown of TM7SF3 in U2-OS cells led to a gene expression profile with high similarity to the hepatic fibrosis/HSC activation profile (Table S1). Consistent with this, we found the expression of Tm7sf3 mRNA is reduced in activated HSCs induced by CCl4 treatment (Fig. S1A), or MASH diet (Fig. 1A). Therefore, we hypothesized that TM7SF3 regulates HSC activation and liver fibrogenesis.
Fig. 1. TM7SF3 KO in HSCs induces fibrogenesis in liver organoids and HSCs by promoting activation and cell proliferation.

(A) Mice were fed with the MASH diet for 20 weeks, and Tm7sf3 and Acta2 mRNA levels from isolated HSCs were measured by qPCR (n=5). (B-E) WT hepatocytes, and NPCs were assembled to form liver organoids, together with either WT or inducible whole-body TM7SF3 KO HSCs as indicated (B). The liver organoids were then treated with a MASH-inducing cocktail for 14 days, and relative gene expression (C), protein levels (D), and secreted proteins (E) were measured by qPCR and ELISA for protein. (F, G) Relative gene expression in primary mouse (F) and human (G) HSCs transfected with siRNA against TM7SF3. (H, I) As described in 1F, Ki67 mRNA levels were measured (H), and HSCs were immuno-stained for Ki67 protein (green) and DAPI (blue); the bar graph shows Ki67 staining quantitation (I). Data are represented as mean ± SEM from 3 independent experiments in triplicate/ duplicate; D - two experiments in triplicate; Col3a1 (D, E), and Des (G) – one experiment in triplicate. An unpaired Mann-Whitney U test with a two-tailed distribution was performed. For C-E, one-way ANOVA test followed by Tukey’s multiple comparisons tests, was used; the scheme was created with BioRender.com. See also Figure S1.
To initially evaluate this hypothesis, we used a liver organoid model generated from wild type (WT) hepatocytes and non-parenchymal cells (NPCs), with HSCs derived from WT (WT-HSCs) mice or inducible whole-body TM7SF3KO (KO-HSCs; Fig. 1B) mice. Over 14 days in culture on 24-well ultra-low adhesion plates, these cells organize into spheroid-shaped structures. As opposed to primary cultures of hepatocytes or HSCs alone, these liver organoids contain multiple liver cell types, and express much higher levels of fibrogenic and inflammatory genes 17. To simulate the MASH process, we treated these liver organoids with a cocktail of fatty acids (FAs; palmitate 0.25 mM, oleate 0.25 mM), fructose (10 mM), and lipopolysaccharide (LPS; 1 μg/ml)18. As previously reported 19–21, this cocktail robustly activates fibrogenic and inflammatory gene expression in these liver organoids (Fig. S1B). We next assessed whether the use of TM7SF3 KO HSCs would further exaggerate fibrogenic and inflammatory programs. Since this cocktail causes robust responses (Fig. S1B), which might mask any increase due to the KO HSCs, we selected a lower dose of the cocktail (FAs; palmitate 0.1 mM; oleate 0.1 mM, fructose 2 mM, and LPS; 100 ng/ml) plus the KO HSCs. As seen in Figure 1C, in the basal condition incorporation of KO-HSCs led to greater expression of Tgfb1, Timp1, and Mcp1 compared to organoids with WT-HSCs. The MASH cocktail induced upregulation of lipid metabolism genes (Fig. S1C), with minimal effects on fibrogenic and inflammatory gene expression. On the other hand, inclusion of the TM7SF3KO HSCs resulted in greater gene and/or protein expression of an array of fibrogenic and inflammatory-related genes, including Tgfb1, Col1a1, Timp1, and Mcp1, compared to WT organoids (Fig. 1C, D). Additionally, there was a significant increase in ECM protein production and secretion in the KO HSC organoids compared to WT organoids (Fig. 1E).
The liver organoids contain a variety of cell types. To specifically examine the role of TM7SF3 in the activation of HSCs, we silenced the Tm7sf3 gene in mouse HSCs using siRNA. The knockdown (KD) of Tm7sf3 was confirmed using qPCR, with a ~90% reduction in Tm7sf3 expression compared with scrambled-siRNA transfected control HSCs (Fig. 1F). We found that TM7SF3 KD in mouse HSCs displayed significantly greater fibrogenic gene expression than control HSCs (Fig. 1F). To further establish the role of TM7SF3 in HSC activation, we studied HSCs from TM7SF3KO mice subjected to MASH diet for four weeks. As shown in Figure S1D, isolated HSCs from TM7SF3KO mice exhibited elevated expression of various fibrogenic and inflammatory genes. In addition, when the TM7SF3KO HSCs were treated with TGFβ, greater gene and protein expression levels were observed compared to WT (Fig. S1E–G). Importantly, TM7SF3-KD or KO in mouse hepatocytes or HSC-depleted NPCs do not affect fibrogenic or inflammation-related gene expression (Fig. S1H–K).
A feature of HSC activation is increased proliferation 22. Indeed, we show that TM7SF3 KO in mouse HSCs increases Ki67 mRNA levels compared to WT controls (Fig. S1L). We also assessed the role of TM7SF3 in primary human HSCs. As shown in Figures 1G and S1M-P, silencing TM7SF3 in human HSCs led to increased expression of fibrogenic genes at both the mRNA and protein levels. Additionally, we observed increased HSC proliferation, as indicated by elevated levels of Ki67 mRNA (Fig. 1H) and an increase in the number of Ki67-positive cells in human TM7SF3 KD HSCs (Fig. 1I). Taken together, these results indicate that TM7SF3 inhibits HSC differentiation and activation both in human and mouse cells and reduces fibrogenesis and inflammation in liver organoids.
HSC-specific TM7SF3 KO exacerbates MASH-induced liver fibrosis
To gain further insights into the impact of TM7SF3 KO on HSC activation and liver fibrosis, we generated a mouse model, HSC-TM7SF3KO, in which TM7SF3 is deleted in HSC by crossbreeding Tm7sf3 floxed mice with Lrat-cre mice. To validate the specificity of the KO, we examined isolated hepatocytes, NPCs, and HSCs from chow HSC-specific KO mice. As expected, Tm7sf3 expression was substantially reduced (~80%) only in the HSC-KOs compared to HSC-wild-type (HSC-WT) but was unchanged in hepatocytes or NPCs (Fig. S2A). Moreover, the basal expression levels of Col1a1 and Timp1 were significantly elevated in KO HSCs compared to WT HSCs (Fig. S2B, C). In HSC-TM7SF3KO livers from normal chow diet (NCD) mice, the relative expression of Tgfb1, Col1a1, Col3a1, and Timp1 was higher than in WT mice (Fig. S2D). Additionally, the expression of Des (desmin) and Vim (vimentin), indicative of HSC number 23, was markedly upregulated in HSC-TM7SF3KO livers (Fig. S2E).
To investigate the phenotype of whole-body and HSC-TM7SF3KO mice in vivo, we induced liver fibrosis using two models, namely CCl4 treatment and a western diet, (WD; AIN-76A). Thus, we treated tamoxifen-induced whole-body KO and WT mice with CCl4 for two weeks. As shown in Figure S3A–D, liver gene expression of the fibrosis markers Tgfb1, Col1a1, Col3a1, and Mcp1, were increased in TM7SF3KO mice treated with CCl4 compared to WT treated mice. Additionally, TM7SF3KO mice exhibited significantly greater CCl4-induced liver fibrosis than WT, as evidenced by greater Sirius red staining and α–SMA protein expression (Fig. S3E, F). We observed this same liver fibrosis phenotype with CCl4 treatment of WT vs. HSC-TM7SF3KO mice. Thus, the expression of genes related to fibrosis and inflammation, as well as protein levels, were higher in the liver and serum of HSC-TM7SF3KO mice compared to WT mice, as depicted in Figure S3G–M. Additionally, there was more liver collagen deposition in HSC-TM7SF3KO mice, as assessed by hydroxyproline levels (Fig. S3N). Next, we assessed the HSC-TM7SF3KO phenotype in the context of a MASH diet. As shown in Figure 2G and Figure S3O, no significant collagen accumulation was detected in HSC-TM7SF3KO or WT mice on the NCD. After 6 weeks on the WD, HSC-TM7SF3KO mice displayed a trend towards an increase in liver hydroxyproline content compared to WT (Fig. S3P). Strikingly, at 16 weeks of the WD, liver α–SMA immunostaining, and COL1A1, and TIMP1 protein expression were higher in HSC-TM7SF3KO livers compared to WT (Fig. 2A–C). This phenotype coincided with increased expression of inflammation markers, such as F4/80, Mcp1, and Cd68 genes (Fig. 2D), and elevated serum IL-1β, TNFα, and MCP1 levels in HSC-TM7SF3KO mice relative to their WT littermates (Fig. 2E). Blood alanine aminotransferase (ALT) levels were significantly higher in HSC-TM7SF3KO compared to WT (Fig. 2F). However, no significant changes were observed in hepatic triglyceride (TG) (Fig. S3Q) or total cholesterol levels (Fig. S3R). Importantly, liver fibrosis was markedly higher in HSC-TM7SF3KO mice than in WT, as assessed by Sirius red staining and hydroxyproline measurements (Fig. 2G, H). In contrast to the results observed in HSC-TM7SF3KO mice, hepatocyte-specific TM7SF3KO mice that were fed with MASH diet for 24 weeks showed an increase in liver TG when compared to WT (as shown in Fig. S3S). This effect was also confirmed in vitro (Fig. S3T). However, TM7SF3 KO in hepatocytes did not affect MASH-related fibrogenic gene expression (Fig. S3U) or liver fibrosis (Fig. S3V) in vivo, consistent with the results demonstrated in Figures S1H, J. Taken together, these findings underscore the role of TM7SF3 in promoting HSC activation and liver fibrosis.
Fig. 2. HSC-specific TM7SF3 KO exacerbates MASH-induced liver fibrosis.
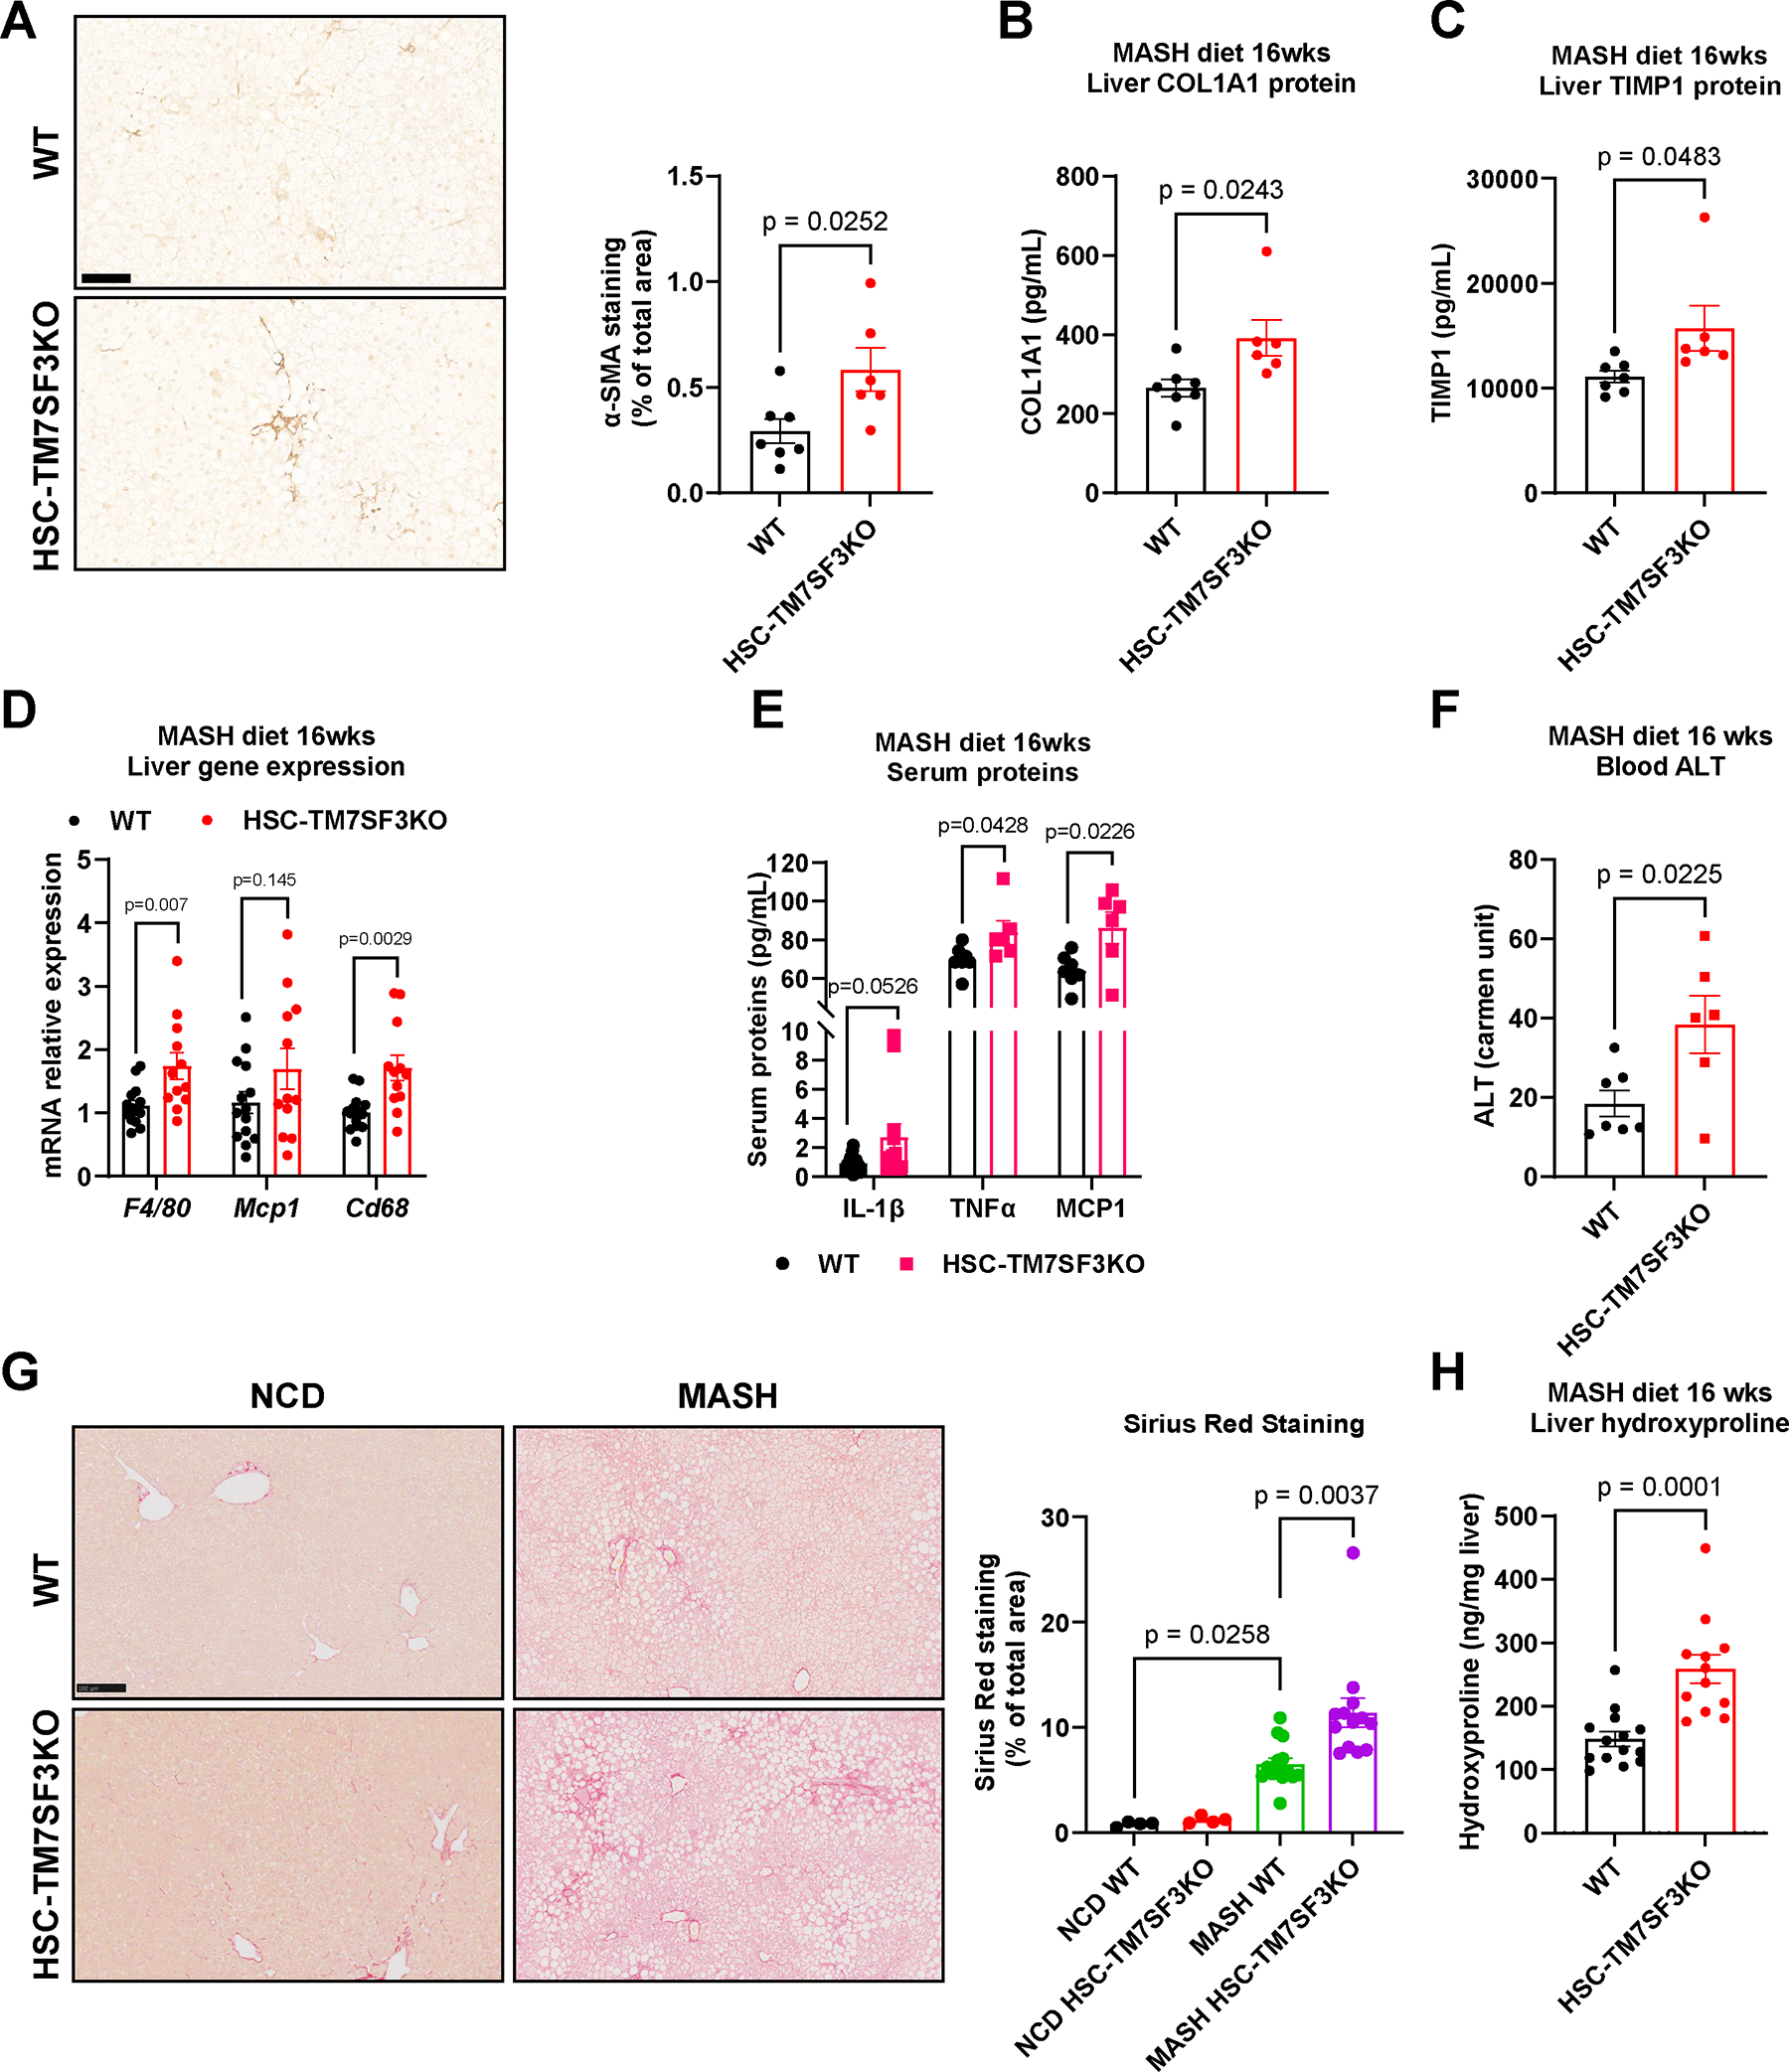
Eight-week-old WT and HSC-TM7SF3KO mice were fed WD for 16 weeks. (A) IHC of liver sections for α–SMA. The bar graph represents the quantitation of % stained area (Scale bar – 100 μM). (B, C) ELISA measured liver protein levels of COL1A1 and TIMP1. (D) Relative expression of the indicated genes. (E) ELISA measured serum proteins, IL-1β, TNFα, and MCP1. (F) Serum ALT levels. (G) Sirius Red staining of liver sections from WT and HSC-TM7SF3KO mice fed with NCD or MASH diet. The bar graph represents the quantitation of % stained area (Scale bar – 100 μM). (H) Hydroxyproline assay to measure liver collagen levels. Data are represented as mean + SEM. WT=14; KO=12; for panels A-C, F, WT=7, KO=6; E, TNFα, and MCP1, n=6; H, (NCD), n=4. An unpaired Mann-Whitney U test with two-tailed distribution was performed for WT and KO; for G, one-way ANOVA test followed by Tukey’s multiple comparisons tests was used. See also Figures S2,3.
TM7SF3 regulates HSC activation by modulation of TEAD1 alternative splicing
Alternative splicing can regulate liver physiology by splicing a variety of different genes, such as the transcription factor TEAD1 24. A previous study has shown that TEAD1 undergoes AS upon liver injury, which regulates its activity 24. In addition, analyses of DNA sequences of enhancer elements during HSC activation identified enrichment of TEAD motifs 25. Interestingly, among the TEAD family transcription factors (1–4), we found that only Tead1 expression and protein levels are enriched in HSCs compared to hepatocytes and NPCs (Fig. S4A–C).
TEAD1 pre-mRNA contains a 12nt microexon (exon 5; Ensembl - ENSE00001709621; Human GRCh38/hg38: chr11:12,878,889–12,878,900) that encodes four amino acids (VTSM) just downstream of the DNA binding helix H3 24. Importantly, exon 5 containing the inhibitory phosphorylation site exists in TEAD1 but not in the other TEAD family members (TEAD2/3/4). Therefore, we examined whether AS of TEAD1 in HSCs is related to liver injury and MASH. Interestingly, the expression of TEAD1 in which this exon is spliced out (termed TEAD1ΔEx5) is elevated in livers from mice treated with CCl4 compared to non-treated controls (Fig. S4D), and in livers from patients with MASH compared to healthy and MASLD patients (Fig. 3A). Next, we assessed TEAD1 AS in hepatocytes, NPCs and HSCs of mice that were treated with CCl4 or fed the MASH diet for 5 months. In HSCs from CCl4-treated mice (Fig. S4E, F), and mice on MASH diet (Figs. 3B, S4G), TEAD1 AS was approximately 2-fold and 6-fold higher, respectively. Importantly, TEAD1 AS did not increase in hepatocytes from mice treated with CCl4 or fed with the MASH diet when compared to controls (Figs. 3B and S4E, F). In NPCs from mice fed with the MASH diet, TEAD1 AS was ~1.2-fold higher than the control group, possibly reflecting a small residual number of HSCs in these HSC-depleted NPCs preparations (Fig. 3B). These results indicate that among liver cells, the TEAD1 AS event predominantly occurs in HSCs during fibrosis development.
Fig. 3. TM7SF3 regulates HSC activation by modulation of TEAD1 alternative splicing.

(A) RNA-seq of human liver samples, shows enhanced TEAD1 exon 5 skipping in MASH patients (Normal=4; MASLD=11; MASH=14). (B) Quantitation of % TEAD1 exon 5 skipping in liver cells from mice fed NCD or MASH diet for 5 months (n=4). (C, D) PCR of TEAD1 exon 5 splicing in U2-OS cells and human HSCs transfected with siTM7SF3 and quantification (C; + Exon 5 inclusion, - exclusion). (E) A customized siRNA was designed to silence only the active form of TEAD1. (F) PCR of TEAD1 splicing in human HSCs transfected with the indicated siRNAs. (G) Quantitation of PCR products from 3F. (H-K) Silencing of TM7SF3 in human HSCs with or without co-silencing the active form of TEAD1 (siTEAD1ΔEx5). The cells were treated with TGFβ for 24h. mRNA expression of Ctgf (H), Cyr61 (I), Acta2 (α–SMA) (J), and Il-6 (K) was measured by qPCR analysis. (L, M) Mouse liver organoids were transfected with siTEAD1ΔEx5, and fibrogenic markers were detected by qPCR (L) and ELISA (M). (N) As in 3H, cell proliferation was measured by WST-1 assay (see methods). Data are represented as mean + SEM from 3 independent experiments in triplicate/duplicate; G, I, M- two experiments in triplicate; Il-6 (K) and Col3a1 (L, M) - one experiment. A one-way ANOVA test followed by Tukey’s multiple comparisons was used. An unpaired Mann-Whitney U test with two-tailed distribution was used for panels B, D, L, M (Acta2 and Bambi in L - one-tailed). See also Figure S4.
Exon 5 in TEAD1 includes a conserved serine residue, which, when phosphorylated, strongly inhibits TEAD1’s DNA-binding ability 24. Thus, excluding this microexon should increase TEAD1 transcriptional activity 24. Indeed, we found that TM7SF3 KD in human HSCs and U2-OS cells promotes exon 5 skipping, leading to an increase in TEAD1ΔEx5 (Fig. 3C, D). Moreover, HSCs from HSC-TM7SF3KO mice exhibited much higher levels of TEAD1 exon 5 skipping compared to HSCs from WT mice (Fig. S4H). This was also observed in livers of inducible whole-body TM7SF3KO mice treated with CCl4 (Fig. S4D). Conversely, TM7SF3 knockdown or knockout in hepatocytes or NPCs did not impact TEAD1 AS and its activity, in vitro or in vivo (Figs. S4I–K). Additionally, Bangru et al. (2018) found that in liver injury, a set of genes associated with the Hippo pathway, undergo AS in hepatocytes. Based on these findings, the effect of TM7SF3 knockdown (KD) on YAP1, NF2, and CSKND1 splicing in human HSCs and mouse hepatocytes was examined. The results, as presented in Figure S4L, show that TM7SF3 KD does not affect AS of these genes.
Next, we examined whether TEAD1ΔEx5 mediates the effects of TM7SF3 KD on HSC activation. We designed an siRNA, ‘siTEAD1ΔEx5’, that targeted the exon-exon junction where the inhibitory exon 5 is spliced out (Fig. 3E). To test the efficiency and specificity of this customized siRNA, we transfected human HSCs with either siRNA against TEAD1, TEAD1ΔEx5, or siCON. While siTEAD1ΔEx5 did not inhibit TEAD1 expression (Fig. 3F), siTEAD1 caused an ~60% decrease (Fig. 3G). However, siTEAD1ΔEx5 efficiently silenced the alternatively spliced active form of TEAD1 that was induced by TM7SF3 KD (Fig. 3F). Additionally, the ability of siTEAD1ΔEx5 to specifically inhibit the active form of TEAD1ΔEx5 was shown by a decrease in the TEAD1 target genes Ctgf and Cyr61 26(Fig. 3H, I). While TM7SF3 KD caused an increase in Ctgf and Cyr61, co-silencing both TM7SF3 with siTEAD1ΔEx5 completely abolished this effect (Fig. 3H, I), and siTEAD1ΔEx5 also repressed the TM7SF3 KD-induced expression of the HSC activation marker Acta2 and the fibrogenic cytokine Il-6 (Fig. 3J, K). Interestingly, co-silencing of TM7SF3 together with TEAD1ΔEx5 was more effective in reversing Ctgf and Cyr61, but not Acta2 expression induced by TM7SF3 KD when compared to siRNA of total TEAD1 (Fig. S4M–O).
To further establish the role of TEAD1 and its exon 5 in the activation of HSCs, we overexpressed TEAD1ΔEx5 and TEAD1 full length (F.L.), in the human HSC line, LX-2 (Fig. S4P). As shown in Figure S4Q, overexpression of TEAD1ΔEx5, but not TEAD1 F.L., led to greater expression levels of the TEAD1 target genes, Ctgf, Cyr61, and Acta2, in comparison to the control cells. We conducted co-transfection experiments in LX-2 cells, with the TEAD1 isoforms along with luciferase reporter construct featuring TEAD binding sites 24. The luciferase activity derived from the TEAD reporter was significantly enhanced in LX-2 cells expressing TEAD1ΔEx5 compared with TEAD1 F.L. or control cells (Fig. S4R). Furthermore, using ChIP analyses, we observed that TEAD1ΔEx5 displayed an enriched association with its response elements on the Ctgf promoter, while TEAD1 F.L. overexpression did not exhibit this effect (Fig. S4S). We then examined the ability of siTEAD1ΔEx5 to reduce fibrosis in the more complex liver organoid system. Liver organoids were transfected every three days with siTEAD1ΔEx5 or siCON, during the 14-day culture with the MASH-inducing cocktail. As shown in Figure 3L, inhibition of TEAD1ΔEx5 resulted in a significant decrease in fibrogenic gene and protein expression but did not change the expression of the inflammation marker MCP1 (Fig. 3L, M). Interestingly, expression of Bambi, a marker for the HSC quiescent state 27, was greater when TEAD1ΔEx5 was inhibited by siTEAD1ΔEx5 compared to control (Fig. 3L). Finally, we evaluated the effects of TM7SF3 and TEAD1ΔEx5 on HSC proliferation. TM7SF3 KD promotes HSC proliferation, as measured by a previously established assay 28(Fig. 3N). Inhibition of TEAD1ΔEx5 in the basal state did not affect HSC proliferation. However, co-silencing both TM7SF3 and TEAD1ΔEx5, in basal or TGFβ-treated human HSCs, eliminates the effect of TM7SF3 KD to enhance cell proliferation (Fig. 3N).
It is known that ER stress can activate HSCs 29. Hence, we investigated whether TM7SF3 controls HSC activation through this mechanism. However, the results shown in Figure S4T indicate that the KD of TM7SF3 in human HSCs did not affect UPR marker genes.
Together, these data suggest that active TEAD1 promotes the development of MASH through HSC activation and mediates the effects of TM7SF3 KD to stimulate HSC activation and proliferation.
TM7SF3 inhibits TEAD1 alternative splicing via the hnRNPU splicing factor
Regulation of AS is generally achieved by the interaction of splicing factors with pre-mRNA sequences 30. We could not identify an RNA recognition motif (RRM) in TM7SF3 protein, but a previous study showed that TM7SF3 can bind to RNA splicing factors or other RNA-binding proteins 15. To identify the splicing factor which directly regulates TM7SF3 KD-induced TEAD1 AS, we analyzed the list of proteins that bind to TM7SF3 15, searching for possible splicing factors that contain an RNA binding motif sequence located 100bp up or downstream of TEAD1 exon 5. As shown in Figure 4A, the heterogeneous nuclear ribonucleoprotein U (hnRNPU) is the only splicing factor that has a binding motif sequence close to the TEAD1 microexon and co-immunoprecipitates with TM7SF3 protein in U2-OS cells (Fig. S5A). Interestingly, the expression of Hnrnpu is substantially higher in mouse HSCs compared to hepatocytes and NPCs (Fig. S5B).
Fig. 4. TM7SF3 inhibits TEAD1 alternative splicing via the hnRNPU splicing factor.

(A) List of potential splicing factors with a binding motif on the introns 100bp up or downstream of the TEAD1 spliced exon 5. (B) Design of primers for RNA-Immunoprecipitation (RIP). (C-E) RNA-IP in human HSCs (C) and HSCs transfected with siRNA-hnRNPU (D) or siRNA-TM7SF3 (E) with the indicated antibodies. After incubation with antibodies, RNA was eluted, and PCR was performed. (F-I) TM7SF3 was silenced by siRNA with or without co-silencing of hnRNPU in human HSCs. The cells were treated with TGFβ for 24h, and full-length TEAD1 and TEAD1ΔEx5 measured by PCR. (F) PCR of TEAD1 splicing; and TEAD1 exon 5 skipping quantification (G); mRNA expression of the indicated genes was detected by qPCR analysis (H, I). (J) Scheme of the model by which TM7SF3 regulates TEAD1 AS. TM7SF3 associates with hnRNPU and inhibits its activity to promote TEAD1 exon 5 skipping (J:b); J:a, When TM7SF3 is depleted, hnRNPU is no longer inhibited and TEAD1ΔEx5 is increased. (K) In similar experimental conditions as described in Fig. 3F, cell proliferation was assessed by Ki67 FACS immunostaining. Data are represented as mean ± SEM of 3 independent experiments in duplicate. D-G, K are from 2 experiments. A one-way ANOVA test followed by Tukey’s multiple comparison tests was used. The scheme was created with BioRender.com. See also Figure S5.
To further verify the interaction of hnRNPU with TEAD1 pre-mRNA, we performed RNA immunoprecipitation (RIP) with antibodies against hnRNPU and TM7SF3 in human HSC extracts. For TEAD1 pre-mRNA detection, primers that are downstream to the TEAD1 exon 5 were designed (Fig. 4B). As shown in Figure 4C, we observed significant enrichment of TEAD1 pre-mRNA with hnRNPU and TM7SF3 antibody precipitation compared to IgG control. TEAD1 pre-mRNA enrichment was also detected with the same RIP conditions in U2-OS cells (Fig. S5C). Moreover, silencing hnRNPU in human HSCs reduced the amount of TEAD1 pre-mRNA pulled down with antibodies against TM7SF3 compared to control (Fig. 4D). In contrast, when TM7SF3 was silenced in human HSCs, the binding of hnRNPU to TEAD1 pre-mRNA was not affected compared to controls (Fig. 4E). We hypothesize that binding of hnRNPU to TEAD1 pre-mRNA leads to skipping of exon 5. To further test this hypothesis, we used siRNA to KD hnRNPU and TM7SF3 individually or together in human HSCs. TM7SF3 KD promotes exon 5 exclusion, while no alternate splicing of exon 5 is seen with hnRNPU KD (Fig. S5D). Similarly, TM7SF3 KD promotes TGFβ-induced TEAD1 activity and HSC activation, while hnRNPU KD has no effect (Fig. S5E, F). However, hnRNPU KD reduced the ability of TM7SF3 KD to induce the splicing of TEAD1 into its active form (Fig. 4F, G). Furthermore, co-silencing of TM7SF3 and hnRNPU reduces the expression of direct TEAD1 target genes (Fig. 4H) as well as HSC activation (Fig. 4I) induced by TM7SF3 KD alone. These results suggest that TM7SF3 associates with hnRNPU and inhibits its activity to promote TEAD1 exon 5 skipping (Fig. 4J:a). When TM7SF3 is depleted, hnRNPU is no longer inhibited, and as a result, TEAD1ΔEx5 is increased and promotes HSC activation (Fig. 4J:b). Finally, si-hnRNPU in human HSCs inhibited cell proliferation promoted by TM7SF3 KD to the same degree as siTEAD1ΔEx5, as measured by Ki67 positive cells (Fig. 4K). All of these results indicate that hnRNPU binds to TEAD1 pre-mRNA and splices out the inhibitory microexon (Fig. 4J:b).
Antisense oligomer targeting TEAD1 pre-mRNA reduces HSC activation
To further assess the impact of TEAD1 AS on HSC activation and MASH progression, we designed an antisense oligomer (ASO) that targets the hnRNPU binding motif on intron 5 just downstream of exon 5 (ASO 56) (Fig. 5A). Primary human HSCs were treated with ASO 56 or control ASO for 48h followed by treatment with TGFβ for 24h. As shown in Figure 5B, treatment of control HSCs with TGFβ increased the expression of TEAD1ΔEx5, Tgfb1, Acta2, Timp1, Il-6, and Pdgfrb. However, pretreatment of HSCs with ASO 56 reduced TEAD1ΔEx5, Tgfb1, Acta2, Timp1, Il-6, and Pdgfrb (Fig. 5B). ASO 56 strongly inhibits the expression of TEAD1ΔEx5 after TGFβ stimulation indicating the efficacy of this ASO approach at targeting hnRNPU and also showing that the effects of TGFβ to increase TEAD1ΔEX5 expression are mediated through hnRNPU.
Fig. 5. ASO targeting TEAD1 pre-mRNA deactivates HSCs.

(A) Antisense oligomer (ASO) was designed to bind to TEAD1 pre-mRNA and block the binding of hnRNPU. (B) Human HSCs were transfected with the ASO for 48h and treated with TGFβ for 24h. mRNA expression of the indicated genes was detected by qPCR analysis. (C-E) Mouse Liver organoids were transfected with ASO 56, and fibrogenic markers were detected by qPCR (C), cellular protein expression (D), and secreted proteins by ELISA (E). (F, G) Mice were injected with a single IV dose (10 mg/Kg) of ASO 56, and 7 days later, hepatocytes, NPCs, and HSCs were isolated by pronase/collagenase perfusion. RNA was extracted from cells, and TEAD1ΔEx5 (F) and Cyr61 gene expression (G) were measured by qPCR analysis (n=9; HSCs, ASO Control n=8, ASO 56 n=7). (H-J) Mouse HSCs (H), hepatocytes (I), and NPCs (J) were transfected with the ASO 56 for 48h and treated with TGFβ for 24h. mRNA expression of the indicated genes was detected by qPCR analysis. Data are represented as mean ± SEM of 3–4 experiments in triplicate/duplicate; C, D, E, J -two independent experiments; Bambi and Col3a1 – one experiment. A one-way ANOVA test followed by Tukey’s multiple comparisons was used. An unpaired Mann-Whitney U test was used for panels (C-E). The scheme was created with BioRender.com. See also Figure S6.
The motif binding of hnRNPU to mouse and human TEAD1 pre-mRNA is identical, and, therefore, we also tested the effect of ASO 56 in a mouse system. First, we assessed the effect of ASO 56 on reducing the fibrogenesis program in the liver organoid system. ASO 56 or control ASO were delivered to liver organoids by transfection every three days during induction with the MASH cocktail as described above. ASO 56 treatment inhibited fibrogenic gene (Fig. 5C) and protein expression (Fig. 5D, E). In contrast, the expression of the quiescent HSC marker, Bambi, was greater with ASO 56 treatment compared to control (Fig. 5C). Finally, gene and protein expression of MCP1 was reduced in liver organoids treated with ASO 56 compared to control (Fig. 5C–E).
ASOs injected into mice are concentrated in the liver 31, and therefore, we evaluated the ability of ASO 56 to inhibit TEAD1 AS in vivo. We injected a single ASO dose (10mg/ Kg; IV) and, 7 days later, sacrificed the mice for mRNA analysis of hepatocytes, NPCs (depleted of HSCs), and HSCs. While ASO 56 did not affect TEAD1 AS in hepatocytes or NPCs, ASO 56 reduced TEAD1ΔEx5 by ~50% in HSCs (Fig. 5F). Additionally, ASO 56 reduced the basal expression of the TEAD1 target gene, Cyr61 in HSCs compared to control ASO (Fig. 5G). The finding that ASO 56 affected HSCs but not hepatocytes or NPCs was also validated in vitro. Primary mouse HSCs and NPCs (depleted of HSCs) and hepatocytes were treated with ASO 56 or control ASO for 48h followed by treatment with TGFβ for 24h. As shown in Figure 5H, ASO 56 reduced exon 5 skipping back down to the basal or control state. Moreover, treatment with ASO 56 inhibited TGFβ-induced expression of Acta2 and Col1a1 (Fig. 5H). A similar reduction was seen in plasminogen activator inhibitor 1, Pai1, and Il-6 (Fig. S6A, B), which are upregulated during HSC activation 32–34. In contrast, ASO 56 treatment did not affect TEAD1 AS or TGFβ-induced Pai1 or Il-6 expression in the hepatocytes (Fig. 5I) or NPCs (Fig. 5J). Additionally, ASO 56 effectively inhibited basal and TGFβ-induced TEAD1 AS in other fibroblast types, including primary normal adult lung fibroblasts (NALFs) and the lung fibroblast MRC5 cell line (Fig. S6C–F). TM7SF3 knockdown in NALFs resulted in higher basal and TGFβ-induced TEAD1 AS and activity (Fig. S6G–K), as well as upregulation of Col1a1 (Fig. S6L), indicating that hnRNPU-mediated AS of TEAD1 occurs in HSCs and other fibroblasts, but not in hepatocytes (Fig. 5F) or NPCs. The selectivity of hnRNPU splicing of TEAD1 exon 5 supports the potential therapeutic utility of a long-acting version of ASO 56 in humans.
ASO targeting TEAD1 pre-mRNA deactivates HSCs in vivo with anti-MASH effects
To assess the ability of ASO 56 to ameliorate the MASH phenotype in vivo, we subjected mice to a MASH diet along with ASO 56 treatment according to the protocol in Figure 6A. At eight weeks of age, male mice were fed a WD for six months. During the last two months of WD, the mice were treated with five IV injections of ASO 56 or control ASO (3mg/Kg) (Fig. 6A). As shown in Figure S6M–O, ASO 56 treatment did not affect body weight, liver mass, or fat mass.
Fig. 6. ASO targeting TEAD1 pre-mRNA deactivates HSCs in vivo with anti-MASH effects.

(A) Scheme for ASO treatment protocol of WT mice fed a Western diet for six months. (B-I) After two months of ASO IV injections, livers were removed, and markers of fibrogenic genes were detected by qPCR and protein analysis. (B) Relative gene expression of TAZ, CTGF, and Birc5. (C) Western blot of CTGF. (D) Bar graph of CTGF immunoblot densitometry, normalized to β-actin. (E) Relative gene expression of TNFα. (F-G) Western blot of IL-1β, PDGFRβ and α–SMA. (H) Bar graph of IL-1β, PDGFRβ, and α–SMA immunoblot densitometry, normalized to β-actin. (I) Timp1 protein detection by ELISA. (J) Blood ALT levels. (K) Liver sections with β-galactosidase staining (Scale bar – 100 μM). (L) Liver sections were stained with Sirius red for fibrosis detection (Scale bar – 250 μM). (M) Liver collagen levels were measured by hydroxyproline assay. Data are represented as mean ± SEM; In B, E, J, L, M data represents a meta-analysis of 2 cohorts, NCD n=8; MASH ASO CON and 56 n=16. In all the others NCD n=4; MASH ASO CON and 56 n=12 from 2 cohorts. A one-way ANOVA test followed by Tukey’s multiple comparisons tests was used. See also Figure S6.
ASO 56 treatment led to reduced expression of the TEAD1 target genes, Ctgf and Birc5, while the MASH-associated increase in Wwtr1 (TAZ) expression was unaffected (Fig. 6B–D). Moreover, liver TNFα expression (Fig. 6E) and IL-1β protein levels were reduced by treatment with ASO 56 (Fig. 6F, H). Additionally, mice fed the WD and treated with control ASO showed a robust increase in expression of the HSC activation marker, PDGFRβ, and α–SMA compared to NCD (Fig. 6F–H). At the same time, ASO 56 treatment led to a near-complete reversal of this induction (Fig. 6F–H). Consistent with this result, ASO 56 treatment also largely normalized Timp1 expression (Fig. 6I), improved blood ALT levels (Fig. 6J), and reduced liver cell senescence as evident by β-galactosidase staining 35, (Fig. 6K) when compared to MASH ASO control mice.
Liver fibrosis was also substantially improved. Thus, after 6 months of WD, the ASO control-treated mice developed the expected degree of fibrosis as shown by increased Sirius red staining and hydroxyproline concentration (Fig. 6L, M). In the ASO 56 treated mice, collagen content was markedly reduced as measured by Sirius red staining and liver hydroxyproline content (Fig. 6L, M). Together, these results indicate that in vivo ASO 56 treatment leads to decreased fibrogenesis in HSCs with reduced collagen deposition in the liver.
Discussion
HSC activation is a critical step in the pathophysiology of MASH 36, yet the underlying molecular elements that trigger and drive HSC activation are not well understood. TM7SF3 is a 7 transmembrane nuclear localized protein that participates in alternate mRNA splicing. Here we show that the TM7SF3 pathway regulates mRNA AS in HSCs and that silencing TM7SF3 accelerates proliferation and activates the fibrogenic program in mouse and human HSCs, in liver organoids, and in mouse TM7SF3KO MASH/liver fibrosis models. Moreover, we identified the Hippo pathway component TEAD1 as a mediator of the TM7SF3 effect on HSC activation and liver fibrosis. Finally, an ASO, which inhibits TEAD1 activity specifically in HSCs, deactivates HSCs and reduces liver fibrosis induced by a MASH diet in vivo. Thus, these data reveal a new role for TM7SF3 in inhibiting the Hippo pathway, HSC activation, and the development of fibrosis due to MASH.
We have found that the expression of TM7SF3 is significantly reduced in HSCs in a MASH model and in CCl4 induced liver injury. To investigate the role of TM7SF3 in the activation of HSCs and the development of fibrosis, we employed two genetic mouse models - one with tamoxifen-inducible whole-body KO and another with HSC-specific TM7SF3KO. We found that HSCs in the HSC-KO TM7SF3 mice showed substantially greater activation than WT HSCs, with fibrosis-associated genes upregulated in both the liver and HSCs from chow KO mice. We induced MASH and liver fibrosis by treating the mice with either CCl4 or feeding a western MASH diet (AIN-76A) with 0.2% cholesterol. Our findings showed that mice with whole-body KO and HSC-specific TM7SF3KO displayed increased levels of systemic and liver inflammation, fibrosis, and liver damage, in both liver fibrosis-inducing models. These findings highlight the important role of TM7SF3 in regulating HSC activation and liver fibrosis.
Our results show that TM7SF3 controls downstream components of the Hippo pathway in HSCs by increasing AS which removes exon 5 of TEAD1. Exon 5 contains an inhibitory serine phosphorylation site, so that full-length TEAD1 is relatively inactive, whereas TEAD1 missing exon 5 (TEAD1ΔEx5) is fully active. TEAD1 functions as a transcription factor within the Hippo pathway and is highly conserved and characterized by the TEA DNA binding domain 37. Among TEAD1 target genes are well-known fibrogenic factors, such as Ctgf, Cyr61, etc. 38.
We showed that TEAD1ΔEx5 is the more active form when expressed in LX-2 cells. This was demonstrated by fibrogenic gene expression, promoter binding (ChIP), and total activity (luciferase reporter) of TEADΔEx5 compared to full-length TEAD1. On the contrary, our data demonstrate that TEAD1ΔEx5 deletion, or inhibition of TEAD1 activity, inhibits the expression of a broad range of fibrogenic genes and proliferation in isolated HSCs, and decreases fibrogenic response in liver organoids, in MASH- mice and CCl4-treated animals. Our approach was to either silence the active form of TEAD1 (TEAD1ΔEx5) by siRNA or to inhibit its expression in HSCs using a specifically targeted ASO. These approaches reverse HSC activation induced by siTM7SF3, or TGFβ in vitro, or by a MASH diet in vivo. Of note, in all these conditions, the expression of full length, less active, TEAD1 did not change, indicating that only the alternatively spliced TEAD1ΔEx5 participates in HSC stimulation.
HNRNPU is a nuclear matrix protein involved in RNA splicing and transport, as well as regulation of three-dimensional chromatin structure and gene transcription 39. At the molecular level, we found that hnRNPU is the splicing factor that interacts with TM7SF3 and binds to the intronic sites that flank exon 5 of TEAD1 pre-mRNA which contains the inhibitory serine phosphorylation site. When TM7SF3 is deleted, hnRNPU promotes AS of TEAD1 by excluding exon 5. In the presence of TM7SF3, the activity of hnRNPU is inhibited, favoring production of less active full length TEAD1. Our RNP-IP data showed that both TM7SF3 and hnRNPU bind to the TEAD1 pre-mRNA in HSCs. Interestingly, the interaction of TM7SF3 with TEAD1 pre-mRNA is hnRNPU-dependent, but silencing TM7SF3 did not affect hnRNPU binding to TEAD1 pre-mRNA. Therefore, we conclude that TM7SF3 inhibits the activity of hnRNPU. A recent study showed that hepatocyte-specific hnRNPU knockout accelerates the development of MASH in vivo 40. Our results suggest a new role of hnRNPU exclusively in HSCs as a splicing factor promoting the Hippo pathway and fibrogenic gene expression.
The TEA domain comprises a three-helix bundle, where the H3 helix provides the interface for DNA binding 24, and exon 5 contains four amino acids just downstream of helix H3. Amongst these four amino acids is a conserved serine residue, which, when phosphorylated by Protein kinase A or C, strongly inhibits TEAD1’s DNA-binding ability 41,42. Exon 5 containing this inhibitory serine residue is exclusive to TEAD1 and is not found in other TEAD family members (TEAD2/3/4). Thus, the inclusion of exon 5 serves as a mechanism to reduce TEAD1 activity independent of its interaction with co-activators. To blunt TEAD1 activity, we designed an ASO (ASO 56) which specifically inhibits the binding of hnRNPU to the TEAD1 pre-mRNA just upstream of exon 5. In in vitro studies using HSCs, we found that TGFβ stimulation caused an increase in active TEAD1ΔEx5 expression and that this effect was inhibited by ASO 56-mediated blockade of the hnRNPU splicing factor. When ASO 56 was used in vivo studies to treat mice on a MASH-inducing diet, the ASO robustly reduced the expression of TEAD1ΔEx5 and its downstream fibrogenic target genes. In vivo, this resulted in amelioration of the liver fibrosis typically seen in MASH.
Our studies show that the TM7SF3/TEAD1/hnRNPU mechanism operates in human HSCs, just as in mouse HSCs. To further demonstrate the relevance of TEAD1ΔEx5 in the development of MASH disease, we found that in mouse and human livers the expression of TEAD1ΔEx5 was higher in livers of mice that were treated with CCl4.TEAD1ΔEx5 expression was also higher in livers from patients with MASH when compared to normal or MASLD livers. Moreover, studies of mouse liver cells showed that the robust increase in TEAD1 Exon 5 skipping induced by CCl4 treatment or MASH diet, is exclusively seen in HSCs, but not in hepatocytes of NPCs. Other reports support the involvement of TEAD1 in liver fibrosis. For example, Liu et al., showed that motifs for the TEAD transcription factor were enriched in activated HSC enhancers with greater acetylation of histone 3 Lysine 27, which indicates higher transcriptional activity 25.
Another interesting aspect regarding our ASOs is their specificity within liver cell types. Thus, hnRNPU-mediated AS of TEAD1 occurs in HSCs, but not in hepatocytes or other NPC types. This finding could be explained due to AS of TEAD1 in a cell-type-specific manner 43. Indeed, our studies show that hnRNPU is the splicing factor that promotes Tead1 exon 5 exclusion in HSCs, and other fibroblasts, but not in hepatocytes or NPCs. Other studies show that the splicing factor ESRP2 inhibits this splicing event in hepatocytes 24, and the RBFOX2 splicing factor can promote the inclusion of TEAD1 exon 5 in Hela cells 9.
ASOs have been used as therapeutic agents for two decades, for example to provide a splicing correction in Spinal Muscular Atrophy (SMA), an important inherited cause of infant mortality 44. Early work on the distribution of ASOs given to animals showed that the liver and kidney accumulate higher concentrations than other organs 45. Moreover, phosphorothioate oligonucleotide (PS) ASOs, as used in our study, preferentially accumulate in liver NPCs 46. Of note, the ASO doses used in our in vivo studies were 3 mg/kg for multiple injections and 10 mg/kg for a single injection. Both doses are lower than previous ASO studies that used 10–200 mg/kg 47. Since our approach utilized tail vein injections, which mainly deliver injected reagents to the liver, we believe this approach leads to higher hepatic ASO concentrations, allowing us to use the lower ASO dose.
Taken together these findings point to the therapeutic potential of the ASO 56 approach for the treatment of MASH. Thus, ASO 56 was specifically designed to interfere with the interaction between hnRNPU and the intronic sequences 3’ to exon 5 which are homologous between mice and humans. Since the hnRNPU-mediated TEAD1 exon 5 splicing event targeted by ASO 56 is selective for HSCs and was not detected in hepatocytes or NPCs, a long-acting version of ASO 56 could have therapeutic value in a chronic disease such as MASH. Indeed, previous studies have shown that chemical modifications can be made to ASOs such that their therapeutic effects can be maintained for 3–6 months in human diseases 48,49. Therefore, it is possible that this approach could have potential therapeutic benefits in MASH. This strategy might also apply to other disease conditions in which a therapeutic target is alternately spliced into a pathophysiologic factor.
In summary, this study uncovers a novel mechanism of AS controlled by the nuclear protein TM7SF3. This mechanism applies to both primary human and mouse HSCs, as well as mouse models of MASH or liver injury (CCl4) in vivo. Additionally, using an ASO approach, we have demonstrated that modulation of TEAD1 AS and its activity, can reduce steatosis and fibrosis in MASH by deactivating HSCs. In aggregate, the in vivo results are quite complementary, in that TEAD1 gain of function (TM7SF3 KO) and loss of function (ASO56 treatment) lead to opposite phenotypes with respect to MASH progression. The importance of further work in this area is highlighted by the fact that the prevalence of MASH is rising worldwide as a leading cause of liver transplantation and hepatocellular carcinoma 50.
Limitations of Study
The limitations of this study include the use of constitutive knockout (KO) of TM7SF3 in vivo rather than conditional HSC-TM7SF3KO mice, although the KO phenotype is normal when fed a normal chow diet (NCD). Although we studied double KOs of TM7SF3 and TEAD1ΔEx5 in vitro, we did not generate a double KO model for in vivo studies. Additionally, the in vivo mouse models were male mice. Also, there is currently no established technique to accurately quantitate ASO uptake in vivo, specifically into HSCs. Lastly, while we show that this TM7SF3/hnRNPU/TEAD1 axis exists in human HSCs, and that ASO56 has the expected effects in these cells, ultimate translation of these concepts into man will require much further development and work. These limitations highlight areas for future investigation.
STAR★METHODS
RESOURCE AVAILABILITY
Lead contact
Jerrold M. Olefsky (University of California, San Diego, jolefsky@health.ucsd.edu).
Materials Availability
All unique/stable reagents generated in this study are available from the Lead Contact with a completed Materials Transfer Agreement.
Data and Code availability
Data and uncropped PCR gels/western blots associated with figures 1–6 and supplementary figures 1–6 are supplied in Data S1.
No original code for this study.
Any additional information required to reanalyze the data reported in this paper is available from the lead contact upon request.
EXPERIMENTAL MODEL AND PARTICIPANT DETAILS
Cell Lines
Primary human HSCs (passages 3–5) were purified from livers using pronase perfusion and gradient centrifugation method. The HSCs, LX-2 (male), and U2OS (female) cells were cultured in DMEM supplemented with 10% FBS, 1% Pen/strep, and 1% Glutamax. The NALFs and MRC5 (male) cells were cultured in EMEM supplemented with 10% FBS, 1% Pen/strep, and 1% Glutamax at 37°C, 5% CO2.
Human specimens
Deidentified livers declined for transplantation are used in this study, the patient consent was obtained by https://www.lifesharing.org/ (Table S3). This project has been reviewed by the Director of the UCSD HRPP, IRB Chair, or IRB Chair’s designee and is certified as not qualifying as human subjects research according to the Code of Federal Regulations, Title 45, part 46 and UCSD Standard Operating Policies and Procedures, and therefore does not require IRB review. Livers were graded for steatosis, inflammation, and fibrosis by a pathologist using a double-blinded method and identified as ALD or normal. Primary human HSCs were purified from livers using pronase perfusion and gradient centrifugation methods. Human livers for TEAD1 AS analysis, were as previously described 51.
For primary NALFs, deidentified normal adult human lungs from deceased donors were obtained from the International Institute for the Advancement of Medicine (IIAM) and the University of North Carolina Marsico Lung Institute (Table S3).
Mice
Generation of TM7SF3 fl/fl mouse. A plasmid encoding the genomic tm7sf3 locus (PG00237_Z_6H11 [Tm7sf3] purchased from EuMMCR; Munich, Germany) was digested by AsiS restriction enzyme. This plasmid contains lox sites that flanking exons 5 and 6 of Tm7sf3. The linearized plasmid was then purified and transfected into C57Bl6 ES cells. Genomic DNA of transfected ES cells were screened by PCR for correct integration of the cassette with homology arms (19kb). Positive ES cells were injected into a C57Bl6 blastocyst. The chimera mice were then cross bred with C57Bl6 mice. To remove LacZ and Neomycin resistance cassettes, the litters of the chimera mice were cross bred with Rosa-26-FLPe to generate TM7SF3fl/fl mice. TM7SF3fl/fl mice were crossbred with Rosa-26-creert2 transgenic mice to generate: TM7SF3fl/fl and Rosa-26-creert2::TM7SF3fl/fl (TM7SF3 KO) mice. To generate HSC-TM7SF3KO mice, TM7SF3fl/fl male mice were crossbred with female Lrat-cre transgenic mice yielding Lrat-cre::TM7SF3fl/fl and TM7SF3fl/fl littermates. To generate Hepatocyte-TM7SF3KO mice, TM7SF3fl/fl mice were crossbred with albumin-cre transgenic mice yielding Albumin-cre::TM7SF3fl/fl and TM7SF3fl/fl littermates. Animals were housed in an animal facility on a 12h/12h light/dark cycle at room temperature of 20–22°C with free access to chow diet and water. Mice were in good health. All animal procedures were in accordance with UC San Diego and Institutional Animal Care and Used Committee-approved protocols and conformed to the Guide for Care and Use of Laboratory Animals of the National Institutes of Health. Eight-week-old male inducible whole-body TM7SF3KO and f/f mice were fed with a Tamoxifen diet for 3 weeks or Eight-week-old male HSC-TM7SF3KO and f/f mice were treated with CCl4 (gavage, 200ul/25gr of 25% CCl4 in corn oil) for 2 weeks (3 times a week)52. Eight-week-old male HSC-TM7SF3KO and f/f mice were fed with AIN-76A Western Diet for 4, 6, 16, and 20 weeks as indicated. Livers or liver cells were isolated as described for further analyses.
Study approval
All animal procedures were approved by the local Animal Care and Use Committee and performed in accordance with the University of California, San Diego Research Guidelines for the Care and Use of Laboratory Animals.
METHODS DETAILS
Hepatic stellate cell (HSC) and non-parenchymal cell (NPC) isolation
Male mouse liver was sequentially perfused via the inferior vena cava first with 40mL of buffer SC-1 (NaCl 137mM, KCl 5.37mM, NaH2PO4.H2O 0.64mM, Na2HPO4 0.85mM, HEPES 10mM, NaHCO3 4.2mM, EGTA 0.5mM, Glucose 5mM, pH 7.4), then with buffer SC-2 (As SC-1, without EGTA and Glucose, but with CaCl2.2H2O 3.8mM) with 0.5mg/mL pronase 25mL, and finally buffer SC-2 with 0.5 mg/mL collagenase D 25mL. After digestion of the clipped liver tissue in a mixture containing DNase, collagenase D and pronase for 20 minutes, the cell suspension was filtered through a 70 mm cell strainer and centrifuged at 50 × g for 1 min at 4°C. The supernatant was collected and centrifuged at 900 × g for 8 min and the pellet was washed once with GBSS buffer with CaCl2.2H2O 1.5mM and HSCs were separated by Nycodenz 8.6% gradient (2000×g for 20min.). The obtained cells in the top layer are purified HSCs. The HSCs were washed once with GBSS buffer before cultured in DMEM media at 37°C, 5% CO2, or used directly for RNA extraction.
The non-parenchymal cells that remain in the Nycodenz pellet were resuspended in SC-2 buffer and Percoll 20% (600×g for 15min.) to remove parenchymal cells. Then the pellet was washed once with SC-2 buffer and resuspended with SC-2 and 28% OptiPrep, to enrich NPCs and remove HSCs. The tube was centrifuged at 1400 × g for 25 min (4°C, low acceleration), and the cell layer between the 28% OptiPrep and cell suspension was collected. These cells were washed twice with centrifugation dilution solution (800 × g for 10 min, 4°C), treated with red blood cell lysis buffer and seeded with culture medium (10% FBS, 1% Glutmax, and 1% penicillin/streptomycin) at 37°C or used directly for RNA extraction.
Isolation of primary hepatocytes
Primary hepatocytes were isolated as described previously 53 with some modifications. Briefly, male mice were infused with a buffer SC-1 via the vena cava for 8 min. (5mL/min.; Total 40mL). After the color of the liver changed to a beige or light brown color, SC-2 buffer with 0.5mg/ml collagenase D was perfused into the liver for 5 min. (5mL/min.; Total 25mL) After the appearance of cracking on the liver surface, perfusion was stopped, and the liver was excised into SC-2 buffer. Cells from digested livers were teased out, suspended in Buffer A, filtered through a 100 mm cell strainer, and centrifuged at 50 × g for 1 min at 4°C. The pellet was resuspended with Buffer SC-2 (no collagenase) and mixed with Percoll (adjusted to physiological ionic strength with 10x PBS) to a final concentration of 27% and centrifuged at 100 × g for 10 min, 4°C. After removing the supernatant, the hepatocyte pellet was washed with Buffer SC-2 and resuspended in Williams Medium E containing 10% FBS and taken either for making liver organoids or were cultured on collagen-coated plates (GIBCO, Life Technologies) and antibiotics. After overnight incubation (16 hr), the culture medium was refreshed.
Liver organoid culture
Primary hepatocytes, NPCs and HSCs from lean male mouse were isolated as described above. About 1500–1600 hepatocytes, 500 stellate cells, and 750 Kupffer cells were seeded per well of a 96-well Ultra Low Attachment (ULA) plate at 37°C, 5% CO2. The medium volume was 200 μl per well. The plating medium was WE + Supplement cocktail A +Dexamethasone+ 5% FBS. The plate was spined at 50–100 × g for 2 min and placed in the incubator. On day 3, 100 μl of the culture medium from each well were withdrawn gently by tilting the plate. Next 100 μl of fresh WE + supplement cocktail B + Dexamethasone, without serum. was added to each well. The medium was changed (only 50% with serum-free WE+ supplement B) every 3rd day. Plate was spinned at 50 × g for 2 min each time medium replacement was carried out. Spheroids formation is visible after 3–5 days. At the end, spheroids from 8 wells were pooled for analysis.
siRNA transfection
Recipient cells were treated with siRNA (20 pmol siRNA) using the RNAiMAX reagent. Control cells were treated with a non-targeting control siRNA. The siRNAs were mixed with RNAiMAX reagent in OptiMEM media, and then incubated for 15 min at room temperature. This mixture was then added to the cell media for 6h following by media replacement. The cells were transfected for 48 h and then transfected again for an additional 48 h. The media was then replaced to serum free media overnight before treatment with TGFβ (5ng/mL) as indicated.
ASO transfection or in vivo treatment
The ASO (500nM) was mixed with lipofectamine RNAiMAX reagent and transfected into recipient cells with OptiMEM media. After 6 h, the OptiMEM was replaced to DMEM media with 10%FBS, 1% Pen/Strep and 1% Glutamax. After 48 h the cells were treated with TGFβ as described above. For in vivo delivery, the ASO 56 or ASO control (3 or 10 mg/Kg as indicated) were injected into the tail vein of recipient WT mice.
Quantitative reverse transcription-polymerase chain reaction (RT-PCR) and PCR analysis
Total RNA was extracted from liver tissue, primary cells and cultured cells using TRIzol reagent according to the manufacturer standard protocol. First-strand cDNA was synthesized using Reverse transcriptase and random hexamers. Quantitative PCR (qPCR) was carried out in 10 ml reactions using SYBR Green mix on an StepOnePlus Real Time PCR system (ABI). Relative Gene expression was calculated as mRNA level normalized to that of a standard housekeeping gene (36B4) using the 2−ΔΔCT method. The specificity of the PCR amplification was verified by melting curve analysis of the final products using StepOne software (v2.3). Primer sequences were provided in Table S2.
RNA-IP
For RNA-immunoprecipitation (RIP) experiments, human HSCs and U2-OS cells were homogenized in lysis TSE buffer (150 mM NaCl, 20 mM Tris-HCl, (pH 7.4), 2mM EDTA, 1% Triton X-100, 0.1% SDS, 0.2 mM PMSF, with protease and phosphatase inhibitors) and 400 mg of cell lysate protein was incubated overnight with protein G beads and antibody complexes as indicated. The Beads were washed with TSE buffer three times, and RNA was eluted with TE buffer containing 10 mM DTT by shaking tubes in 37°C for 30 minutes. RNA was extracted from the elution followed by reverse transcription reaction and a PCR with primers for TEAD1 pre-mRNA (Table S2).
Western blot analysis
Primary human HSCs, liver, were homogenized in RIPA buffer supplemented with protease and phosphatase inhibitors. Tissue and cell lysates were subjected to Western blotting and proteins were detected by corresponding antibodies. The protein bands were analyzed using densitometry and Image J image analysis software, normalizing to housekeeping protein such as HSP90 or beta-actin bands. Arbitrary densitometry units were quantified by ImageJ analysis.
Histopathological analysis, and immunofluorescence microscopy
Formalin-fixed, paraffin-embedded mouse liver sections were stained with Picrosirius (Sirius) red to assess liver fibrosis. The stained sections were digitally scanned, and 20–30 frames (with the indicated scale bar) were taken from each section. The staining intensity was then analyzed by MATLAB R2023a software.
For immunofluorescence staining, cells (5× 10⁴ cells/well; 24 wells/plate) were grown on glass coverslips; washed with PBS and fixed with 4% paraformaldehyde for 17 min at 22°C. Cells were permeabilized with 0.5% triton-X100 in PBS for 4 min, and thereafter blocked for 30 min in a blocking solution (Tris 10 mM, NaCl 150 mM, 0.5% Triton X-100, 10% normal Goat serum, 2% BSA, 1% Glycine, Ph 7.4). Cells were subjected to indirect immunofluorescence with the indicated antibodies diluted in blocking solution for 1 h at 22°C. Cell were washed with PBS and primary antibodies were detected with Alexa488 Goat anti-rabbit secondary antibodies (Abcam, diluted 1:200 in PBS with 20% Normal horse serum) for 1 h at 22°C. Cells were washed with PBS. Staining of nuclei was performed using and DAPI (0.5 μg/ml). The specimens were washed several times with PBS and were mounted with Immu-mount (Thermo Scientific; Cheshire, UK) overnight on glass microscope slides. Images were obtained as single optical slides using Leica TCS SP8 confocal microscope SP8 LIGHTNING.
For Senescence-associated β-galactosidase staining, fresh frozen liver sections were fixed with 4% paraformaldehyde for 2 hours. These were rehydrated with PBS and stained with X-gal using Senescence Detection Kit, and incubated for 12 hours at 37°C, according to manufacturer’s protocol. At least 3 visual fields of a magnified image (original magnification, x200) were randomly selected for each section, and the positive area was calculated.
Human HSC FACS analysis
HSCs were dissociated from the plate with trypsin, washed, and blocked with FC Block and anti-CD16/32 solution. Viability and surface staining were done with a mix of PBS, FC-Block, and Zombie NIR. Fixation/Permeabilization working solution was added, and cells were stained with the intracellular antibody (Ki67) permeabilization buffer. After staining, cells were washed and were resuspend in 300μL FACS Buffer.
HSC proliferation Assay
Proliferation of human HSCs was measured using the WST-1 cell proliferation kit as previously described 28. Briefly, HSCs in 96-well plates were transfected with siRNAs as described above. After 4 days, the cells were cultured overnight in fresh DMEM without FBS followed by culturing in DMEM and TGFβ (5ng/mL) for an additional 24 h. The media were changed to fresh DMEM, and the WST-1 reagent was added for 4 h, followed by assaying absorbance at 440 nm with a plate reader.
Measurement of hydroxyproline content of liver tissue
Hydroxyproline liver content was measured as previously described 54. Briefly, liver tissues were incubated with 6N hydrochloric acid for 30 min in 110°C followed by homogenization. Then, samples were hydrolyzed by incubation with 6N hydrochloric acid at 110°C for 16 h followed by neutralization with sodium hydroxide. Liver hydrolysates were oxidized using chloramine-T, followed by incubation with Ehrlich’s perchloric acid reagent for color development. Absorbance was measured at 560 nm, and hydroxyproline quantities were calculated by reference to standards processed in parallel. Results are expressed as ng per mg liver weight.
ChIP qPCR
LX-2 cells were cultured in DMEM until reaching approximately 90% confluency and then transfected with the active and less active variants of TEAD1 plasmids. A day post-transfection, cells were fixed using 1% formaldehyde in PBS for 10 minutes at RT. The fixation reaction was neutralized with 1.25 M glycine at 1:10 ratio and incubated for 5 minutes at RT. After a single ice-cold 1X PBS wash, cells were collected in a 1.5 ml Lobind tube via scraping in ice-cold PBS, then centrifuged at 250 g for 10 minutes at 4°C. The supernatant was discarded, and cellular pellets were stored at −80°C. For nuclei isolation, cells were lysed in hypotonic lysis buffer (HEPES pH9 10 mM, KCL 85 mM, IGEPAL 0.5%, prepared in PBS) containing protease inhibitors. After 10 minutes incubation at 4°C, nuclei were centrifuged at 500 g for 6 min at 4°C, resuspended in RIPA buffer (Tris-HCl 50 mM, NaCl 150 mM, EDTA 1 mM, IGEPAL 1%, Sodium Deoxycholate 0.25%, 0.5 % SDS) and underwent chromatin shearing using the Pixul (# P00326–03, Active Motif) settings (Pulse [N]- 50, PRF [kHz]- 1.00, time – 1 hour, Burst rate [Hz]- 20). The sonicated samples were centrifuged at 16,000 g for 15 min at 4°C, and a fraction was reserved as input. The remaining sample was diluted to adjust the SDS concentration to 0.1%. The diluted chromatin samples were incubated overnight at 4°C with the MYC antibody Dyna-beads-protein G (#10003D, ThremoFisher Scientific) complex. Post-incubation, beads were washed 3 times with WBI buffer (Tris-HCl 20 mM pH 7.5, NaCl 150 mM, SDS 0.1%, Triton X-100– 1%, EDTA 2 mM), 3X with WBII buffer (LiCl 250 mM, Triton X-100– 1%, Sodium Deoxycholate 0.7%, Tris-HCl 10 mM pH 7.5, EDTA 1 mM) and 2X with TET buffer (Tris 10 mM pH 7.5, EDTA 1 mM, Tween20– 0.2%). Wash buffers were supplemented with protease inhibitors. Both input and ChIP samples were purified de-crosslinked at 55°C for 1 hour and 65°C for 4 hours after the addition of elution buffer (388 mM NaCl, 19mM EDTA, and 1mM Proteinase K, and 0.67% SDS). DNA was purified using SPRI beads (# B23318, Beckman Coulter), and DNA was eluted in 25 ul of TT buffer (10 mM Tris pH 8 dissolved in 0.05% Tween 20). Data were analyzed using 2−ΔΔCT approach, and fold enrichment was normalized against the empty vector and negative control after normalizing for Tead1 protein levels. Statistical analysis was done using GraphPad Prism 10 software.
QUANTIFICATION AND STATISTICAL ANALYSIS
Experimental conditions of the groups were not blinded. The data are presented as mean ± standard error of the mean (SEM), with the numbers (n) of experiments and mice indicated in the figure or figure legend. To test the statistical difference between two groups, an unpaired Mann-Whitney U test with two-tailed distribution and for more than two groups, an ANOVA one-way test followed by Tukey’s multiple comparisons tests was performed with Prism9 software (GraphPad Software, San Diego, CA). Data distribution was assumed to be normal, but this was not formally tested. Samples or animals were only excluded for technical reasons, including insufficient sample quality (e.q. low viability), or undetermined gene expression for PCR data. Outliers were identified by the ROUT test (Q=0.2%; with an Asterix in Data S1). P-values of 0.05 or less were statistically significant.
Supplementary Material
Data S1. Unprocessed source data underlying all blots and graphs, related to Figures 1, 2, 3, 4, 5, 6, and S1–S6.
Table S1. Ingenuity canonical pathway analysis. TM7SF3 was knockdown in U2-OS cells, and Ingenuity canonical pathway analysis was performed on RNA sequencing gene expression, related to Figure 1.
Table S3. Characteristics of human donor samples that were used for HSCs, and NALFs, related to Figures 1, 3–5.
KEY RESOURCES TABLE.
| REAGENT or RESOURCE | SOURCE | IDENTIFIER |
|---|---|---|
| Antibodies | ||
| Rabbit polyclonal anti-HSP90 | Cell Signaling Technology | Cat#4874; RRID: AB_2121214 |
| Rabbit polyclonal anti-β-actin | Cell Signaling Technology | Cat#4970; RRID:AB_2223172 |
| Rabbit polyclonal anti-TEAD1 | Cell Signaling Technology | Cat12292; RRID:AB_2797873 |
| Rabbit polyclonal anti-Ki67 | Abcam | Cat#ab15580; RRID:AB_443209 |
| Rabbit polyclonal anti-CTGF | Abcam | Cat#ab6992; RRID:AB_305688 |
| Mouse monoclonal anti-Alpha-SMA | Invitrogen | Cat#14-9760-82; RRID:AB_2572996 |
| Mouse monoclonal anti-F4/80 | Invitrogen | Cat#14-4801-82; RRID:AB_467558 |
| Rabbit anti-IgG | Santa Cruz Biotechnology | Cat#sc-2027; RRID: AB_737197 |
| Mouse anti-IgG2B | Santa Cruz Biotechnology | Cat#sc-3879; RRID:AB_737262 |
| Mouse monoclonal anti-p21 | Santa Cruz Biotechnology | Cat#sc-6246; RRID:AB_628073 |
| Rabbit polyclonal anti-IL1-β | Santa Cruz Biotechnology | Cat#sc-7884; RRID:AB_2124476 |
| Mouse monoclonal anti-hnRNPU | Santa Cruz Biotechnology | Cat#: sc-32315; RRID: AB_627741 |
| Mouse monoclonal anti-Col1a1 | Santa Cruz Biotechnology | Cat#: sc-293182; RRID: AB_2797597 |
| Mouse monoclonal anti-Myc | Santa Cruz Biotechnology | Cat#: sc-40; RRID: AB_627268 |
| Rabbit polyclonal anti-PDGFRβ | Santa Cruz Biotechnology | Cat#: sc-432; RRID: AB_631068 |
| Rabbit polyclonal anti-TM7SF3 | Generated by Dr. Yehiel Zick, Weizmann Institute of Science | 15 |
| Oligonucleotides | ||
| List of primers for qPCR, PCR, and ChIP see Table S2 | ||
| siRNA-mouse TM7SF3 | Horizon Discovery | Cat# M-057504-02-0005 |
| siRNA-human TM7SF3 | Horizon Discovery | Cat# M-005745-00-0010 |
| siRNA-human/mouse TEAD1ΔEx5 Sense:AUUCCAAGCUAAAGGAUCAGAUU Antisense:UCUGAUCCUUUAGCUUGGAAUUU | Horizon Discovery | N/A (custom siRNA) |
| siRNA-Human TEAD1 | Horizon Discovery | Cat# M-012603-01-0005 |
| Mouse siCON | Horizon Discovery | Cat# D-OO1210-05-05 |
| Human siCON | Horizon Discovery | Cat# D-OO1206-13-20 |
| siRNA-Human hnRNPU | Horizon Discovery | Cat# M-013501-01-0005 |
| ASO 56 /52MOErC/*/i2MOErA/*/i2MOErG/*/i2MOErC/*/i2MOErT/*/i2MOErA/*/i2MOErA/*/i2MOErA/*/i2MOErA/*/i2MOErT/*/i2MOErA/*/i2MOErC/*/i2MOErA/*/i2MOErG/*/i2MOErA/*/i2MOErA/*/i2MOErT/*/i2MOErA/*/i2MOErC/*/i2MOErT/*/i2MOErC/*/32MOErA/ |
Integrated DNA Technologies | N/A |
| NC5 MOE SSO (22mer) /52MOErG/*/i2MOErC/*/i2MOErG/*/i2MOErA/*/i2MOErC/*/i2MOErT/*/i2MOErA/*/i2MOErT/*/i2MOErA/*/i2MOErC/*/i2MOErG/*/i2MOErC/*/i2MOErG/*/i2MOErC/*/i2MOErA/*/i2MOErA/*/i2MOErT/*/i2MOErA/*/i2MOErT/*/i2MOErG/*/i2MOErG/*/32MOErT/ |
Integrated DNA Technologies | N/A |
| Chemicals, and recombinant proteins | ||
| Percoll | GE Healthcare Life Sciences | Cat# 17-0891-01 |
| Formaldehyde | ThermoFisher Scientific | Cat#28906 |
| TRIzol RNA isolation reagent | ThermoFisher Scientific | Cat# 15596026 |
| SuperSignal West Pico Chemiluminescent Substrate | ThermoFisher Scientific | Cat# 34077 |
| RIPA Lysis Buffer System | Santa Cruz | Cat# sc-24948A |
| LPS | Sigma | Cat# L2630-10MG |
| SYBR Green Master Mix | ThermoFisher Scientific | Cat# A25743 |
| RBC lysis buffer | eBioscience | Cat# 00-4333-57 |
| Direct Red 80 (for Sirius red staining) | Sigma | Cat# 366648 |
| High-capacity cDNA reverse Transcription kit | ThermoFisher Scientific | Cat# 4368813 |
| Lipofectamine RNAiMAX reagent | ThermoFisher Scientific | Cat# 13778-075 |
| Pronase | Roche | Cat# 11459643001 |
| Collagenase D | Roche | Cat# 11088882001 |
| DNAnase I | Roche | Cat# 10104159001 |
| Protease inhibitors | Life Technologies Corporation | Cat#A32963 |
| Proteinase K | NEB | Cat#P8107S |
| Critical commercial assays | ||
| Mouse collagen I ELISA kit | AVIVA systems biology | Cat# OKEH00544 |
| Mouse collagen III ELISA kit | Abbexa | Cat#: abx255283 |
| Mouse Timp1 ELISA kit | RayBiotech | Cat#: ELM-TIMP1-CL |
| Mouse MCP-1 ELISA kit | BioLegend | Cat#: 446207 |
| Plasmids | ||
| Myc-Human-TEAD1 | Addgene | Cat#33109 |
| Myc-Human-TEAD1ΔEx5 | This paper | |
| pcDNA3.1 | Addgene | Cat#V790-20 |
| Pgl4.75 [hRluc/CMV] | Promega | Cat# E6931 |
| 8Xgtiic-luciferase | Addgene | Cat#34615 |
| Critical Commercial Assays | ||
| WST-1 assay | Sigma | Cat#5015944001 |
| Dual-Luciferase Reporter Assay System | Promega | Cat#E1910 |
| ALT Activity Assay Kit | Elabscience | Cat#E-BC-K235-S |
| Senescence Detection Kit | Abcam | Ab65351 |
| Experimental Models: Cell Lines | ||
| U2OS cells | ATCC | HTB-96 |
| MRC5 cells | ATCC | CCL-171 |
| LX-2 cells | Generated by Dr. Scott Friedman | |
| NALFs | Dr. Zea Borok, UCSD | |
| Experimental Models: Organisms/Strains | ||
| Mouse: C57Bl6/J | Jackson Laboratories | JAX: 000664 |
| Mouse: Rosa-26-FLPe | Jackson Laboratories | JAX: 003946 |
| Mouse: Rosa-26-creert2 | Jackson Laboratories | JAX: 008463 |
| Mouse: Lrat-cre | Dr. Robert Schwabe, Columbia University | |
| Mouse: TM7SF3fl/fl | This paper | |
| Mouse: Rosa-26-creert2:: TM7SF3fl/fl | This paper | |
| Mouse: Lrat-cre:: TM7SF3fl/fl | This paper | |
| Mouse: Albumin-cre:: TM7SF3fl/fl | This paper | |
| Software and Algorithms | ||
| FlowJo | FlowJo | N/A |
| SFmap | Technion | http://sfmap.technion.ac.il/ |
| Image J | NIH | https://imagej.nih.gov/ij/ |
| Prism | Graphpad | Version 10 |
| Image Lab | BioRad | https://www.bio-rad.com/en-us/product/chemidoc-xrs-system?ID=NINJHRKG4 |
| Other | ||
| Laboratory Rodent Diet (Chow) | LabDiet | Cat# 5001 |
| AIN-76A Western Diet | TestDiet | Cat# 5342 |
| Tamoxifen Diet | ENVIGO | Cat# TD.130859 |
| 96-well Ultra Low Attachment (ULA) plate | Corning | Cat#4515 |
| Lobind tube | Eppendorf | Cat#022431021 |
Highlights.
TM7SF3 knockdown increases HSC activation and worsens MASH fibrosis in vivo.
Inhibiting TEAD1 splicing with an ASO reduces HSC activation and liver fibrosis.
Active TEAD1ΔEx5 mediates HSC activation and liver fibrosis in MASH.
TM7SF3 inhibits hnRNPU-mediated splicing of TEAD1 into the more active form.
ACKNOWLEDGEMENTS
We would like to thank the UCSD Transgenic, CRISPR Mutagenesis, and Knock-Out Mouse Core for helping to generate the TM7SF3 floxed mice. We would also like to thank Dr. Tatiana Kisseleva and the lifesharing OPO for providing primary human HSCs, and LX-2 cells (generated by Dr. Scott Friedman). We would like to thank Dr. Robert Schwabe for providing Lrat-Cre transgenic mice. Finally, we thank Jachelle Pimentel and Jan Pferdekamper for their technical assistance. This study was funded by the National Institutes of Health (DK099205, AA028550, DK101737, AA011999, DK120515, AA029019, DK091183 to T.K.; NINDS P30 NS047101 to UCSD microscopy core; DK063491 and DK101395 to J.M.O), by the Swiss National Science Foundation (P2BSP3_200177 to T.V.R.), the Larry L. Hillblom Foundation (2023-D-012-FEL to T.V.R.), and Janssen Pharmaceuticals to J.M.O.
Footnotes
Declaration of Interests
R.I. and J.M.O. are co-inventors on a provisional patent for the use of ASO 56 as an inhibitor of liver fibrosis.
Publisher's Disclaimer: This is a PDF file of an unedited manuscript that has been accepted for publication. As a service to our customers we are providing this early version of the manuscript. The manuscript will undergo copyediting, typesetting, and review of the resulting proof before it is published in its final form. Please note that during the production process errors may be discovered which could affect the content, and all legal disclaimers that apply to the journal pertain.
REFERENCES
- 1.Yeh ML, and Yu ML (2023). From nonalcoholic steatohepatitis, metabolic dysfunction-associated fatty liver disease, to steatotic liver disease: Updates of nomenclature and impact on clinical trials. Clin Mol Hepatol 29, 969–972. 10.3350/cmh.2023.0359. [DOI] [PMC free article] [PubMed] [Google Scholar]
- 2.Benedict M, and Zhang X (2017). Non-alcoholic fatty liver disease: An expanded review. World J Hepatol 9, 715–732. 10.4254/wjh.v9.i16.715. [DOI] [PMC free article] [PubMed] [Google Scholar]
- 3.Vieira Barbosa J, and Lai M (2021). Nonalcoholic Fatty Liver Disease Screening in Type 2 Diabetes Mellitus Patients in the Primary Care Setting. Hepatol Commun 5, 158–167. 10.1002/hep4.1618. [DOI] [PMC free article] [PubMed] [Google Scholar]
- 4.Godoy-Matos AF, Silva Junior WS, and Valerio CM (2020). NAFLD as a continuum: from obesity to metabolic syndrome and diabetes. Diabetol Metab Syndr 12, 60. 10.1186/s13098-020-00570-y. [DOI] [PMC free article] [PubMed] [Google Scholar]
- 5.Zisser A, Ipsen DH, and Tveden-Nyborg P (2021). Hepatic Stellate Cell Activation and Inactivation in NASH-Fibrosis-Roles as Putative Treatment Targets? Biomedicines 9. 10.3390/biomedicines9040365. [DOI] [PMC free article] [PubMed] [Google Scholar]
- 6.Hou W, and Syn WK (2018). Role of Metabolism in Hepatic Stellate Cell Activation and Fibrogenesis. Front Cell Dev Biol 6, 150. 10.3389/fcell.2018.00150. [DOI] [PMC free article] [PubMed] [Google Scholar]
- 7.Tomita K, Teratani T, Suzuki T, Shimizu M, Sato H, Narimatsu K, Okada Y, Kurihara C, Irie R, Yokoyama H, et al. (2014). Free cholesterol accumulation in hepatic stellate cells: mechanism of liver fibrosis aggravation in nonalcoholic steatohepatitis in mice. Hepatology 59, 154–169. 10.1002/hep.26604. [DOI] [PubMed] [Google Scholar]
- 8.Burglin TR (1991). The TEA domain: a novel, highly conserved DNA-binding motif. Cell 66, 11–12. 10.1016/0092-8674(91)90132-i. [DOI] [PubMed] [Google Scholar]
- 9.Kim CL, Choi SH, and Mo JS (2019). Role of the Hippo Pathway in Fibrosis and Cancer. Cells 8. 10.3390/cells8050468. [DOI] [PMC free article] [PubMed] [Google Scholar]
- 10.Boopathy GTK, and Hong W (2019). Role of Hippo Pathway-YAP/TAZ Signaling in Angiogenesis . Front Cell Dev Biol 7, 49. 10.3389/fcell.2019.00049. [DOI] [PMC free article] [PubMed] [Google Scholar]
- 11.Mokhtari RB, Ashayeri N, Baghaie L, Sambi M, Satari K, Baluch N, Bosykh DA, Szewczuk MR, and Chakraborty S (2023). The Hippo Pathway Effectors YAP/TAZ-TEAD Oncoproteins as Emerging Therapeutic Targets in the Tumor Microenvironment. Cancers (Basel) 15. 10.3390/cancers15133468. [DOI] [PMC free article] [PubMed] [Google Scholar]
- 12.Zhao B, Ye X, Yu J, Li L, Li W, Li S, Yu J, Lin JD, Wang CY, Chinnaiyan AM, et al. (2008). TEAD mediates YAP-dependent gene induction and growth control. Genes Dev 22, 1962–1971. 10.1101/gad.1664408. [DOI] [PMC free article] [PubMed] [Google Scholar]
- 13.Li F, Negi V, Yang P, Lee J, Ma K, Moulik M, and Yechoor VK (2022). TEAD1 regulates cell proliferation through a pocket-independent transcription repression mechanism. Nucleic Acids Res 50, 12723–12738. 10.1093/nar/gkac1063. [DOI] [PMC free article] [PubMed] [Google Scholar]
- 14.Isaac R, Goldstein I, Furth N, Zilber N, Streim S, Boura-Halfon S, Elhanany E, Rotter V, Oren M, and Zick Y (2017). TM7SF3, a novel p53-regulated homeostatic factor, attenuates cellular stress and the subsequent induction of the unfolded protein response. Cell Death Differ 24, 132–143. 10.1038/cdd.2016.108. [DOI] [PMC free article] [PubMed] [Google Scholar]
- 15.Isaac R, Vinik Y, Mikl M, Nadav-Eliyahu S, Shatz-Azoulay H, Yaakobi A, DeForest N, Majithia AR, Webster NJG, Shav-Tal Y, et al. (2022). A seven-transmembrane protein-TM7SF3, resides in nuclear speckles and regulates alternative splicing. iScience 25, 105270. 10.1016/j.isci.2022.105270. [DOI] [PMC free article] [PubMed] [Google Scholar]
- 16.Vassilatis DK, Hohmann JG, Zeng H, Li F, Ranchalis JE, Mortrud MT, Brown A, Rodriguez SS, Weller JR, Wright AC, et al. (2003). The G protein-coupled receptor repertoires of human and mouse. Proc Natl Acad Sci U S A 100, 4903–4908. 10.1073/pnas.0230374100. [DOI] [PMC free article] [PubMed] [Google Scholar]
- 17.Harrison SP, Baumgarten SF, Verma R, Lunov O, Dejneka A, and Sullivan GJ (2021). Liver Organoids: Recent Developments, Limitations and Potential. Front Med (Lausanne) 8, 574047. 10.3389/fmed.2021.574047. [DOI] [PMC free article] [PubMed] [Google Scholar]
- 18.Gao H, Jin Z, Bandyopadhyay G, Cunha ERK, Liu X, Zhao H, Zhang D, Jouihan H, Pourshahian S, Kisseleva T, et al. (2022). MiR-690 treatment causes decreased fibrosis and steatosis and restores specific Kupffer cell functions in NASH. Cell Metab 34, 978–990 e974. 10.1016/j.cmet.2022.05.008. [DOI] [PMC free article] [PubMed] [Google Scholar]
- 19.Broutier L, Andersson-Rolf A, Hindley CJ, Boj SF, Clevers H, Koo BK, and Huch M (2016). Culture and establishment of self-renewing human and mouse adult liver and pancreas 3D organoids and their genetic manipulation. Nat Protoc 11, 1724–1743. 10.1038/nprot.2016.097. [DOI] [PubMed] [Google Scholar]
- 20.Elbadawy M, Yamanaka M, Goto Y, Hayashi K, Tsunedomi R, Hazama S, Nagano H, Yoshida T, Shibutani M, Ichikawa R, et al. (2020). Efficacy of primary liver organoid culture from different stages of non-alcoholic steatohepatitis (NASH) mouse model. Biomaterials 237, 119823. 10.1016/j.biomaterials.2020.119823. [DOI] [PubMed] [Google Scholar]
- 21.McCarron S, Bathon B, Conlon DM, Abbey D, Rader DJ, Gawronski K, Brown CD, Olthoff KM, Shaked A, and Raabe TD (2021). Functional Characterization of Organoids Derived From Irreversibly Damaged Liver of Patients With NASH. Hepatology 74, 1825–1844. 10.1002/hep.31857. [DOI] [PMC free article] [PubMed] [Google Scholar]
- 22.Gandhi CR (2017). Hepatic stellate cell activation and pro-fibrogenic signals. J Hepatol 67, 1104–1105. 10.1016/j.jhep.2017.06.001. [DOI] [PMC free article] [PubMed] [Google Scholar]
- 23.Zhang D, Zhuang R, Guo Z, Gao M, Huang L, You L, Zhang P, Li J, Su X, Wu H, et al. (2018). Desmin- and vimentin-mediated hepatic stellate cell-targeting radiotracer (99m)Tc-GlcNAc-PEI for liver fibrosis imaging with SPECT. Theranostics 8, 1340–1349. 10.7150/thno.22806. [DOI] [PMC free article] [PubMed] [Google Scholar]
- 24.Bangru S, Arif W, Seimetz J, Bhate A, Chen J, Rashan EH, Carstens RP, Anakk S, and Kalsotra A (2018). Alternative splicing rewires Hippo signaling pathway in hepatocytes to promote liver regeneration. Nat Struct Mol Biol 25, 928–939. 10.1038/s41594-018-0129-2. [DOI] [PMC free article] [PubMed] [Google Scholar]
- 25.Liu X, Xu J, Rosenthal S, Zhang LJ, McCubbin R, Meshgin N, Shang L, Koyama Y, Ma HY, Sharma S, et al. (2020). Identification of Lineage-Specific Transcription Factors That Prevent Activation of Hepatic Stellate Cells and Promote Fibrosis Resolution. Gastroenterology 158, 1728–1744 e1714. 10.1053/j.gastro.2020.01.027. [DOI] [PMC free article] [PubMed] [Google Scholar]
- 26.Stein C, Bardet AF, Roma G, Bergling S, Clay I, Ruchti A, Agarinis C, Schmelzle T, Bouwmeester T, Schubeler D, and Bauer A (2015). YAP1 Exerts Its Transcriptional Control via TEAD-Mediated Activation of Enhancers. PLoS Genet 11, e1005465. 10.1371/journal.pgen.1005465. [DOI] [PMC free article] [PubMed] [Google Scholar]
- 27.Tao L, Xue D, Shen D, Ma W, Zhang J, Wang X, Zhang W, Wu L, Pan K, Yang Y, et al. (2018). MicroRNA-942 mediates hepatic stellate cell activation by regulating BAMBI expression in human liver fibrosis. Arch Toxicol 92, 2935–2946. 10.1007/s00204-018-2278-9. [DOI] [PMC free article] [PubMed] [Google Scholar]
- 28.Wang X, Zheng Z, Caviglia JM, Corey KE, Herfel TM, Cai B, Masia R, Chung RT, Lefkowitch JH, Schwabe RF, and Tabas I (2016). Hepatocyte TAZ/WWTR1 Promotes Inflammation and Fibrosis in Nonalcoholic Steatohepatitis. Cell Metab 24, 848–862. 10.1016/j.cmet.2016.09.016. [DOI] [PMC free article] [PubMed] [Google Scholar]
- 29.Koo JH, Lee HJ, Kim W, and Kim SG (2016). Endoplasmic Reticulum Stress in Hepatic Stellate Cells Promotes Liver Fibrosis via PERK-Mediated Degradation of HNRNPA1 and Up-regulation of SMAD2. Gastroenterology 150, 181–193 e188. 10.1053/j.gastro.2015.09.039. [DOI] [PubMed] [Google Scholar]
- 30.Lee Y, and Rio DC (2015). Mechanisms and Regulation of Alternative Pre-mRNA Splicing. Annu Rev Biochem 84, 291–323. 10.1146/annurev-biochem-060614-034316. [DOI] [PMC free article] [PubMed] [Google Scholar]
- 31.Prakash TP, Graham MJ, Yu J, Carty R, Low A, Chappell A, Schmidt K, Zhao C, Aghajan M, Murray HF, et al. (2014). Targeted delivery of antisense oligonucleotides to hepatocytes using triantennary N-acetyl galactosamine improves potency 10-fold in mice. Nucleic Acids Res 42, 8796–8807. 10.1093/nar/gku531. [DOI] [PMC free article] [PubMed] [Google Scholar]
- 32.Zhang LP, Takahara T, Yata Y, Furui K, Jin B, Kawada N, and Watanabe A (1999). Increased expression of plasminogen activator and plasminogen activator inhibitor during liver fibrogenesis of rats: role of stellate cells. J Hepatol 31, 703–711. 10.1016/s0168-8278(99)80351-1. [DOI] [PubMed] [Google Scholar]
- 33.Salguero Palacios R, Roderfeld M, Hemmann S, Rath T, Atanasova S, Tschuschner A, Gressner OA, Weiskirchen R, Graf J, and Roeb E (2008). Activation of hepatic stellate cells is associated with cytokine expression in thioacetamide-induced hepatic fibrosis in mice. Lab Invest 88, 1192–1203. 10.1038/labinvest.2008.91. [DOI] [PubMed] [Google Scholar]
- 34.Tan Z, Qian X, Jiang R, Liu Q, Wang Y, Chen C, Wang X, Ryffel B, and Sun B (2013). IL-17A plays a critical role in the pathogenesis of liver fibrosis through hepatic stellate cell activation. J Immunol 191, 1835–1844. 10.4049/jimmunol.1203013. [DOI] [PubMed] [Google Scholar]
- 35.Krizhanovsky V, Yon M, Dickins RA, Hearn S, Simon J, Miething C, Yee H, Zender L, and Lowe SW (2008). Senescence of activated stellate cells limits liver fibrosis. Cell 134, 657–667. 10.1016/j.cell.2008.06.049. [DOI] [PMC free article] [PubMed] [Google Scholar]
- 36.De Smet V, Eysackers N, Merens V, Kazemzadeh Dastjerd M, Halder G, Verhulst S, Mannaerts I, and van Grunsven LA (2021). Initiation of hepatic stellate cell activation extends into chronic liver disease. Cell Death Dis 12, 1110. 10.1038/s41419-021-04377-1. [DOI] [PMC free article] [PubMed] [Google Scholar]
- 37.Lin KC, Park HW, and Guan KL (2017). Regulation of the Hippo Pathway Transcription Factor TEAD. Trends Biochem Sci 42, 862–872. 10.1016/j.tibs.2017.09.003. [DOI] [PMC free article] [PubMed] [Google Scholar]
- 38.Lai D, Ho KC, Hao Y, and Yang X (2011). Taxol resistance in breast cancer cells is mediated by the hippo pathway component TAZ and its downstream transcriptional targets Cyr61 and CTGF. Cancer Res 71, 2728–2738. 10.1158/0008-5472.CAN-10-2711. [DOI] [PubMed] [Google Scholar]
- 39.Norman M, Rivers C, Lee YB, Idris J, and Uney J (2016). The increasing diversity of functions attributed to the SAFB family of RNA-/DNA-binding proteins. Biochem J 473, 4271–4288. 10.1042/BCJ20160649. [DOI] [PubMed] [Google Scholar]
- 40.Xiong J, Liu T, Mi L, Kuang H, Xiong X, Chen Z, Li S, and Lin JD (2020). hnRNPU/TrkB Defines a Chromatin Accessibility Checkpoint for Liver Injury and Nonalcoholic Steatohepatitis Pathogenesis. Hepatology 71, 1228–1246. 10.1002/hep.30921. [DOI] [PMC free article] [PubMed] [Google Scholar]
- 41.Gupta MP, Kogut P, and Gupta M (2000). Protein kinase-A dependent phosphorylation of transcription enhancer factor-1 represses its DNA-binding activity but enhances its gene activation ability. Nucleic Acids Res 28, 3168–3177. 10.1093/nar/28.16.3168. [DOI] [PMC free article] [PubMed] [Google Scholar]
- 42.Jiang SW, Dong M, Trujillo MA, Miller LJ, and Eberhardt NL (2001). DNA binding of TEA/ATTS domain factors is regulated by protein kinase C phosphorylation in human choriocarcinoma cells. J Biol Chem 276, 23464–23470. 10.1074/jbc.M010934200. [DOI] [PubMed] [Google Scholar]
- 43.Olivieri JE, Dehghannasiri R, Wang PL, Jang S, de Morree A, Tan SY, Ming J, Ruohao Wu A, Tabula Sapiens C, Quake SR, et al. (2021). RNA splicing programs define tissue compartments and cell types at single-cell resolution. Elife 10. 10.7554/eLife.70692. [DOI] [PMC free article] [PubMed] [Google Scholar]
- 44.Sivanesan S, Howell MD, Didonato CJ, and Singh RN (2013). Antisense oligonucleotide mediated therapy of spinal muscular atrophy. Transl Neurosci 4. 10.2478/s13380-013-0109-2. [DOI] [PMC free article] [PubMed] [Google Scholar]
- 45.Geary RS, Norris D, Yu R, and Bennett CF (2015). Pharmacokinetics, biodistribution and cell uptake of antisense oligonucleotides. Adv Drug Deliv Rev 87, 46–51. 10.1016/j.addr.2015.01.008. [DOI] [PubMed] [Google Scholar]
- 46.Graham MJ, Crooke ST, Monteith DK, Cooper SR, Lemonidis KM, Stecker KK, Martin MJ, and Crooke RM (1998). In vivo distribution and metabolism of a phosphorothioate oligonucleotide within rat liver after intravenous administration. J Pharmacol Exp Ther 286, 447–458. [PubMed] [Google Scholar]
- 47.Sahashi K, Ling KK, Hua Y, Wilkinson JE, Nomakuchi T, Rigo F, Hung G, Xu D, Jiang YP, Lin RZ, et al. (2013). Pathological impact of SMN2 mis-splicing in adult SMA mice. EMBO Mol Med 5, 1586–1601. 10.1002/emmm.201302567. [DOI] [PMC free article] [PubMed] [Google Scholar]
- 48.Wurster CD, and Ludolph AC (2018). Nusinersen for spinal muscular atrophy. Ther Adv Neurol Disord 11, 1756285618754459. 10.1177/1756285618754459. [DOI] [PMC free article] [PubMed] [Google Scholar]
- 49.Passini MA, Bu J, Richards AM, Kinnecom C, Sardi SP, Stanek LM, Hua Y, Rigo F, Matson J, Hung G, et al. (2011). Antisense oligonucleotides delivered to the mouse CNS ameliorate symptoms of severe spinal muscular atrophy. Sci Transl Med 3, 72ra18. 10.1126/scitranslmed.3001777. [DOI] [PMC free article] [PubMed] [Google Scholar]
- 50.Younossi Z, Stepanova M, Ong JP, Jacobson IM, Bugianesi E, Duseja A, Eguchi Y, Wong VW, Negro F, Yilmaz Y, et al. (2019). Nonalcoholic Steatohepatitis Is the Fastest Growing Cause of Hepatocellular Carcinoma in Liver Transplant Candidates. Clin Gastroenterol Hepatol 17, 748–755 e743. 10.1016/j.cgh.2018.05.057. [DOI] [PubMed] [Google Scholar]
- 51.Webster NJG, Kumar D, and Wu P (2024). Dysregulation of RNA splicing in early non-alcoholic fatty liver disease through hepatocellular carcinoma. Sci Rep 14, 2500. 10.1038/s41598-024-52237-7. [DOI] [PMC free article] [PubMed] [Google Scholar]
- 52.Kubota N, Kado S, Kano M, Masuoka N, Nagata Y, Kobayashi T, Miyazaki K, and Ishikawa F (2013). A high-fat diet and multiple administration of carbon tetrachloride induces liver injury and pathological features associated with non-alcoholic steatohepatitis in mice. Clin Exp Pharmacol Physiol 40, 422–430. 10.1111/1440-1681.12102. [DOI] [PubMed] [Google Scholar]
- 53.Li P, Liu S, Lu M, Bandyopadhyay G, Oh D, Imamura T, Johnson AMF, Sears D, Shen Z, Cui B, et al. (2016). Hematopoietic-Derived Galectin-3 Causes Cellular and Systemic Insulin Resistance. Cell 167, 973–984 e912. 10.1016/j.cell.2016.10.025. [DOI] [PMC free article] [PubMed] [Google Scholar]
- 54.Boigk G, Stroedter L, Herbst H, Waldschmidt J, Riecken EO, and Schuppan D (1997). Silymarin retards collagen accumulation in early and advanced biliary fibrosis secondary to complete bile duct obliteration in rats. Hepatology 26, 643–649. 10.1002/hep.510260316. [DOI] [PubMed] [Google Scholar]
Associated Data
This section collects any data citations, data availability statements, or supplementary materials included in this article.
Supplementary Materials
Data S1. Unprocessed source data underlying all blots and graphs, related to Figures 1, 2, 3, 4, 5, 6, and S1–S6.
Table S1. Ingenuity canonical pathway analysis. TM7SF3 was knockdown in U2-OS cells, and Ingenuity canonical pathway analysis was performed on RNA sequencing gene expression, related to Figure 1.
Table S3. Characteristics of human donor samples that were used for HSCs, and NALFs, related to Figures 1, 3–5.
Data Availability Statement
Data and uncropped PCR gels/western blots associated with figures 1–6 and supplementary figures 1–6 are supplied in Data S1.
No original code for this study.
Any additional information required to reanalyze the data reported in this paper is available from the lead contact upon request.