Abstract
The cystic fibrosis transmembrane conductance regulator (CFTR), the defective protein in cystic fibrosis, is an anion channel activated by protein kinase A phosphorylation. The regulatory domain (RD) of CFTR has multiple phosphorylation sites, and is responsible for channel activation. This domain is intrinsically disordered, rendering the structural analysis a difficult task, as high-resolution techniques are barely applicable. In this work, we obtained a biophysical characterization of the native and phosphorylated RD in solution by employing complementary structural methods. The native RD has a gyration radius of 3.25 nm, and a maximum molecular dimension of 11.4 nm, larger than expected for a globular protein of the same molecular mass. Phosphorylation causes compaction of the structure, yielding a significant reduction of the gyration radius, to 2.92 nm, and on the maximum molecular dimension to 10.2 nm. Using an ensemble optimization method, we were able to generate a low-resolution, three-dimensional model of the native and the phosphorylated RD based on small-angle X-ray scattering data. We have obtained the first experiment-based model of the CFTR regulatory domain, which will be useful to understand the molecular mechanisms of normal and pathological CFTR functioning.
Electronic supplementary material
The online version of this article (doi:10.1007/s00018-012-1172-5) contains supplementary material, which is available to authorized users.
Keywords: ABC transporter, Cystic fibrosis, Protein structure, Small-angle X-ray scattering, CFTR, Regulatory domain, Phosphorylation
Introduction
The cystic fibrosis transmembrane conductance regulator (CFTR/ABCC7) protein is a cAMP-activated anion channel that belongs to the ATP-binding cassette transporter super-family. CFTR is expressed in the apical membrane of epithelial cells in mammalian airways, intestine, pancreas, and testis. Cystic fibrosis (CF) is a severe genetic disease caused by more than a thousand naturally occurring mutations, distributed along the entire CFTR gene. The CFTR protein is composed of five distinct parts: two membrane-spanning domains, two nucleotide-binding domains, and a regulatory region. The channel is activated by cAMP-dependent phosphorylation of the regulatory domain (RD), and ATP binding and hydrolysis at the NBDs are responsible for CFTR pore gating. The RD is about 185 residues segment, and contains 12 putative serine-phosphorylation sites. In a fully phosphorylated protein, between eight and nine phosphoserines have been detected by mass spectrometry [24, 36] and NMR [3]. Relatively little is known about the structure of the RD, although it has been predicted to be mostly disordered [26], a hypothesis that is consistent with NMR data for the separately expressed and purified RD peptide [3]. The intrinsic disordered nature of the protein, as well as the lack of a homology template, has resulted in a great difficulty to predict the three-dimensional structure of the RD, obtaining several divergent molecule models [14, 21, 22, 29]. Indeed, other whole-CFTR proposed models, where the pore structure is carefully studied, have neglected the RD due to the difficulties of modeling this domain [1, 7, 25]. Electron microscopy has identified the location for some of RD epitopes in the full-length CFTR protein [44, 45]. NMR data mapped the residue parts involved in the interactions between the isolated RD with isolated CFTR nucleotide-binding domains [3, 16]. Phosphorylation of RD may induce changes on the structural conformation of the isolated protein, as revealed by circular dichroism [9] and NMR [3], and may change the interactions between RD and the NBDs [6, 16].
We have investigated the molecular structure of the isolated and purified RD in the native, non-phosphorylated state and in a fully phosphorylated state. We have employed small-angle X-ray scattering (SAXS), in combination with other biophysical techniques to obtain structural models of the native and the phosphorylated CFTR regulatory domain in solution.
Materials and methods
Primary structure analysis
The sequence of the RD was analyzed with the use of the program metaPrDOS [15] to identify regions of disorder. This program uses the following seven prediction algorithms to predict disordered regions: PrDOS, DISOPRED2, DisEMBL, DISPROT(VSL2), DISpro, IUpred, and POODLE-S to optimize the ROC (receiver operating characteristic) value to minimize the prediction false-positive rate to less than 5.0 % (see http://prdos.hgc.jp).
Expression and purification of R region
Escherichia coli BL21 (DE3) CodonPlus RIL cells (Stratagene) were transformed with a plasmid based on the pPROEX HTb vector (Invitrogen), encoding a 185-residue fragment, from position 654–838, of the human CFTR (UniProtKB P13569) RD, with an N-terminal His6 tag (the construct was generously provided by J.D. Forman-Kay, SickKids Hospital, Toronto, ON, Canada). The exact boundaries of the RD remain a point of discussion (for a review, see [39]). Here, the Ser654 N-terminal boundary was chosen to include the PKA phosphorylation consensus residues on the N-terminal side of the important Ser660 phosphorylation site, as well as Ser654, which is homologous to the Thr654 residue found to act as an N-terminal helix cap in the murine NBD1 crystal structure [18]. The C-terminal boundary was chosen to include a group of negatively charged residues with a helical propensity suggested to have a functional role in CFTR channel inhibition [43]. The RD sequence carried the polymorphism Leu833 from the original CFTR cloning paper, as the wild-type Phe833 was deleterious for protein solubility [3]. Comparison of NMR data of RD proteins bearing Phe833 and Leu833 showed similar structural properties for the two proteins [3].
Transformed E. coli were grown to A600 ≈ 0.6–0.8 and induced with 1 mM IPTG for 4–6 h at 37 °C. The RD was purified from the insoluble lysate fraction using a 6 M guanidinium-HCl purification including Ni2+ affinity chromatography (HisTrap, GE-Healthcare, Uppsala, Sweden) and denaturing size exclusion chromatography (SEC) on a Superdex 75 column (GE-Healthcare), followed by ionic exchange chromatography. The purified protein was then dialyzed in two steps: first, against 3 M guanidinium-HCl, 20 mM TRIS pH 8, 200 mM NaCl, 2 mM DTT; then, against 30 mM phosphate buffer pH 8, 200 mM NaCl, 2 mM DTT. The product was then concentrated to ~2.5 mg ml−1 by ultra-filtration (Amicon Ultra-10K, Millipore Corporation, Bedford, MA, USA), fast-frozen in liquid nitrogen, and stored at −80 °C for further use. All purification and refolding procedures were done at 6–8 °C. For all successive experiments, RD were freshly thawed, cleared with a 0.45-μm filter (Ultrafree-MC, Millipore) and protein concentration was estimated by the absorbance at 280 nm (ε = 12,210 Mol−1 cm−1).
Western blot
Proteins (10–15 μg) were subjected to SDS polyacrylamide gel electrophoretic analysis. Separated proteins were then transferred to PVDF membrane (Millipore, Billerica, MA, USA) for 1 h at 100 V in a temperature-stable room at 5 °C. The blot was then incubated with polyclonal rabbit anti-RD (1:1,000, Acris Antiboby GmbH, Herford, Germany) and with horseradish peroxidase-conjugated goat anti-rabbit antibody (1:4,000, Santa Cruz Biotechnology, Santa Cruz, CA, USA), as secondary antibody using the SNAP i.d. system (Millipore catalog n° WBAVDBASE, Worcester, MA, USA) according to the manufacturer’s instructions. Immunodetection was performed using ECL PLUS detection reagents (GE-Healthcare) and the images were captured by using Hyperfilm ECL (GE-Healthcare).
Phosphorylation
The catalytic fraction of protein kinase A (PKA, Biaffin GmbH and Co KG), at a concentration of 600 units per nM of protein, was added to an aliquot of 10–20 μl of RD (2–3 mg ml−1) supplemented with 50 μM ATP and 5 mM MgCl2. The mixture was incubated for 30–40 min at 37 °C and then diluted (to a concentration of 0.1–1 mg ml−1) with 30 mM phosphate buffer (pH 8.0) supplemented with 1:3,000 of 2-mercaptoethanol. The native RD sample was prepared in the same way without the addition of PKA.
Circular dichroism and fluorescence spectra
The circular dichroism (CD) spectra were acquired on a Jasco J-815 spectropolarimeter. Step scans were collected from 195 to 260 nm at 50 nm min−1 with a data pitch of 0.1 nm, in a 0.1 cm rectangular cell. The spectra of the native and phosphorylated protein were collected (ten replicate spectra per sample) at 10 °C, and normalized to the concentration of the sample (0.1–0.5 mg ml−1) estimated immediately before the experiment, measuring the absorbance of the sample at 280 nm. The secondary structure analysis was done by the on line server Dichroweb [41], using the algorithm SELCON3 [30].
Fluorescence spectra were done in a Perkin-Elmer LS 50D spectrofluorometer. The native or phosphorylated RD samples (0.1–0.5 mg ml−1) were excited at 295 or 274 nm, and the emission spectra were recorded between 300 and 400 nm. Data were obtained as the average of four spectra.
Size exclusion chromatography
We performed analytical gel filtration with a Superdex 75 column to determine the molecular mass of RD by comparing its elution volume (V e) with that of reference proteins. The void volume (V 0) was determined with Dextran blue. We determined the Stokes radius (R S) of RD using a linear calibration plot of [−log (K av)]1/2 against the Strokes hydrostatic radius of the standards [35, 38], where K av is the partition coefficient, defined as (V e – V 0)/(V t – V 0), with V t being the total volume of the column.
SAXS data collection and processing
Small-angle X-ray scattering spectra of 0.8 to 1.6 mg ml−1 of phosphorylated and native RD were collected at the ID14-EH3 beam line of the European Synchrotron Radiation Facility (ESRF, Grenoble). The sample-detector distance of 1.83 m covered the range of momentum transfer 0.08 < s < 4.5 nm−1 (s = 4π sin (θ)/λ, where 2θ is the scattering angle and λ = 0.093 nm is the X-ray wavelength; the optical path of the X-ray through the sample is about 1 mm). Data were collected at 10 °C. For each sample, we recorded ten spectra of 30 s each, for a total of 5 min of acquisition. A low concentration of glycerol (<1.5 %) was used as free radical scavenger to minimize the radiation damage of the sample. The comparison of the ten successive exposures of an acquisition experiment indicated no changes in the scattering patterns, i.e., no measurable radiation damage to the protein samples. Data were normalized to the intensity of the transmitted beam, and the scattering data from the buffer (identical to that of the sample) without protein, done before and after each sample measurement, was averaged and used to subtract the background.
We processed the data using standard procedures for ATSAS programs [27]. The forward scattering I(0) and the radius of gyration R g were computed using the Guinier approximation for sR g < 1.3 [10, 13]. The excluded volume of the particle, V, was computed using the Porod equation [10, 13]. The distance distribution function P(r) was calculated using the indirect Fourier transform method implemented in the program GNOM [32]. It was limited to s ≤ 2.5 nm−1, to avoid the high noise found for larger s. P(r) represents the probability of finding a point within the observed particle at a distance, r, from a defined point of reference. Sample molecular mass was estimated by comparing the extrapolated forward scattering I(0) to a reference solution made of bovine serum albumin. A Kratky plot was employed to qualitatively assess the overall conformational state of the native and phosphorylated RD [12, 38].
Structural modeling of the SAXS data
To obtain quantitative estimates of the degree of the dynamics and conformational heterogeneity or the RD in its two conditions, native and phosphorylated, we analyzed the SAXS data using an ensemble optimization method (EOM) [4]. Using this strategy, the experimental SAXS profile is assumed to derive from a (undetermined a priori) number of coexisting conformational states. A sub-ensemble of conformations is selected by a genetic algorithm from the scattering patterns computed from a large pool representing the maximum flexibility allowed by the protein topology [4].
The optimization was done with the program GAJOE (Genetic Algorithm Judging Optimization of Ensembles) that uses a genetic algorithm for the selection of an ensemble of models, whose combined theoretical scattering intensity best describe the experimental SAXS data [5]. The program is executed following the generation of a random pool of models using RANCH to generate a pool of 10,000 native-like random chains structures, where CA-angle distribution consistent with folded proteins, and calculated the scattering curve of each structure with the use of CRYSOL [31]. Each of the experimental SAXS curves, from native and from phosphorylated RD, was analyzed with a genetic algorithm (of the best of 50 subsets of ~20 protein structures such that the discrepancy (the χ 2 value) between the average scattering of the ensemble model and the experimental data was minimized. For each curve, ten independent EOM runs were performed, and the obtained subsets were analyzed to yield the R g and D max.
The low-resolution ab initio shape of native and phosphorylated RD was reconstructed with the use of DAMMIF [11]. Compact models of interconnected beads were used to represent the molecule, and simulated annealing was employed to minimize the discrepancy between the experimental and calculated data. Fifteen DAMMIF models were generated for each RD experimental condition and analyzed using DAMAVER [40], which characterizes the similarity between the individual ab initio models by the normalized spatial discrepancy (NSD) [17]. The most representative models (with the lowest average NSD) were selected.
Chemicals
Except when indicated, all reagents were purchased from Sigma-Aldrich (St. Louis, MO, USA).
Results
The CFTR regulatory domain is predicted to be disordered
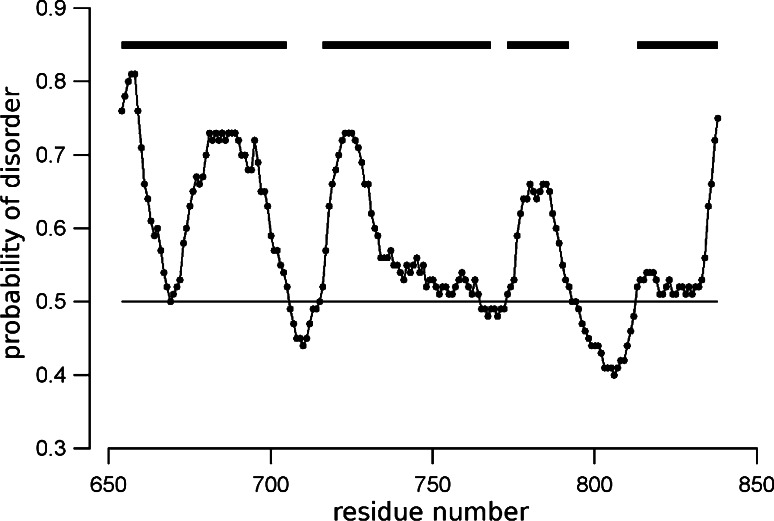
The bioinformatics analysis of RD predicted four disordered regions, interrupted by three ordered regions, along of the primary structure of the polypeptide. The residue into the disordered regions are in intervals from 654 to 705, from 716 to 768, from 773 to 792, and from 813 to 838. The probability of disorder (threshold = 0.5) as predicted by the metaPrDOS web server is shown in Fig. 1, were the disordered regions are indicated by the bars. These disordered regions represent 81 % of the sequence (149 out of 185 residues).
Fig. 1.
Primary structure analysis of CFTR-RD metaPrDOS prediction of local disorder as a function of residue number. The disordered regions are marked as horizontal lines. The threshold of 0.5 for the probability of disorder shown in the figure was defined to obtain a false-positive prediction rate <5 % (ROC = 0.904)
Preparation of recombinant CFTR regulatory domain
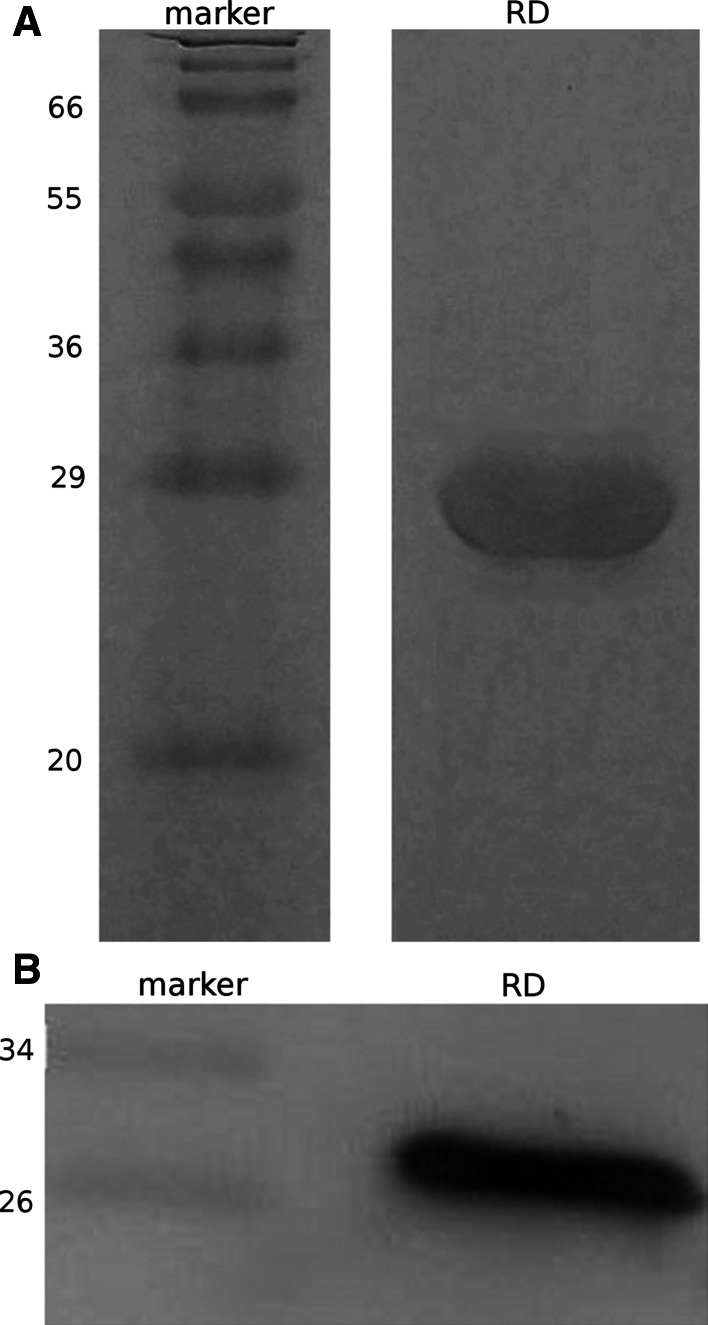
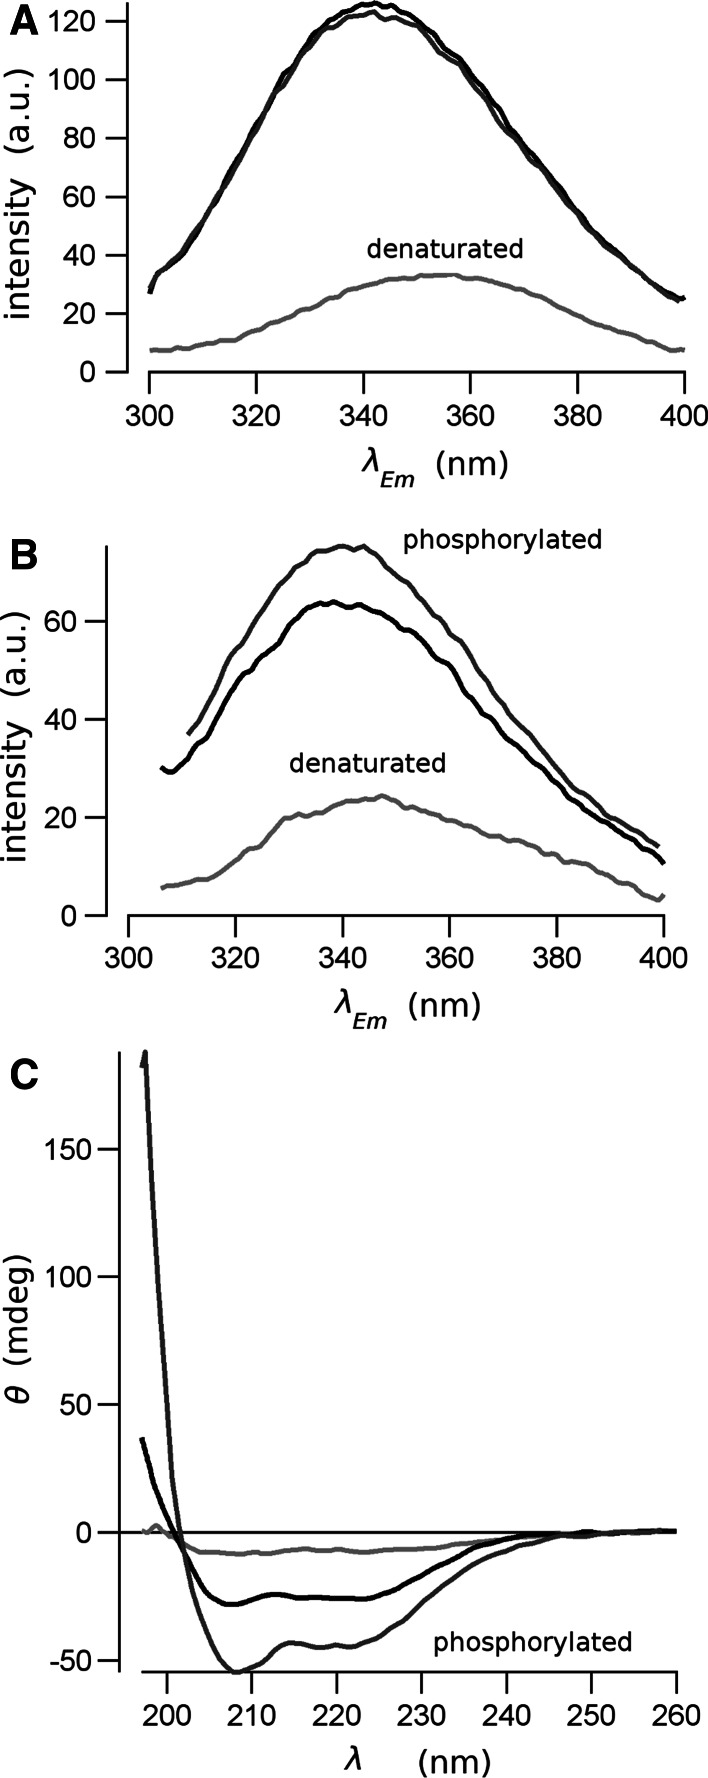
Human CFTR regulatory domain was expressed as inclusion bodies, purified by chromatography and refolded in vitro by two-step dialysis. The analysis of the protein by SDS–polyacrylamide electrophoresis yielded a single band at a molecular mass of about 24 kDa (Fig. 2a), which is consistent with the molecular mass estimated from the recombinant protein sequence. A further identification of the purified protein was obtained from the Western-blot assay (Fig. 2b), were a band strongly positive to the RD-antibody was detected at a molecular mass of about 24 kDa. The quality of the refolding was checked comparing the fluorescence and CD spectra of the protein before and after dialysis. The position of the peak of protein intrinsic fluorescence emission spectra of the unfolded protein showed the maximum shifted to red as the protein fluorophores are exposed to the polar environment. After refolding, when protein fluorophores are accommodated in the hydrophobic core of the protein, the fluorescence peak shifts by 25 nm to left (Fig. 3a, b). The CD spectra also changes from a predominant random coil for the unfolded protein to a spectrum with secondary structure content for the native RD (Fig. 3c).
Fig. 2.
Biochemical characterization of the recombinant RD preparation. a SDS–Polyacrylamide gel electrophoresis of the purified RD. A molecular mass standard is shown. b Western-blot identification of the CFTR-RD. The purified protein was revealed with a specific monoclonal antibody
Fig. 3.
Fluorescence and circular dichroism (CD) spectroscopy from the native (black lines), phosphorylated (dark-gray lines) and denatured (light-gray lines) RD. The fluorescence emission spectra was obtained for excitation wavelengths of 274 nm (a), to reveal the tyrosine and phenylalanine intrinsic fluorescence, and 290 nm (b), to observe the tryptophan intrinsic fluorescence. The far-UV CD spectra (c) were measured from 197 to 260 nm
Phosphorylation changes the RD conformation
The RD protein in solution retains a degree of secondary structure organization, despite being intrinsically disordered. This is evident from the CD spectra on Fig. 3c. Deconvolution of the CD spectra for the native RD yielded more than 30 % of random coil structure, but also the presence of structured regions, with about 45 % of α-helix and 12 % of β-sheet content. This secondary structure composition is significantly altered when the protein is phosphorylated. Deconvolving the corresponding CD spectra (Fig. 3c; dark gray), we found a reduction of the random coil structure, to about 18 %, and an increase of the α-helix content to more than 70 %, and a dramatic reduction of β-sheet content to less than 1 %.
The conformational change of RD by phosphorylation is also detected from the fluorescence spectroscopy assays. Tyrosine-intrinsic fluorescence spectra were obtained upon the excitation of the samples at 274 nm (Fig. 3a). The RD construct has four tyrosine residues toward the N-terminus of the polypeptide, composing the linker of the 6-His tag. A further tyrosine is at CFTR-position 834 of RD, near to the C-terminus of the polypeptide. Tyrosine 833 is not present in this construct, as was substituted by leucine to increase solubility [3]. Refolding of the protein caused a blue-shift of the spectra, with an increase of the overall emission intensity. This change is consistent with the re-accommodation of the tyrosine fluorophores in a non-polar environment, typical for a folded protein. However, phosphorylation does not modify the fluorescence spectra, indicating that it does not introduce changes in the environment of the tyrosines.
Conversely, phosphorylation produces a significant modification of the emission spectra of the tryptophan. When the protein is excited at 295 nm, the single tryptophan in the construct, at the CFTR-position 679, has an emission fluorescence spectrum with a peak at 338 nm (Fig. 3b). Phosphorylation of RD does not change the position of the emission spectra, but increases the intensity of fluorescence. This could be interpreted as the tryptophan remaining in a non-polar environment, but a quencher residue has moved from its neighborhood, increasing the intrinsic fluorescence. This modification is consistent with a conformational change, re-accommodating the lateral chains of neighbor residues, and compatible with a secondary structure change.
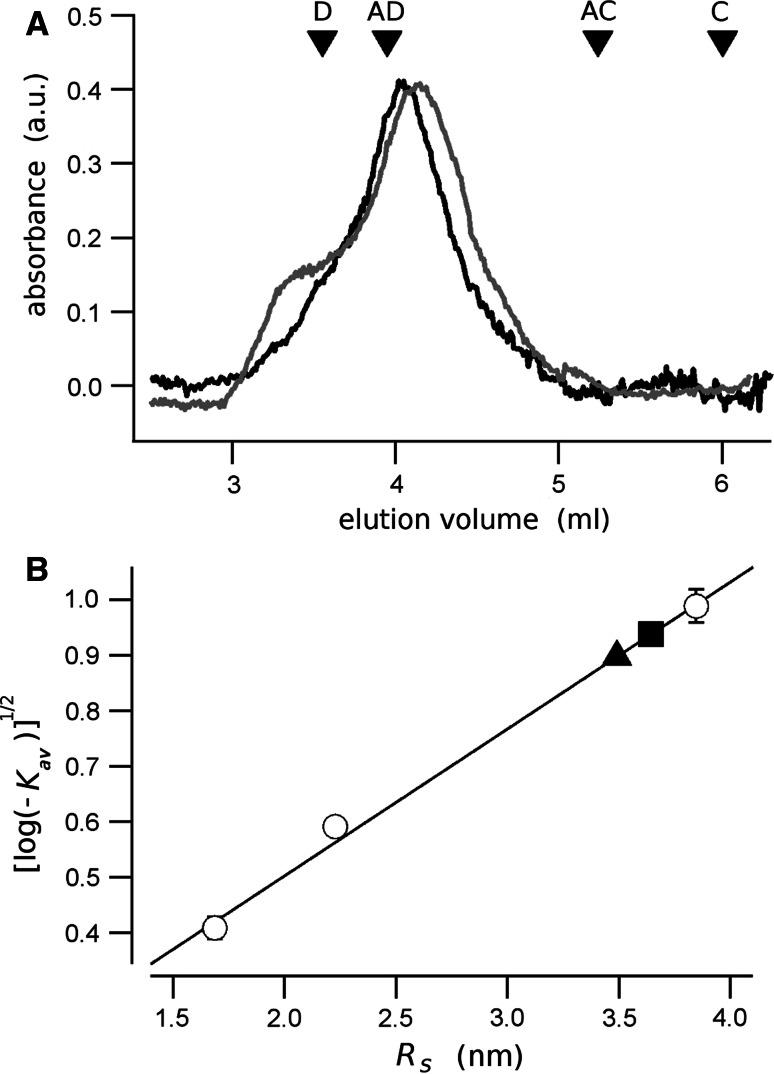
In SEC experiments, the native RD eluted from the column in a major peak that corresponds to apparent molecular mass of 148 kDa and a Stokes radius R S = 3.6 nm (Fig. 4). This molecular weight exceeds by about sixfold that expected for a RD monomer. When the RD is phosphorylated, the protein elutes at a significantly smaller volume, corresponding to an apparent molecular mass to 130 kDa, and a R S = 3.4 nm. These masses and dimensions may correspond to aggregates, or to elongated or unfolded proteins, which are known to elute at a volume corresponding to a higher apparent molecular mass [2].
Fig. 4.
Size exclusion chromatography of the CFTR-RD. a The chromatogram of the native (black line) and the phosphorylated (gray line) RD. The molecular mass standards are shown as inverted triangles; D dextran blue, AD alcohol dehydrogenase, AC carbonic anhydrase, C cytochrome-C. b The square root of the partition coefficient, K av, is plotted against the Strokes radius, R S. The calibration points are indicated as open circles. The native and the phosphorylated RD are represented by a square and a triangle, respectively
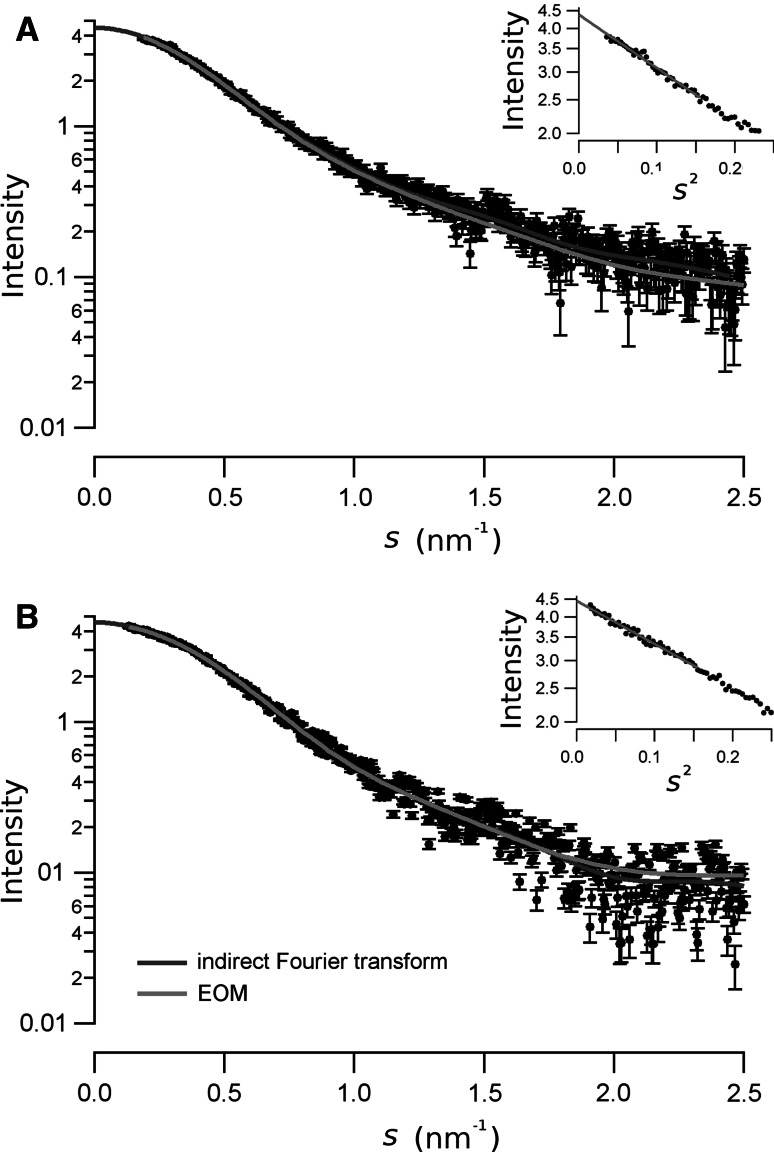
SAXS data was used to confirm the monomeric state of the RD in solution. The molecular mass of the native, non-phosphorylated, and the phosphorylated RD in solution were estimated from the Guinier plot of the corresponding SAXS spectra (Fig. 5, insert). The scattering intensity extrapolated to s = 0 measured at each condition was compared to that of the standard BSA sample [23], yielding a molecular mass of 23.96 and 24.34 kDa, for the native and the phosphorylated protein, respectively. This molecular mass is consistent with that calculated from the primary structure of the recombinant protein (23.3 KDa). It confirms that this protein, is a monomer in solution, and the Stokes hydrodynamic radius estimated from the SEC corresponds to that of a single RD molecule, either phosphorylated or not.
Fig. 5.
The experimental X-ray scattering data fort the native (a) and the phosphorylated (b) RD are shown as circles. Bars represent the standard deviation of the measurement. The continuous dark-gray lines are the scattering curve calculated from the inverse Fourier transform in Fig. 6. The light-gray line is the scattering curve calculated from the best optimization obtained from the EOM analysis. The Guinier plot for each conformation is shown as an inset
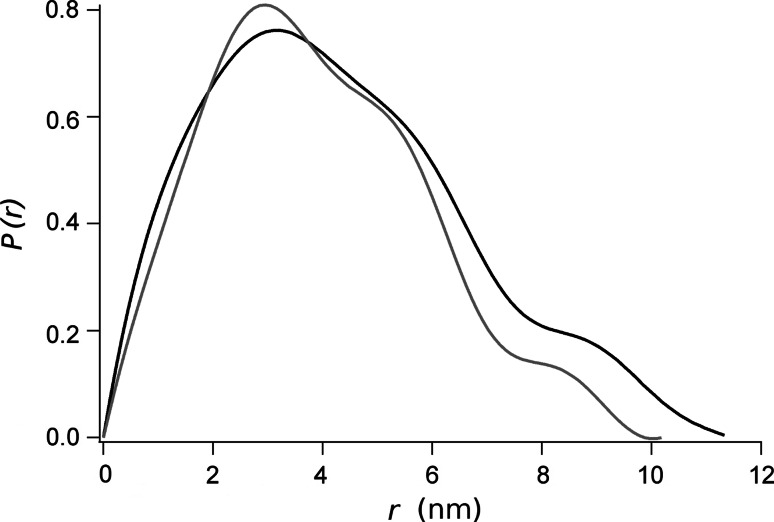
The reduction of the size of the RD upon phosphorylation was also confirmed by the SAXS experiments. The physical invariants measured from the SAXS spectra of the native and the phosphorylated RD are presented in Table 1. The radius of gyration, R g, was measured with a higher precision from the slope of the Guinier plot in Fig. 5. There, an R g value of 3.25 ± 0.18 and 2.92 ± 0.04 nm, for the native and the phosphorylated RD, respectively, was obtained. This data was further confirmed from the estimation of R g from the distance distribution function, P(r), shown in Fig. 6. It is shown that the maximum distance, D max, estimated from P(r) yielded a value of 11.4 nm for the native RD, and 10.2 nm for the phosphorylated polypeptide. These differences in the size may be due to a change in the shape of the molecule, as suggested comparing the P(r) presented in Fig. 6. In both cases, the form of the distance distribution function is consistent with a multilobular-elongated body, but the shape in the two states is different [11]. Indeed, the particle volume estimated from the Porod approximation yield similar values of about 72 nm3 (see Table 1).
Table 1.
Physical invariants measured from the SAXS spectra of the native and the phosphorylated RD
| R g (nm) | I(0) | MM (kDa) | D max (nm) | R *g (nm) | V (nm3) | |
|---|---|---|---|---|---|---|
| Native | 3.25 ± 0.18 | 4.38 ± 0.03 | 23.96 | 11.4 | 3.46 ± 0.03 | 71.2 ± 0.7 |
| Phosphorylated | 2.92 ± 0.04 | 4.45 ± 0.02 | 24.34 | 10.2 | 3.09 ± 0.02 | 71.99 ± 1.7 |
R g and I(0) are the gyration radius and the extrapolation of the intensity to s = 0, respectively, calculated from the Guinier plot. MM is the molecular mass estimated from I(0). D max and R *g are the maximum size of the particle and the gyration radius calculated from the distance distribution function. V is the Porod volume of the particle
Fig. 6.
P(r) distribution of the native (black line) and the phosphorylated (gray line) RD. For comparison, the curves were normalized by the area under the curve
Solution model of the native and phosphorylated RD
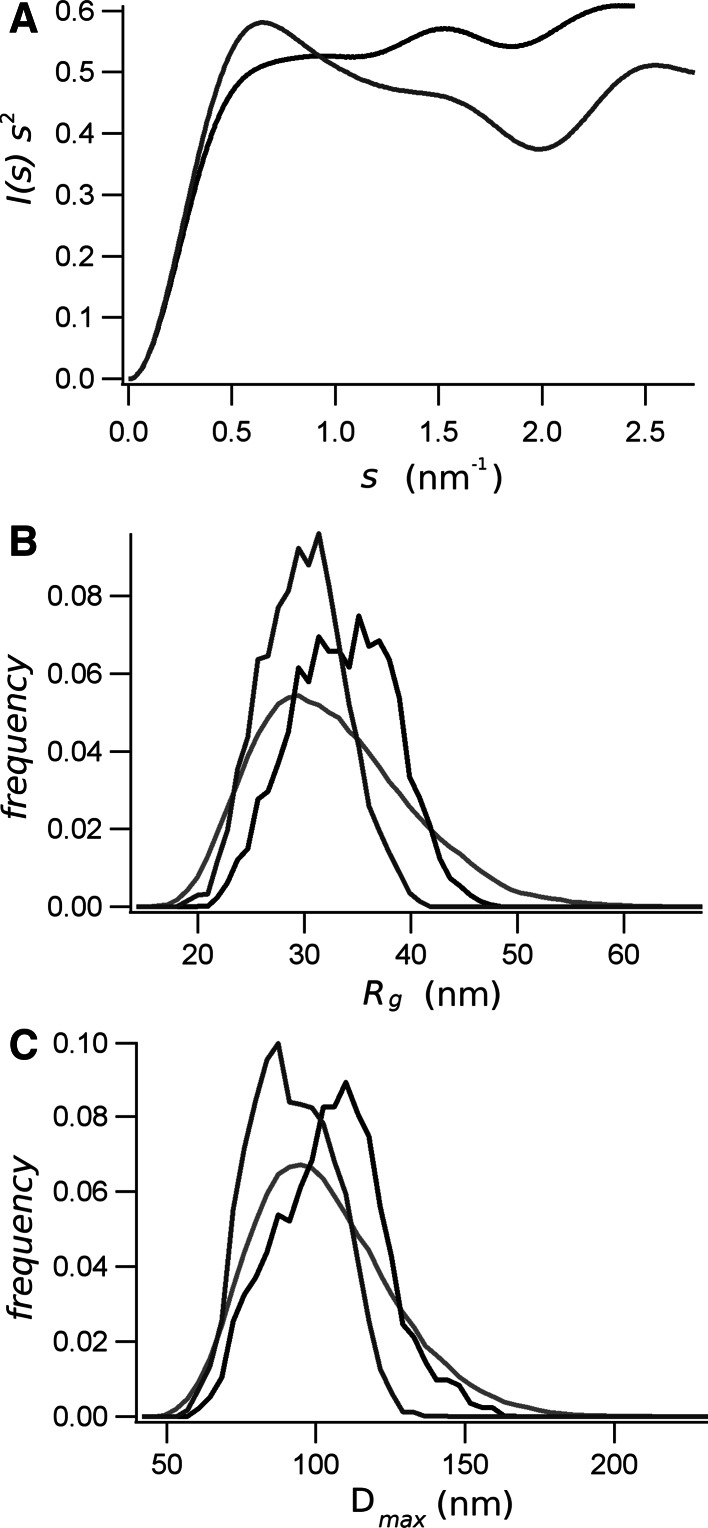
The Kratky plot for either native or phosphorylated RD (Fig. 7a) are not indicative of a compact, globular protein (which is typically bell shaped) or a fully unfolded protein, which would show a fast upward slope at higher scattering angles. Instead, these plots show a first peak at approximately s = 0.6 nm−1, followed by several maxima, without a net decrease in the function, suggesting that both RD preparations, native and phosphorylated, are multi-lobular and partially unfolded. The P(r) function of native and phosphorylated RD have an asymmetric shape (Fig. 6), with their maxima at low r followed by a long tail. This is again consistent with an extended, perhaps partially unfolded molecule with the maximum dimension (D max) of 11.4 and 10.2 nm for the native and the phosphorylated RD, respectively.
Fig. 7.
a Kratky plot of the native (black line) and the phosphorylated (gray line) RD. Results of the EOM study showing the distribution of the R g (b) and D max (c). The distributions of the random pool are shown in light gray, and those of the selected ensemble for native RD are in black and for phosphorylated RD in dark gray
Because the Kratky plot, P(r) function, and the dimension of the molecule (R g and R S) indicated that the native and the phosphorylated RD is partially unfolded, we used an ensemble method (EOM) to quantitatively assess its flexibility. The best EOM solution of ten independent runs yielded very homogeneous χ 2-values of ~1.3. We selected the EOM ensembles with the best χ 2-value. The fit of the EOM ensembles with the native and phosphorylated RD-SAXS data are shown as a light-gray continuous line in Fig. 5. The best EOM ensemble yielded a set of 16 and 19 models for the native and the phosphorylated RD, respectively. Single models are presented in the supplementary figures S1 and S2.
The width of the distribution of R g and D max for the EOM ensembles of the native and the phosphorylated RD are smaller than that of the distribution of the random population, indicating the procedure has selected an enriched population of selected structures than the random pool (Fig. 7b, c). The EOM ensemble for the native RD shows a population (Fig. 7b) with a R g average value of 3.44 nm, which is bigger than the average R g of the random population of 3.38 nm. This is in agreement with the distribution of D max, which indicates that the optimized ensemble for the native RD has an average maximum size that is larger than the random pool (Fig. 7c). Conversely, the R g of the EOM ensemble for the phosphorylated RD has an average value of 3.06 nm, which is smaller than the random population, consistent with a more compact structure (Fig. 7b, c). The average head-to-tail distance of the native RD, 7.6 ± 0.5 nm, is also larger than the average head-to-tail distance of the phosphorylated RD, 5.9 ± 0.5 nm. The overall different conformation, particularly on the extreme dimensions of the polypeptide, are described by the residue-to-residue distance plot shown in the supplementary figure S3. The average anisometry [5] evaluated for all the EOM ensemble models was 2.1 ± 0.6 and 1.7 ± 0.3 nm, for the native and the phosphorylated RD, respectively, indicating that the molecules have a prolate shape, being the phosphorylated RD more compact.
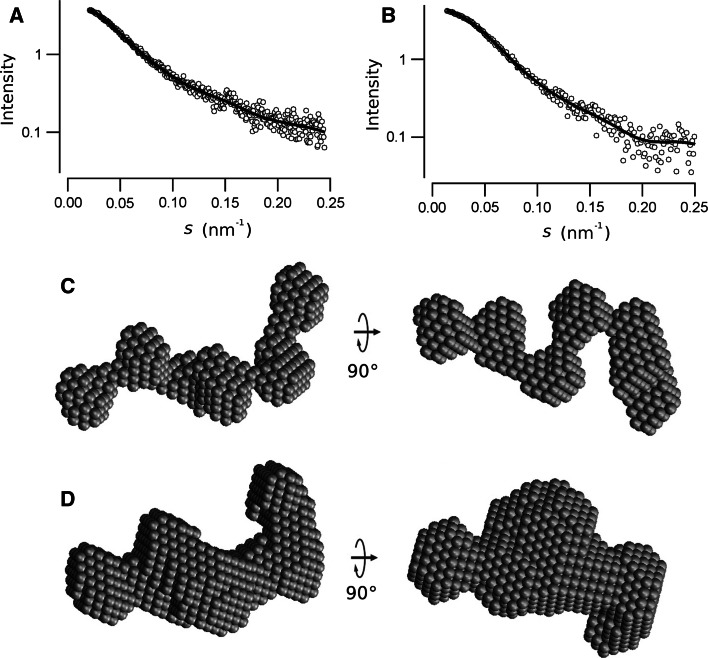
Because the results from the CD and EOM analysis provided evidence that native and phosphorylated RD contains some structure and is not fully unfolded, we performed ab initio modeling to visualize a suggestive three-dimensional representation compatible with SAXS data. Fifteen independent models for both native and phosphorylated RD were generated by DAMMIF, and all fit the corresponding experimental data well with χ 2-values of ~1.3 (Fig. 8a, b). The models align with an average NSD value of 1.09 for the native RD and 0.781 for the phosphorylated protein, indicating that the shape reconstruction is more stable for the phosphorylated protein [33]. The most representative DAMMIF models are presented in Fig 8c, d. Both models are characterized by an extended shape formed by several lobules. The lobules in the native RD model seem more defined, while they tend to be fused for the phosphorylated RD. The average longest molecular dimension of the native RD models is 11.8 ± 0.1, and 10.4 ± 0.1 nm for the phosphorylated RD, in agreement with the D max obtained from the P(r) functions.
Fig. 8.
Ab initio reconstruction of the shape of the RD. The continuous lines on the SAXS data represents the calculated scattering curves from DAMMIF reconstruction of the native (a) and the phosphorylated (b) RD. Two views of the ab initio bead model of native (c) and the phosphorylated (d) RD calculated using DAMMIF. The model shown is the most representative of ten structures calculated
Discussion
From this combined biophysical study, a molecular view of the CFTR regulatory domain, in the native and the phosphorylated state, is emerging. We compared the forward extrapolation of the SAXS spectra of RD to that of a standard bovine serum albumin to estimate the molecular mass of our preparation [23]. For both native and phosphorylated RD the estimated molecular mass of the protein in solution is ~24 kDa (Table 1), that is about the molecular mass calculated from the protein sequence. It confirms that the RD is a monomer in solution, and that the small partition coefficient measured by SEC is actually due to the large R S of the protein, and not to some protein aggregation during the chromatography experiments. On the other hand, the R g estimated from the Guinier plot of the SAXS data yielded values that are consistent with the R S values measured from SEC, and to those of non-globular proteins. Therefore, this protein domain in solution is monomeric but its shape deviates greatly from globular, and the bioinformatics analysis predicts that RD is an intrinsically disordered protein. The hydrodynamic behavior of the native and the phosphorylated RD, as determined by SEC experiments, is intermediate between a globular protein and a unfolded protein (Fig. 4). Indeed, the expected R S a globular protein of a molecular mass of 24.3 kDa is about 2.1 nm, while the expected R S, an unfolded protein (in 6 M guanidinium-HCl), is 4.4 nm [35]. The R S of the native RD protein, 3.6 nm, is slightly larger than the pre-molten state, that, for this protein is predicted a R S = 3.4 nm. Phosphorylation of RD produces a slight compacting of the molecule, observed as a small reduction of R S to 3.4 nm, which is also in the range corresponding to a pre-molten protein. Hence, we can hypothesize that it contains some local structure and is moderately compact but lacks a folded core, characteristic of an intrinsically disordered protein.
Interestingly, some organized secondary structure is detected by CD analysis. We interpreted the relative abundance of the predicted secondary structure from CD results with caution given that current methods of CD spectral deconvolution are not ideally adaptable to proteins with a large degree of disorder because the reference databases consist mainly of globular folded proteins [41]. This could explain the differences in the interpretation of the secondary structure contents or native and phosphorylated RD reported by others [3, 9]. Nevertheless, comparison between CD spectra from folded and the unfolded proteins (Fig. 3c) clearly confirms the secondary structure contents of the signal. Indeed, a partially disordered protein does contain some amount of secondary structure, at difference to a denatured protein, which presents only the random coil conformation (for a review, see [8, 28, 37]). More interestingly, there is a reproducible net difference between the CD spectra from native and phosphorylated RD (see Fig. 3c). This difference reveals a conformational change of RD induced by phosphorylation. The RD phosphorylation conditions applied here induces the maximal change on the CD spectra, as previously demonstrated [19], and therefore we could consider a bona fide maximum phosphorylation condition of the protein. In this condition of maximum phosphorylation, it is expected to find at least eight phosphoserines in the RD (residues 660, 700, 712, 737, 753, 768, 795, and 813 of the CFTR), as determined by mass spectroscopy [24, 36] and NMR analysis [3]. A further serine in position 670 has been reported to be partially (≈60 %) phosphorylated [18].
Fluorescence spectroscopy has also shown a difference between the unfolded RD in 6 M guanidinium-HCl and the folded protein after the dialysis procedure, confirming the difference between the completely unfolded state and the native protein (Fig. 3a, b). These experiments have also shown that the intrinsic tryptophan fluorescence increases when the RD is phosphorylated (Fig. 3b). The lower intrinsic fluorescence in the native state may be due to a quenching of the tryptophan fluorescence by negatively charged residues that are rearranged upon a conformational change produced by the RD phosphorylation.
SAXS experiments have confirmed the molecular changes produced by the phosphorylation. The shape of the distance distribution functions, P(r), calculated from the SAXS data have a maximum that is smaller than D max/2 (Fig. 6), which correspond to elongated molecules [10, 34]. Consistently, the ab initio molecular shape reconstructed from the SAXS data results in elongated molecules for both native and phosphorylated RD (Fig. 8). Moreover, the EOM ensembles were also characterized with an anisometry larger than 1, which is consistent with an elongated prolate shape of the molecules. The EOM analysis also indicated differences between the ensembles for the native and phosphorylated RD. Indeed, the phosphorylated RD has a smaller average R g and D max than the native protein (Fig. 7b, c). The best EOM ensembles, which account for the continuous light-gray lines in Fig. 5, are composed by 16 and 19 structures for the native and phosphorylated RD (see supplementary figures S1 and S2).
The experiments reported here demonstrate conclusively that the CFTR RD is best described as being in the pre-molten globule state, in agreement with the definition of a partially disordered protein resulted from the bioinformatics analysis, and from the previous studies by NMR [3]. The characteristics of the molten globule are that it has similar secondary structural elements with the native folded state, but the tertiary interactions are absent; the protein remains globular but loosely packed.
Some disordered regions of proteins can form structure on binding to targets [20]. Therefore, we cannot rule out the possibility that when the RD form part of the whole CFTR protein, the interactions with other protein domains may restrict the degree of disorder observed on the isolated proteins in solution. Unfortunately, at the moment we do not have enough data to predict what is the actual conformation of RD in the whole protein. Available NMR data [3, 16], as well as other data regarding domain–domain interactions (see for example [42]) has been obtained from isolated domains in solution, lacking the topological restraints of the whole protein anchored in a membrane. Perhaps these data could be used as restraints to dock the RD models obtained here with a consensus between the available molecular homology models [1, 7, 21, 22, 25, 29], together with the structural data, as that obtained from cryo-electron microscopy models [44, 45], to get a plausible image of the CFTR intracellular domains organization. It is, however, important to notice that the conformational changes observed in the isolated proteins may be related with the possible different interactions of RD with NBDs for the activated and the inactivated CFTR. It is conceivable that its conformational variability offers RD the advantage of adaptive binding to its targets into the CFTR protein. Here, we have presented the first experimental-based set of molecular models for the CFTR regulatory domain. Our biophysical characterizations of this protein, along with the low-resolution solution model, will pave the way for studying the molecular interactions of RD with other parts of CFTR, which have many implications on the understanding the pathophysiology of cystic fibrosis.
Electronic supplementary material
Below is the link to the electronic supplementary material.
Acknowledgments
We thank Enzo Martorana for his critical comments of the manuscript. We thank the ESRF for provision of synchrotron radiation facilities, and we would like to thank Silvia Russi for assistance in using beamline ID14-EH3. This work was supported by the Italian Cystic Fibrosis Research Foundation grant #7/2010, with the collaboration of Delegazione FFC di Cosenza 2, Work in Progress Communication “Sapore di Sale 2010″, Gruppo di Sostegno di Monterotondo (RM), Delegazione FFC di Genova, Delegazione FFC “Il Sorriso di Jenny”, LIFC Comitato provinciale di Livorno.
References
- 1.Alexander C, Ivetac A, Liu X, Norimatsu Y, Serrano JR, Landstrom A, Sansom M, Dawson DC. Cystic fibrosis transmembrane conductance regulator: using differential reactivity toward channel-permeant and channel-impermeant thiol-reactive probes to test a molecular model for the pore. Biochemistry. 2009;48:10078–10088. doi: 10.1021/bi901314c. [DOI] [PMC free article] [PubMed] [Google Scholar]
- 2.Andrews P. The gel-filtration behaviour of proteins related to their molecular weights over a wide range. Biochem J. 1965;96:595–606. doi: 10.1042/bj0960595. [DOI] [PMC free article] [PubMed] [Google Scholar]
- 3.Baker JMR, Hudson RP, Kanelis V, Choy W, Thibodeau PH, Thomas PJ, Forman-Kay JD. CFTR regulatory region interacts with NBD1 predominantly via multiple transient helices. Nat Struct Mol Biol. 2007;14:738–745. doi: 10.1038/nsmb1278. [DOI] [PMC free article] [PubMed] [Google Scholar]
- 4.Bernadó P, Svergun DI. Structural analysis of intrinsically disordered proteins by small-angle X-ray scattering. Mol BioSyst. 2012;8:151–167. doi: 10.1039/c1mb05275f. [DOI] [PubMed] [Google Scholar]
- 5.Bernadó P, Mylonas E, Petoukhov MV, Blackledge M, Svergun DI. Structural characterization of flexible proteins using small-angle X-ray scattering. J Am Chem Soc. 2007;129:5656–5664. doi: 10.1021/ja069124n. [DOI] [PubMed] [Google Scholar]
- 6.Chappe V, Irvine T, Liao J, Evagelidis A, Hanrahan JW. Phosphorylation of CFTR by PKA promotes binding of the regulatory domain. Embo J. 2005;24:2730–2740. doi: 10.1038/sj.emboj.7600747. [DOI] [PMC free article] [PubMed] [Google Scholar]
- 7.Dalton J, Kalid O, Schushan M, Ben-Tal N, Villà-Freixa J. New model of cystic fibrosis transmembrane conductance regulator proposes active channel-like conformation. J Chem Inf Model. 2012;52:1842–1853. doi: 10.1021/ci2005884. [DOI] [PubMed] [Google Scholar]
- 8.Dunker AK, Lawson JD, Brown CJ, Williams RM, Romero P, Oh JS, Oldfield CJ, Campen AM, Ratliff CM, Hipps KW, Ausio J, Nissen MS, Reeves R, Kang C, Kissinger CR, Bailey RW, Griswold MD, Chiu W, Garner EC, Obradovic Z. Intrinsically disordered protein. J Mol Graph Model. 2001;19:26–59. doi: 10.1016/S1093-3263(00)00138-8. [DOI] [PubMed] [Google Scholar]
- 9.Dulhanty AM, Chang XB, Riordan JR. Mutation of potential phosphorylation sites in the recombinant R domain of the cystic fibrosis transmembrane conductance regulator has significant effects on domain conformation. Biochem Biophys Res Commun. 1995;206:207–214. doi: 10.1006/bbrc.1995.1029. [DOI] [PubMed] [Google Scholar]
- 10.Feigin LA, Svergun DI. Structure analysis by small-angle X-ray and neutron scattering. New York: Plenum Press; 1987. [Google Scholar]
- 11.Franke D, Svergun DI. DAMMIF, a program for rapid ab initio shape determination in small-angle scattering. J Appl Cryst. 2009;42:342–346. doi: 10.1107/S0021889809000338. [DOI] [PMC free article] [PubMed] [Google Scholar]
- 12.Glatter O, Kratky O. Small angle X-ray scattering. London: Academic Press; 1982. [Google Scholar]
- 13.Guinier A, Fournet G. Small-angle scattering of X-rays. New York: Wiley; 1955. [Google Scholar]
- 14.Hegedus T, Serohijos AW, Dokholyan NV, He L, Riordan JR. Computational studies reveal phosphorylation-dependent changes in the unstructured R domain of CFTR. J Mol Biol. 2008;378:1052–1063. doi: 10.1016/j.jmb.2008.03.033. [DOI] [PMC free article] [PubMed] [Google Scholar]
- 15.Ishida T, Kinoshita K. Prediction of disordered regions in proteins based on the meta approach. Bioinformatics. 2008;24:1344–1348. doi: 10.1093/bioinformatics/btn195. [DOI] [PubMed] [Google Scholar]
- 16.Kanelis V, Hudson RP, Thibodeau PH, Thomas PJ, Forman-Kay JD. NMR evidence for differential phosphorylation-dependent interactions in WT and DeltaF508 CFTR. EMBO J. 2010;29:263–277. doi: 10.1038/emboj.2009.329. [DOI] [PMC free article] [PubMed] [Google Scholar]
- 17.Kozin MB, Svergun DI. Automated matching of high- and low-resolution structural models. J Appl Cryst. 2001;34:33–41. doi: 10.1107/S0021889800014126. [DOI] [Google Scholar]
- 18.Lewis HA, Buchanan SG, Burley SK, Conners K, Dickey M, Dorwart M, Fowler R, Gao X, Guggino WB, Hendrickson WA, Hunt JF, Kearins MC, Lorimer D, Maloney PC, Post KW, Rajashankar KR, Rutter ME, Sauder JM, Shriver S, Thibodeau PH, Thomas PJ, Zhang M, Zhao X, Emtage S. Structure of nucleotide-binding domain 1 of the cystic fibrosis transmembrane conductance regulator. EMBO J. 2004;23:282–293. doi: 10.1038/sj.emboj.7600040. [DOI] [PMC free article] [PubMed] [Google Scholar]
- 19.Marasini C, Galeno L, Moran O. Thermodynamic study of the native and phosphorylated regulatory domain of the CFTR. Biochem Biophys Res Commun. 2012;423:549–552. doi: 10.1016/j.bbrc.2012.05.165. [DOI] [PubMed] [Google Scholar]
- 20.Marsh JA, Dancheck B, Ragusa MJ, Allaire M, Forman-Kay JD, Peti W. Structural diversity in free and bound states of intrinsically disordered protein phosphatase 1 regulators. Structure. 2010;18:1094–1103. doi: 10.1016/j.str.2010.05.015. [DOI] [PMC free article] [PubMed] [Google Scholar]
- 21.Mornon JP, Lehn P, Callebaut I. Atomic model of human cystic fibrosis transmembrane conductance regulator: membrane-spanning domains and coupling interfaces. Cell Mol Life Sci. 2008;65:2594–2612. doi: 10.1007/s00018-008-8249-1. [DOI] [PMC free article] [PubMed] [Google Scholar]
- 22.Mornon J, Lehn P, Callebaut I. Molecular models of the open and closed states of the whole human CFTR protein. Cell Mol Life Sci. 2009;66:3469–3486. doi: 10.1007/s00018-009-0133-0. [DOI] [PMC free article] [PubMed] [Google Scholar]
- 23.Mylonas E, Svergun DI. Accuracy of molecular mass determination of proteins in solution by small-angle X-ray scattering. J Appl Cryst. 2007;40:s245–s249. doi: 10.1107/S002188980700252X. [DOI] [Google Scholar]
- 24.Neville DC, Rozanas CR, Price EM, Gruis DB, Verkman AS, Townsend RR. Evidence for phosphorylation of serine 753 in CFTR using a novel metal-ion affinity resin and matrix-assisted laser desorption mass spectrometry. Protein Sci. 1997;6:2436–2445. doi: 10.1002/pro.5560061117. [DOI] [PMC free article] [PubMed] [Google Scholar]
- 25.Norimatsu Y, Ivetac A, Alexander C, Kirkham J, O’Donnell N, Dawson DC, Sansom MSP. Cystic fibrosis transmembrane conductance regulator: a molecular model defines the architecture of the anion conduction path and locates a “bottleneck” in the pore. Biochemistry. 2012;51:2199–2212. doi: 10.1021/bi201888a. [DOI] [PMC free article] [PubMed] [Google Scholar]
- 26.Ostedgaard LS, Baldursson O, Welsh MJ. Regulation of the cystic fibrosis transmembrane conductance regulator Cl- channel by its R domain. J Biol Chem. 2001;276:7689–7692. doi: 10.1074/jbc.R100001200. [DOI] [PubMed] [Google Scholar]
- 27.Petoukhov MV, Konarev PV, Kikhneya AG, Svergun D. ATSAS 2.1 – toward automated and web-supported small-angle scattering data analysis. J Appl Crystallogr. 2007;40:s223–s228. doi: 10.1107/S0021889807002853. [DOI] [Google Scholar]
- 28.Ptitsyn OB, Uversky VN. The molten globule is a third thermodynamical state of protein molecules. FEBS Lett. 1994;341:15–18. doi: 10.1016/0014-5793(94)80231-9. [DOI] [PubMed] [Google Scholar]
- 29.Serohijos AW, Hegedus T, Aleksandrov AA, He L, Cui L, Dokholyan NV, Riordan JR. Phenylalanine-508 mediates a cytoplasmic-membrane domain contact in the CFTR 3D structure crucial to assembly and channel function. Proc Natl Acad Sci USA. 2008;105:3256–3261. doi: 10.1073/pnas.0800254105. [DOI] [PMC free article] [PubMed] [Google Scholar]
- 30.Sreerama N, Woody RW. Computation and analysis of protein circular dichroism spectra. Methods Enzymol. 2004;383:318–351. doi: 10.1016/S0076-6879(04)83013-1. [DOI] [PubMed] [Google Scholar]
- 31.Svergun DI, Barberato C, Koch MHJ. CRYSOL - a program to evaluate x-ray solution scattering of biological macromolecules from atomic coordinates. J Appl Cryst. 1995;28:768–773. doi: 10.1107/S0021889895007047. [DOI] [Google Scholar]
- 32.Svergun DI. Determination of the regularization parameter in indirect-transform methods using perceptual criteria. J Appl Cryst. 1992;25:495–503. doi: 10.1107/S0021889892001663. [DOI] [Google Scholar]
- 33.Svergun DI, Koch MH. Advances in structure analysis using small-angle scattering in solution. Curr Opin Struct Biol. 2002;12:654–660. doi: 10.1016/S0959-440X(02)00363-9. [DOI] [PubMed] [Google Scholar]
- 34.Svergun DI, Koch MH. Small-angle scattering studies of biological macromolecules in solution Dmitri I Svergun1,2 and Michel H J Koch1. Rep Prog Phys. 2003;66:1735–1782. doi: 10.1088/0034-4885/66/10/R05. [DOI] [Google Scholar]
- 35.Tcherkasskaya O, Davidson EA, Uversky VN. Biophysical constraints for protein structure prediction. J Proteome Res. 2003;2:37–42. doi: 10.1021/pr025552q. [DOI] [PubMed] [Google Scholar]
- 36.Townsend RR, Lipniunas PH, Tulk BM, Verkman AS. Identification of protein kinase A phosphorylation sites on NBD1 and R domains of CFTR using electrospray mass spectrometry with selective phosphate ion monitoring. Protein Sci. 1996;5:1865–1873. doi: 10.1002/pro.5560050912. [DOI] [PMC free article] [PubMed] [Google Scholar]
- 37.Uversky VN, Gillespie JR, Fink AL. Why are “natively unfolded” proteins unstructured under physiologic conditions? Proteins. 2000;41:415–427. doi: 10.1002/1097-0134(20001115)41:3<415::AID-PROT130>3.0.CO;2-7. [DOI] [PubMed] [Google Scholar]
- 38.Uversky VN. Natively unfolded proteins: a point where biology waits for physics. Protein Sci. 2002;11:739–756. doi: 10.1110/ps.4210102. [DOI] [PMC free article] [PubMed] [Google Scholar]
- 39.Vankeerberghen A, Cuppens H, Cassiman J. The cystic fibrosis transmembrane conductance regulator: an intriguing protein with pleiotropic functions. J Cyst Fibros. 2002;1:13–29. doi: 10.1016/S1569-1993(01)00003-0. [DOI] [PubMed] [Google Scholar]
- 40.Volkov V, Svergun D. Uniqueness of ab initio shape determination in small-angle scattering. J Appl Crystallogr. 2003;36:860–864. doi: 10.1107/S0021889803000268. [DOI] [PMC free article] [PubMed] [Google Scholar]
- 41.Whitmore L, Wallace BA. Protein secondary structure analyses from circular dichroism spectroscopy: methods and reference databases. Biopolymers. 2008;89:392–400. doi: 10.1002/bip.20853. [DOI] [PubMed] [Google Scholar]
- 42.Wang W, He Z, O’Shaughnessy TJ, Rux J, Reenstra WW. Domain-domain associations in cystic fibrosis transmembrane conductance regulator. Am J Physiol Cell Physiol. 2002;282:C1170–C1180. doi: 10.1152/ajpcell.00337.2001. [DOI] [PubMed] [Google Scholar]
- 43.Xie J, Adams LM, Zhao J, Gerken TA, Davis PB, Ma J. A short segment of the R domain of cystic fibrosis transmembrane conductance regulator contains channel stimulatory and inhibitory activities that are separable by sequence modification. J Biol Chem. 2002;277:23019–23027. doi: 10.1074/jbc.M201661200. [DOI] [PubMed] [Google Scholar]
- 44.Zhang L, Aleksandrov LA, Zhao Z, Birtley JR, Riordan JR, Ford RC. Architecture of the cystic fibrosis transmembrane conductance regulator protein and structural changes associated with phosphorylation and nucleotide binding. J Struct Biol. 2009;167:242–251. doi: 10.1016/j.jsb.2009.06.004. [DOI] [PubMed] [Google Scholar]
- 45.Zhang L, Aleksandrov LA, Riordan JR, Ford RC. Domain location within the cystic fibrosis transmembrane conductance regulator protein investigated by electron microscopy and gold labelling. Biochim Biophys Acta. 2011;1808:399–404. doi: 10.1016/j.bbamem.2010.08.012. [DOI] [PubMed] [Google Scholar]
Associated Data
This section collects any data citations, data availability statements, or supplementary materials included in this article.


