

Abstract
Heteroplasmic cells, harboring both mutant and normal mitochondrial DNAs (mtDNAs), must accumulate mutations to a threshold level before respiratory activity is affected. This phenomenon has led to the hypothesis of mtDNA complementation by inter-mitochondrial content mixing. The precise mechanisms of heteroplasmic complementation are unknown, but it depends both on the mtDNA nucleoid dynamics among mitochondria as well as the mitochondrial dynamics as influenced by mtDNA. We tracked nucleoids among the mitochondria in real time to show that they are shared after complete fusion but not ‘kiss-and-run’. Employing a cell hybrid model, we further show that mtDNA-less mitochondria, which have little ATP production and extensive Opa1 proteolytic cleavage, exhibit weak fusion activity among themselves, yet remain competent in fusing with healthy mitochondria in a mitofusin- and OPA1-dependent manner, resulting in restoration of metabolic function. Depletion of mtDNA by overexpression of the matrix-targeted nuclease UL12.5 resulted in heterogeneous mitochondrial membrane potential (ΔΨm) at the organelle level in mitofusin-null cells but not in wild type. In this system, overexpression of mitofusins or application of the fusion-promoting drug M1 could partially rescue the metabolic damage caused by UL12.5. Interestingly, mtDNA transcription/translation is not required for normal mitochondria to restore metabolic function to mtDNA-less mitochondria by fusion. Thus, interplay between mtDNA and fusion capacity governs a novel ‘initial metabolic complementation’.
Electronic supplementary material
The online version of this article (doi:10.1007/s00018-015-1863-9) contains supplementary material, which is available to authorized users.
Keywords: Tfam, Rho0, Photoactivation, Mfn1, Mfn2, Nucleoids
Introduction
Mutations in mitochondrial (mt) DNA have been implicated not only in aging but also in more than 150 distinct genetic disorders [1–3]. Unlike mutations in nuclear genes, mtDNA mutations are most often heteroplasmic, i.e., mutant and normal molecules coexist within cells, and the proportion of mutant molecules can vary between tissues and with age [4, 5]. The threshold effect refers to the fact that mutant mtDNA must constitute a high proportion (60–90 %) of total cellular mtDNA to cause respiratory defects [6, 7]. Functional complementation by inter-mitochondrial content exchange between heteroplasmic mitochondria has been hypothesized as an explanation for this phenomenon [8].
To date, the role of mtDNA in the regulation of mitochondrial fusion and the role of fusion in the function of individual mitochondria remain unknown, largely because of a lack of an appropriate experimental system. Photoactivatable and photoswitchable fluorescent proteins, such as photoactivatable green fluorescent protein (PAGFP) and Kindling fluorescent protein (KFP), are widely used to visualize subcellular dynamics by the selective labeling of a subset of organelles or proteins within living cells [9–11]. Real-time imaging of photoactivatable fluorescent proteins or the fusion of cells expressing different fluorescent proteins has allowed the visualization of mitochondrial dynamics. We used these methods to identify two distinct modes of mitochondrial fusion–fission in mammalian cells: ‘kiss-and-run’ and complete fusion. In mitochondrial ‘kiss-and-run,’ two mitochondria come into close apposition, exchange soluble inter-membrane space and matrix contents, and then separate at the same site to preserve their original morphology [12]. Conversely, complete fusion entails the fusion of both outer and inner membranes of separate mitochondria generating one single entity. Fission may then occur at a different site to produce daughter mitochondria. Repetitive cycles of mitochondrial fusion and fission are essential for maintaining the metabolic function of these organelles as well as their regulatory roles in cell signaling and cell differentiation [12–17]. Fusion-fission cycles are reported to engage in mitochondrial segregation and elimination [18, 19]. In addition to mRNA, proteins, and other small, soluble factors, mtDNA has also been reported to exchange during mitochondrial fusion [20]. Defects in mitochondrial fusion can result in heterogeneity in (ΔΨm) and mtDNA nucleoids, which encode components of the electron transport chain [21]. Mitochondrial fusion is also reported to be required for mtDNA stability and tolerance of mtDNA mutations in skeletal muscle [22]. These observations have led to the proposal that the exchange of mtDNA nucleoids within heteroplasmic cells may underlie the functional complementation of pathogenic mtDNA genomes [23]. However, the implications of ‘kiss-and-run’ vs. complete fusion for mtDNA complementation remain to be experimentally tested.
The existence of inter-mitochondrial functional complementation remains controversial. Two studies suggested the absence of mitochondrial complementation, based on the observation that cybrids could not be generated from cells carrying different mtDNA mutations following culture in nutritional selection medium without pyruvate and uridine [24, 25]. However, several reports provide evidence for the presence of mitochondrial complementation. For example, cytochrome c oxidase activity was restored following the fusion of cells carrying different mtDNA mutations [26]. Also, in a mutant mtDNA mouse model, all mitochondria in tissues had normal cytochrome c oxidase activity until the mutation had accumulated to a high level [8]. Furthermore, in a mitofusin-knockout mouse model, the loss of mitofusins, which are required for mitochondrial fusion, led to the depletion of mtDNA and the accumulation of mtDNA mutations, indicating the role of mitochondrial fusion in the tolerance of mtDNA mutations [22].
We have previously found that ‘kiss-and-run’ is important for preventing mitochondrial metabolic dysfunction induced by oligomycin treatment [12], but the mechanisms and processes of the mitochondrial metabolic repair are not clear and the role of mtDNA is not well understood. Here, we developed a series of novel imaging methods to track mtDNA nucleoids in real time and analyze mitochondrial dynamics and metabolism. Our studies reveal the interplay between mtDNA and mitochondrial fusion, which together govern a previously unreported and novel process of ‘initial metabolic complementation’.
Materials and methods
Cells
HeLa cells and the derived Rho0 cell line were gifts from the laboratory of Professor Bin Lu (Wenzhou Medical College, China). Mfn1,2−/− Opa1−/− and control MEF cells were purchased from ATCC (Manassas, USA). WT HeLa cells were grown in Dulbecco’s modified Eagle’s medium (DMEM) supplemented with 10 % fetal bovine serum (FBS), streptomycin (50 μg/ml), and penicillin (50 U/ml). Rho0 HeLa cells were grown in the same medium but with the addition of 1 mM sodium pyruvate and 50 μg/ml uridine to support growth. WT MEF, Mfn1,2−/− MEF, and Opa1−/− MEF cells were grown in DMEM supplemented with 10 % FBS, streptomycin (50 μg/ml), penicillin (50 U/ml), 2 mM Glutamax (Gibco), and 2 mM NEAA (Gibco). All cultures were maintained at 37 °C in a humidified incubator containing 5 % CO2. For imaging experiments, cells were plated on glass coverslips.
Transient expression
Transfection was performed using electroporation (2–3 × 10⁶ cells and 10–20 μg of each DNA plasmid per 200 μl Opti-MEM). All mitochondrial matrix-targeting fluorescent protein (mtFP) vectors encoded the targeting sequence of cytochrome c oxidase subunit VIII to achieve mitochondrial matrix localization. The Tfam-DsRed plasmid was constructed by replacing the sequence encoding the cytochrome c oxidase subunit VIII of mtDsRed with that of hTfam (NM_009360.4) or mTfam (NM_009360). Transfected cells were cultured for 24–72 h before imaging experiments.
The mouse Rho0 cell lines acquired by genetic approach
The pMX-UL12.5-GFP plasmid was constructed by inserting the coding sequence for UL12.5 into the pMXs-GFP retroviral vector. The pMXs-m-Mfn1 and pMXs-m-Mfn2 plasmids were constructed by inserting the coding sequences for m-Mfn1 (NM_024200.4) and m-Mfn2 (NM_133201.2) into the pMXs-Flag vector. For virus production, Plat-E cells were plated in a 10-cm dish for 24 h, and then transfected with 10 μg pMX-UL12.5-GFP/40 μg Polyethylenimine (PEI,Polyscience Co.) in 1 ml Opti-MEM (Invitrogen). The culture medium was replaced 12 h after transfection and the medium containing retrovirus was collected 36 h later. Rho-(UL12.5) cells were used for studies requiring cell fusion once it was confirmed that all cells contained low ΔΨm mitochondria. For functional rescue experiments involving overexpression of Mfn1/2, equal amounts of virus encoding UL12.5-GFP and virus encoding Mfn1/2, Mfn1, Mfn2, Mfn1T09A, or Mfn1K88T were used to infect either WT or Mfn1,2−/− MEF cells. Viruses generated using the control pMXs-Flag vector were used as a control to equalize the total amount of virus administered to cells. For functional rescue experiments using M1, cells (WT or Mfn1,2−/− MEF) were infected with UL12.5-GFP virus and then treated with either 5 μM M1 or 0.1 % DMSO (control). Cellular ATP production and mitochondrial ΔΨm were then measured as described below.
Live cell imaging
Confocal microscopy was performed using a Leica DMIRE2 inverted microscope (Leica Microsystems, Montreal). Fusion experiments were performed using a 100× oil objective (Uapo340, NA 1.40), and images of 1024 × 1024 pixel resolution were recorded at a frame rate of 5.83 s−1. Photoactivation of PAGFP and excitation of CFP was performed using the 458 nm line of the Ar/ArKr laser, and excitation of EYFP and EGFP was performed using the 488 nm line. The 543 nm line of the HeNe laser source was used for the excitation of DsRed or TMRM. Photoactivation of PAGFP was performed using the region of interest scanning option in the Leica LAS AF Lite software. A single 25 μm2 area was chosen per cell, and following photoactivation was imaged at a rate of 80 images every 5.83 s.
ΔΨm was measured using the potentiometric dye TMRM (Invitrogen) or JC-1 staining. For TMRM staining, cells were treated with 25 nM TMRM for 30 min, and then with 5 nM TMRM for imaging, using the confocal parameters described above. The JC-1 Mitochondrial Membrane Potential Assay Kit (Beyotime, BJ) was used to measure ΔΨm according to the manufacturer’s protocol. The ΔΨm of WT and Rho0 cells was measured using the same culture medium before and after TMRM (or JC-1) staining. The quantitation of ΔΨm was done as average intensity of mitochondria. All image analysis was performed using the Leica LAS AF Lite software. All imaging experiments were conducted using a minimum of three different cell preparations.
Cell fusion
For cell fusion, cells with differently labeled mitochondria were mixed and plated on glass coverslips 16–40 h before cell fusion. Cycloheximide (20 μg/ml) was added to cell cultures 30–60 min before fusion and maintained in all media and buffers used subsequently to inhibit cytoplasmic protein synthesis. The protocol for PEG-mediated fusion of adherent cells was a slight modification of that reported previously [27]. Co-cultured cells seeded on 24 × 24-mm coverslips were washed with phosphate-buffered saline (PBS) without serum and incubated for 45–60 s with 1 ml of a prewarmed (37 °C) solution of PEG 2000 [50 % (wt/vol) in DMEM]. Cells were washed three times with DMEM containing 10 % serum, and then cultured for 7 h under normal growth conditions before fixation with 4 % paraformaldehyde for 10 min. Coverslips were mounted onto microscope slides with GelMount (Biomeda, Foster City, CA, USA). To observe the mobility (or uptake of ΔΨm dyes) of mtDNA-less mitochondria in real time, cells were returned to normal growth conditions after fusion and then 45–120 min later (or after 7 h) imaged in the presence of 50 mM cycloheximide.
Immunofluorescence
Samples were processed for analysis by immunofluorescence as follows: cells were fixed with 4 % paraformaldehyde for 15 min, washed, and permeabilized in 0.5 % Triton X-100 for 15 min. Cells were then washed, blocked with 1 % bovine serum albumen/PBS for 15 min, and incubated with primary antibody for 1 h. After washing, cells were then incubated with corresponding secondary antibody (Pierce) for 1 h. All washes were with PBS and all procedures were performed at room temperature. Primary antibodies used were anti-DNA (BD, USA, 1:100) and anti-Tfam (Abcam, 1:50).
Western blotting
Equal amounts of total protein (approximately 20 μg) from WT and Rho0 HeLa cells were resolved by 10 % polyacrylamide/sodium dodecyl sulfate gel electrophoresis and then transferred onto polyvinylidene fluoride membranes. Membranes were then blocked overnight, followed by incubation with anti-Tfam (Abcam, 1:1000), anti-Cox2 (Abcam, 1:1000), anti-Opa1 (Abcam, 1:1000), or anti-β-actin (Santa Cruz, 1:2000) antibodies. After incubation with the primary antibody, membranes were incubated with horseradish peroxidase-coupled secondary antibody and immunoreactivity was subsequently detected using SuperSignal West Pico Chemiluminescent Substrate (Pierce).
Quantitative PCR analysis
Total mtDNA was prepared from MEF cells using a genome extraction kit (TianGen). Total RNA was extracted using Trizol reagent (Invitrogen) according to the manufacturer’s instructions and cDNA was synthesized by reverse transcription of 1 μg total RNA per sample using the ReverTra Ace-α kit (Toyobo). Quantitative polymerase chain reaction (Q-PCR) was performed using a CFX-96 real-time PCR detection system (BioRad) in conjunction with the SYBR Premix Ex Taq kit (Takara) using the following conditions: an initial denaturation step of 95 °C for 30 s, followed by 40 cycles of denaturation at 95 °C for 5 s and annealing–elongation at 60 °C for 20 s. The primers used were as follows: Cox1 (forward, 5′-TGTGAGGTCTGCCAGTCTTTA-3′; reverse, 5′-TGTCCTTAATTGGGGTCGTTG-3′); Cox2 (forward, 5′-CATCCCTACGCATCCTTTAC-3′; reverse, 5′-GGTTTGCTCCACAGATTTCAG-3′); and β-actin (forward, 5′-TGACGTGGACATCCGCAAAG-3′; reverse, 5′-CTGGAAGGTGGACAGCGAGG-3′). ND5 (forward, 5′-TCCTACTGGTCCGATTCCAC-3′, reverse, 5′-ATGTCGTTTTGGGTGAGAGC-3′).
ATP measurement
ATP levels were determined using the ENLITEN ATP Assay System (Promega Corp., Madison, WI, USA). Cell extraction was performed with 2.5 % trichloroacetic acid, and the sample was neutralized and diluted in 10 mM Tris–acetate (pH 7.75). ATP levels were then measured using the luciferase/luciferin reagent according to the manufacturer’s protocol. The protocol for measuring mitochondrial ATP production was a slight modification of that previously reported [28]. Cells were treated with 10 mM oligomycin for 15 min before ATP levels were measured.
Statistics
The data are shown as mean ± SEM, and all experiments were repeated at least three times. All statistical analysis was performed using SPSS software (SPSS Inc., Chicago, IL, USA). Comparisons of the proportions of fused cells and the TMRM FI of mitochondria for various cell hybrids were made by analysis of variance as indicated in the legends of the relevant figures. The significance of statistical differences observed for other experiments was evaluated using the Student’s t test as indicated in the legends of relevant figures. p values of less than 0.05 were considered as significant, while values less than 0.01 were considered as highly significant.
Results
mtDNA nucleoids are shared after mitochondrial complete fusion but not ‘kiss-and-run’
Human cells contain several hundred nucleoids each of which contains between 2 to 8 mtDNA molecules. Nucleoids co-localize with mitochondrial transcription factor A (Tfam) and are distributed throughout the mitochondrial inner compartment [20]. We fused Tfam to DsRed to visualize nucleoid dynamics in live cells. In wild-type cells (WT), Tfam was observed as punctuate structures that co-localize with mtDNA visualized by anti-DNA immunostaining (Fig. S1a), whereas in cells lacking mtDNA (Rho0 cells) Tfam fluorescence exhibited a diffuse distribution within mitochondria (Fig. 1a). The number of mtDNA nucleoids is unaffected by the overexpression of Tfam-DsRed (Fig. S1b). This observation suggests that Tfam-DsRed is a valid marker of mtDNA nucleoids in live cells.
Fig. 1.

mtDNA nucleoids are shared after complete fusion but not ‘kiss-and-run,’ which is Opa1 dependent. a The distribution of Tfam in WT and Rho0 cells (scale bar 10 μm). b Labeling of a subpopulation of mitochondria by photoactivation of PAGFP in WT MEF cells expressing both mtPAGFP and Tfam-DsRed (scale bar 1 μm). c Time course of a typical mtDNA nucleoid sharing event by mitochondrial complete fusion as determined by photoactivation (scale bar 1 μm). We define 0 s as the time when the transfer of photoactivated PAGFP has begun. The FI of mitochondrion #1 increases after photoactivated PAGFP transfers from mitochondrion #2 to mitochondrion #1. d Time course of mtDNA nucleoid movement during ‘kiss-and-run’ events after PAGFP photoactivation (scale bar 1 μm). The FI of mitochondrion #1 increases after photoactivated PAGFP transfers from mitochondrion #2 to mitochondrion #1 at 0 s. e The percentage of mtDNA nucleoid sharing events that occurred during ‘kiss-and-run’ fusion events per 466.4 s imaging interval (n ≥ 25). f There were no fusion events in Opa1−/− MEF cells, while there were 9 ± 2 fusion events in WT MEF cells (n = 5). # p < 0.01. g Model of mtDNA nucleoid dynamics
Using matrix-targeted mtPAGFP in combination with Tfam-DsRed allowed the study of the exchange of mtDNA nucleoids among individual mitochondria in real time (Fig. 1b). As in a previous report [12], we employed high-resolution time-lapse confocal microscopy with region of interest scanning to selectively and irreversibly photoactivate subpopulations of mitochondria. Monitoring the dynamics of mitochondria after photoactivation, we classified fusion events as either complete or ‘kiss-and-run’. We observed that Tfam-DsRed-labeled nucleoids are shared after complete fusion but not ‘kiss-and-run’ (Fig. 1c–e; Fig. S1c–e). Although mitochondrial ‘kiss-and-run’ is approximately three times more frequent than complete fusion in Mouse Embryonic Fibroblast (MEF) and HeLa cells (a rate similar to that found for H9c2 cells [12] ), we did not observe any mtDNA nucleoids are shared after ‘kiss-and-run’ with durations ranging from 5.8 s to 5 min (n = 25). Importantly, real-time imaging revealed that mtDNA nucleoids demonstrate little mobility within mitochondria, an observation that would predict mtDNA sharing after complete fusion, but not in ‘kiss-and-run’ wherein the fusion pore opens transiently only to allow the exchange of soluble contents.
We then tested whether the inner membrane fusion protein, Opa1, is required for mtDNA sharing. We found that both matrix exchange and mtDNA nucleoids sharing are eliminated in Opa1−/− cells (Fig. 1f). This result suggests that mtDNA nucleoid sharing involves the same double membrane fusion mechanism as that required for matrix exchange. The above results indicate that mtDNA nucleoids are shared after complete fusion but not after ‘kiss-and-run’ (Fig. 1g).
mtDNA-less mitochondria exhibit weak fusion activity among themselves yet remain competent in fusing with normal mitochondria
To determine the dependence of mitochondrial fusion on mtDNA, we used the mtDNA-less cell line, Rho0 HeLa. We first confirmed that Rho0 HeLa cells stained negative for mtDNA, exhibited no mtDNA transcription, and exhibited only low Tfam expression (Fig. S2a, b, d). To examine fusion between normal and mtDNA-less mitochondria, we generated cell hybrid models using WT and Rho0 cells (Fig. 2a) expressing mitochondrial matrix-targeting fluorescent proteins of different colors. Seven hours after polyethylene glycol (PEG) treatment to induce cell fusion, Rho0 × Rho0 hybrids showed little fusion relative to WT × WT crosses, whereas Rho0 × WT resulted in an intermediate phenotype (Fig. 2b), indicating a mtDNA dependence of mitochondrial fusion. In addition, we observed mtDNA nucleoids are shared after mitochondrial fusion in WT × Rho0 cell hybrids by Tfam and DNA immunofluorescence (Fig. S2e), consistent with the observed mobility of mitochondrial nucleoids and respiratory complexes [20]. Together, our results suggest that mtDNA-less mitochondria exhibit weak fusion activity among themselves, yet retain the ability to fuse efficiently with normal mitochondria.
Fig. 2.

Dependence of mitochondrial fusion on mtDNA as determined by PEG-induced cell fusion and in vivo photoactivation. a Representative images of three PEG-induced cell hybrid fusion assays performed by fusing the different cell combinations indicated on the right (Scar bar 10 μm). b Quantitation of the PEG-induced cell hybrid experiments (n ≥ 60). c Labeling of one subset of mitochondria by photoactivation of PAGFP in WT and Rho0 cells expressing both mtPAGFP and mtDsRed (Scar bar 10 μm). d Mitochondrial fusion was monitored by measuring the dilution of mtPAGFP in the photoactivated area for 200 s (n = 5). Comparison of the frequency of mitochondrial fusion (e) or fission (f) events and the duration of ‘kiss-and-run’ events (g) in WT and Rho0 cells. h Measurement of cellular ATP production in WT and Rho0 cells. i Measurement of mitochondrial ATP production in WT and Rho0 cells before and after 15 min treatment with 10 mM oligomycin. j The protein expression pattern of different Opa1 isoforms in WT and Rho 0 and iPS cells assayed by Western blotting. Scale bar 10 μm, # p < 0.01, *p < 0.05
Next we co-expressed matrix-targeted mtPAGFP and mtDsRed in Rho0 and WT cells, and then photoactivated mtPAGFP in vivo (Fig. 2c). In WT cells, where the mitochondrial fusion activity is high, the photoactivated mtPAGFP fluorescence intensity (FI) steadily diminished due to the continuous fusion between photoactivated and nonphotoactivated mitochondria. However, in Rho0 cells, the mtPAGFP FI declined much slower (12 % Rho0 vs. 37 % WT, n = 5 for each), indicative of a limited mitochondrial fusion activity in Rho0 cells (Fig. 2d). We observed both fusion and fission events in Rho0 cells (Fig. S2c), although these occurred at only 20 and 11 % of the respective rates observed in WT cells (Fig. 2e, f). We also determined the duration of association between mitochondria after the exchange of contents for each ‘kiss-and-run’ event and found that the duration of ‘kiss-and-run’ in Rho0 cells was significantly longer (124 ± 41 s) than that in WT (43 ± 18 s) (Fig. 2g). These results indicated that although mtDNA may not be required for mitochondrial fusion, the potential for mtDNA-less mitochondria to undergo fusion is much lower than that of normal mitochondria, a finding that was consistent with the results obtained from Rho0/WT cell experiments.
We then sought to determine the mitochondrial metabolic status in WT and Rho0 cells. The cellular ATP level in Rho0 cells was much lower than that in WT cells (53 % of control, Fig. 2h), and the ΔΨm of Rho0 cells was much lower than that of WT cells (Fig. S4a, b). We found that the mitochondrial ATPase inhibitor oligomycin had little effect on the ATP level in Rho0 cells, while this inhibitor reduced the ATP level in WT cells by 60 % (a level approaching that found for Rho0 cells), demonstrating that residual ATP production in Rho0 cells was independent of mitochondria (Fig. 2i). Mitochondrial fusion was detected during ATP depletion in HeLa cells, but was not detected in the presence of an uncoupler using a cell fusion assay where quantification was not performed [29]. However, our individual mitochondrial tracking experiments showed that mitochondrial fusion exists during loss of ΔΨm and suggested Opa1 cleavage is responsible for inhibition of fusion with an uncoupler [12]. As reduced mitochondrial ATP and ΔΨm have been reported to induce Opa1 cleavage [30–33], we next examined Opa1 protein levels in WT and Rho0 cells (Fig. 2j). Opa1 exists as multiple isoforms as a result of eight mRNA splice forms [34] and subsequent proteolytic processing at two sites [31]. In gel electrophoresis, Opa1 isoforms migrate as a complex mixture of five bands, routinely observed as two upper long bands and three lower short bands [31, 33] (Fig. 2j, note the five characteristic Opa1 bands observed for induced pluripotent stem cells). In Rho0 cells, the upper bands of Opa1 are less but the lower bands are increased, compared to WT, indicating increased Opa1 cleavage generates more short forms in mtDNA-less mitochondria. Long and short Opa1 isoforms are required to functionally complement one another to support substantial fusion activity [33]. Therefore, the weak fusion activity observed among mtDNA-less mitochondria can be ascribed to the pattern of Opa1 cleavage observed in these defective organelles, whereas long and short Opa1 isoforms, which functionally complement one another, enable competent fusion between mtDNA-less and normal mitochondria.
It has been reported that outer mitochondrial membrane (OMM) and inner mitochondrial membrane (IMM) fusion are not coupled in the process of mitochondrial fusion [12, 27]. Then we tested OMM fusion frequency among Rho0 cells. We used Omp25-PAGFP to mark mitochondrial outer membrane, and observe OMM fusion events by photoactivation in WT and Rho0 HeLa cells (Fig. S3a). The Omp25-PAGFP FI in Rho0 cells declines a little slower than that in WT cells (25 % Rho0 vs. 35 % WT, n = 5) (Fig. S3b), whereas the mtPAGFP in Rho0 cells declines much slower than that in WT cells (12 % Rho0 vs. 37 % WT, n = 5) (Fig. 2d). On the other hand, the number of OMM fusion events in Rho0 cells had 47 % decrease compared with that in WT cells (Fig. S3c), which is much less than 80 % decrease in matrix fusion events (Fig. 2e). Above data together show that the OMM fusion in Rho0 cells is affected to a lesser degree compared with the matrix fusion. Except the fusion proteins, mitochondrial fusion is also modulated by biophysical properties such as mitochondrial motility [18]. Indeed, the mitochondrial motility in Rho0 cells is slower than that in WT cells (0.010 ± 0.001 μm/s Rho0 vs. 0.017 ± 0.003 μm/s WT, n = 5), which may be responsible for the OMM fusion frequency decrease in Rho0 cells.
Mitochondrial ‘initial metabolic complementation’ is dependent on mitofusins/Opa1-mediated fusion
To evaluate the metabolic capacity of cell hybrids, ΔΨm was measured by tetramethylrhodamine methyl ester (TMRM) staining (Fig. 3a). In all experiments, the TMRM fluorescence intensity (TMRM FI) of mitochondria was normalized to that of WT cells. In experiments using WT × WT cell hybrids, the TMRM FI was found to be 0.99 ± 0.07, indicating that cell fusion had no discernible effect on ΔΨm. The TMRM FI of mitochondria in Rho0 cells and Rho0 × Rho0 cell hybrids was 0.19 ± 0.01 and 0.20 ± 0.02, respectively (Fig. 3b). Low ΔΨm in Rho0 was also confirmed using JC-1-based methods (Fig. S4a, b). The TMRM FI of mitochondria in WT × Rho0 hybrids 7 h after fusion was 0.86 ± 0.06, a result that was similar to that found for WT or WT × WT cell hybrids, but which was much higher than that for Rho0 or Rho × Rho0 hybrids (Fig. 3b). This indicates that Rho0 cells recover ΔΨm shortly after fusing with WT cells, therefore demonstrating the occurrence of mitochondrial metabolic complementation. It has been reported that cells carrying non-overlapping mtDNA deletions can trans-complement and fuse to restore mitochondrial protein synthesis after long-term culture for more than 10 days [35]. Our results demonstrate a new process of mitochondrial metabolic complementation that occurs in the short term (within 7 h), distinct from this long-time complementation.
Fig. 3.

Inter-mitochondrial initial metabolic complementation is dependent on mitochondrial fusion. a Measurement of ΔΨm in WT × WT, Rho0 × Rho0 and WT × Rho0 cell hybrids as determined by TMRM staining (Scar bar 10 μm). b Quantitation of ΔΨm of WT cells, Rho0 cells, and WT × WT, Rho0 × Rho0 and WT × Rho0 cell hybrids, normalized to the FI in WT cells (n ≥ 10). c Measurement of ΔΨm in Rho-(UL12.5) × WT, Rho-(UL12.5) × Rho-(UL12.5), Rho-(UL12.5) × Mfn1,2−/−, and Rho-(UL12.5) × Opa1−/− cell hybrids by TMRM. In Rho-(UL12.5) × Mfn1,2−/− or Rho-(UL12.5) × Opa1−/− hybrids, Rho-mitochondria (green) and Mfn1,2−/− or Opa1−/− mitochondria (red) are adjacent but do not show colocalization (Scar bar 10 μm). d Quantitation of ΔΨm in Rho-(UL12.5) × WT, Rho-(UL12.5) × Rho-(UL12.5), Rho-(UL12.5) × Mfn1,2−/−, and Rho-(UL12.5) × Opa1−/− cell hybrids (scale bar 10 μm, n ≥ 10). e A single mtDNA-less mitochondrion gains a higher ΔΨm after fusing with a normal mitochondrion by complete fusion (Scar bar 1 μm). f mtDNA-less mitochondria exhibit increased mitochondrial motility after fusing with normal mitochondria
We then sought to determine whether mtDNA-less mitochondria recover ΔΨm through fusion with normal mitochondria. We adopted a genetic approach to test this possibility by generating Rho-MEF cells. UL12.5 is an endonuclease of DNA from herpes simplex virus (HSV) [36] that can be targeted to the mitochondrial matrix to cleave mtDNA. In MEF cells infected with UL12.5-GFP retrovirus (UL12.5), we observed that mtDNA and mtRNA decreased to 22.7 and 0.002 % of their initial levels, respectively, after 4 days (Fig. S4c, d). These data demonstrate that the Rho-MEF cells could be generated successfully at the level of mtDNA transcription.
Consequently, we next performed ΔΨm imaging experiments using Rho-MEF cells in conjunction with the different MEF cell lines. Again, the TMRM FI of mitochondria in MEF cell experiments was normalized to that of the WT controls. The TMRM FI of mitochondria in Rho-(UL12.5) MEF cells was 0.26 ± 0.03, while TMRM FI observed for Mfn1,2−/− and Opa1−/− cells was 0.93 ± 0.12 and 0.95 ± 0.03, respectively (n = 30 per experimental group; Fig. 3c, d; Fig. S4e). Following cell fusion, the TMRM FI of mitochondria in WT × Rho-(UL12.5) MEF cell hybrids was 0.92 ± 0.17 (n = 12), a finding that was similar to that found for WT cells, but which was much higher than that for Rho-(UL12.5) or Rho-(UL12.5) × Rho-(UL12.5) cell hybrids (0.21 ± 0.07, n = 17). However, in Mfn1,2−/− × Rho-(UL12.5) and Opa1−/− × Rho-(UL12.5) cell hybrids, mitochondria from each parental cell maintained their original ΔΨm (Mfn1,2−/−: 0.97 ± 0.15, Rho-(UL12.5): 0.18 ± 0.05; Opa1−/−: 0.95 ± 0.03, Rho-(UL12.5): 0.23 ± 0.03, n = 12 per experimental group), indicating a failure in metabolic restoration (Fig. 3c, d). These findings indicate that mitofusin- and Opa1-mediated fusion is required for metabolic complementation between normal and mtDNA-less mitochondria.
Next we tracked the fate of mtDNA-less mitochondria by performing real-time Rho0 (mtEYFP) × WT MEF cell fusion experiments. In cell hybrids stained with TMRM, mtDNA-less mitochondria, which were identifiable by green (mtEYFP) fluorescence, exhibited low-intensity red fluorescence (TMRM), whereas normal mitochondria exhibited high-intensity red fluorescence (TMRM). We then tracked fusion events between mtDNA-less and normal mitochondria. Figure 3e provides an example of an mtDNA-less mitochondrion (#1), with EYFP fluorescence and low TMRM FI, undergoing complete fusion with a normal mitochondrion (#2), which exhibits no EYFP fluorescence and high TMRM FI. Fusion is complete by the 0 s time point. Upon fusion, the resulting mitochondrion gained red fluorescence by uptake of TMRM, and the TMRM FI had stabilized by the 5.8 s time point, indicating that the mtDNA-less mitochondrion gains ΔΨm after fusion with the normal mitochondrion. As shown in Fig. S5, the mtDNA-less mitochondrion (#1) can also gain ΔΨm after fusion with a normal mitochondrion (#2) by a lone time ‘kiss-and-run’ and maintain ΔΨm after re-separation.
Specific positioning of the mitochondria is required for cellular metabolism, specialization, and ion transport [37, 38]. As Rho0 mitochondrial motility is inhibited, this raises the interesting question of whether Rho0 mitochondria can regain motility by fusion with normal mitochondria. We therefore performed real-time Rho0 (mtEYFP) × WT (mtDsRed) cell fusion experiments, and tracked the movement of mtDNA-less mitochondria. Tracking experiments revealed that mtDNA-less mitochondria exhibited poor motility (0.010 ± 0.001 μm/s, n = 5; Fig. 3f). However, an increase in mitochondrial movement was observed during the process of complete fusion and during ‘kiss-and-run’ events (0.022 ± 0.003 and 0.046 ± 0.021 μm/s; p < 0.05, n = 3). Also, ‘kiss-and-run’ was found to increase the movement of mitochondria immediately after re-separation (0.081 ± 0.010 μm/s; Fig. 3f). This indicates that mtDNA-less mitochondria gain motility by fusion with normal mitochondria, consistent with mitochondrial metabolic recovery.
The process of mitochondrial ‘initial metabolic complementation’ is independent of mtDNA transcription/translation
We then asked whether our observation of mitochondrial metabolic complementation is dependent on mtDNA transcription/translation. Vitamin K3 (VK3) can inhibit mtDNA replication, low-dose Ethidium bromide (EB) can inhibit both mtDNA replication and transcription, and chloramphenicol (Cap) can inhibit mtDNA translation. We therefore subjected cells to combined treatment with VK3 and EB to determine the effect of transcriptional inhibition on mitochondrial initial functional complementation, while Cap treatment was used to determine the role of translation in this process. First, we examined the relative levels of Cox1/2 mtDNA (Fig. 4a; Fig. S6), mtRNA (Fig. 4b), and protein (Fig. 4c) in HeLa cells treated with various concentrations of VK3, EB, and Cap, respectively. Results showed that mtDNA replication, transcription, and translation were inhibited in the presence of 30 μM VK3, 0.4 μg/ml EB, and 100 μg/ml Cap. We then performed Rho0 × WT cell fusion experiments for a duration of 7 h in the presence of these inhibitors at the above concentrations. The results showed that TMRM FI of mitochondria in Rho0 and WT × Rho0 cell hybrids was 0.27 ± 0.06 and 0.85 ± 0.06, respectively, while the TMRM FI of mitochondria in WT × Rho0 cell hybrids treated with VK3, EB, or Cap was 0.82 ± 0.05, 0.83 ± 0.03, or 0.90 ± 0.02, respectively (Fig. 4d, e). This demonstrated that normal mitochondria could restore the metabolic function of mtDNA-less mitochondria, even if mitochondrial transcription and translation were inhibited. In summary, our observations indicate a novel short-term effect of mitochondrial fusion called ‘initial metabolic complementation’ which precedes long-term mtDNA transcription/translation-dependent complementation.
Fig. 4.
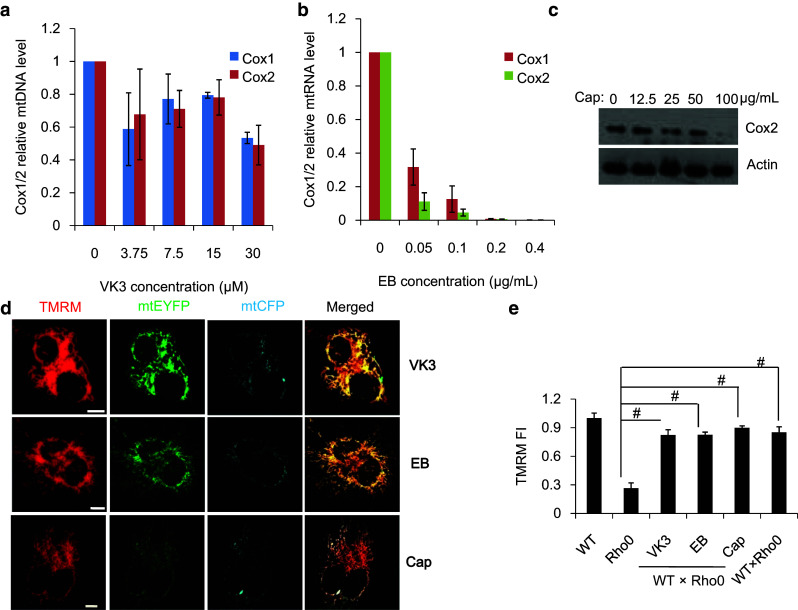
Inter-mitochondrial initial metabolic complementation is not dependent on mtDNA transcription/translation. Relative levels of Cox1/2 mtDNA (a) mtRNA (b) and protein (c) in HeLa cells treated with various concentrations of VK3, EB or Cap. d Measurement of ΔΨm by TMRM staining in WT × WT, Rho0 × Rho0 and WT × Rho0 cell hybrids treated with 30 μM VK3, 0.4 μg/ml EB and 100 μg/ml Cap (Scar bar 10 μm). e Quantitation of ΔΨm by TMRM staining of WT, Rho0, WT × Rho0 cell hybrids, and WT × Rho0 cell hybrids treated with VK3, EB, and Cap (n ≥ 10). Scale bar 10 μm, # p < 0.01
Mitofusins or the fusion-promoting drug M1 can enhance mitochondrial ‘initial metabolic complementation’
Rho0 cells were then generated from WT and Mfn1,2−/− MEF by the overexpression of matrix-targeted endonuclease UL12.5, as described above. Strikingly, ΔΨm phenotypes were different between WT and Mfn1,2−/− cells during the course of infection. In WT MEF cells, we did not observe the coexistence of high and low ΔΨm mitochondria within single cells, but rather a population of cells showed a low ΔΨm phenotype where all the mitochondria were equally depolarized (Fig. 5a, upper panel). In Mfn1,2−/− MEF cells, high and low ΔΨm mitochondria were observed to coexist within single cells under normal conditions (14.2 ± 1.2 %, Fig. 5b) consistent with previous reports [39], however, after expression of UL12.5 that fraction increased more than fivefold (Fig. 5b). These data indicate the occurrence of ‘initial metabolic complementation’ driven by Mfn1/2-dependent fusion between mitochondria of different metabolic states that can compensate for the destruction of mtDNA.
Fig. 5.

Overexpression of Mfn1/2 or treatment with the fusion-promoting drug M1 enhances mitochondrial metabolic complementation. a Differential patterns of ΔΨm were observed for the mitochondria of WT MEF and Mfn1,2−/− MEF cells 6 days post-infection with UL12.5-GFP virus (upper panel, H denotes high ΔΨm, L denotes low ΔΨm, scale bar 50 μm; lower panel, scale bar 10 μm). b Quantitation of percentage of mitochondria with low ΔΨm in Mfn1,2−/− MEF cells or Mfn1,2−/− MEF cells 6 days following infection with UL12.5-GFP virus (n = 10). c Quantitation of the percentage of MEF cells with low ΔΨm mitochondria 6 days following the co-infection of cells with UL12.5-GFP and pMXs-Flag, Mfn1, Mfn2, Mfn1/2, Mfn1T109A, or Mfn1K88T (n ≥ 85). d Cellular ATP production of MEF cells following treatment as described in c. e Quantitation of the percentage of MEF cells with low ΔΨm mitochondria 6 days following the simultaneous infection and treatment of cells with UL12.5-GFP virus and either DMSO control or M1 (n ≥ 100). f Quantitation of percentage of mitochondria with low ΔΨm in Mfn1,2−/− MEF cells that were simultaneously infected and treated as described in e (n = 10). g Cellular ATP production of WT or Mfn1,2−/− MEF cells that were simultaneously infected and treated as described in e. # p < 0.01
During the time course of UL12.5 virus infection, the percentage of WT cells with low ΔΨm mitochondria increased, and the cellular ATP level decreased. This provides, for the first time, a quantifiable in vitro system to screen for genes or drugs that affect metabolic rescue, and such a system may prove useful as a tool in the search for, and development of, new therapies. To test the role of mitochondrial fusion in this system, we performed overexpression studies using mitofusins including Mfn1, Mfn2, and Mfn1 GTPase domain mutants, K88T and T109A, which show little fusion activity [40]. At day 6 after infection with UL12.5, the percentage of cells with low ΔΨm was significantly reduced by co-expression of either Mfn1, Mfn2 and by both in tandem, whereas the GTPase mutants had no effect (Fig. 5c). These findings were mirrored by corresponding increases in cellular ATP levels (Fig. 5d). These results demonstrate that in this system, mitochondrial functional complementation was dependent on mitochondrial fusion. Besides mitochondrial fusion, mtDNA synthesis can also enhance mitochondrial metabolic function in this system, however, we did not detect any changes in ND2/ND5 mtDNA or mtRNA levels in MEF cells after overexpression of Mfn1 and/or Mfn2 for 6 days (Fig. S7). These data suggest that mitofusin-mediated metabolic complementation is a candidate target for therapy for mtDNA mutation diseases.
The small molecule M1 promotes mitochondrial fusion in mammalian cells [41]. We therefore also decided to test this drug using our UL12.5-GFP retroviral-based system. By day 6 post-viral infection, the percentage of cells with low ΔΨm was 68.3 ± 1.1 % when infection was combined with treatment with 5 μM M1, whereas it was 87.2 ± 1.1 % for control cells treated with DMSO. In addition, the relative cellular ATP concentration in cells treated with 5 μM M1 was 0.76 ± 0.04, whereas it was 0.53 ± 0.04 for DMSO controls (values normalized to those of untreated/uninfected MEF). We then sought to determine whether M1 exerted its function through mitochondrial fusion. We therefore used this drug in experiments with Mfn1/2−/− MEF cells infected with UL12.5 virus, and found that there was no difference in either ΔΨm or ATP measurements following administration of M1 (Fig. 5e–g). Therefore, the small molecule M1 enhances mitochondrial metabolic complementation by targeting mitochondrial fusion, suggesting that it may be a candidate drug for the treatment of mitochondrial diseases.
Discussion
The results of our study provide evidence for the establishment of two new concepts regarding the interplay between mitochondrial fusion and mtDNA. First, mtDNA nucleoids exhibit poor mobility and can only be shared after complete mitochondrial fusion and not ‘kiss-and-run,’ which does not permit the physical interaction of the two mtDNAs for recombination. To date, two different models have been proposed to explain mtDNA exchange: the ‘faithful nucleoid’ model maintains that mtDNA within a nucleoid is generally static and not readily exchanged between nucleoids [35, 42]. Alternatively, the ‘dynamic nucleoid’ model maintains that mtDNA nucleoids are subject to dynamic remodeling, allowing mtDNAs to exchange freely [43]. In this study, we present for the first time the dynamics of mtDNA nucleoids. We demonstrate that although nucleoids sharing relatively freely after complete fusion (Fig. 1; Fig. S1), an observation that is in agreement with previous studies [20, 35, 44], mtDNA nucleoids themselves exhibit little motility within mitochondria, and do not freely diffuse by ‘kiss-and-run’. This finding is consistent with the discovery that mtDNA nucleoids are tethered to the inner mitochondrial membrane by a series of DNA–protein and protein–protein interactions [45]. Such tethering provides the mechanism for the lack of genome exchange between heterologous nucleoids in the ‘faithful nucleoid’ model [35, 42].
Second, our results support a model of ‘initial metabolic complementation’ taking place before mtDNA transcription/translation-dependent functional complementation (Fig. 6). Our results showed that ‘initial metabolic complementation’ was still in effect at inhibited mtDNA replication, transcription, or translation (Fig. 4), suggesting that neither mtDNA nucleoids nor mtRNA sharing should be a factor for ‘initial metabolic complementation’. The ‘initial metabolic complementation’ should occur right after the two IMMs from donor and acceptor become electrically and luminally continuous. IMM-PAGFP (ABCB10-fused PAGFP) test showed that IMM integral protein exchange occurs during ‘kiss-and-run’. The duration of ‘kiss-and-run’ showing IMM-PAGFP exchange is longer than that showing matrix exchange (IMM 105 ± 42 s vs. matrix 45 ± 2 s) [12]. For the long duration of ‘kiss-and-run’ in Rho0 cells (Fig. 2g; Fig. S5), ‘kiss-and-run’ may contribute to ‘initial metabolic complementation’ by substantial inner membrane exchange. For example, when considering deleterious changes in mtDNA that occur in somatic tissues with age, our results would suggest that the small proportion of mitochondria that carry these dysfunctional mtDNAs would have their functions restored by fusion with normal mitochondria. Following ‘initial metabolic complementation,' there is a limited time for metabolic repair, and if this time is exceeded, the damaged mitochondrion would either undergo another ‘metabolic complementation’ fusion event or would otherwise be removed by autophagy. In this model, ‘initial metabolic complementation’ represents an important element of mitochondrial quality control. Finally, although the maintenance of autonomous mitochondria by fusion consumes cellular energy through GTPase activity, the preservation of these competent mitochondria offers some advantages, including sustaining a greater mobility that seems to be important for the next fusion event as well as a range of other cell functions. Therefore, ‘initial metabolic complementation’ enhances the number of metabolic units and the functional stability and plasticity of the mitochondrial pool, and together with mtDNA-dependent complementation provides a time-dependent means to optimize the use of the mitochondrial pool in a variety of cellular activities.
Fig. 6.

Model of mitochondrial fusion in the process of mitochondrial complementation
Electronic supplementary material
Below is the link to the electronic supplementary material.
Fig. S1 mtDNA nucleoids are shared after complete fusion but not ‘kiss-and-run’ in HeLa cells. a Tfam-DsRed co-localizes with anti-mtDNA fluorescence (Scale bar: 2 μm). b Quantitation of mtDNA nucleoid number after overexpressing Tfam-DsRed or mtDsRed in HeLa cells by Anti-DNA immunofluorescence (UT, Untreated). c Time course of mtDNA nucleoid movement during ‘kiss-and-run’ events after PAGFP photoactivation (Scale bar: 1 μm). The graph shows an increase of PAGFP FI in the acceptor mitochondrion (#1). d Time course of a typical mtDNA nucleoids sharing events in HeLa cells by mitochondrial complete fusion as determined by photoactivation (Scale bar: 1 μm). e The percentage of mtDNA nucleoid sharing events that occurred during ‘kiss-and-run’ events per 466.4 s imaging interval (n≥17). #, p < 0.01
Fig. S2 Acquisition of mtDNA nucleoids by mtDNA-less mitochondria by fusion events in Rho0 cells. a b The identification of Rho0 Hela cells. a The protein expression level of Tfam in WT and Rho cells. b Relative levels of Cox1 and Cox2 mtRNA in WT and Rho0 cells. c Time course of a typical mitochondrial fusion event in Rho0 cells (Scale bar: 1 μm). The graph shows an increase of PAGFP FI in the acceptor mitochondrion (#1). d e The heteroplasmic fusion between mtDNA-less and normal mitochondria by PEG-induced cell fusion. d Anti-DNA and anti-Tfam immunofluorescence of Rho0 and WT cells (Scale bar: 10 μm). e Anti-DNA and Anti-Tfam immunofluorescence of WT × Rho0 (mtDsRed) cell hybrids after PEG-mediated cell fusion for 7 h (Scale bar: 10 μm)
Fig. S3 OMM fusion frequency in Rho0 cells. a Labeling of a subpopulation of mitochondria by photoactivation of PAGFP in WT and Rho0 HeLa cells expressing both Omp25-PAGFP and mtDsRed (Scale bar: 10 μm). b OMM fusion was monitored by measuring the dilution of Omp25-PAGFP in subset for 200 s after photoactivation (n=5). c Comparison of OMM fusion events numbers in WT and Rho0 cells (n=5). #, p < 0.01
Fig. S4 Measurements of ΔΨm in WT and Rho0 HeLa cells and the generation of mouse Rho- cell lines by genetic approach. a Measurements of ΔΨm in WT and Rho0 by JC-1 staining (Scale bar: 10 μm). The ratio of red/green FI is used to measure ΔΨm. Rho0 cells had lower ratio, indicating lower ΔΨm than WT. b Measurements of ΔΨm in WT and Rho0 by TMRM staining (Scale bar: 10 μm). c Relative level of ND5 mtDNA in the days following infection with UL12.5-GFP. d Relative level of ND5 mtRNA in the days following infection with UL12.5-GFP. e Measurement of ΔΨm in MEF cells, Mfn1,2-/- MEF cells, and Opa1-/- MEF cells by TMRM staining (Scale bar: 10 μm)
Fig. S5 A single mtDNA-less mitochondrion gains a higher ΔΨm after fusing with a normal mitochondrion by ‘kiss-and-run’ (Scar bar 1 μm)
Fig. S6 Relative levels of Cox1/2 mtDNA in HeLa cells treated with 0.4 μg/mL EB for 48 h. #, p < 0.01
Fig. S7 Overexpression of Mfn1 or Mfn2 does affect neither mtDNA nor mtRNA levels. a Relative levels of ND2 and ND5 mtDNA in MEF cells after overexpression of Mfn1, Mfn2 or Mfn1/2 for 6 days. b Relative levels of ND2 and ND5 mtRNA in MEF cells after overexpression of Mfn1, Mfn2 or Mfn1/2 for 6 days
Acknowledgments
We thank Hongwen Pang for his technical advice and Prof. György Hajnóczky, Prof. Xiaodong Shu, Dr. Juan Du, and Dr. Shen Chen for their expert views on the manuscript. This work was financially supported by the ‘Strategic Priority Research Program’ of the Chinese Academy of Sciences (XDA01020108), the Ministry of Science and Technology 973 program (2013CB967403 and 2012CB721105), the Ministry of Science and Technology 863 Program (2012AA02A708), the National Natural Science Foundation projects of China (31271527), International Cooperation Project of Guangdong Science and Technology Program (2012B050300022), Guangzhou Science and Technology Program (2014Y2-00161), Guangdong Natural Science Foundation for Distinguished Young Scientists (S20120011368), and the “One hundred Talents” Project for Prof. Xingguo Liu from the Chinese Academy of Sciences.
Conflict of interest
The authors declare that they have no conflicts of interest.
Abbreviations
- Cap
Chloramphenicol
- DMEM
Dulbecco’s modified Eagle’s medium
- EB
Ethidium bromide
- FBS
Fetal bovine serum
- FI
Fluorescence intensity
- IMM
Inner mitochondrial membrane
- KFP
Kindling fluorescent protein
- MEF
Mouse embryonic fibroblast
- mt
Mitochondrial
- mtFP
Mitochondrial matrix-targeting fluorescent protein
- mtDNAs
Mitochondrial DNAs
- OMM
Outer mitochondrial membrane
- PAGFP
Photoactivatable green fluorescent protein
- PBS
Phosphate-buffered saline
- PEG
Polyethylene glycol
- Q-PCR
Quantitative polymerase chain reaction. Rho0 cells: cells lacking mtDNA
- Tfam
Mitochondrial transcription factor A
- TMRM
Tetramethylrhodamine methyl ester
- VK3
Vitamin K3
- WT
Wild type
- ΔΨm
Mitochondrial membrane potential
References
- 1.Wallace DC. Mitochondrial diseases in man and mouse. Science. 1999;283:1482–1488. doi: 10.1126/science.283.5407.1482. [DOI] [PubMed] [Google Scholar]
- 2.Greaves LC, Reeve AK, Taylor RW, Turnbull DM. Mitochondrial DNA and disease. J Pathol. 2012;226:274–286. doi: 10.1002/path.3028. [DOI] [PubMed] [Google Scholar]
- 3.Schapira AH. Mitochondrial diseases. Lancet. 2012;379:1825–1834. doi: 10.1016/S0140-6736(11)61305-6. [DOI] [PubMed] [Google Scholar]
- 4.Leonard JV, Schapira AH. Mitochondrial respiratory chain disorders I: mitochondrial DNA defects. Lancet. 2000;355:299–304. doi: 10.1016/S0140-6736(99)05225-3. [DOI] [PubMed] [Google Scholar]
- 5.Lightowlers RN, Chinnery PF, Turnbull DM, Howell N. Mammalian mitochondrial genetics: heredity, heteroplasmy and disease. Trends Genet. 1997;13:450–455. doi: 10.1016/S0168-9525(97)01266-3. [DOI] [PubMed] [Google Scholar]
- 6.Rossignol R, Faustin B, Rocher C, Malgat M, Mazat JP, Letellier T. Mitochondrial threshold effects. Biochem J. 2003;370:751–762. doi: 10.1042/BJ20021594. [DOI] [PMC free article] [PubMed] [Google Scholar]
- 7.Chomyn A. The myoclonic epilepsy and ragged-red fiber mutation provides new insights into human mitochondrial function and genetics. Am J Hum Genet. 1998;62:745–751. doi: 10.1086/301813. [DOI] [PMC free article] [PubMed] [Google Scholar]
- 8.Nakada K, Inoue K, Ono T, Isobe K, Ogura A, Goto YI, Nonaka I, Hayashi JI. Inter-mitochondrial complementation: mitochondria-specific system preventing mice from expression of disease phenotypes by mutant mtDNA. Nat Med. 2001;7:934–940. doi: 10.1038/90976. [DOI] [PubMed] [Google Scholar]
- 9.Patterson GH, Lippincott-Schwartz J. A photoactivatable GFP for selective photolabeling of proteins and cells. Science. 2002;297:1873–1877. doi: 10.1126/science.1074952. [DOI] [PubMed] [Google Scholar]
- 10.Ando R, Hama H, Yamamoto-Hino M, Mizuno H, Miyawaki A. An optical marker based on the UV-induced green-to-red photoconversion of a fluorescent protein. Proc Natl Acad Sci USA. 2002;99:12651–12656. doi: 10.1073/pnas.202320599. [DOI] [PMC free article] [PubMed] [Google Scholar]
- 11.Chudakov DM, Belousov VV, Zaraisky AG, Novoselov VV, Staroverov DB, Zorov DB, Lukyanov S, Lukyanov KA. Kindling fluorescent proteins for precise in vivo photolabeling. Nat Biotechnol. 2003;21:191–194. doi: 10.1038/nbt778. [DOI] [PubMed] [Google Scholar]
- 12.Liu X, Weaver D, Shirihai O, Hajnoczky G. Mitochondrial ‘kiss-and-run’: interplay between mitochondrial motility and fusion-fission dynamics. EMBO J. 2009;28:3074–3089. doi: 10.1038/emboj.2009.255. [DOI] [PMC free article] [PubMed] [Google Scholar]
- 13.Chan DC. Mitochondria: dynamic organelles in disease, aging, and development. Cell. 2006;125:1241–1252. doi: 10.1016/j.cell.2006.06.010. [DOI] [PubMed] [Google Scholar]
- 14.McBride HM, Neuspiel M, Wasiak S. Mitochondria: more than just a powerhouse. Curr Biol. 2006;16:R551–R560. doi: 10.1016/j.cub.2006.06.054. [DOI] [PubMed] [Google Scholar]
- 15.Tatsuta T, Langer T. Quality control of mitochondria: protection against neurodegeneration and ageing. EMBO J. 2008;27:306–314. doi: 10.1038/sj.emboj.7601972. [DOI] [PMC free article] [PubMed] [Google Scholar]
- 16.Liu X, Hajnoczky G. Altered fusion dynamics underlie unique morphological changes in mitochondria during hypoxia-reoxygenation stress. Cell Death Differ. 2011;18:1561–1572. doi: 10.1038/cdd.2011.13. [DOI] [PMC free article] [PubMed] [Google Scholar]
- 17.Suen DF, Norris KL, Youle RJ. Mitochondrial dynamics and apoptosis. Genes Dev. 2008;22:1577–1590. doi: 10.1101/gad.1658508. [DOI] [PMC free article] [PubMed] [Google Scholar]
- 18.Twig G, Liu X, Liesa M, Wikstrom JD, Molina AJ, Las G, Yaniv G, Hajnoczky G, Shirihai OS. Biophysical properties of mitochondrial fusion events in pancreatic beta-cells and cardiac cells unravel potential control mechanisms of its selectivity. Am J Physiol Cell Physiol. 2010;299:C477–C487. doi: 10.1152/ajpcell.00427.2009. [DOI] [PMC free article] [PubMed] [Google Scholar]
- 19.Twig G, Elorza A, Molina AJ, Mohamed H, Wikstrom JD, Walzer G, Stiles L, Haigh SE, Katz S, Las G, Alroy J, Wu M, Py BF, Yuan J, Deeney JT, Corkey BE, Shirihai OS. Fission and selective fusion govern mitochondrial segregation and elimination by autophagy. EMBO J. 2008;27:433–446. doi: 10.1038/sj.emboj.7601963. [DOI] [PMC free article] [PubMed] [Google Scholar]
- 20.Legros F, Malka F, Frachon P, Lombes A, Rojo M. Organization and dynamics of human mitochondrial DNA. J Cell Sci. 2004;117:2653–2662. doi: 10.1242/jcs.01134. [DOI] [PubMed] [Google Scholar]
- 21.Chen H, Chomyn A, Chan DC. Disruption of fusion results in mitochondrial heterogeneity and dysfunction. J Biol Chem. 2005;280:26185–26192. doi: 10.1074/jbc.M503062200. [DOI] [PubMed] [Google Scholar]
- 22.Chen H, Vermulst M, Wang YE, Chomyn A, Prolla TA, McCaffery JM, Chan DC. Mitochondrial fusion is required for mtDNA stability in skeletal muscle and tolerance of mtDNA mutations. Cell. 2010;141:280–289. doi: 10.1016/j.cell.2010.02.026. [DOI] [PMC free article] [PubMed] [Google Scholar]
- 23.Nakada K, Sato A, Hayashi J. Mitochondrial functional complementation in mitochondrial DNA-based diseases. Int J Biochem Cell Biol. 2009;41:1907–1913. doi: 10.1016/j.biocel.2009.05.010. [DOI] [PubMed] [Google Scholar]
- 24.Enriquez JA, Cabezas-Herrera J, Bayona-Bafaluy MP, Attardi G. Very rare complementation between mitochondria carrying different mitochondrial DNA mutations points to intrinsic genetic autonomy of the organelles in cultured human cells. J Biol Chem. 2000;275:11207–11215. doi: 10.1074/jbc.275.15.11207. [DOI] [PubMed] [Google Scholar]
- 25.Yoneda M, Miyatake T, Attardi G. Complementation of mutant and wild-type human mitochondrial DNAs coexisting since the mutation event and lack of complementation of DNAs introduced separately into a cell within distinct organelles. Mol Cell Biol. 1994;14:2699–2712. doi: 10.1128/MCB.14.4.2699. [DOI] [PMC free article] [PubMed] [Google Scholar]
- 26.Ono T, Isobe K, Nakada K, Hayashi JI. Human cells are protected from mitochondrial dysfunction by complementation of DNA products in fused mitochondria. Nat Genet. 2001;28:272–275. doi: 10.1038/90116. [DOI] [PubMed] [Google Scholar]
- 27.Song Z, Ghochani M, McCaffery JM, Frey TG, Chan DC. Mitofusins and OPA1 mediate sequential steps in mitochondrial membrane fusion. Mol Biol Cell. 2009;20:3525–3532. doi: 10.1091/mbc.E09-03-0252. [DOI] [PMC free article] [PubMed] [Google Scholar]
- 28.Tondera D, Grandemange S, Jourdain A, Karbowski M, Mattenberger Y, Herzig S, Da Cruz S, Clerc P, Raschke I, Merkwirth C, Ehses S, Krause F, Chan DC, Alexander C, Bauer C, Youle R, Langer T, Martinou JC. SLP-2 is required for stress-induced mitochondrial hyperfusion. EMBO J. 2009;28:1589–1600. doi: 10.1038/emboj.2009.89. [DOI] [PMC free article] [PubMed] [Google Scholar]
- 29.Legros F, Lombes A, Frachon P, Rojo M. Mitochondrial fusion in human cells is efficient, requires the inner membrane potential, and is mediated by mitofusins. Mol Biol Cell. 2002;13:4343–4354. doi: 10.1091/mbc.E02-06-0330. [DOI] [PMC free article] [PubMed] [Google Scholar]
- 30.Baricault L, Segui B, Guegand L, Olichon A, Valette A, Larminat F, Lenaers G. OPA1 cleavage depends on decreased mitochondrial ATP level and bivalent metals. Exp Cell Res. 2007;313:3800–3808. doi: 10.1016/j.yexcr.2007.08.008. [DOI] [PubMed] [Google Scholar]
- 31.Ishihara N, Fujita Y, Oka T, Mihara K. Regulation of mitochondrial morphology through proteolytic cleavage of OPA1. EMBO J. 2006;25:2966–2977. doi: 10.1038/sj.emboj.7601184. [DOI] [PMC free article] [PubMed] [Google Scholar]
- 32.Duvezin-Caubet S, Jagasia R, Wagener J, Hofmann S, Trifunovic A, Hansson A, Chomyn A, Bauer MF, Attardi G, Larsson NG, Neupert W, Reichert AS. Proteolytic processing of OPA1 links mitochondrial dysfunction to alterations in mitochondrial morphology. J Biol Chem. 2006;281:37972–37979. doi: 10.1074/jbc.M606059200. [DOI] [PubMed] [Google Scholar]
- 33.Song Z, Chen H, Fiket M, Alexander C, Chan DC. OPA1 processing controls mitochondrial fusion and is regulated by mRNA splicing, membrane potential, and Yme1L. J Cell Biol. 2007;178:749–755. doi: 10.1083/jcb.200704110. [DOI] [PMC free article] [PubMed] [Google Scholar]
- 34.Delettre C, Griffoin JM, Kaplan J, Dollfus H, Lorenz B, Faivre L, Lenaers G, Belenguer P, Hamel CP. Mutation spectrum and splicing variants in the OPA1 gene. Hum Genet. 2001;109:584–591. doi: 10.1007/s00439-001-0633-y. [DOI] [PubMed] [Google Scholar]
- 35.Gilkerson RW, Schon EA, Hernandez E, Davidson MM. Mitochondrial nucleoids maintain genetic autonomy but allow for functional complementation. J Cell Biol. 2008;181:1117–1128. doi: 10.1083/jcb.200712101. [DOI] [PMC free article] [PubMed] [Google Scholar]
- 36.Corcoran JA, Saffran HA, Duguay BA, Smiley JR. Herpes simplex virus UL12.5 targets mitochondria through a mitochondrial localization sequence proximal to the N terminus. J Virol. 2009;83:2601–2610. doi: 10.1128/JVI.02087-08. [DOI] [PMC free article] [PubMed] [Google Scholar]
- 37.Li Z, Okamoto K, Hayashi Y, Sheng M. The importance of dendritic mitochondria in the morphogenesis and plasticity of spines and synapses. Cell. 2004;119:873–887. doi: 10.1016/j.cell.2004.11.003. [DOI] [PubMed] [Google Scholar]
- 38.Yi M, Weaver D, Hajnoczky G. Control of mitochondrial motility and distribution by the calcium signal: a homeostatic circuit. J Cell Biol. 2004;167:661–672. doi: 10.1083/jcb.200406038. [DOI] [PMC free article] [PubMed] [Google Scholar]
- 39.Chen H, Detmer SA, Ewald AJ, Griffin EE, Fraser SE, Chan DC. Mitofusins Mfn1 and Mfn2 coordinately regulate mitochondrial fusion and are essential for embryonic development. J Cell Biol. 2003;160:189–200. doi: 10.1083/jcb.200211046. [DOI] [PMC free article] [PubMed] [Google Scholar]
- 40.Santel A, Frank S, Gaume B, Herrler M, Youle RJ, Fuller MT. Mitofusin-1 protein is a generally expressed mediator of mitochondrial fusion in mammalian cells. J Cell Sci. 2003;116:2763–2774. doi: 10.1242/jcs.00479. [DOI] [PubMed] [Google Scholar]
- 41.Wang D, Wang J, Bonamy GM, Meeusen S, Brusch RG, Turk C, Yang P, Schultz PG. A small molecule promotes mitochondrial fusion in mammalian cells. Angew Chem Int Ed Engl. 2012;51:9302–9305. doi: 10.1002/anie.201204589. [DOI] [PubMed] [Google Scholar]
- 42.Jacobs HT, Lehtinen SK, Spelbrink JN. No sex please, we’re mitochondria: a hypothesis on the somatic unit of inheritance of mammalian mtDNA. BioEssays. 2000;22:564–572. doi: 10.1002/(SICI)1521-1878(200006)22:6<564::AID-BIES9>3.0.CO;2-4. [DOI] [PubMed] [Google Scholar]
- 43.D’Aurelio M, Gajewski CD, Lin MT, Mauck WM, Shao LZ, Lenaz G, Moraes CT, Manfredi G. Heterologous mitochondrial DNA recombination in human cells. Hum Mol Genet. 2004;13:3171–3179. doi: 10.1093/hmg/ddh326. [DOI] [PubMed] [Google Scholar]
- 44.Okamoto K, Perlman PS, Butow RA. The sorting of mitochondrial DNA and mitochondrial proteins in zygotes: preferential transmission of mitochondrial DNA to the medial bud. J Cell Biol. 1998;142:613–623. doi: 10.1083/jcb.142.3.613. [DOI] [PMC free article] [PubMed] [Google Scholar]
- 45.He J, Cooper HM, Reyes A, Di Re M, Sembongi H, Litwin TR, Gao J, Neuman KC, Fearnley IM, Spinazzola A, Walker JE, Holt IJ. Mitochondrial nucleoid interacting proteins support mitochondrial protein synthesis. Nucleic Acids Res. 2012;40:6109–6121. doi: 10.1093/nar/gks266. [DOI] [PMC free article] [PubMed] [Google Scholar]
Associated Data
This section collects any data citations, data availability statements, or supplementary materials included in this article.