

Abstract
Astrocytes interact with neurons and endothelial cells and may mediate exchange of metabolites between capillaries and nerve terminals. In the present study, we investigated intracellular glucose diffusion in purified astrocytes after local glucose uptake. We used a fluorescence resonance energy transfer (FRET)-based nano sensor to monitor the time dependence of the intracellular glucose concentration at specific positions within the cell. We observed a delay in onset and kinetics in regions away from the glucose uptake compared with the region where we locally super-fused astrocytes with the d-glucose-rich solution. We propose a mathematical model of glucose diffusion in astrocytes. The analysis showed that after gradual uptake of glucose, the locally increased intracellular glucose concentration is rapidly spread throughout the cytosol with an apparent diffusion coefficient (D app) of (2.38 ± 0.41) × 10−10 m2 s−1 (at 22–24 °C). Considering that the diffusion coefficient of d-glucose in water is D = 6.7 × 10⁻¹⁰ m2 s−1 (at 24 °C), D app determined in astrocytes indicates that the cytosolic tortuosity, which hinders glucose molecules, is approximately three times higher than in aqueous solution. We conclude that the value of D app for glucose measured in purified rat astrocytes is consistent with the view that cytosolic diffusion may allow glucose and glucose metabolites to traverse from the endothelial cells at the blood–brain barrier to neurons and neighboring astrocytes.
Keywords: Glucose, Diffusion, Astrocytes
Introduction
Astrocytes interact with neurons and endothelial cells of blood capillaries in a complex manner [1]. Astrocytic endfeet have rosette-like structures lying on the vessel wall [2], which connect astrocytes with neuronal terminals [3]. Astrocytes engulf synapses and sense the activity of the brain [2] by neurotransmitter receptors [4] and likely act as integrators at different temporal and spatial domains [5, 6].
Discontinuities of the astrocyte endfeet on the vessel wall may allow indirect communication between nerve terminals and capillaries [7]. On the other hand, astrocytes may mediate exchange of metabolites between capillaries and nerve terminals [2, 7], possibly by allowing glucose to traverse the astrocytes and transporting it to the interstitium [8], because glucose is considered to be the main support for mammalian brain energy metabolism [9]. In the present study, we investigated intracellular glucose diffusion in purified astrocytes after local glucose uptake.
The glucose transporter family (GLUT) mediates a bidirectional process of glucose transport in most tissues and cells [10]. GLUT1 was found in the brain in two molecular mass forms. The 55-kDa form of GLUT1 is located in endothelial cells that form the blood–brain barrier. Glucose may enter neurons transcellularly through astrocytes via the 45-kDa form of GLUT1 or directly via GLUT3, a neuronal glucose transporter [11]. The 45-kDa form of GLUT1 is not only located in astrocytic endfeet around blood vessels [12] but also in astrocytic cell bodies and processes [13]. Both GLUT1 and GLUT3 transport glucose with relatively high affinity (Km: 1.4 and 3 mM, respectively) [10]. The GLUT2 glucose transporter has also been found in astrocytes [13–15].
Shortly after glucose entry, a large portion of glucose is phosphorylated. In neurons and astrocytes, phosphorylation is mainly catalyzed by type I hexokinase [16, 17], which is ubiquitous in the brain [18]. In astrocytes, most of the type I hexokinase is associated with mitochondria [19], and the activity of hexokinase bound to mitochondria is greater than the activity of cytosolic hexokinase [20]. After glucose phosphorylation, glucose 6-phosphate is the intermediate for either glycolysis, the pentose phosphate pathway, or the generation of glycogen. The amount of glucose metabolized in the pentose phosphate pathway is less than one-tenth that of glycolysis in cultured astrocytes [21, 22], where lactate is the major metabolic product [23]. It has been suggested that astrocytes play the primary role in cerebral glucose utilization by metabolizing glucose to lactate, which is subsequently transported to neurons to fuel neuronal energetics, i.e., by the astrocyte–neuron lactate shuttle [24].
In the brain, glycogen resides predominantly in astrocytes [25, 26], where it plays a role in normal brain metabolism [27, 28]. The glycogen shunt represents the fraction of metabolized glucose that passes through glycogen molecules prior to entering the glycolytic pathway, and may be as large as 40 % of overall glucose metabolism [28]. In hypoxic conditions, which are usually associated with reduced blood flow and limited glucose supply to astrocytes, glucose 1-phosphate is generated by glycogenolysis [29–31]. In the brain, Locus coeruleus represents an important source of noradrenergic neurons innervating the cerebral cortex [32]. Our recent study showed that the availability of the intracellular glucose in astrocytes increased after noradrenaline stimulation, which points to the stimulated glycogenolysis. Noradrenalin-stimulated glucose increase was attenuated by an inhibitor of glycogen phosphorylase a [33].
The colocalization of enzymes involved in gluconeogenesis, such as pyruvate carboxylase, phosphoenolpyruvate carboxykinase, and fructose 1,6-bisphosphatase indicates that astrocytes may resynthesize glucose from lactate or amino acids [23]. Although glucose 6-phosphatase has been shown to be present in astroglial cells [34], the role of astrocytes as glucose-releasing cells has to be further investigated [35, 36].
To measure dynamic glucose distribution in astrocytes, we used fluorescence resonance energy transfer (FRET)-based nanosensors [37]. We used FLII12PGLU-700μ∆6, a second-generation nanosensor [38], to measure local changes in glucose concentration after focally superfusing cells with a d-glucose-rich solution. We developed a mathematical model of glucose diffusion in the cytoplasm after gradual glucose uptake. Our results show that a locally increased intracellular glucose concentration is rapidly spread throughout the cytosol in astrocytes with an apparent diffusion coefficient, D app, of 2.38 ± 0.41 × 10⁻¹⁰ m2 s−1, which indicates that the cytosolic tortuosity, which hinders the glucose molecules, is approximately three times larger than that in aqueous solution.
Materials and methods
Cell culture and plasmid transfection
Cultures were prepared from the cortex of 2-day-old rats as described previously [39]. Cells were grown in high d-glucose Dulbecco’s Eagle’s medium containing 10 % fetal bovine serum, 1 mM pyruvate, 2 mM glutamine, and 25 μg/ml penicillin/streptomycin in 95 % air/5 % CO2. Confluent cultures were shaken at 225 rpm overnight, and the medium was changed the next morning. This process was repeated three times. After the third shaking, the cells were trypsinized and put into tissue culture flat tubes with a growth area of 10 cm2. After reaching confluence again, the cells were subcultured onto 22-mm-diameter coverslips coated with poly-l-lysine. After a minimum of 1 day and a maximum of 3 days, the cells were transfected using Fugene 6 transfection reagent (Roche, Mannheim, Germany) or Lipofectamine (Invitrogen, Carlsbad, CA, USA). For lipofection, we used the plasmid FLII12PGLU-700μ∆6 (Addgene 17866) [38], which was extracted from Escherichia coli DH5α and purified using a commercially available protocol, the PureYield plasmid miniprep system (Promega). The concentration of plasmid was measured with a spectrophotometer (Ultrospec 1100, GE Healthcare LifeSciences) and kept in deionized water at −20 °C until transfection. For transfection, we used 1 μg of plasmid DNA. Lipofection medium contained no serum or antibiotics. Ultroser G 3 % (Pall BioSepra, Cergy-Saint-Christophe, France) was added to the lipofection medium at least 3 h after transfecting the cells. Before imaging, cells were incubated in a humidified atmosphere at 37 °C and 5 % CO2 for 24–50 h. Typically, 5–15 cells per coverslip were successfully transfected.
Imaging and data analysis
Imaging was performed 24–50 h after transfection. Coverslips with transfected astrocytes were mounted in a superfusion recording chamber on the microscope stage. Approximately 5–10 min before the beginning of the experiments, 300 μl of the d-glucose-free extracellular solution was applied to the cells. The d-glucose-free extracellular solution contained: NaCl 131.8 mM, KCl 5 mM, HEPES [N-2-hydroxyethylpiperazin-N-2-ethanesulfonic acid] 10 mM, MgCl2 2 mM (Kemika, Zagreb, Croatia), CaCl2 (Riedel-De-Haen AG, Seelze, Hannover, Germany) 1.8 mM, NaH2PO4 0.5 mM, NaHCO3 5 mM; pH adjusted to 7.2 with NaOH [40]. All salts were of the highest purity available. All chemicals were from Sigma Aldrich (St. Louis, MO, USA) unless otherwise stated. The osmolarity of extracellular solution was 295–305 mOsm, measured with freezing point depression (Osmomat 030, Gonotech GmbH, Germany).
The superfusion flow rate of d-glucose-free extracellular solution was set to 4–10 ml/min (Perfusion Valve Controller, Model VC-8, Warner Instruments, Hamden, CT, USA). Imaging was performed on a fluorescence microscope (Zeiss Axiovert 135 (Zeiss, Oberkochen, Germany) equipped with a water-immersion objective (C-Apochromat 63x/1.2 NA), and with a CCD camera and a monochromator (Polychrome IV, Till Photonics, Graefelfing, Germany) for a monochromatic source of light with a wavelength of 436 nm/10 nm. Dual-emission intensity ratios were recorded using an image splitter (Optical Insights, Tucson, AZ, USA) and two emission filters [465/30 nm for cyan fluorescent protein (CFP) and 535/30 nm for yellow fluorescent protein (YFP)]. For imaging, cells with no contact with neighboring cells were selected. All measurements were obtained in astrocyte somata. Images were acquired at intervals of 1 s. Exposure time was 0.7 s. Imaging was performed at room temperature (22–24 °C). Only one cell was recorded in each experiment.
To locally superfuse a region of a cell, Transjector 4657 with a micromanipulator (Eppendorf, Hamburg, Germany) was used. A continuous pressure (1 hPa) was applied to eject the pipette solution. Glass pipettes were prepared with a horizontal puller (P-87, Sutter Instruments, Novato, CA). d-Glucose was added to extracellular solution to achieve a concentration of 10 mM for the glucose-containing pipette solution.
To calculate the cytosolic glucose concentration [glc]i we measured the change in the YFP/CFP FRET ratio (∆R). The CFP/YFP FRET ratio was obtained by integration of the ratio over all the cells using Till Vision software (Till Photonics, Graefelfing, Germany).The [glc]i was calculated as reported previously [33]. The difference between the average FRET ratio during superfusion with an increasing extracellular d-glucose concentration and superfusion with a solution devoid of d-glucose was measured. The curve fitted to the data was of the form:  , where ∆R represents the change in the YFP/CFP FRET ratio, [glc]e is the extracellular glucose concentration, and
  . The glucose sensor was calibrated by using cell permeabilization with β-escin (50 μM for 30 s) [41] as reported previously [33]. The binding constant K
d obtained from the fitted curve was 0.422 mM, which is equal to recently published K
d values for FLII12PGLU-600μ∆6 obtained in astrocytes [42], but lower than the K
d of FLII12PGLU-700μ∆6 determined in isolated protein (0.66 mM) [38]. The internal glucose concentration was calculated using normalized ratio changes (saturation,
. The glucose sensor was calibrated by using cell permeabilization with β-escin (50 μM for 30 s) [41] as reported previously [33]. The binding constant K
d obtained from the fitted curve was 0.422 mM, which is equal to recently published K
d values for FLII12PGLU-600μ∆6 obtained in astrocytes [42], but lower than the K
d of FLII12PGLU-700μ∆6 determined in isolated protein (0.66 mM) [38]. The internal glucose concentration was calculated using normalized ratio changes (saturation,  );
);  .
.
Data analysis was performed using custom code in C and Python, Matlab, GNU Octave and MS Excel software. Figures were assembled for display using Adobe Photoshop and Systat Sigma Plot software. Data are expressed as the arithmetic mean ± standard error of the mean (SEM). The normality of the data distribution was tested using the Shapiro–Wilk test. Student’s paired or unpaired two-tailed t test was used to compare two samples, and Friedman repeated measures analysis of variance on ranks followed by the Tukey test was used to compare paired multiple repeated measurements. We proposed a mathematical model to describe the diffusion of d-glucose in the cytosol of astrocytes. A global fitting of the analytical model functions to the experimentally determined data (time dependence of [glc]i measured at three distinct places within the cell) was based on a Levenberg–Marquardt non-linear least-squares algorithm.
Results
Local astrocyte superfusion with d-glucose-rich solution results in increased intracellular glucose concentration
We transfected purified cortical astrocytes with the plasmid FLII12PGLU-700μ∆6 to express the FRET glucose nanosensor. Using a CCD camera in combination with an image splitter, we simultaneously recorded images of CFP and YFP emission. Purified astrocytes, plated on a coverglass surface were bathed in glucose-free extracellular solution, which was superfused by a gravity-driven superfusion system. A glass micropipette was used to locally superfuse a narrow region of a cell with a solution containing 10 mM d-glucose. Using a micromanipulator, the cell was intermittently approached by a narrow glass micropipette (Fig. 1a). To evaluate the stability and width of the stream of d-glucose-rich solution ejected from the pipette, we used extracellular solution containing fluorescein (Fig. 1b). The laminar flow of the d-glucose-rich solution was 6 μm wide.
Fig. 1.
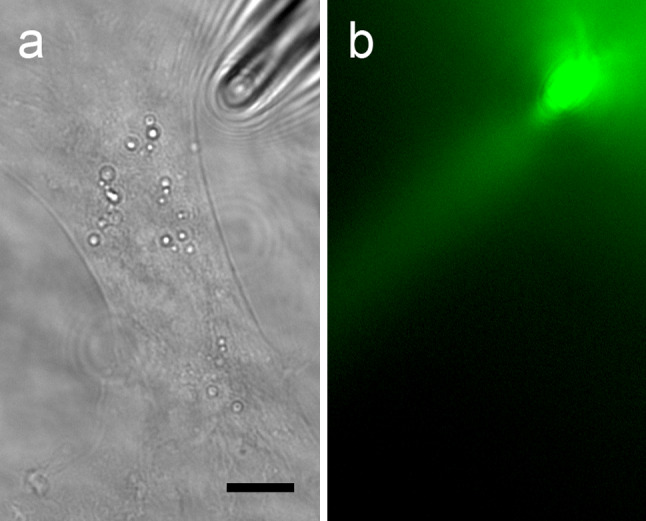
A glass micropipette was used to locally superfuse a narrow region of a cultured astrocyte. a A cortical astrocyte, plated on a glass coverslip, was approached by a narrow glass micropipette (shadow on the right upper corner). Scale bar: 5 μm. b Extracellular solution containing fluorescein was continuously ejected from the pipette into the gravity-driven superfusion chamber to visualize the geometry of the solution jet ejected from the tip of the glass pipette. Superfusion flow rates were set to 4–10 ml/min. The width of the pipette jet was around 6 μm
After local superfusion of cells with the extracellular medium containing 10 mM d-glucose, the fluorescence intensity of the CFP nanosensor decreased, and the fluorescence intensity of YFP increased, which manifested as a change in pseudocolor on the FRET ratio images of CFP and YFP emission (Fig. 2a). Red indicates a high ratio and blue indicates a low ratio of YFP/CFP emission. The FRET fluorescence was acquired at a frequency of 1 Hz. Note that after 8, 15, and 30 s after start of the local superfusion with glucose, a gradual increase in the FRET ratio is recorded (Fig. 2a), which indicates an increase in the cytosolic glucose concentration. We averaged the signal from three regions of interest (ROI) (diameter 6 μm), separated from the micropipette by 10.8 ± 0.6 μm and 18.0 ± 0.9 μm. The removal of the pipette with glucose-rich solution resulted in a decrease in the FRET ratio, indicating decrease of glucose level within 20 s (Fig. 2b).
Fig. 2.

Changes in the FLII12PGLU-700μ∆6 FRET ratio in cultured astrocytes after local superfusion of solution containing d-glucose. a Pseudocolored FRET ratio images of CFP and YFP emission in astrocytes expressing the FLII12PGLU-700μ∆6 fluorescent nanosensor. Red indicates a high ratio and blue indicates a low ratio of YFP/CFP emission. The first panel (0 s) shows the astrocyte in the medium without d-glucose (0 mM), the second (8 s), third (15 s), and fourth (30 s) panels show the same cell after locally superfusing the cell with the pipette medium (white arrow) containing 10 mMd-glucose. Integration of the ratio over the three ROIs (marked A, B, C in the first panel) was used to quantify the time-dependent changes in the FRET ratio. Scale bar: 5 μm. b Superfusion with the medium containing 10 mMd-glucose (grey bar) resulted in a time-dependent increase in the YFP/CFP ratio measured in ROI A. Following addition, external d-glucose was removed by removing the superfusion pipette containing the d-glucose solution and the medium in the bath was washed by continuous chamber superfusion. The subsequent decrease in the ratio indicates consumption of intracellular d-glucose after the removal from the bath. The red dotted line represents the curve fitted with the exponential regression algorithm:  where a = 0.45 ± 0.01 and a = 10.27 ± 0.20 s. In addition, the rise and fall times were quantified as the time between 20 and 80 % of the maximal amplitude (ΔRampl.). Black vertical ticks mark the time of the image sample shown in panel a
We measured the rise time of the FRET ratio as the time when the ratio changed from 20 to 80 % of the maximal value (Fig. 2b). Similarly, we measured the fall time as the time when the ratio decreased from 80 to 20 % of the maximal value. We also fitted the exponential regression algorithm to the change in FRET ratio after local d-glucose superfusion in all three ROIs in each experiment. Changes in the FRET ratio in ROIs away from the position of the pipette for d-glucose superfusion display delayed kinetics. In Fig. 3, in which we show superimposed traces of the change in the FRET ratio in three different ROIs, we observe a delay in onset and kinetics in regions away from the pipette (B and C) compared with the region at the pipette (A).
Fig. 3.

Time-dependent changes in the FRET ratio in ROIs away from the d-glucose superfusion position display delayed kinetics. Astrocyte bathed in glucose-free medium was superfused locally at ROI A for 100 s with d-glucose (10 mM, grey bar). The change in the FRET ratio was recorded at the ROI, which coincided with the position of local superfusion and two distant ROIs (B and C; 9 and 17 μm from the local superfusion, respectively). The amplitude of the changes in the FRET ratios was normalized to the amplitude of change in region A (left panel) to better observe the delay in the onset and the kinetics of the change in the FRET ratio in ROI B (green line) and ROI C (red line), respectively
This observation was confirmed by the measurements of the rise time as the FRET ratio changed between 20 and 80 % of the maximal amplitude (Fig. 4). The increase in FRET ratio in ROIs away from the d-glucose superfusion position (B 15.12 ± 1.38 s, C 15.92 ± 1.47 s) is significantly slower compared with the increase in ROI (A 13.49 ± 1.47 s) (Friedman repeated-measures analysis of variance on ranks followed by the Tukey test, p < 0.001, n = 42). The mean values of the fall time measurements after cessation of local d-glucose superfusion were not significantly different in the three ROIs (A 9.92 ± 1.82 s, B 9.97 ± 0.7 s, C 9.92 ± 0.85 s). The amplitudes of the change in the FRET ratio were not different in ROIs B (0.41 ± 0.04) and C (0.38 ± 0.05) compared with ROI A (0.38 ± 0.04).
Fig. 4.

Time-dependent increase in the FRET ratio in ROIs away from the position of d-glucose superfusion (ROIs B and C) is longer in comparison with the increase in ROI A. Black bars show the average rise times and the empty bars show the average fall times (both measured as the time of the ratio changes between 20 and 80 % of the maximal amplitude) after the onset and the cessation of d-glucose superfusion with the pipette, respectively. Rise times measurements at d-glucose increase in ROI B and ROI C were significantly longer compared with ROI A (Friedman repeated measures analysis of variance on ranks followed by the Tukey test, p < 0.001, n = 42). The mean values of the fall time measurements after cessation of local d-glucose superfusion were not significantly different in the three ROIs studied
Similarly, the time constant of the exponential rise of the FRET ratio after local d-glucose superfusion (Fig. 5) is larger when measured at ROI B (11.92 ± 1.46 s) and ROI C (12.75 ± 1.44 s) compared with the time constant measured at the region at the pipette for local superfusion (ROI A, (10.09 ± 1.56 s); Friedman repeated measures analysis of variance on ranks followed by the Tukey test, p < 0.001, n = 41 cells tested). The amplitudes of the fitted exponential curves were similar for ROI A, ROI B, and ROI C at 0.42 ± 0.05, 0.47 ± 0.06, and 0.40 ± 0.06 s, respectively; ROI C was not significantly different from ROI A, p = 0.67; and ROI B was higher compared with ROI A, p = 0.03 (Student’s t test for paired data).
Fig. 5.

Time constant for the exponential rise in the FRET ratio after local d-glucose superfusion is larger when measured at ROI B and ROI C compared with the increase in the FRET ratio measured at the region of local superfusion (ROI A). The time constants were significantly larger at ROI B a = 11.37 ± 1.46 s and ROI C a = 12.75 ± 1.44 s compared with the time constants measured at ROI A (a = 10.09 ± 1.56 s). (Friedman repeated measures analysis of variance on ranks followed by the Tukey’s test, p < 0.001), n = 41 cells tested)
Modeling of the diffusion kinetics
We developed a mathematical model to estimate the apparent diffusion coefficient of glucose in purified astrocytes. The model was based on measurements of the kinetics of the change in FRET ratio after local superfusion of d-glucose-rich solution.
We first calculated relative change in the glucose concentration in astrocytes using the change in the FRET YFP/CFP ratio. The FRET ratio (R) increased after locally increasing the external d-glucose concentration. Bleaching the fluorescent probes resulted in a decrease in the ratio R. This was corrected by subtracting the baseline signal (signal recorded before and after superfusion of the cell and fitted with a three-term second-order polynomial equation) from the recorded signal (R) after the exposure of the astrocyte cell to a d-glucose-rich medium. The internal glucose concentration, [glc]i, was calculated using normalized changes in the YFP/CFP ratio, ∆R [33] according to the expression:  . For the calculation, a maximal change in the FRET ratio was used
  , which is the saturation level for the nanosensor [33]. The binding constant K
d for FLII12PGLU-700μ∆6 was Kd = 422 ± 63 μM determined by fitting the above equation to the YFP/CFP ratio increase as a function of the external glucose concentration in β-escin-permeabilized cells [33].
, which is the saturation level for the nanosensor [33]. The binding constant K
d for FLII12PGLU-700μ∆6 was Kd = 422 ± 63 μM determined by fitting the above equation to the YFP/CFP ratio increase as a function of the external glucose concentration in β-escin-permeabilized cells [33].
To analyze the time-dependent changes in glucose concentration at three different ROIs, we applied the following diffusion model. First, due to the flat geometry of a single astrocyte, we assumed a one-dimensional geometry of glucose propagation. Second, since the distances from the point of glucose input at which the FRET ratio signals were recorded in order to monitor glucose propagation within the cell were small compared with the length of the cell, the propagation distance of d-glucose was assumed to be virtually infinite. Therefore, we derived a one-dimensional diffusion equation.
 |
1 |
with the corresponding initial condition  .
.
 |
2 |
and boundary condition  .
.
 |
3 |
was applied to obtain the diffusion coefficient of d-glucose in astrocytes. In Eqs. (1–3), x denotes the space coordinate, t is the time of propagation, and D represents a space- and time-independent diffusion coefficient.  is a continuous function describing the time dependence of the glucose input at the position of the micropipette
  , and
, and  denotes the molar concentration of intracellular glucose at a distance x from the origin and at a time t. The initial condition (Eq. 2) guarantees that, before superfusion, the internal glucose concentration was zero everywhere within the cell.
The solution of Eq. (1) for the given conditions (Eqs. 2 and 3) is
 |
4 |
For the increase in the glucose concentration in the cell at the region of glucose application  , we assumed a first-order kinetics with the time constant τ. The boundary condition with the linear correction
  is (cf. Eq. 3):
 |
5 |
where  represents the maximum concentration of d-glucose at place
  within the cell, i.e., at position ROI A.
  was applied because the experimentally observed signal demonstrated a small linear term superimposed on the exponential shape characteristic for first-order kinetics. From its purely exponential-like form, we assumed this deviation to be a consequence of the kinetics of an enzymatic process (i.e., a progressive decrease in the glycogen synthesis).
Due to the relativeness of the scale of  , obtained from the YFP/CFP emission at different positions within the cell (ROIs A, B, and C), we needed to scale solution (4) by the corresponding asymptotic maximum value of the glucose concentration at positions ROI B and C
  . By the same reasoning as given above, an additional small linear correction
  was applied. The corresponding scaled solution of Eq. (4), corrected for the linear increase in the signal, is
 |
6 |
Note again that subscript x in Eq. (6) denotes the position away from the point of glucose input, i.e., for ROI B and ROI C. Note also that  is a unitless fitting parameter, correcting for the relative scale of
  obtained experimentally.
Global fitting of expressions (5) and (6) to the traces for the relative changes in glucose concentration in three ROIs (Fig. 6) was performed to extract the best-fit model parameters of interest (diffusion coefficient D and time constant τ). A Levenberg–Marquardt minimization algorithm was used for that purpose. The resulting mean diffusion coefficient of n = 21 cells tested was D = (2.38 ± 0.41) × 10−10 m2s−1, and the corresponding time constant τ was: τ = 5.12 ± 0.57 s. The 95 % confidence intervals were  and τ ± 1.13 s.
Fig. 6.

Time dependence of the relative changes in d-glucose concentration in three ROIs obtained experimentally from the cell shown in Fig. 2. The theoretical prediction (Eqs. 5 and 6) for the parameters calculated via global fitting of the model functions to the raw experimental data is shown by continuous lines (see Results section for the model). Data obtained from ROI A is denoted by black circles, ROI B by green squares, and ROI C by red triangles. The resulting mean diffusion coefficient of n = 21 cells tested was D = (2.38 ± 0.41) × 10−10 m2s−1 and the corresponding time constant τ was τ = 5.12 ± 0.57 s. The 95 % confidence intervals were  and τ ± 1.13 s
The diffusion coefficient obtained by our measurements in astrocytes and calculated by applying our model is marked as an apparent diffusion coefficient (D app) in order to discriminate it from the diffusion coefficient of d-glucose in pure water. Note that the inhomogeneity of the cell interior is not directly modeled (Eq. 6). In the Discussion section, we address this tortuosity of the intracellular space. The result of the above analysis shows that the apparent diffusion coefficient for glucose in the cytosol of astrocytes is about three times less than that measured in aqueous solution (D = 6.7 × 10⁻¹⁰ m2s−1) at 24 °C [43].
Discussion
The main finding of this study is that we have determined the apparent diffusion coefficient of cytosolic d-glucose in astrocytes.
Glucose enters the mammalian brain and equilibrates with the basal lamina via rapid facilitated transport across the endothelial cell layer of the blood–brain barrier. There are three potential pathways of glucose or its metabolites to the neurons. First, glucose may enter the astrocyte where it can be converted to lactate as proposed by the astrocyte–neuron lactate shuttle hypothesis (ANLS) [24], and subsequently lactate is transported into the interstitium and neurons. Alternatively, glucose may traverse the astrocyte and may be transported out, into the interstitium [8]. Finally, basal lamina glucose may diffuse freely into the interstitium whence it is transported directly into neurons and astrocytes [8].
In rat brain, the extracellular concentration of glucose measured with microelectrodes under ischemic conditions may be as low 0.05 mM, and in hypoglycemia less than 0.19 mM [44]; measurements using a microdialysis technique show a glucose concentration of 0.47 mM [45]. On the other hand, the blood plasma glucose levels in fasting animals are up to 5 mM and are higher after glucose intake [46, 47]. This difference in glucose concentration between the plasma and neutrophils may enable astrocytes to transport metabolites from capillaries to neurons.
As reported previously, uptake of glucose into the cytosol of astrocytes and its subsequent utilization is saturable [48]. At high external glucose concentrations, the intracellular concentration is limited to a maximal value of 0.4 mM [33, 42]. This is likely due to the plasma membrane permeability for glucose reaching maximal transport capacity, which is balances cytosolic glucose utilization. The rate of glucose flux through GLUT1, the major d-glucose transporter in astrocytes [49], is in balance with the rate of utilization by hexokinase activity. It was shown that levels of d-glucose 1,6-bisphosphate higher than 0.2 mM inhibit astroglial hexokinase in a concentration-dependent manner; at 1.2 mM, the hexokinase activity was almost completely inhibited [50]. This results in free non-phosphorylated glucose in the cytosol, which may be diffused from the region of uptake to the region of glucose utilization in the astrocyte or even exported to the extracellular medium.
Astrocytes are interconnected by gap junctions, which allow the passage of ions and small molecules [51, 52]. It was shown that sodium rapidly spreads in the astrocyte network in hippocampal slices due to diffusion through gap junctions composed of Cx30 and Cx43 [53]. Gap junctions allow the transfer of glucose and its metabolites between astrocytes in an activity-dependent manner [54, 55]. Treatment with proinflammatory cytokines enhances glucose uptake and reduces the intercellular diffusion of glucose [56]. Glucose metabolites are quickly dispersed and released from highly activated zones of the inferior colliculus in rat brain due to an extensive syncytial network that includes thousands of cells and perivascular endfeet [57].
Endothelin-1, a vasoconstricting agent [58], stimulates the translocation and upregulation of both GLUT1 transporter and type 1 hexokinase in astrocytes [59], indicating that changes in cytosolic glucose concentrations may be regulated by plasma membrane receptors. Noradrenaline activates both α- and β-adrenergic receptors in astrocytes [60, 61], which induces glycogen breakdown [24, 62–65]. In astrocytes, glycogen is continuously synthesized and degraded [66]. Stimulation of single astrocytes with adrenaline or noradrenaline resulted in increased cytosolic glucose concentration due to glycogen breakdown [33]. This may support the view that astrocytes provide an endogenous source of brain glucose, since they express glucose 6-phosphatase-β [67], or other glucose metabolites, such as lactate.
The mathematical model of cerebral metabolism and nutrient transport in the brain parenchyma shows that diffusion of glucose to the interstitium through the basal lamina dominates the delivery of glucose to both neurons and astrocytes, whereas astrocytic endfeet transfer less than 4 % of the total glucose supplied to the tissue [68]. This indicates that neuronal access to paracellularly diffused glucose may prevail over glucose or lactate delivered to neurons by astrocytes. The mathematical model suggests that shuttled lactate may account for 7 % of total brain glucose uptake, which is matched by an amount of monocarboxylates drained by the bloodstream. This indicates that direct uptake of glucose may be exerted by neurons and astrocytes, rather than delivery by using the lactate shuttle [68], however the ability of astrocytes to transport glucose remains unknown.
We found that after local superfusion of cells with extracellular medium containing 10 mM d-glucose, the cytosolic glucose concentration was increased by the highest rate close to the region of local superfusion and by a significantly lower rate away from the position of direct glucose uptake (Figs. 3–5). This observation was confirmed by measurements of the rise time of the FRET ratio and by fitting the exponential regression algorithm to the changes in the FRET ratio.
To further quantify and analyze the delayed kinetics of the increase in cytosolic glucose, we developed a mathematical model to determine the apparent diffusion coefficient (D app) of cytosolic glucose in purified astrocytes. By considering a flat geometry of the single astrocyte and the specific region of d-glucose uptake, obtained by placing the ejection jet of the pipette locally at a narrow part of the cell, we were able to establish an analytical solution to a one-dimensional diffusion equation with well-defined boundary conditions to analyze time-dependent changes in cytosolic glucose concentration at three different ROIs in the cell. For the increase in glucose concentration in the cell at the region of glucose application, we assumed a first-order kinetics with the time constant τ, where the boundary condition included a small linear correction due to the kinetics of an enzymatic process, e.g., gradual decrease in the rate of glycogen synthesis (cf. Eq. 5). Equation (5) and the solution of the diffusion equation for the applied conditions (Eq. 6) were simultaneously fitted to all three traces for the relative change in glucose concentration (ROI A, B, and C) in 21 experiments. The calculated mean apparent diffusion coefficient was (2.38 ± 0.41) × 10−10 m2s−1, and the corresponding time constant τ of the assumed first-order kinetics of glucose input was 5.12 ± 0.57 s, n = 21 cells).
The tortuosity of the extracellular or intracellular space (λ) represents the hindrance imposed on diffusing molecules by the tissue or intracellular structures compared with obstacle-free medium [69], where the value of 1 indicates the absence of hindrance. The apparent diffusion coefficient (D
app) for molecular self-diffusion in the tissue is thus given by:  . The tortuosity (λ) for the diffusion of 1.6 has been measured within cortical brain tissue [69]. At such tortuosity, the apparent diffusion coefficient for d-glucose is D = 4.4 × 10⁻¹⁰ m2s−1 (D = 6.7× 10⁻¹⁰ m2s−1 in pure water at 24 °C, MW = 180.16 g/mol) [8, 43]. Our results show that the apparent diffusion coefficient for cytosolic glucose in astrocytes is D = (2.38± 0.41) × 10−10 m2s−1, which means that the tortuosity of the astrocyte cytosol for glucose is
  . The apparent diffusion coefficient for d-glucose in the astrocyte cytosol is thus lower than found in cerebral cortical tissue [69] and lower compared with the diffusion coefficient of glucose in an N-isopropyl acrylamide gel (3.7 × 10⁻¹⁰ m2s−1) [70] and tumor spheroids (5 × 10⁻¹⁰ m2s−1) [71], but more than in human dura mater D = (1.6 × 10⁻¹⁰ m2s−1) [72].
Since dimensions of cells are relatively small and due to the technical limitations of monitoring (imaging) the FRET signal (i.e., temporal resolution and sensitivity) we have measured the diffusion coefficient at room temperature, where the diffusion is expected to be relatively slower. Moreover, at room temperature the physiological processes (biochemical processes in particular) are less likely to influence the measurements of cytosolic glucose concentration. In an ideal medium, the diffusion coefficient may be corrected to physiological temperature of 37 °C by applying the standard correction of +2 %/° [73, 74]. Therefore the diffusion coefficient of glucose in water is 6.7 × 10⁻¹⁰ m2 s−1 (at 24 °C) and 8.7 × 10⁻¹⁰ m2 s−1 (at 37 °C). Analogously, the apparent diffusion coefficient of intracellular glucose is 2.4 × 10⁻¹⁰ m2 s−1, compared to calculated coefficient 3.1 × 10⁻¹⁰ m2 s−1 at 37 °C.
We conclude that the measured apparent diffusion coefficient for cytosolic glucose in purified rat astrocytes is only three times less than that in aqueous solution, which may allow glucose and glucose metabolites to traverse from the endothelial cell layer at the blood–brain barrier to neurons and neighboring astrocytes.
Acknowledgments
The authors thank Wolf B. Frommer for providing the plasmid FLII12PGLU-700μ∆6 (http://www.addgene.org). We thank Dr. Helena H. Chowdhury and Dr. Nina Vardjan for valuable help with plasmid multiplication. This work was supported by Grants #P3-310, #J3-4146 from the Slovenian Research Agency (ARRS) and COST (European Cooperation in Science and Technology) action BM1002. M.L. acknowledges the support of ARRS through Program P1-0201 and Project J1-4148. He also thanks Dr. Andrej Lajovic for discussions and help with numerical manipulation of the data.
References
- 1.Vesce S, Bezzi P, Volterra A. The active role of astrocytes in synaptic transmission. Cell Mol Life Sci. 1999;56:991–1000. doi: 10.1007/s000180050488. [DOI] [PMC free article] [PubMed] [Google Scholar]
- 2.Kacem K, Lacombe P, Seylaz J, Bonvento G. Structural organization of the perivascular astrocyte endfeet and their relationship with the endothelial glucose transporter: a confocal microscopy study. Glia. 1998;23:1–10. doi: 10.1002/(SICI)1098-1136(199805)23:1<1::AID-GLIA1>3.0.CO;2-B. [DOI] [PubMed] [Google Scholar]
- 3.Tsacopoulos M, Magistretti P. Metabolic coupling between glia and neurons. J Neurosci. 1996;16:877–885. doi: 10.1523/JNEUROSCI.16-03-00877.1996. [DOI] [PMC free article] [PubMed] [Google Scholar]
- 4.Murphy S. Astrocytes: pharmacology and function. San Diego: Academic Press; 1993. [Google Scholar]
- 5.Parpura V, Zorec R. Gliotransmission: exocytotic release from astrocytes. Brain Res Rev. 2010;63:83–92. doi: 10.1016/j.brainresrev.2009.11.008. [DOI] [PMC free article] [PubMed] [Google Scholar]
- 6.Parpura V, Baker B, Jeras M, Zorec R. Regulated exocytosis in astrocytic signal integration. Neurochem Int. 2010;57:451–459. doi: 10.1016/j.neuint.2010.02.007. [DOI] [PMC free article] [PubMed] [Google Scholar]
- 7.Cohen Z, Ehret M, Maitre M, Hamel E. Ultrastructural analysis of tryptophan hydroxylase immunoreactive nerve terminals in the rat cerebral cortex and hippocampus: their associations with local blood vessels. Neuroscience. 1995;66:555–569. doi: 10.1016/0306-4522(94)00625-F. [DOI] [PubMed] [Google Scholar]
- 8.Simpson IA, Carruthers A, Vannucci SJ. Supply and demand in cerebral energy metabolism: the role of nutrient transporters. J Cereb Blood Flow Metab. 2007;27:1766–1791. doi: 10.1038/sj.jcbfm.9600521. [DOI] [PMC free article] [PubMed] [Google Scholar]
- 9.Clarke D, Sokoloff L. Circulation and energy metabolism of the brain. In: Siegel G, Agranoff B, Albers R, Fisher S, Uhler MD, editors. Basic neurochemistry. Philadelphia: Lippincott-Raven; 1999. pp. 637–669. [Google Scholar]
- 10.Zhao F, Keating A. Functional properties and genomics of glucose transporters. Curr Genomics. 2007;8:113–128. doi: 10.2174/138920207780368187. [DOI] [PMC free article] [PubMed] [Google Scholar]
- 11.Maher F, Vannucci S, Simpson I. Glucose transporter proteins in brain. FASEB J. 1994;8:1003–1011. doi: 10.1096/fasebj.8.13.7926364. [DOI] [PubMed] [Google Scholar]
- 12.Morgello S, Uson R, Schwartz E, Haber R. The human blood–brain barrier glucose transporter (GLUT1) is a glucose transporter of gray matter astrocytes. Glia. 1995;14:43–54. doi: 10.1002/glia.440140107. [DOI] [PubMed] [Google Scholar]
- 13.Leino R, Gerhart D, van Bueren A, McCall A, Drewes L. Ultrastructural localization of GLUT 1 and GLUT 3 glucose transporters in rat brain. J Neurosci Res. 1997;49:617–626. doi: 10.1002/(SICI)1097-4547(19970901)49:5<617::AID-JNR12>3.0.CO;2-S. [DOI] [PubMed] [Google Scholar]
- 14.Leloup C, Arluison M, Lepetit N, Cartier N, Marfaing-Jallat P, Ferré P, Pénicaud L. Glucose transporter 2 (GLUT 2): expression in specific brain nuclei. Brain Res. 1994;638:221–226. doi: 10.1016/0006-8993(94)90653-X. [DOI] [PubMed] [Google Scholar]
- 15.Arluison M, Quignon M, Nguyen P, Thorens B, Leloup C, Penicaud L. Distribution and anatomical localization of the glucose transporter 2 (GLUT2) in the adult rat brain–an immunohistochemical study. J Chem Neuroanat. 2004;28:117–136. doi: 10.1016/j.jchemneu.2004.05.009. [DOI] [PubMed] [Google Scholar]
- 16.Griffin L, Gelb B, Adams V, McCabe E. Developmental expression of hexokinase 1 in the rat. Biochim Biophys Acta. 1992;1129:309–317. doi: 10.1016/0167-4781(92)90508-W. [DOI] [PubMed] [Google Scholar]
- 17.Needels D, Wilson J. The identity of hexokinase activities from mitochondrial and cytoplasmic fractions of rat brain homogenates. J Neurochem. 1983;40:1134–1143. doi: 10.1111/j.1471-4159.1983.tb08104.x. [DOI] [PubMed] [Google Scholar]
- 18.Wilkin G, Wilson J. Localization of hexokinase in neural tissue: light microscopic studies with immunofluorescence and histochemical procedures. J Neurochem. 1977;29:1039–1051. doi: 10.1111/j.1471-4159.1977.tb06507.x. [DOI] [PubMed] [Google Scholar]
- 19.Lynch R, Fogarty K, Fay F. Modulation of hexokinase association with mitochondria analyzed with quantitative three-dimensional confocal microscopy. J Cell Biol. 1991;112:385–395. doi: 10.1083/jcb.112.3.385. [DOI] [PMC free article] [PubMed] [Google Scholar]
- 20.Nagamatsu S, Nakamichi Y, Inoue N, Inoue M, Nishino H, Sawa H. Rat C6 glioma cell growth is related to glucose transport and metabolism. Biochem J. 1996;319(Pt 2):477–482. doi: 10.1042/bj3190477. [DOI] [PMC free article] [PubMed] [Google Scholar]
- 21.Ben-Yoseph O, Boxer P, Ross B. Oxidative stress in the central nervous system: monitoring the metabolic response using the pentose phosphate pathway. Dev Neurosci. 1994;16:328–336. doi: 10.1159/000112127. [DOI] [PubMed] [Google Scholar]
- 22.Leo G, Driscoll B, Shank R, Kaufman E. Analysis of [1–13C] D-glucose metabolism in cultured astrocytes and neurons using nuclear magnetic resonance spectroscopy. Dev Neurosci. 1993;15:282–288. doi: 10.1159/000111346. [DOI] [PubMed] [Google Scholar]
- 23.Wiesinger H, Hamprecht B, Dringen R. Metabolic pathways for glucose in astrocytes. Glia. 1997;21:22–34. doi: 10.1002/(SICI)1098-1136(199709)21:1<22::AID-GLIA3>3.0.CO;2-3. [DOI] [PubMed] [Google Scholar]
- 24.Pellerin L, Magistretti P. Glutamate uptake into astrocytes stimulates aerobic glycolysis: a mechanism coupling neuronal activity to glucose utilisation. Proc Natl Acad Sci USA. 1994;91:10625–10629. doi: 10.1073/pnas.91.22.10625. [DOI] [PMC free article] [PubMed] [Google Scholar]
- 25.Cataldo A, Broadwell R. Cytochemical identification of cerebral glycogen and glucose-6-phosphatase activity under normal and experimental conditions. II. Choroid plexus and ependymal epithelia, endothelia and pericytes. J Neurocytol. 1986;15:511–524. doi: 10.1007/BF01611733. [DOI] [PubMed] [Google Scholar]
- 26.Wender R, Brown A, Fern R, Swanson R, Farrell K, Ransom B. Astrocytic glycogen influences axon function and survival during glucose deprivation in central white matter. J Neurosci. 2000;20:6804–6810. doi: 10.1523/JNEUROSCI.20-18-06804.2000. [DOI] [PMC free article] [PubMed] [Google Scholar]
- 27.Fillenz M, Lowry J, Boutelle M, Fray A. The role of astrocytes and noradrenaline in neuronal glucose metabolism. Acta Physiol Scand. 1999;167:275–284. doi: 10.1046/j.1365-201x.1999.00578.x. [DOI] [PubMed] [Google Scholar]
- 28.Walls A, Heimbürger C, Bouman S, Schousboe A, Waagepetersen H. Robust glycogen shunt activity in astrocytes: effects of glutamatergic and adrenergic agents. Neuroscience. 2009;158:284–292. doi: 10.1016/j.neuroscience.2008.09.058. [DOI] [PubMed] [Google Scholar]
- 29.Marrif H, Juurlink B. Astrocytes respond to hypoxia by increasing glycolytic capacity. J Neurosci Res. 1999;57:255–260. doi: 10.1002/(SICI)1097-4547(19990715)57:2<255::AID-JNR11>3.0.CO;2-6. [DOI] [PubMed] [Google Scholar]
- 30.Niitsu Y, Hori O, Yamaguchi A, Bando Y, Ozawa K, Tamatani M, Ogawa S, Tohyama M. Exposure of cultured primary rat astrocytes to hypoxia results in intracellular glucose depletion and induction of glycolytic enzymes. Brain Res Mol Brain Res. 1999;74:26–34. doi: 10.1016/S0169-328X(99)00245-4. [DOI] [PubMed] [Google Scholar]
- 31.Kahlert S, Reiser G. Glial perspectives of metabolic states during cerebral hypoxia—calcium regulation and metabolic energy. Cell Calcium. 2004;36:295–302. doi: 10.1016/j.ceca.2004.02.009. [DOI] [PubMed] [Google Scholar]
- 32.Bekar LK, He W, Nedergaard M. Locus coeruleus a-adrenergic—mediated activation of cortical astrocytes in vivo. Cereb Cortex. 2008;18:2789–2795. doi: 10.1093/cercor/bhn040. [DOI] [PMC free article] [PubMed] [Google Scholar]
- 33.Prebil M, Vardjan N, Jensen J, Zorec R, Kreft M. Dynamic monitoring of cytosolic glucose in single astrocytes. Glia. 2011;59:903–913. doi: 10.1002/glia.21161. [DOI] [PubMed] [Google Scholar]
- 34.Forsyth R, Bartlett K, Burchell A, Scott H, Eyre J. Astrocytic glucose-6-phosphatase and the permeability of brain microsomes to glucose 6-phosphate. Biochem J. 1993;294(Pt 1):145–151. doi: 10.1042/bj2940145. [DOI] [PMC free article] [PubMed] [Google Scholar]
- 35.Dringen R, Hamprecht B. Differences in glycogen metabolism in astroglia-rich primary cultures and sorbitol-selected astroglial cultures derived from mouse brain. Glia. 1993;8:143–149. doi: 10.1002/glia.440080302. [DOI] [PubMed] [Google Scholar]
- 36.Forsyth R. Astrocytes and the delivery of glucose from plasma to neurons. Neurochem Int. 1996;28:231–241. doi: 10.1016/0197-0186(95)00094-1. [DOI] [PubMed] [Google Scholar]
- 37.Fehr M, Lalonde S, Lager I, Wolff M, Frommer W. In vivo imaging of the dynamics of glucose uptake in the cytosol of COS-7 cells by fluorescent nanosensors. J Biol Chem. 2003;278:19127–19133. doi: 10.1074/jbc.M301333200. [DOI] [PubMed] [Google Scholar]
- 38.Takanaga H, Chaudhuri B, Frommer W. GLUT1 and GLUT9 as major contributors to glucose influx in HepG2 cells identified by a high sensitivity intramolecular FRET glucose sensor. Biochim Biophys Acta. 2008;1778:1091–1099. doi: 10.1016/j.bbamem.2007.11.015. [DOI] [PMC free article] [PubMed] [Google Scholar]
- 39.Schwartz J, Wilson D. Preparation and characterization of type 1 astrocytes cultured from adult rat cortex, cerebellum, and striatum. Glia. 1992;5:75–80. doi: 10.1002/glia.440050111. [DOI] [PubMed] [Google Scholar]
- 40.Kreft M, Stenovec M, Rupnik M, Grilc S, Krzan M, Potokar M, Pangrsic T, Haydon P, Zorec R. Properties of Ca (2 +)-dependent exocytosis in cultured astrocytes. Glia. 2004;46:437–445. doi: 10.1002/glia.20018. [DOI] [PubMed] [Google Scholar]
- 41.John S, Ottolia M, Weiss J, Ribalet B. Dynamic modulation of intracellular glucose imaged in single cells using a FRET-based glucose nanosensor. Pflugers Arch. 2008;456:307–322. doi: 10.1007/s00424-007-0395-z. [DOI] [PMC free article] [PubMed] [Google Scholar]
- 42.Bittner C, Loaiza A, Ruminot I, Larenas V, Sotelo-Hitschfeld T, Gutiérrez R, Córdova A, Valdebenito R, Frommer W, Barros L (2010) High-resolution measurement of the glycolytic rate. Front Neuroenergetics 2:26. doi:10.3389/fnene.2010.00026 [DOI] [PMC free article] [PubMed]
- 43.Marucci M, Ragnarsson G, Axelsson A. Electronic speckle pattern interferometry: a novel non-invasive tool for studying drug transport rate through free films. J Control Release. 2006;114:369–380. doi: 10.1016/j.jconrel.2006.06.019. [DOI] [PubMed] [Google Scholar]
- 44.Silver I, Erecińska M. Extracellular glucose concentration in mammalian brain: continuous monitoring of changes during increased neuronal activity and upon limitation in oxygen supply in normo-, hypo-, and hyperglycemic animals. J Neurosci. 1994;14:5068–5076. doi: 10.1523/JNEUROSCI.14-08-05068.1994. [DOI] [PMC free article] [PubMed] [Google Scholar]
- 45.Fellows L, Boutelle M, Fillenz M. Extracellular brain glucose levels reflect local neuronal activity: a microdialysis study in awake, freely moving rats. J Neurochem. 1992;59:2141–2147. doi: 10.1111/j.1471-4159.1992.tb10105.x. [DOI] [PubMed] [Google Scholar]
- 46.Cameron IL, Ord VA. Parenteral level of glucose intake on glucose homeostasis, tumor growth, gluconeogenesis, and body composition in normal and tumor-bearing rats. Cancer Res. 1983;43:5228–5234. [PubMed] [Google Scholar]
- 47.Huang BW, Chiang MT, Yao HT, Chiang W. The effect of high-fat and high-fructose diets on glucose tolerance and plasma lipid and leptin levels in rats. Diabetes Obes Metab. 2004;6:120–126. doi: 10.1111/j.1462-8902.2004.00323.x. [DOI] [PubMed] [Google Scholar]
- 48.Prebil M, Chowdhury HH, Zorec R, Kreft M. Changes in cytosolic glucose level in ATP stimulated live astrocytes. Biochem Biophys Res Commun. 2011;405:308–313. doi: 10.1016/j.bbrc.2011.01.035. [DOI] [PubMed] [Google Scholar]
- 49.Loaiza A, Porras O, Barros L. Glutamate triggers rapid glucose transport stimulation in astrocytes as evidenced by real-time confocal microscopy. J Neurosci. 2003;23:7337–7342. doi: 10.1523/JNEUROSCI.23-19-07337.2003. [DOI] [PMC free article] [PubMed] [Google Scholar]
- 50.Lai J, Behar K, Liang B, Hertz L. Hexokinase in astrocytes: kinetic and regulatory properties. Metab Brain Dis. 1999;14:125–133. doi: 10.1023/A:1020761831295. [DOI] [PubMed] [Google Scholar]
- 51.Giaume C, Koulakoff A, Roux L, Holcman D, Rouach N. Astroglial networks: a step further in neuroglial and gliovascular interactions. Nat Rev Neurosci. 2010;11:87–99. doi: 10.1038/nrn2757. [DOI] [PubMed] [Google Scholar]
- 52.Nagy JI, Dudek FE, Rash JE. Update on connexins and gap junctions in neurons and glia in the mammalian nervous system. Brain Res Brain Res Rev. 2004;47:191–215. doi: 10.1016/j.brainresrev.2004.05.005. [DOI] [PubMed] [Google Scholar]
- 53.Langer J, Stephan J, Theis M, Rose CR. Gap junctions mediate intercellular spread of sodium between hippocampal astrocytes in situ. Glia. 2012;60:239–252. doi: 10.1002/glia.21259. [DOI] [PubMed] [Google Scholar]
- 54.Rouach N, Koulakoff A, Abudara V, Willecke K, Giaume C. Astroglial metabolic networks sustain hippocampal synaptic transmission. Science. 2008;322:1551–1555. doi: 10.1126/science.1164022. [DOI] [PubMed] [Google Scholar]
- 55.Tabernero A, Medina JM, Giaume C. Glucose metabolism and proliferation in glia: role of astrocytic gap junctions. J Neurochem. 2006;99:1049–1061. doi: 10.1111/j.1471-4159.2006.04088.x. [DOI] [PubMed] [Google Scholar]
- 56.Retamal MA, Froger N, Palacios-Prado N, Ezan P, Sáez PJ, Sáez JC, Giaume C. Cx43 hemichannels and gap junction channels in astrocytes are regulated oppositely by proinflammatory cytokines released from activated microglia. J Neurosci. 2007;27:13781–13792. doi: 10.1523/JNEUROSCI.2042-07.2007. [DOI] [PMC free article] [PubMed] [Google Scholar]
- 57.Ball KK, Gandhi GK, Thrash J, Cruz NF, Dienel GA. Astrocytic connexin distributions and rapid, extensive dye transfer via gap junctions in the inferior colliculus: implications for [(14)C]glucose metabolite trafficking. J Neurosci Res. 2007;85:3267–3283. doi: 10.1002/jnr.21376. [DOI] [PMC free article] [PubMed] [Google Scholar]
- 58.Nie X, Olsson Y. Endothelin peptides in brain diseases. Rev Neurosci. 1996;7:177–186. doi: 10.1515/revneuro.1996.7.3.177. [DOI] [PubMed] [Google Scholar]
- 59.Sánchez-Alvarez R, Tabernero A, Medina J. Endothelin-1 stimulates the translocation and upregulation of both glucose transporter and hexokinase in astrocytes: relationship with gap junctional communication. J Neurochem. 2004;89:703–714. doi: 10.1046/j.1471-4159.2004.02398.x. [DOI] [PubMed] [Google Scholar]
- 60.Northam W, Bedoy C, Mobley P. Pharmacological identification of the alpha-adrenergic receptor type which inhibits the beta-adrenergic activated adenylate cyclase system in cultured astrocytes. Glia. 1989;2:129–133. doi: 10.1002/glia.440020209. [DOI] [PubMed] [Google Scholar]
- 61.Hertz L, Lovatt D, Goldman S, Nedergaard M. Adrenoceptors in brain: cellular gene expression and effects on astrocytic metabolism and [Ca(2 +)]i. Neurochem Int. 2010;57:411–420. doi: 10.1016/j.neuint.2010.03.019. [DOI] [PMC free article] [PubMed] [Google Scholar]
- 62.Fray A, Forsyth R, Boutelle M, Fillenz M. The mechanisms controlling physiologically stimulated changes in rat brain glucose and lactate: a microdialysis study. J Physiol. 1996;496(Pt 1):49–57. doi: 10.1113/jphysiol.1996.sp021664. [DOI] [PMC free article] [PubMed] [Google Scholar]
- 63.Subbarao K, Hertz L. Stimulation of energy metabolism by alpha-adrenergic agonists in primary cultures of astrocytes. J Neurosci Res. 1991;28:399–405. doi: 10.1002/jnr.490280312. [DOI] [PubMed] [Google Scholar]
- 64.Subbarao K, Hertz L. Effect of adrenergic agonists on glycogenolysis in primary cultures of astrocytes. Brain Res. 1990;536:220–226. doi: 10.1016/0006-8993(90)90028-A. [DOI] [PubMed] [Google Scholar]
- 65.Gibbs M, Hutchinson D, Hertz L. Astrocytic involvement in learning and memory consolidation. Neurosci Biobehav Rev. 2008;32:927–944. doi: 10.1016/j.neubiorev.2008.02.001. [DOI] [PubMed] [Google Scholar]
- 66.Shulman R, Hyder F, Rothman D. Cerebral energetics and the glycogen shunt: neurochemical basis of functional imaging. Proc Natl Acad Sci USA. 2001;98:6417–6422. doi: 10.1073/pnas.101129298. [DOI] [PMC free article] [PubMed] [Google Scholar]
- 67.Ghosh A, Cheung Y, Mansfield B, Chou J. Brain contains a functional glucose-6-phosphatase complex capable of endogenous glucose production. J Biol Chem. 2005;280:11114–11119. doi: 10.1074/jbc.M410894200. [DOI] [PubMed] [Google Scholar]
- 68.DiNuzzo M, Mangia S, Maraviglia B, Giove F. Changes in glucose uptake rather than lactate shuttle take center stage in subserving neuroenergetics: evidence from mathematical modeling. J Cereb Blood Flow Metab. 2010;30:586–602. doi: 10.1038/jcbfm.2009.232. [DOI] [PMC free article] [PubMed] [Google Scholar]
- 69.Hrabetová S, Nicholson C. Contribution of dead-space microdomains to tortuosity of brain extracellular space. Neurochem Int. 2004;45:467–477. doi: 10.1016/j.neuint.2003.11.011. [DOI] [PubMed] [Google Scholar]
- 70.Andersson M, Axelsson A, Zacchi G. Diffusion of glucose and insulin in a swelling N-isopropylacrylamide gel. Int J Pharm. 1997;157:199–208. doi: 10.1016/S0378-5173(97)00243-3. [DOI] [PubMed] [Google Scholar]
- 71.Groebe K, Erz S, Mueller-Klieser W. Glucose diffusion coefficients determined from concentration profiles in EMT6 tumor spheroids incubated in radioactively labeled l-glucose. Adv Exp Med Biol. 1994;361:619–625. doi: 10.1007/978-1-4615-1875-4_114. [DOI] [PubMed] [Google Scholar]
- 72.Bashkatov AN, Genina EA, Sinichkin YP, Kochubey VI, Lakodina NA, Tuchin VV. Glucose and mannitol diffusion in human dura mater. Biophys J. 2003;85:3310–3318. doi: 10.1016/S0006-3495(03)74750-X. [DOI] [PMC free article] [PubMed] [Google Scholar]
- 73.Gerhardt GA, Adams RN. Determination of diffusion coefficients by flow injection analysis. Anal Chem. 1982;54:2618–2620. doi: 10.1021/ac00251a054. [DOI] [Google Scholar]
- 74.Nicholson C. Diffusion and related transport mechanisms in brain tissue. Rep Prog Phys. 2001;64:815–884. doi: 10.1088/0034-4885/64/7/202. [DOI] [Google Scholar]