

Abstract
The T cell integrin receptor LFA-1 orchestrates adhesion between T cells and antigen-presenting cells (APCs), resulting in formation of a contact zone known as the immune synapse (IS) which is supported by the cytoskeleton. L-plastin is a leukocyte-specific actin bundling protein that rapidly redistributes to the immune synapse following T cell–APC engagement. We used single domain antibodies (nanobodies, derived from camelid heavy-chain only antibodies) directed against functional and structural modules of L-plastin to investigate its contribution to formation of an immune synapse between Raji cells and human peripheral blood mononuclear cells or Jurkat T cells. Nanobodies that interact either with the EF hands or the actin binding domains of L-plastin both trapped L-plastin in an inactive conformation, causing perturbation of IS formation, MTOC docking towards the plasma membrane, T cell proliferation and IL-2 secretion. Both nanobodies delayed Ser5 phosphorylation of L-plastin which is required for enhanced bundling activity. Moreover, one nanobody delayed LFA-1 phosphorylation, reduced the association between LFA-1 and L-plastin and prevented LFA-1 enrichment at the IS. Our findings reveal subtle mechanistic details that are difficult to attain by conventional means and show that L-plastin contributes to immune synapse formation at distinct echelons.
Electronic supplementary material
The online version of this article (doi:10.1007/s00018-012-1169-0) contains supplementary material, which is available to authorized users.
Keywords: Immune synapse, Nanobody, LFA-1, Integrin, L-plastin
Introduction
Upon T cell receptor (TCR) engagement with peptide antigens displayed by antigen-presenting cells (APCs), a complex cellular structure called the immunological synapse (IS) is formed at the interface between T cells and APCs. The synapse is a highly dynamic structure composed of various receptors and intracellular signaling molecules. These proteins are organized in distinct structures, called supramolecular activation clusters or SMAC (s): a central (c) and peripheral (p) SMAC, each containing a different subset of proteins. The inner circle (cSMAC) is composed of the T cell receptor (TCR) and associated signaling proteins (PKCΘ, CD2, CD28,…). The surrounding pSMAC contains the integrin LFA-1 (leukocyte functional antigen 1 or αLβ2), talin, and associated adhesion molecules [1, 2]. Next to the interaction between TCR/CD3 and the appropriate peptide-major histocompatibility (MHC) complex on the APC, T cells also require a costimulatory signal (for instance from CD28) to become fully activated [3].
LFA-1 (CD11a/CD18) is responsible for adhesion between T cells and APCs during IS formation by binding to intercellular adhesion molecules (ICAMs) on the APC. Studies also indicate that this ICAM-LFA-1 interaction is capable of initiating costimulatory T cell signaling events, via phosphorylation of the beta2 integrin chain of LFA-1 [4, 5].
Actin cytoskeleton rearrangements are crucial for multiple steps in the T cell activation process. Actin is rapidly polymerized in response to T cell receptor signaling as F-actin provides IS stability and is thought to regulate LFA-1 clustering and avidity by controlling mobility of the integrin [6]. L-plastin, an actin-bundling protein, accumulates at the synapse where it colocalizes with F-actin in the peripheral SMAC. T cells from LPL−/− mice form smaller immunological synapses, show reduced recruitment of talin and LFA-1 to the synapse, and are defective in TCR-mediated cytokine production and proliferation [7, 8].
Plastins are composed of 2N-terminal EF-hands, involved in calcium binding, followed by two actin binding domains (ABDs). The ABDs can simultaneously bind two actin filaments, thus cross-linking the filaments into tight bundles. F-actin binding and bundling activities are negatively regulated by Ca2+ [9]. Three plastin isoforms are expressed in mammals: L-plastin, I-plastin, and T-plastin, each with different tissue distributions. L-plastin or “leukocyte-plastin” is exclusively found in leukocytes, but ectopic expression is also observed in cancer cells [10, 11].
L-plastin (LPL) contains two N-terminal phosphorylation sites: Ser5 (primary phosphorylation site) and Ser7. Phosphorylation of LPL enhances targeting of LPL to F-actin-rich structures in epithelial cells and increases its bundling activity [12]. In T cells, phosphorylation of LPL is induced by TCR/CD3+ CD28 costimulation and this is considered as a marker of T cell activation [13, 14].
Several studies indicate that LPL also has a role in integrin signaling and activity. LPL associates with LFA-1 in unstimulated and stimulated T cells, and it has been postulated that LPL stabilizes LFA-1 at the immune synapse, possibly through interaction with calmodulin [8]. However, the exact mechanism how LPL affects LFA-1 function and/or localization remains to be clarified.
Nanobodies correspond with the antigen-binding domains of “heavy-chain only antibodies”, which are found in Camelidae species and cartilaginous fish such as sharks [15, 16]. They are monovalent, ±15 kDa in size, generally bind with nanomolar affinity and can be easily cloned. Nanobodies have manifold applications and have been used to neutralize toxins [17], crystallize active-state beta2 adrenergic receptors [18], or inactivate viral proteins [19], among others. Moreover, they show therapeutic potential [16]. Since nanobodies can be generated against enzymes and structural proteins alike, they offer the opportunity of eliciting a protein domain knock-out involving the inhibition of a particular protein function while leaving other functions intact. As such, this approach is complementary to RNAi which eradicates protein expression and thus eliminates all functions and interaction partners unique to a particular polypeptide.
In this study, we used two L-plastin nanobodies that target different epitopes to scrutinize the role and contribution of this leukocyte-specific protein to immune synapse formation and T cell activation. We show that both nanobodies affect MTOC docking, IL-2 secretion, and T cell proliferation, but differently affect the phosphorylation of LFA-1 and its enrichment at the IS. We suggest that LPL is crucial for optimal T cell activation due to its role in cytoskeletal reorganization but also through its interaction with, and regulation of, other proteins.
Materials and methods
Reagents and antibodies
Monoclonal anti-V5 antibody was purchased from Invitrogen (Merelbeke, Belgium). A monoclonal L-plastin-specific antibody was purchased from Neomarkers (Fremont, CA, USA); monoclonal gelsolin antibody, γ-tubulin antibody, α-tubulin antibody and anti-rabbit IgG were all from Sigma-Aldrich (St. Louis, MO, USA). Polyclonal anti-gelsolin, anti-CapG and anti-EGFP antibodies were obtained as described [20, 21]. Polyclonal rabbit IgGs against L-plastin and serine-5 phosphorylated L-plastin (anti-Ser5-P) were a kind gift from Dr. Evelyne Friedrich (University of Luxembourg) and have been characterized before [12]. Rabbit anti-EGFP, phospho-p44/42 MAPK (Erk1/2) (Thr202/Tyr204), phospho-cofilin (Ser3) and phospho-MEK1/2 (Ser217/221) antibodies were purchased from Cell Signaling (Danvers, MA, USA). Monoclonal anti-CD3 (MEM-92) and anti-fascin were purchased from Abcam (Cambridge, UK). Anti-human CD28, CD18 and CD11a were from BD Biosciences (San Diego, CA, USA). CellTrace™ Far Red DDAO-SE fluorescent tracer, mouse anti-CD3 R-phycoerythrin (R-PE) labeled antibody and mouse IgG2a R-PE labeled antibody for flow cytometric purpose, Alexa Fluor 488/594-conjugated goat anti-mouse/anti-rabbit IgGs, and Alexa Fluor 594 phalloidin were all obtained from Molecular Probes®-Life Technologies™ (Grand Island, NY, USA). DAPI and poly-l-lysine were from Sigma-Aldrich (St. Louis, MO, USA). Rabbit monoclonal anti-calmodulin and anti-phospho LFA-beta 2 (pS745) were from Epitomics (Burlingame, CA, USA). Monoclonal anti-actin antibody (clone C4) was from ICN Pharmaceuticals (Costa Mesa, CA, USA). All commercial antibodies were used at the dilution recommended by the manufacturer.
Lymphoprep™ was purchased from Axis-Shield PoC (Oslo, Norway). Human IL-2 was obtained from Peprotech (Wein, Austria) and staphylococcal enterotoxin E (SEE) was from Toxin Technology (Sarasota, FL, USA). Human T-activator CD3/CD28 Dynabeads® were purchased from Invitrogen (Merelbeke, Belgium) and used according to the manufacturer’s instructions. A human IL-2 Single Analyte ELISArray kit was purchased from SABiosciences-Qiagen (Frederick, MD, USA). The Amaxa® Cell Line Nucleofector® Kit V and Human T Cell Nucleofector® Kit were obtained from Lonza (Cologne, Germany).
Cell culture, primary cell isolation and transfection
Jurkat CD4+/CD8− T lymphoma cells and Raji B lymphoma cells were maintained at 37 °C in a humidified 5 % CO2 incubator and grown in RPMI 1640 (Gibco®-Life Technologies™, Grand Island, NY, USA) supplemented with 10 % fetal bovine serum, 100 μg/ml streptomycin and 100 IU/ml penicillin. Human peripheral blood mononuclear cells (PBMCs) were isolated by Lymphoprep™ density centrifugation of whole blood from healthy donors (Ghent University Hospital Blood Bank). Experiments were approved by the local ethical committee (UZGent/UGent OG 017) and informed consent was obtained from all subjects. Primary cells were then maintained in RPMI 1640 supplemented with 10 % heat inactivated fetal bovine serum. Nucleofection of Jurkat T cells and PBMCs was performed with Cell Line Nucleofector® Kit V or Human T Cell Nucleofector® Kit, respectively. Transfection efficiency of GFP-tagged constructs was checked with an epifluorescence microscope: 75–90 % in case of the Jurkat T cells and 60 % for the PBMCs.
Generation of nanobodies and cDNA cloning
L-plastin and gelsolin nanobodies were obtained in collaboration with the VIB nanobody service facility and described earlier [23, 24].
The EGFP nanobody cDNA was a kind gift of Dr. Gholamreza Hassanzadeh Ghassabeh (VIB nanobody service facility).
Recombinant V5-tagged nanobodies were generated for immunoprecipitation experiments. The V5-tag allows retrieval of nanobodies using anti-V5 antibody coupled to agarose. Two pairs of oligonucleotides containing this V5 sequence and a linker were annealed and used for subsequent cloning into the pHEN6c His6 vector creating the vector pHEN6c His6 V5. The following primers were used; Fwd: 5′ GTC ACC GTC TCC TCA GGT GGT GGT GGT TC T GGT GGT GGT AAG CCT ATC CCT AAC CCT CTC CTC GGT CTC GAT TCT ACG CGT ACC GGT CAT CAT CAC CAT CAC CAT TGAG 3′; Rev: 5′ AAT TCT CAA TGG TGA TGG TGA TGA TGA CCG GTA CGC GTA GAA TCG AGA CCG AGG AGA GGG TTA GGG ATA GGC TTA CCA CCA CCA GAA CCA CCA CCA CCT GAG GAG ACG 3′. Expression and purification of recombinant V5-tagged nanobodies was performed as described [24].
Activation of T lymphocytes
PBMCs were incubated with Human T-activator CD3/CD28 Dynabeads® or 2 μg/ml SEE, and 15 ng/ml recombinant human IL-2 for 8 h at 37 °C. After stimulation, cells were washed with PBS and divided in 2 for cell proliferation and IL-2 measurements. To quantify proliferation, the PBMCs were loaded with 10 μM far red DDAO-SE according to the manufacturer’s instructions and cultured in RPMI 1640 complete medium in the presence of 15 ng/ml IL-2. Cell proliferation was then determined after 3 days using flow cytometry. Cells were stained with anti-CD3 R-PE or IgG2a R-PE (control) in order to select the CD3-positive cells. Flow cytometric data acquisition was performed with a FACSCalibur machine (Becton–Dickinson, Franklin Lakes, NJ, USA) and data analysis was done with CELLQuest Pro software from BD. PBMCs, used for the IL-2 measurement, were cultured in RPMI 1640 complete medium, without any IL-2 added. After 2 days of culture, the amount of secreted IL-2 in the medium was determined by ELISA.
Jurkat T cells, used for phosphorylation analysis, were stimulated with immobilized anti-CD3 Ab (4 μg/ml) and soluble anti-CD28 Ab (4 μg/ml) for the times indicated.
The influence of CD3/CD28 stimulation on LPL/LFA-1 interaction was investigated with Jurkat T cells which were stimulated for 1 h with immobilized anti-CD3 Ab (2 μg/ml) and soluble anti-CD28 Ab (2.5 μg/ml).
Immunoprecipitation and immunoblotting
Untransfected Jurkat T cells or PBMCs were disrupted in ice-cold lysis buffer (PBS; Ca/Mg, 0.5 % NP-40, 1 mM PMSF and a protease inhibitor cocktail mix, with or without 1 mM EGTA) and the extract was centrifuged at 4 °C for 10 min (20,000g). Then, 1 mg of total protein was incubated with 5 μg recombinant V5-tagged nanobody or 5–10 μg antibody of interest at 4 °C for 1 h. Subsequently, 15 μl anti-V5 agarose or protein G Sepharose was added to the sample and again incubated for 1 h at 4 °C. Next, 1 mg of cells transiently expressing EGFP-tagged nanobodies was lysed and then incubated with 5–10 μg antibody at 4 °C for 1 h. Subsequently, 15 μl protein G Sepharose was added to the sample and again incubated during 1 h at 4 °C. The beads were washed 4 times with lysis buffer, boiled for 5 min in Laemmli sample buffer, and proteins were fractionated by SDS-PAGE. Western blotting was performed as described [22]. Image J software was used to determine band intensity.
Immunostaining and microscopy of conjugates
Purified PBMCs were cultured with 2 μg/ml SEE and 15 ng/ml IL-2 for 4 days and subsequently cultured for 3 additional days in the presence of IL-2 only. For stimulation with B cells, PBMCs or Jurkat T cells were mixed at a 1:1 ratio in a total volume of 200 μl with Raji cells, which were pulsed with SEE (2 μg/ml) for 30 min and washed, or left nonpulsed as a negative control. This cell mixture was incubated for 40 min at 37 °C in RPMI 1640 medium supplemented with only 0.5 % fetal bovine serum. For stimulation with beads, the cells were mixed with CD3/CD28 Dynabeads® at a ratio of 1:4 for the PBMCs and 2:5 for the Jurkats and incubated for 15 min at 37 °C. After incubation, 1.5 ml of fixative (4 % paraformaldehyde and 2 % sucrose) was added to the conjugates. The mixture was incubated for 5 min at room temperature and then transferred onto poly-l-lysine-coated glass slides and centrifuged for 5 min at 2,000g. The coverslips were then washed with PBS + Ca/Mg with 0.1 M ammonium chloride, followed by 3 washings with PBS only. For most experiments, the Raji cells were first prelabeled with 25 μM far red DDAO-SE at 37 °C for 15 min. Cells were subsequently permeabilized with 0.1 % Triton X-100 in PBS, blocked in PBS-1 % BSA for 10 min at room temperature, and incubated with primary antibody for 1 h at 37 °C (anti-L-plastin, anti-α-tubulin, anti-γ-tubulin or anti-gelsolin antibody). Cells were washed with PBS, incubated with secondary antibody (Alexa 488/594-conjugated goat anti-mouse or anti-rabbit IgG) and/or Alexa Fluor 594 phalloidin for 30 min at room temperature. Nuclei were stained using DAPI (0.4 μg/ml). For LFA-1 staining, cells were placed in 50 % ice-cold MeOH-PBS, then immediately washed with PBS and subsequently placed in 100 % ice-cold MeOH for 5 min.
Stained cells were analyzed using a Carl Zeiss Axiovert 200 M Apotome epifluorescence microscope or an Olympus IX-81 laser scanning confocal microscope. The Zeiss epifluorescence microsope is equipped with an Axiocam cooled charge-coupled device (CCD) camera and data processing was done with Axiovision software (Zeiss). Images, acquired on the Olympus confocal microscope were analyzed using Fluoview 1000 software. The stepsize of the Z stacks was 0.5 μM and the dimension of the IS was defined as the maximal length (L) of F-actin accumulation across the synapse through all slices. The cell–cell contact area was measured by counting the number of z-slices that show F-actin staining, multiplied by the stepsize between each slice (Z), and the previous measurement of actin enrichment length (L). LFA-1 enrichment was defined as the intensity of LFA-1 at the IS, divided by the background intensity of the cell. For determination of the angle of alignment, conjugated cells were first aligned on the x-axis, and then the angle between the x-axis and a region of interest (ROI) line, linking the MTOC and the cell back point located on the cell median, was determined by Olympus software in the “Measurements” section.
Statistical analysis
Statistical analysis was performed with the unpaired Student’s t test (Instat; GraphPad Software).
Results
Nanobodies target highly expressed actin-binding proteins in hematopoietic cells
We previously described camelid single-heavy chain antibodies (nanobodies) targeting L-plastin (LPL) and gelsolin (GSN) as a tool to disrupt intracellular functions. L-plastin nanobody 5 (LPL Nb5) blocks the F-actin bundling activity of L-plastin (K d 40 nM) and L-plastin nanobody 9 (LPL Nb9) interacts with the N-terminally located EF-hands (K d 80 nM) in a calcium-dependent manner [23] (Fig. 1). GSN Nb11 binds specifically monomeric gelsolin irrespective of the calcium concentration (K d 5 nM) whereas GSN Nb13 only recognizes calcium-activated gelsolin (K d 10 nM) [24]. These actin-binding proteins are highly expressed in hematopoietic cells (Supplementary Fig.S1). The availability of high affinity nanobodies targeting specific properties of gelsolin and L-plastin prompted us to first investigate the localization of these two actin-binding proteins at the IS. To this end, Staphylococcus enterotoxin E (SEE)-pulsed Raji cells (Burkitt’s Lymphoma B cells) were conjugated with peripheral blood mononuclear cells (PBMCs). L-plastin was highly enriched at the IS and showed nearly perfect colocalization with F-actin (Fig. 2a, upper panels). The presence of gelsolin at the IS, another well-known actin-binding protein with capping and severing activities, has not yet been investigated. Gelsolin enrichment at the IS was much less pronounced as compared to L-plastin, although gelsolin clearly relocalized at the IS (Fig. 2a, lower panels). To test the efficacy towards their respective antigens in PBMCs, the four recombinant V5-tagged nanobodies were incubated with extracts of PBMCs and the immunoprecipitated samples were subsequently analyzed by western blot (Fig. 2b). As expected, GSN Nb11 and 13 recognized gelsolin and actin-bound gelsolin, respectively, although the amount of actin-free gelsolin was much lower as compared to epithelial cells [24]. LPL Nb5 and 9 pulled down ‘free’ L-plastin, not associated with actin (Fig. 2b). In order to investigate the effect of GSN Nb11/13 or LPL Nb5/9 on the formation and function of the IS, we expressed EGFP-tagged LPL Nbs and GSN Nbs in Jurkat T cells by transfection of nanobody cDNAs. Immunoprecipitation experiments were performed to determine the expression level of Nbs in cells and to confirm their efficacy to pull-down their respective antigens. As shown in Fig. 2c, GSN Nb11, LPL Nb5 and 9 were efficiently expressed and at a similar level. GSN Nb13 was poorly expressed compared to other nanobodies and was therefore excluded from further analysis. L-plastin was observed but to a lesser extent for Nb9 compared to Nb5.
Fig. 1.

Schematic diagram showing the structural domains of LPL and epitopes of the nanobodies. N-terminally located EF-hands (EF) and C-terminally located ABDs 1 en 2. Both ABDs are divided into two calponin homology (CH) domains. LPL Nb9 recognizes the EF-hands; LPL Nb5 binds the two ABDs combined
Fig. 2.

L-plastin and gelsolin nanobodies interact with their target when expressed in cells. a SEE-pulsed PBMCs were incubated with SEE-pulsed superantigen-presenting cells (Raji cells) for 45 min to allow conjugation. The cells were then stained for actin (phalloidin-alexa 594, red) and L-plastin or gelsolin (alexa-488, green). T T cell, R Raji cell. Bar 10 μm. b PBMCs were incubated with recombinant V5-tagged LPL, GSN or EGFP nanobodies which were recovered from the lysate by binding to anti-V5 agarose beads. Western blot stained for gelsolin, L-plastin and actin show proteins that were co-immunoprecipitated by the nanobodies. c Lysates of EGFP-tagged GSN Nb11, LPL Nb5- or LPL Nb9 or EGFP transfected Jurkat T cells were incubated with an EGFP antibody, followed by binding on protein G Sepharose. The blot was stained for gelsolin, L-plastin or EGFP. These data are representative of three independent experiments. CL crude lysate
LPL Nbs reduce proliferation and IL-2 secretion after primary T cell activation
To investigate if nanobodies were able to induce a defect in T cell activation, we performed a proliferation and IL-2 secretion assay. In the proliferation assay, (mother) T cells were stimulated with Dynabeads® CD3/CD28 or SEE toxin for 8 h and the amount of (daughter and mother) cells was determined by flow cytometry. Whereas the proliferation ratio in the absence of CD3+/CD28+ beads or SEE peptide was around 1, the proliferation ratio of EGFP or GSN Nb11 transfected cells was at least three times higher (Fig. 3a, b), indicating that GSN Nb11 has no effect. The ratio in LPL Nb transfected cells was reduced by 40 % (Nb9) and by approximately 25 % (Nb5) (Fig. 3a, b). This defect in proliferation could be observed for both Dynabeads and SEE stimulation. Secretion of IL-2 was reduced by approximately 50 % for LPL Nb5 and 9 (Fig. 3c). However, GSN Nb11 showed no effect. These findings indicate that both LPL Nbs diminish T cell activation.
Fig. 3.

LPL Nbs induce a proliferation defect and a decrease in the secretion of IL-2. EGFP, GSN Nb11, LPL Nb5 or LPL Nb9 transfected PMBCs (or: human T cells) were stimulated for 8 h with Dynabeads® CD3/CD28 (a) or SEE toxin (b). The stimulated cells were then fluorescently labeled with a far red dye (day 0). At day 3, proliferated cells were stained with anti-CD3 to target the CD3-positive T cell population and subsequently analyzed by flow cytometry. a, b Left panel: bar graph of the proliferation ratio (cell number of the daughter population/cell number of the mother population) for the different transfected conditions. Right panel: histogram showing the reduced amount of cells in the daughter population for LPL Nb5 (dashed line) or LPL Nb9 (solid line) transfected cells compared to the control (EGFP) transfected cells (gray). c Bar graph showing secreted IL-2 determined by Elisa for Dynabeads® CD3/CD28 (left graph) or SEE (right graph) stimulated T cell supernatant. These data are representative of three independent experiments. Error bars mean ± SEM (*p < 0.05; **p < 0.01; ***p < 0.001)
L-plastin nanobodies perturb IS formation and decrease the cell–cell contact area
Since LPL Nbs bind with high affinity to functional/structural domains in plastin, we set out to examine which functions of plastin contribute to formation of the IS between antigen-presenting cells and T cells. As shown in Fig. 4a, EGFP transfected Jurkat cells conjugated with SEE-pulsed Raji cells displayed a ring structure highly enriched in F-actin whereas no enrichment was observed in T cells conjugated with unstimulated Raji cells (Fig. 4a, upper panels). In T cells expressing LPL Nb5 or 9, F-actin enrichment was still observed although the ring was reduced in size (Fig. 4a, lower panels), compared to control conditions. L-plastin was still present at cell–cell contacts (Fig. 4b). However, this enrichment was much less striking because the contact zone was reduced. In conjugated PBMC-Raji cells, the same phenomenon could be observed (Fig. 4c). Similar results were obtained when the cells were activated by incubation with CD3/CD28 Dynabeads® (Supplementary Figs. S2 and S3). We conclude that LPL Nbs disrupt IS structure without disturbing the localization of L-plastin.
Fig. 4.

LPL Nb-expressing T cells are unable to form a normal IS. a, b Jurkat T cells transfected with EGFP, LPL Nb5-EGFP or LPL Nb9-EGFP were incubated for 40 min with SEE-pulsed (+SEE) or unstimulated (−SEE) superantigen-presenting cells (Raji cells) and stained for actin (phalloidin-alexa 594, red) (a) or L-plastin (Alexa-594, red) (b). Transfected Jurkat cells are depicted in green (EGFP) and the nuclei were stained with DAPI. The pictures were acquired with an epifluorescence microscope and are representative for three independent experiments. Bar 10 μm. c PBMCs expressing GSN Nb11 or LPL Nb5 were primed with SEE and conjugated with SEE-pulsed Raji cells as described and stained for L-plastin (alexa-594, red) or actin (phalloidin-alexa 594, red). In the merged pictures, PBMCs expressing the EGFP-tagged nanobodies are shown in green and the Raji’s are shown in magenta (far red). The pictures were acquired with a laser scanning confocal microscope and are representative for three independent experiments. Bar 10 μm. d Confocal images of conjugated Jurkat cells expressing LPL Nbs or EGFP. Left panel Raji cells are shown in magenta (far red) and transfected Jurkat cells in green (EGFP). Right panel Z-dimensional acquisition for actin (alexa-594, red) and EGFP (green) staining, followed by projection on the Z-axis. Bar 5 μm. e Representation of the relative actin intensity profile as a function of the length (μm) measured on the Z-dimensional acquisition (as described in d, right panel) for EGFP (solid line) and LPL Nb5 (dashed line). f Bar graph of the IS length (measured with the method described in b) obtained for different conjugated cells (n = 20) in each condition from three independent experiments. g Representation of the cell–cell contact area. The area was calculated from the two different values (L and Z); L being the value obtained in b, and Z being the actin length measurement obtained from the z-dimensional acquisitions (described in “Materials and Methods”). h Representation of the IS area of conjugated cells (n = 20) for EGFP, GSN Nb11, LPL Nb5 or LPL Nb9 transfected cells from three independent experiments. Error bars mean ± SEM. Unpaired t tests were performed to observe statistical differences in the area of the IS between cells expressing EGFP and cells expressing a nanobody (*p < 0.05; **p < 0.01; ***p < 0.001)
Since LPL Nb5 and 9 target different epitopes and therefore may affect formation of the IS in different ways, we sought an objective approach to quantify the observed effects. We performed a conjugation assay with transfected Jurkat T cells and fluorescently prelabeled SEE-pulsed Raji cells. Using confocal microscopy and F-actin intensity profile analysis at the IS, we measured IS length between conjugated cells (Fig. 4d, e). For cells expressing EGFP or GSN Nb11, the length of the IS was approximately 12 μm, whereas the length reached only 8 μm in case of LPL Nb5 or 9, implying a 33 % decrease (Fig. 4f). Considering the IS area as an oval, we measured the second parameter (Z) using Z-dimensional acquisition. Mostly, this parameter was very similar to the length measured on the y-axis (L) (Fig. 4g). The area for EGFP and GSN Nb11 transfected cells was calculated at 100 μm2 whereas the area measured for both LPL Nb transfected cells was only 50 μm2 (Fig. 4h). This suggests that both LPL Nbs induce a similar phenotype on IS structure, reducing the cell–cell interaction area.
LPL Nb expressing T cells fail to properly complete MTOC polarization towards antigen presenting cells
Another important parameter reflecting appropriate T cell-APC interaction is polarization of the T cell towards the target cell followed by recruitment of the MTOC to the T cell membrane in front of the target cell center (MTOC docking) [25]. We stained conjugated cells with alpha- (Supplementary video S1a, b) and gamma-tubulin (Fig. 5a) to visualize microtubules and the MTOC, followed by Z-dimensional acquisition. In LPL Nb expressing T cells, we observed that the MTOC was recruited in the direction of the target cell. However, we noticed a positional defect (Fig. 5a) since the MTOC was skewed away from the pSMAC center as compared to control cells (Supplementary video S1a, b). To quantify this observation, we measured the angle between the axis passing through the MTOC and the back of the T cell on the one hand and the median of the target cell on the other hand. If final cell–cell polarization is well established, this angle is close to 0°, which is the case for the control (EGFP and GSN Nb11) conditions where the angle is ±5° (Fig. 5b). For LPL Nb5 and 9, this angle was increased to ±15°. Therefore, LPL Nb5 and 9 impede MTOC apposition (also called MTOC final docking), which is an important prerequisite for efficient interaction and T cell activation.
Fig. 5.

LPL Nbs promote a defect in centrosome docking. Jurkat cells transfected with EGFP, GSNNb11-, LPL Nb5- or LPL Nb9-EGFP were incubated during 45 min with SEE-pulsed Raji cells which were prelabeled with a fluorescent far red dye. a Confocal images of conjugated cells expressing LPL/GSN Nbs or EGFP. Left panel Raji cells are shown in magenta (far red) and transfected Jurkat cells in green (EGFP). Right panel Z-dimensional acquisition for gamma-tubulin (red) and EGFP (green) staining, followed by projection on the Z-axis. Bar 5 μm. b Bar graph representing the angle measurement between the X-axis and the line linking the centrosome to the center point of the cell extremity (see “Materials and Methods”). Representation of conjugated cells (n = 20) angle measurements for the different conditions from three independent experiments. Error bars mean ± SEM. Unpaired t tests were performed to observe statistical differences in the area between the cells expressing EGFP and the cells expressing (different) nanobodies (*p < 0.05; **p < 0.01; ***p < 0.001)
L-plastin Nb5 disrupts the interaction between L-plastin and calmodulin
To unravel the molecular basis how both LPL Nbs perturb IS formation, we investigated the interaction between L-plastin and different proteins that were previously shown to be crucial for IS formation. Calmodulin binds LPL and stabilizes its presence at the IS [8]. We performed immunoprecipitation assays in the presence or absence of calcium. As shown in Fig. 6a (lane 4) and b (lanes 4–5), calmodulin co-immunopreciptated LPL and vice versa. The calmodulin-plastin interaction was not disrupted when LPL Nb9 was used to immunoprecipitate LPL. The interaction was stronger in the presence of EGTA (compare Fig. 6a, lane 6 with b, lane 7), as demonstrated before [8]. LPL Nb9 requires calcium for optimal binding which explains the low amount of LPL when EGTA was added. Interestingly, calmodulin was not present in the Nb5 immunoprecipitate indicating that calmodulin-LPL interaction was prevented by Nb5 (Fig. 6a, b).
Fig. 6.

LPL Nb5 disrupts the interaction between L-plastin and calmodulin. a Lysates from untransfected Jurkat cells were incubated with IgG, monoclonal LPL (mLPL), calmodulin (CaM) antibody or LPL Nb5/9 nanobodies. No EGTA was added to the lysate. The blots were stained for LPL and calmodulin. b Co-immunoprecipitations as described in (a) were performed in the presence of EGTA to immunoprecipitate calcium-free LPL. A polyclonal LPL antibody (pLPL) was used to visualize calcium-free LPL. Blots are representative for 3 independent experiments. c, d Lysates from Jurkat cells were incubated with mLPL, pLPL or CaM antibody and LPL Nb5/9 nanobodies in the absence (c) or presence (d) of EGTA in an actin co-immunoprecipitation experiment. Blots are representative for 2 independent experiments. Densitometry was used to determine band intensity. CL crude lysate, LC IgG light chain
Bundling of actin filaments by L-plastin is negatively regulated by Ca2+ [9]. The western blots in Fig. 6c, d reveal that both Nb5 and 9 interact with actin-free LPL, which offers a possible explanation for their inhibitory effect as the bundling activity of LPL is important for IS formation [7, 8, 26, 27].
LPL Nb5 reduces LFA-1 interaction with plastin and LFA-1 enrichment at the IS
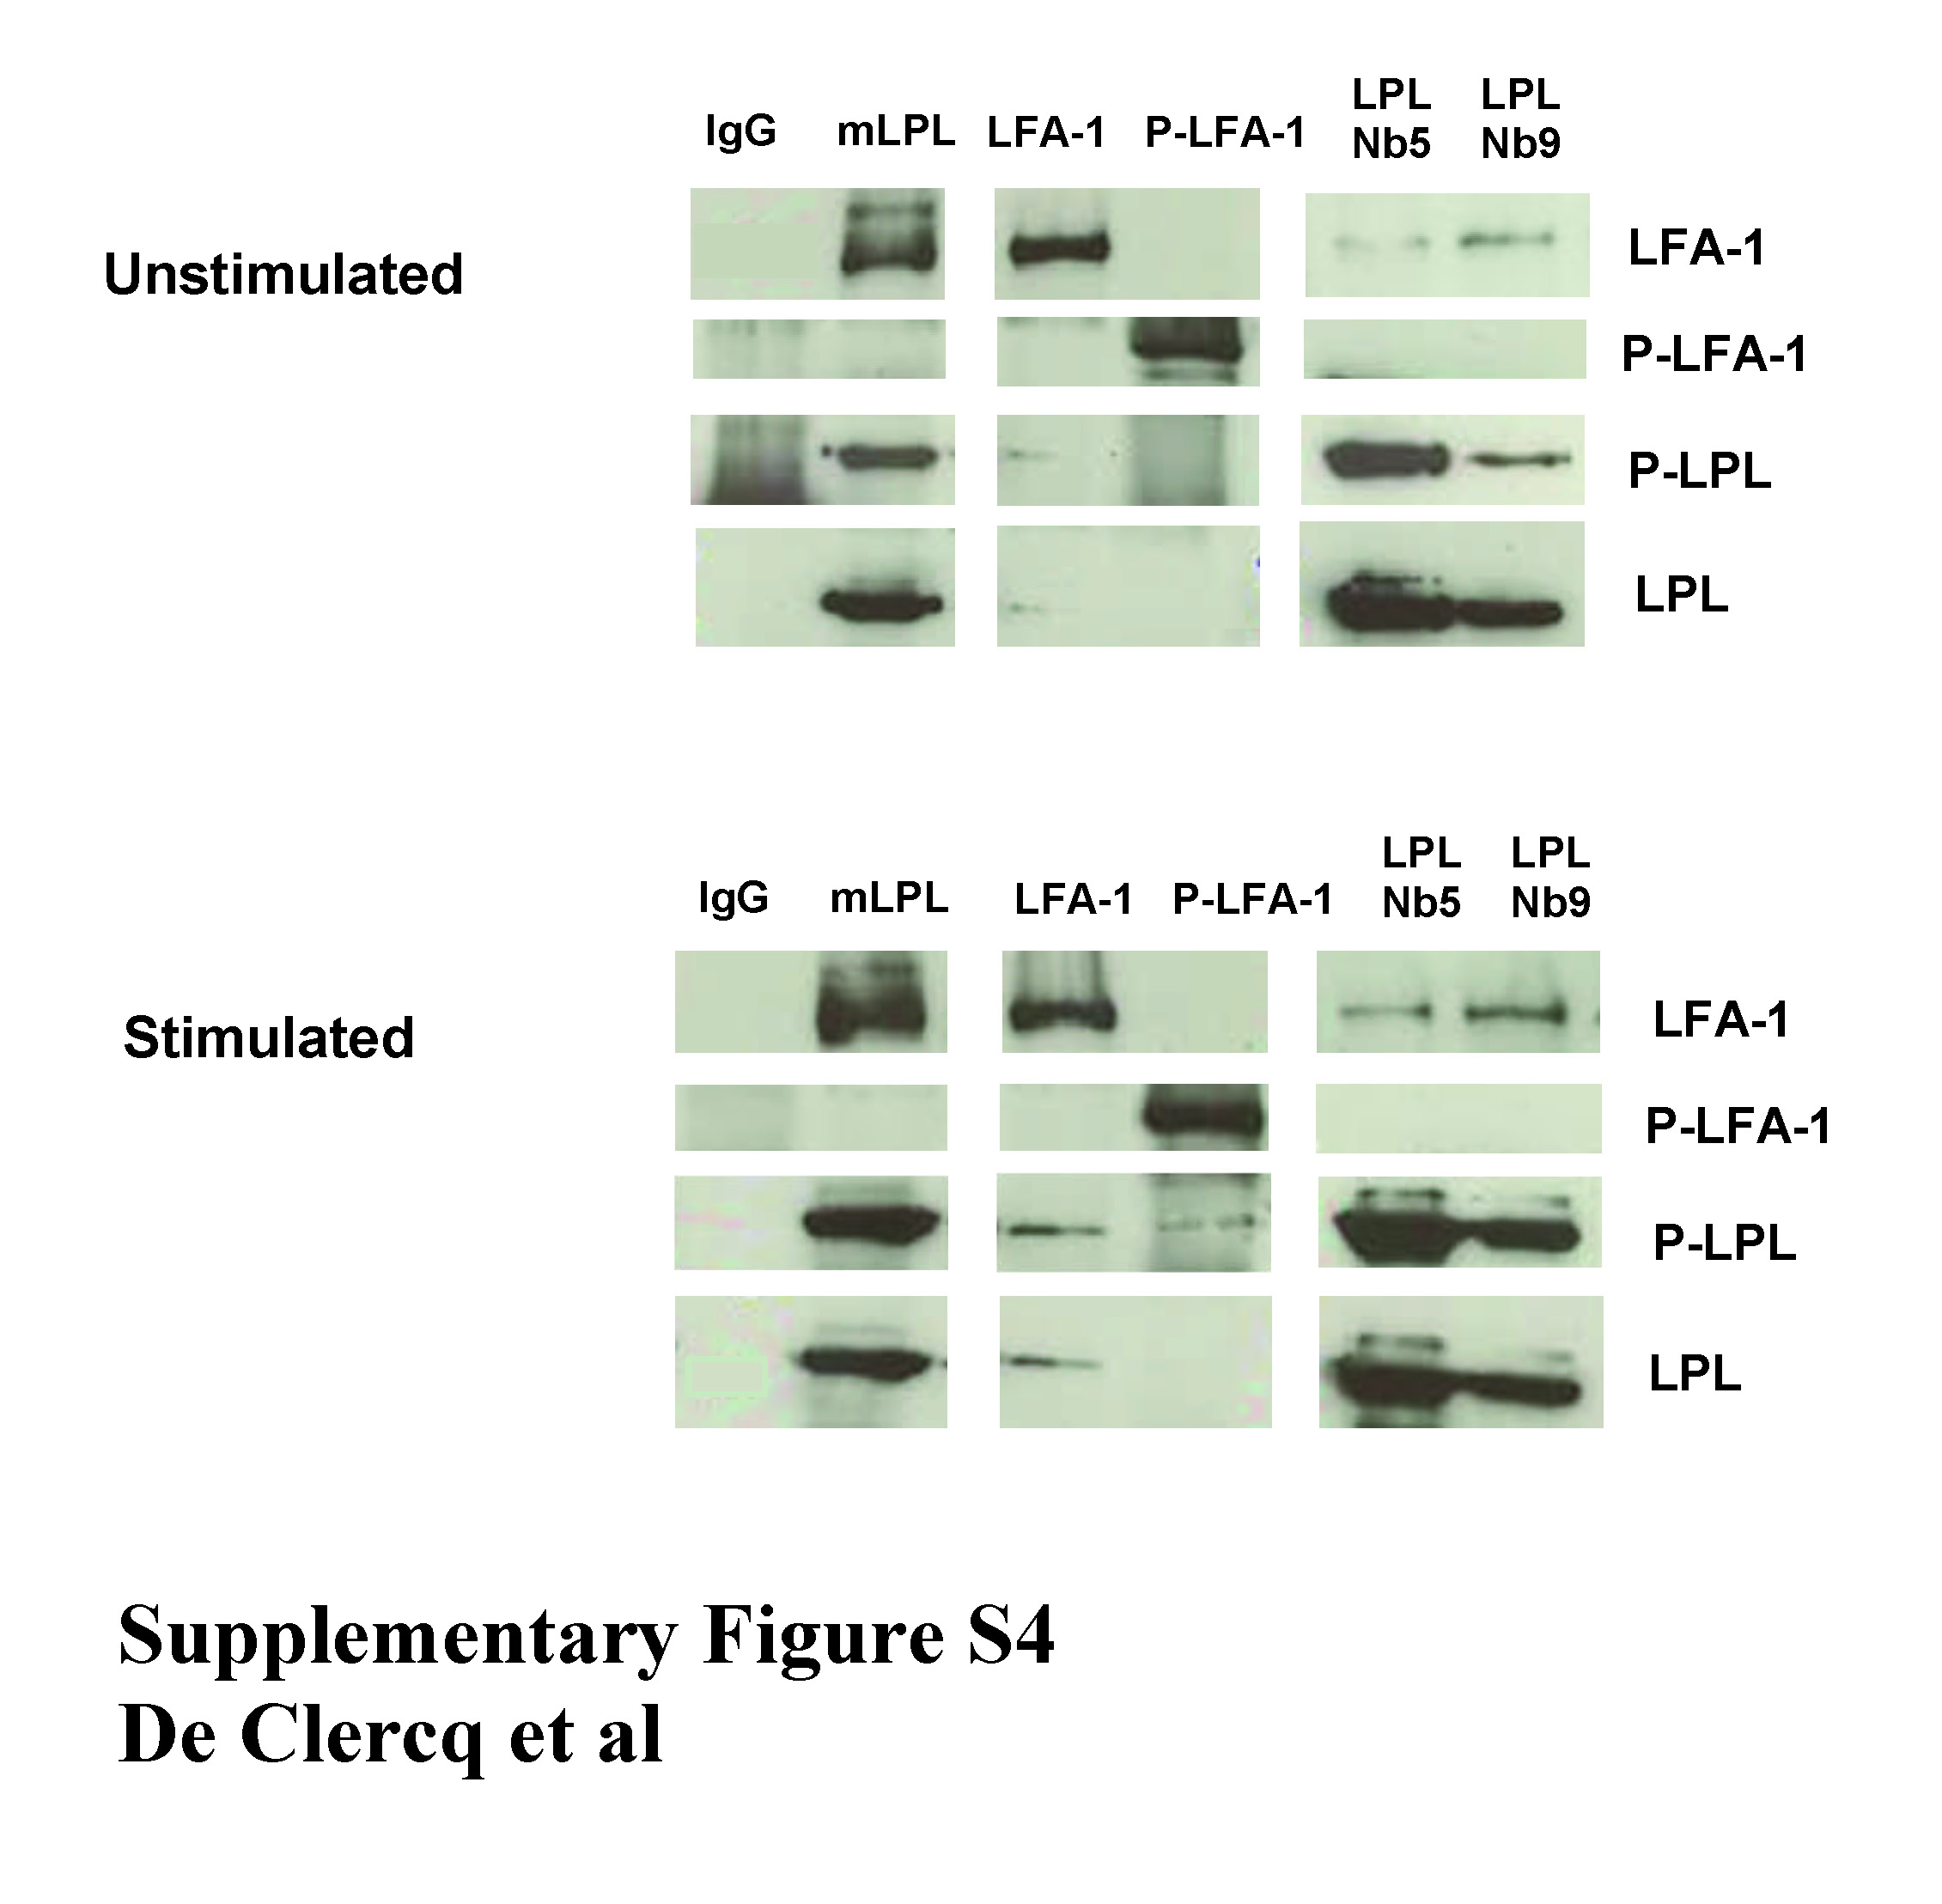
Recently, LFA-1 has been described as a new LPL partner forming a complex together with calmodulin which is crucial for IS maintenance [8]. Since LPL Nb5 inhibits the interaction with calmodulin, and considering the LPL Nb-induced effect on the immunological synapse, we hypothesized a defect in cell–cell adhesion. We therefore investigated the interaction between LPL and LFA-1. In immunoprecipitation assays, we observed that LFA-1 interacts with LPL, and this interaction was decreased for LPL Nb5 compared to Nb9 (Supplementary Fig. S4). The interaction was persistent in control (unstimulated) cells or cells that were stimulated. Moreover, an interaction between phosphorylated L-plastin and phosphorylated LFA-1 (CD18) could be shown in stimulated T cells, but not in unstimulated cells (Supplementary Fig. S4).
We also noticed LFA-1 enrichment at the IS of conjugates (Fig. 7a). T cells expressing EGFP showed an enrichment of LFA-1 at the interface of the two interacting cells (Fig 7a, upper panel). This was also the case for cells expressing LPL Nb9 (Fig. 7a, bottom panel). However, cells expressing LPL Nb5 showed a significant decrease in the amount of LFA-1 at the IS (Fig. 7a, middle panel). The intensity of LFA-1 at the IS, compared to the background intensity of the cell, was approximately 4 times higher for cells showing LFA-1 enrichment at the IS. For cells showing no LFA-1 accumulation, this ratio was close to 1. Approximately 80 % of conjugates expressing EGFP or GSN Nb11 showed LFA-1 enrichment at the IS (Fig. 7b). In case of LPL Nb9, the percentage of cells showing enrichment was reduced to 62 %. Cells expressing LPL Nb5, however, showed LFA-1 enrichment in only 4 % of the observed cell couples. This result highlights a new disrupting function for LPL Nb5.
Fig. 7.

LPL Nb5 prevents LFA-1 enrichment at the IS. a EGFP, LPL Nb5 or LPL Nb9 EGFP-tagged transfected Jurkat T cells were incubated for 45 min with SEE-pulsed Raji cells and subsequently stained for LFA-1 (alexa 594, red). The merged pictures show the T cell in green and the Raji cell in magenta (far red). Bar 10 μm. b Accumulation of LFA-1 in the IS was calculated from 20 cell couples per condition. The percentage of conjugated cells showing LFA-1 accumulation in the IS is depicted
L-plastin Nb5 and 9 delay phosphorylation kinetics of L-plastin and LFA-1
L-plastin is phosphorylated on Ser5 (predominantly) and Ser7 in its amino-terminal region. The Ser5 phosphorylation site is unique in leukocytes and occurs only after cell stimulation with chemoattractants, suggesting that phosphorylation may be a specific mechanism of regulating LPL function in leukocytes [28, 29]. We investigated the localization of phosphorylated L-plastin in the IS using a Ser5 phospho L-plastin antibody [12]. An enrichment in phosphorylated L-plastin at the IS was observed in conjugated cells (Fig. 8a). We postulated that L-plastin phosphorylation could be influenced by one or both LPL Nbs. To this end, we performed a kinetic assay to investigate whether phosphorylation of L-plastin would be differentially regulated in LPL Nb expressing Jurkat T cells after CD3/CD28 stimulation. In control conditions (EGFP), a drastic increase in L-plastin phosphorylation was observed after 30 min, with a maximum at 60 min after which the signal decreased to basal levels (Fig. 8b). In contrast, LPL Nb5 and 9 expressing T cells consistently displayed delayed and reduced plastin phosphorylation. Plastin phosphorylation after 30 min was hardly detectable and the signal increased after 45 min with a maximum at 1 h after which phosphorylation again decreased. Assembly of the immunological synapse is a highly dynamic event and requires appropriate intracellular responses following receptor activation involving phosphorylation of various substrates. We investigated time dependent phosphorylation of various components of the TCR signaling pathway including p42/44 (Erk1/2), cofilin and Mek1/2 as well as LFA-1. LPL nanobodies did not affect phosphorylation of any of these proteins except for LFA-1 (Fig. 8b; Supplementary Fig. S5). Jurkat T cells expressing EGFP showed the strongest LFA-1 phosphorylation after 15 min of CD3/CD28 stimulation (Fig. 8b). Cells expressing LPL Nb9 showed the same kinetics. LPL Nb5 however induced a delay in LFA-1 phosphorylation with a maximum observed after 30 instead of 15 min (Fig. 8b, middle panel).
Fig. 8.

L-plastin and/or LFA-1 phosphorylation is delayed by LPL Nbs. a EGFP transfected Jurkat cells were incubated with SEE-pulsed Raji cells. The cells were stained with phospho-Ser L-plastin antibody (alexa 594, red). Bar 10 μm. Acquisition of conjugated cells was performed with a confocal microscope. The intensity profile of phosphorylated L-plastin (red line) and EGFP (green line) signal is shown as function of the length. b EGFP, LPL Nb5 and LPL Nb9 transfected T cells were stimulated for different periods of time with coated anti-CD3 (MEM92) and soluble anti-CD28. The blots were stained for phospho-L-plastin, phospho-LFA-1, phospho-p44/42 and total L-plastin as a loading control. The data are representative of three independent experiments. Band intensity was determined by densitometry in (b), and is expressed as phospho-LPL/total LPL
Discussion
In this study, we used a nanobody-based approach to investigate which functions of LPL are required for stabilizing the immunological synapse (actin-bundling, integrin binding or activation, calmodulin interaction) [30]. The specificity of our findings is supported by the nanomolar affinity of LPL Nbs and the observation that a Nb directed against gelsolin, an ubiquitous actin severing protein active in dynamic actin rearrangements which is also expressed in T cells and enriched at the IS, showed no effect on IS formation or F-actin enrichment.
LPL Nb expression in T cells led to a reduction in IL-2 secretion and T cell proliferation. As such, they extend the effects triggered by LPL expression modulation through knock-out or knock-down strategies [7, 8, 31], suggesting that in all these cases the same molecular pathway is targeted. This is further substantiated by normal proximal TCR signaling and associated phosphorylation of Akt/ZAP-70 in knock-out T cells [7] and unperturbed Erk1/2 activity in knock-out T cells or Nb expressing cells ([7]; this study). The observation that Jurkat cells failed to properly align their MTOC in close apposition with the antigen-presenting cell highlights two features associated with IS formation: (1) correct MTOC and Golgi orientation is required for polarized secretion of various molecules, including cytokines, by the T cell [32], and thus provides a possible explanation why levels of secreted IL-2 drop significantly in LPL Nb expressing T cells; and (2) synapse formation involves initial accumulation of actin, followed by its outward movement from the center to the pSMAC in coordination with MTOC movement towards the central synapse region [33, 34]. L-plastin may contribute to the conversion of an early cSMAC-associated cytoskeleton into a pSMAC with a tightly bundled actin cytoskeleton, blocking of which encumbers MTOC orientation. This notion is supported by the observation that LPL Nbs trigger a reduction in IS length and surface area, suggesting an inability of T cells to adequately generate a pSMAC. Interestingly, our findings resemble those of Tsun et al. [25] who recently demonstrated very similar defective final MTOC docking at the plasma membrane in cytotoxic T lymphocytes that lack the tyrosine kinase Lck. They showed that actin accumulates at the synapse but fails to clear into a pSMAC. L-plastin is one such candidate protein required for pSMAC actin ring strengthening. Through the action of both Nbs, this actin belt is weakened and unable to generate the forces needed to pull in the MTOC, followed by its subsequent docking.
Nanobodies that target the LPL N-terminal EF-hands or central actin binding domains perturbed IS formation, MTOC docking, IL-2 secretion and proliferation to the same extent, although their mode of action differs profoundly. LPL Nb9 predominantly binds with nM affinity to Ca2+-bound L-plastin, an inactive conformation of the protein that precludes actin bundling [9]. As shown in Fig. 6d, LPL Nb9 even prevented interaction between LPL and actin in contrast to a polyclonal LPL antibody, suggesting that LPL is irreversibly trapped. Sequestering this inactive L-plastin population reduces the available concentration capable of participating in cytoskeletal reorganization. This fuels the hypothesis that LPL copolymerization with actin brings LPL in the IS [8]. The actin binding domains of LPL are crucial for LPL-sustained IS formation in several ways. LPL Nb5 binds L-plastin irrespective of its activation by Ca2+. Earlier experiments showed that LPL Nb5 inhibits F-actin bundling in vitro leading to strongly diminished filopodium formation in PC-3 prostate cancer cells [23]. In Jurkat T cells, Nb5 reduced LFA-1/L-plastin interaction paralleled by significant loss of LFA-1 enrichment at the IS. This is not the case for LPL Nb9, indicating that trapping the LPL EF-hands does not prevent LFA-1 accumulation (Fig. 7). Thus, the ABDs of LPL very likely provide an interaction platform for LFA-1. Supporting evidence for a direct interaction between LPL and the beta chain of LFA-1(αLβ2) comes from a study showing that L-plastin binds to the cytoplasmic domain of integrins in vitro and in MCF-7 cells [35]. Binding occurred with LPL ABD1, ABD2 or ABD1+2, but not with the N-terminal region. Importantly, since Nb5 interacts only with ABD1+2, it follows that the binding sites for actin and LFA-1 on L-plastin are very likely non-overlapping. This is supported by a complete lack of actin association with LPL in the presence of Nb5 but only reduced association with LFA-1.
We confirmed the co-immunoprecipitation between LPL and calmodulin. CaM is thought to stabilize LPL at the immune synapse, and the interaction between both proteins appears to be required for stable accumulation of LFA-1 at the IS [8]. The reduced CaM-LPL interaction for LPL Nb5-expressing cells, compared to LPL Nb9, is consistent with the observed effects of LPL Nb5 on LFA-1 phosphorylation and localization at the IS.
LPL Nbs differentially delayed and reduced phosphorylation of Ser5 L-plastin and Ser745 LFA-1, suggesting that tight phosphorylation kinetics as well as turnover are critical for temporal and spacial control of IS formation. This is supported by other studies showing reduced myosin regulatory light chain phosphorylation (Ser19) in cells where Drp-1 expression was down-regulated [36], or delayed Lck or ZAP-70 phosphorylation kinetics in CD4-deficient [37] and CD2AP−/−-deficient T cells [38], respectively. In all these cases, immune synapse formation was impaired. Phosphorylation of LPL is known to increase its bundling activity, with striking phospho-plastin localization in actin-rich dynamic compartments [12]. This is corroborated here by enrichment of phospho-plastin in the synapse region (Fig. 8a). By deferring its phosphorylation, L-plastin is maintained longer in a low affinity state with diminished bundling activity, leading to reduced F-actin accumulation and defective (phospho-) plastin targeting to the IS.
In GM-CSF stimulated eosinophils, phosphorylated L-plastin upregulated αMβ2 integrin expression and increased cell migration, suggesting a link between LPL Ser5 phosphorylation and integrin activation [39]. In leukocytes, Ser5 plastin phosphorylation was shown to be required for activation of αMβ2 integrin-mediated adhesion of leukocytes [40]. LPL Nb5 not only delayed plastin phosphorylation but also LFA-1 phosphorylation. LFA-1 Ser745 phosphorylation is triggered by multiple PKC isozymes [41] and promotes JAB-1 release from LFA-1, leading to c-Jun activation [4]. Our findings suggest that LPL Nb5 affects LFA-1 phosphorylation by restraining its enrichment at the IS, triggered by a decreased LPL/LFA-1 interaction. This property is not shared by Nb9 and indeed Nb9 did not affect LFA-1 phosphorylation. LPL phosphorylation may restrict lateral mobility of β2 integrins through its enhanced bundling activity, associated with an increasingly ‘opaque’ actin cytoskeleton leading to increased LFA-1 clustering and activation. By perturbing LFA-1/LPL interaction as well as phosphorylation of LPL and LFA-1, Nb5 disturbs IS formation at various echelons. However, this is not mirrored by quantitative effects on IL-2 secretion or MTOC positioning above those elicited by Nb9.
In summary, although LPL Nb5 and 9 target 2 different domains, they trap an actin-free, non-functional LPL population in cells. In this scenario, LPL Nbs bind LPL during synapse formation and disrupt the equilibrium between active and inactive LPL (Fig. 9). This is confirmed by the absence of F-actin enrichment in the synapse and the complete lack of actin in LPL-Nb immunocomplexes. Furthermore, critical phosphorylation events are disturbed, leading to ineffective synapse formation and T cell signaling. We therefore advocate nanobodies as a powerful tool to help explain how functions and structural modules of proteins contribute to formation of the IS, and as a stepping stone towards rational design of inhibitory compounds. Ideally, nanobodies proper could be developed further into a therapeutic format to block autoimmune disease-associated disproportionate T cell activation.
Fig. 9.

Schematic diagram depicting the contribution of LPL to IS formation and effect of nanobodies. a, b LPL phosphorylation enhances bundling activity and both nanobodies delay phosphorylation thereby keeping LPL longer in a low affinity state. c LFA-1 (CD11a/CD18) tethers to the cytoskeleton, in part through interaction with LPL. A tightly bundled actin cytoskeleton in the pSMAC limits free diffusion of LFA-1 and contributes to LFA-1 clustering. d LPL Nb5 and 9 interfere with LPL function in subtle ways leading to reduced interaction with LFA-1 and delayed phosphorylation (Nb5) or by blocking interaction with actin and maintaining LPL in an inactivated state (Nb9). In both cases, T cell activation is disturbed. For more details, see “Discussion”
Electronic supplementary material
Below is the link to the electronic supplementary material.
Suppl. Figure S1. L-plastin is a highly and specifically expressed protein in hematopoietic cells. Lysates (10 µg) of PBMCs (monocytes and lymphocytes) from whole blood were analyzed by immunoblotting with gelsolin, fascin, L-plastin and CapG antibodies. (JPEG 274 kb)
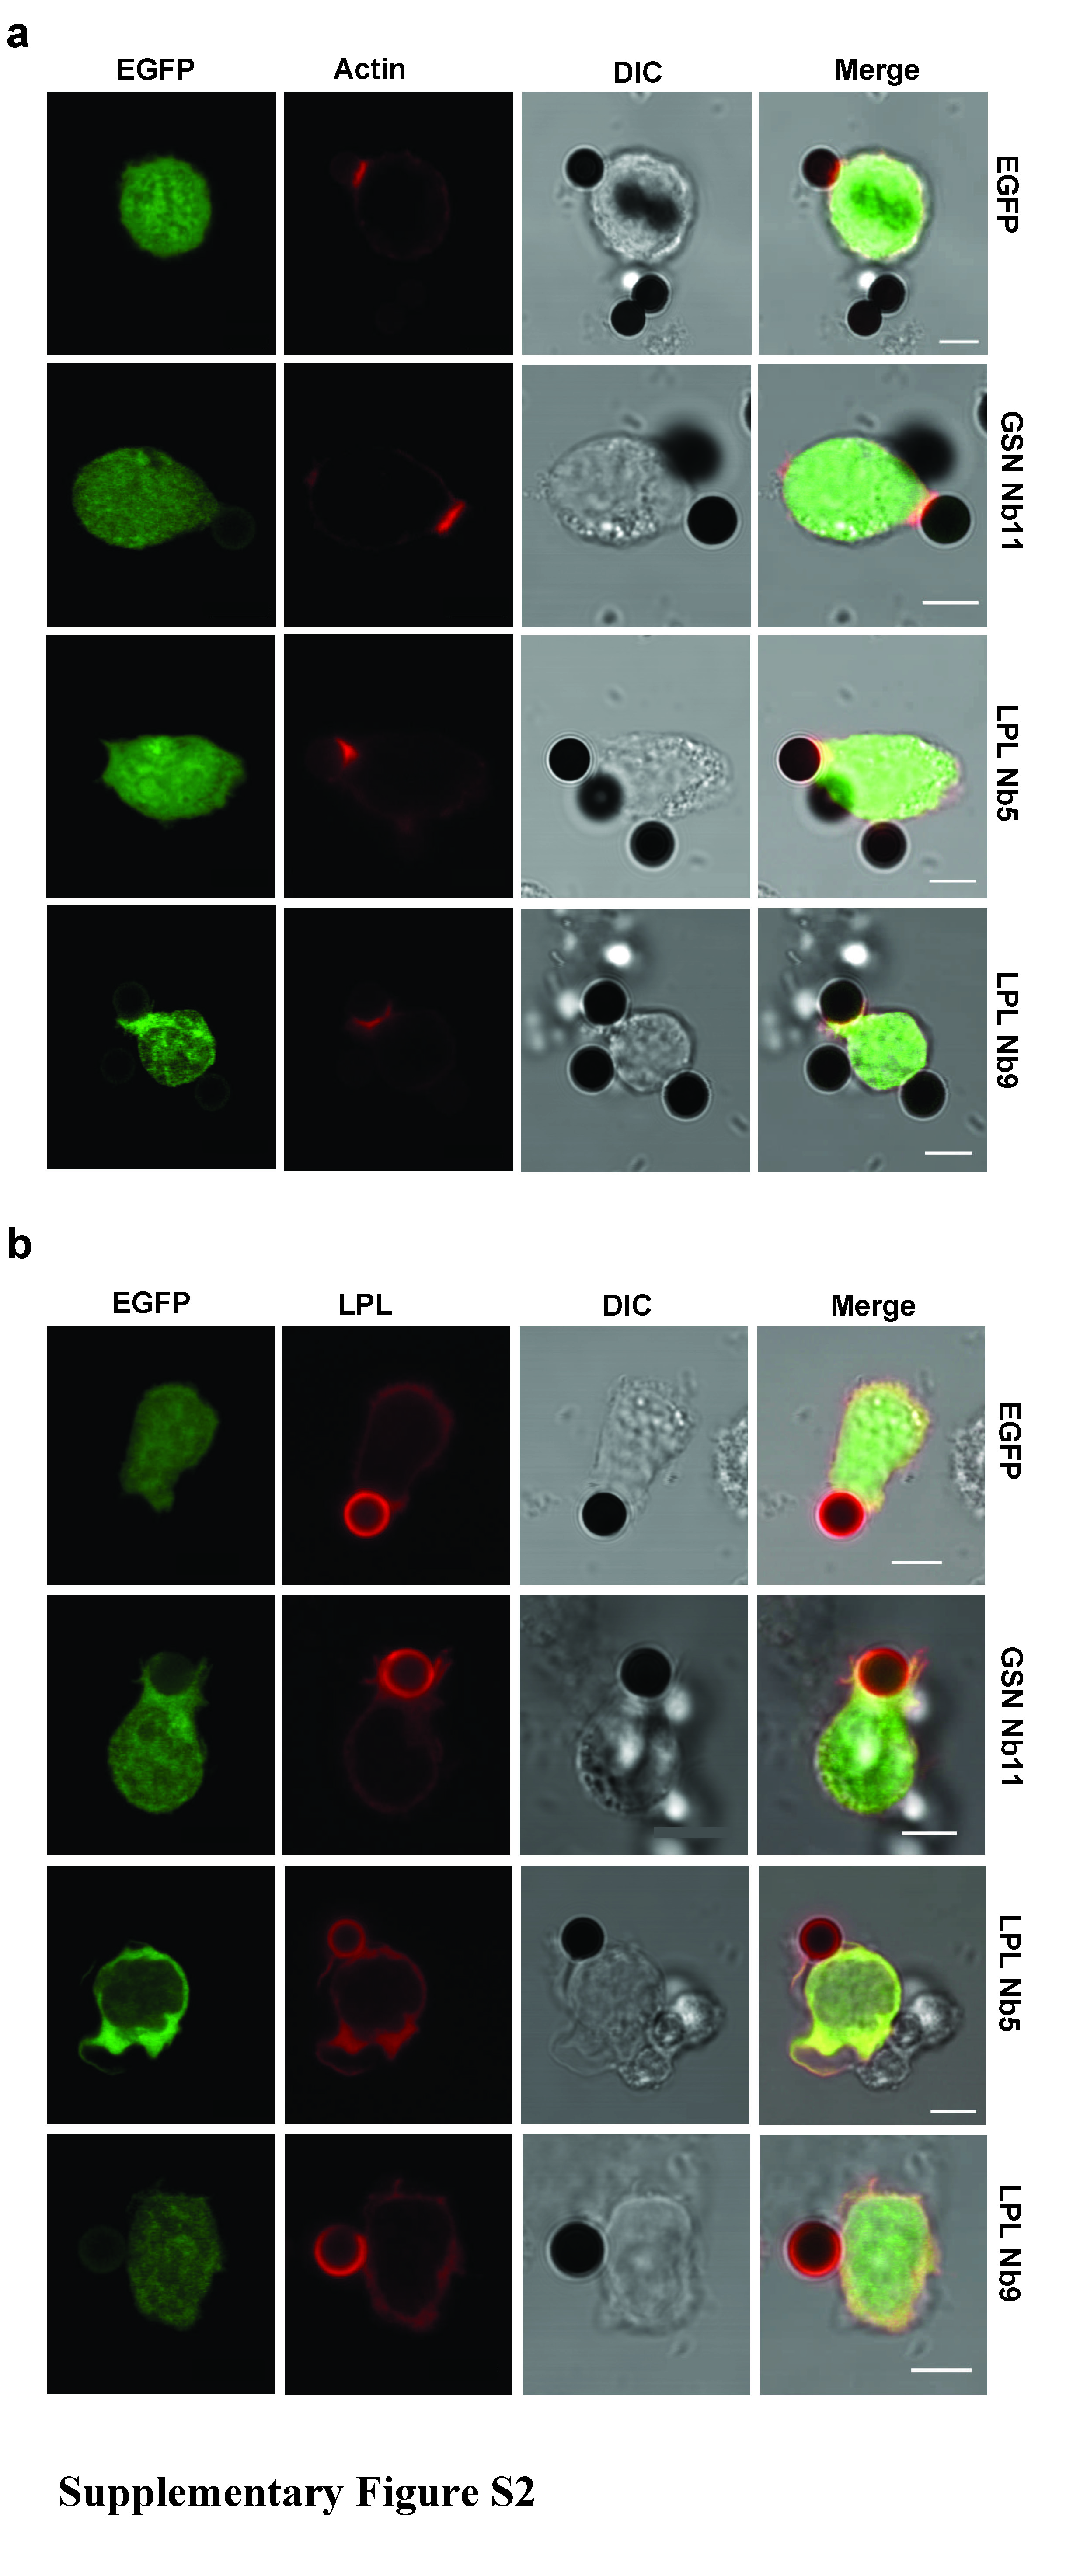
Suppl. Figure S2. Actin and LPL localization in Jurkat T cells, conjugated with CD3/CD28 Dynabeads ®. (a, b) Jurkat T cells transfected with EGFP, LPL Nb5-EGFP or LPL Nb9-EGFP were incubated for 15 minutes with CD3/CD28 Dynabeads® and stained for actin (phalloidin-alexa 594, red) (a) or L-plastin (Alexa-594, red) (b). Transfected Jurkat cells are depicted in green (EGFP) and the beads can be seen (in black) in the DIC and merged images. (Note the autofluorescence of the beads when stained for LPL.) The pictures were acquired with a laser scanning confocal microscope. Bar: 5 µm. (JPEG 1638 kb)
Suppl. Figure S3. Actin and LPL localization in PBMCs, conjugated with CD3/CD28 Dynabeads ®. (a, b) PBMCs transfected with EGFP, LPL Nb5-EGFP or LPL Nb9-EGFP were incubated for 15 minutes with CD3/CD28 Dynabeads® and stained for actin (phalloidin-alexa 594, red) (a) or L-plastin (Alexa-594, red) (b). Transfected PBMCs are depicted in green (EGFP) and the beads can be seen (in black) in the DIC and merged images. (Note the autofluorescence of the beads when stained for LPL.) The pictures were acquired with a laser scanning confocal microscope. Bar: 5 µm. (JPEG 1269 kb)
Suppl. Figure S4. Phospho-LFA-1 interacts with phospho-LPL in stimulated Jurkat T cells. Lysates from unstimulated and CD3/CD28 stimulated Jurkat cells were incubated with IgG, monoclonal LPL (mLPL), LFA-1 (CD18) and phospho-LFA-1 antibodies (P-LFA-1) and LPL Nb5/9 in an immunoprecipitation experiment. The blots were stained for LFA-1, phospho-LFA-1, phospho-LPL (P-LPL) and LPL. Blots are representative for 2 independent experiments. (JPEG 412 kb)
Suppl. Figure S5. LPL Nbs do not affect the phosphorylation of cofilin and MEK1/2. EGFP, LPL Nb5 and LPL Nb9 transfected T cells were stimulated for different periods of time (indicated on top) with coated anti-CD3 (MEM92) and soluble anti-CD28. The blots were stained for phospho-cofilin and phospho-MEK1/2. The data are representative of three independent experiments. (JPEG 440 kb)
Suppl. Video S1. EGFP or LPL Nb5-EGFP transfected Jurkat cells were incubated for 45 min with SEE-pulsed Raji cells which were prelabeled with a fluorescent dye. Acquisition of the conjugated cells (stained for alpha-tubulin (alexa 594 (red) and DAPI (blue)) was done along the z-axis. A 3D reconstruction of the cell-cell interaction for EGFP (A) and LPL Nb5 (B) transfected cells is shown. Note: Jurkat cells are the polarized, elongated cells directly in front of the Raji cells. (MPEG 1408 kb)
Acknowledgments
We thank Ciska Boucherie for technical support and dr. Leen Van Troys for helpful advice with confocal microscopy. We thank Dr. Evelyne Friedrich and Dr. Elisabeth Schaffner-Reckinger for the polyclonal rabbit IgGs against L-plastin and serine-5 phosphorylated L-plastin. Peter Van den Hemel is acknowledged for help with digital video processing. This work was supported by the Fund for Scientific Research-Flanders (FWO-Vlaanderen), the Stichting tegen Kanker (Belgium), the Concerted Actions Programme of Ghent University (GOA) and the Interuniversity attraction poles (IUAP06). SDC was supported by Ghent University.
Abbreviations
- ABD
Actin binding domain
- Akt
Protein kinase B
- CaM
Calmodulin
- CCD
Charge-coupled device
- CH
Calponin homology
- DDAO-SE
9-H-(1,3-dichloro-9,9-dimethylacridin-2-one-7-yl)-succinimidyl ester
- GSN
Gelsolin
- IS
Immune synapse
- LCK
Lymphocyte-specific protein tyrosine kinase
- LPL
L-plastin
- mLPL
Monoclonal L-plastin (antibody)
- pLPL
Polyclonal L-plastin (antibody)
- MTOC
Microtubule-organizing center
- Nb
Nanobody
- PKC
Protein kinase C
- R-PE
R-phycoerythrin
- SEE
Staphylococcus enterotoxin E
- SMAC
Supramolecular activation cluster
- pSMAC
Peripheral SMAC
- cSMAC
Central SMAC
Footnotes
Aude Guillabert and Jan Gettemans contributed equally to this work.
References
- 1.Grakoui A, Bromley SK, Sumen C, Davis MM, Shaw AS, Allen PM, Dustin ML. The immunological synapse: a molecular machine controlling T cell activation. Science. 1999;285(5425):221–227. doi: 10.1126/science.285.5425.221. [DOI] [PubMed] [Google Scholar]
- 2.Monks CR, Freiberg BA, Kupfer H, Sciaky N, Kupfer A. Three-dimensional segregation of supramolecular activation clusters in T cells. Nature. 1998;395(6697):82–86. doi: 10.1038/25764. [DOI] [PubMed] [Google Scholar]
- 3.Frauwirth KA, Thompson CB. Activation and inhibition of lymphocytes by costimulation. J Clin Invest. 2002;109(3):295–299. doi: 10.1172/JCI14941. [DOI] [PMC free article] [PubMed] [Google Scholar]
- 4.Perez OD, Mitchell D, Jager GC, South S, Murriel C, McBride J, Herzenberg LA, Kinoshita S, Nolan GP. Leukocyte functional antigen 1 lowers T cell activation thresholds and signaling through cytohesin-1 and Jun-activating binding protein 1. Nat Immunol. 2003;4(11):1083–1092. doi: 10.1038/ni984. [DOI] [PubMed] [Google Scholar]
- 5.Nurmi SM, Autero M, Raunio AK, Gahmberg CG, Fagerholm SC. Phosphorylation of the LFA-1 integrin beta2-chain on Thr-758 leads to adhesion, Rac-1/Cdc42 activation, and stimulation of CD69 expression in human T cells. J Biol Chem. 2007;282(2):968–975. doi: 10.1074/jbc.M608524200. [DOI] [PubMed] [Google Scholar]
- 6.Burkhardt JK, Carrizosa E, Shaffer MH. The actin cytoskeleton in T cell activation. Annu Rev Immunol. 2008;26:233–259. doi: 10.1146/annurev.immunol.26.021607.090347. [DOI] [PubMed] [Google Scholar]
- 7.Wang C, Morley SC, Donermeyer D, Peng I, Lee WP, Devoss J, Danilenko DM, Lin Z, Zhang J, Zhou J, Allen PM, Brown EJ. Actin-bundling protein L-plastin regulates T cell activation. J Immunol. 2010;185(12):7487–7497. doi: 10.4049/jimmunol.1001424. [DOI] [PMC free article] [PubMed] [Google Scholar]
- 8.Wabnitz GH, Lohneis P, Kirchgessner H, Jahraus B, Gottwald S, Konstandin M, Klemke M, Samstag Y. Sustained LFA-1 cluster formation in the immune synapse requires the combined activities of L-plastin and calmodulin. Eur J Immunol. 2010;40(9):2437–2449. doi: 10.1002/eji.201040345. [DOI] [PubMed] [Google Scholar]
- 9.Namba Y, Ito M, Zu Y, Shigesada K, Maruyama K. Human T cell L-plastin bundles actin filaments in a calcium-dependent manner. J Biochem. 1992;112(4):503–507. doi: 10.1093/oxfordjournals.jbchem.a123929. [DOI] [PubMed] [Google Scholar]
- 10.Leavitt J. Discovery and characterization of two novel human cancer-related proteins using two-dimensional gel electrophoresis. Electrophoresis. 1994;15(3–4):345–357. doi: 10.1002/elps.1150150154. [DOI] [PubMed] [Google Scholar]
- 11.Park T, Chen ZP, Leavitt J. Activation of the leukocyte plastin gene occurs in most human cancer cells. Cancer Res. 1994;54(7):1775–1781. [PubMed] [Google Scholar]
- 12.Janji B, Giganti A, De Corte V, Catillon M, Bruyneel E, Lentz D, Plastino J, Gettemans J, Friederich E. Phosphorylation on Ser5 increases the F-actin-binding activity of L-plastin and promotes its targeting to sites of actin assembly in cells. J Cell Sci. 2006;119(Pt 9):1947–1960. doi: 10.1242/jcs.02874. [DOI] [PubMed] [Google Scholar]
- 13.Grimbert P, Valanciute A, Audard V, Pawlak A, Legouvelo S, Lang P, Niaudet P, Bensman A, Guellaen G, Sahali D. Truncation of C-mip (Tc-mip), a new proximal signaling protein, induces c-maf Th2 transcription factor and cytoskeleton reorganization. J Exp Med. 2003;198(5):797–807. doi: 10.1084/jem.20030566. [DOI] [PMC free article] [PubMed] [Google Scholar]
- 14.Sester U, Wabnitz GH, Kirchgessner H, Samstag Y. Ras/PI3kinase/cofilin-independent activation of human CD45RA+ and CD45RO+ T cells by superagonistic CD28 stimulation. Eur J Immunol. 2007;37(10):2881–2891. doi: 10.1002/eji.200737206. [DOI] [PubMed] [Google Scholar]
- 15.Harmsen MM, De Haard HJ. Properties, production, and applications of camelid single-domain antibody fragments. Appl Microbiol Biotechnol. 2007;77(1):13–22. doi: 10.1007/s00253-007-1142-2. [DOI] [PMC free article] [PubMed] [Google Scholar]
- 16.Van Bockstaele F, Holz JB, Revets H. The development of nanobodies for therapeutic applications. Curr Opin Investig Drugs. 2009;10(11):1212–1224. [PubMed] [Google Scholar]
- 17.Hmila I, Saerens D, Ben Abderrazek R, Vincke C, Abidi N, Benlasfar Z, Govaert J, El Ayeb M, Bouhaouala-Zahar B, Muyldermans S. A bispecific nanobody to provide full protection against lethal scorpion envenoming. FASEB J. 2010;24(9):3479–3489. doi: 10.1096/fj.09-148213. [DOI] [PubMed] [Google Scholar]
- 18.Rasmussen SG, DeVree BT, Zou Y, Kruse AC, Chung KY, Kobilka TS, Thian FS, Chae PS, Pardon E, Calinski D, Mathiesen JM, Shah ST, Lyons JA, Caffrey M, Gellman SH, Steyaert J, Skiniotis G, Weis WI, Sunahara RK, Kobilka BK. Crystal structure of the beta2 adrenergic receptor-Gs protein complex. Nature. 2011;477(7366):549–555. doi: 10.1038/nature10361. [DOI] [PMC free article] [PubMed] [Google Scholar]
- 19.Hultberg A, Temperton NJ, Rosseels V, Koenders M, Gonzalez-Pajuelo M, Schepens B, Ibanez LI, Vanlandschoot P, Schillemans J, Saunders M, Weiss RA, Saelens X, Melero JA, Verrips CT, Van Gucht S, de Haard HJ. Llama-derived single domain antibodies to build multivalent, superpotent and broadened neutralizing anti-viral molecules. PLoS ONE. 2011;6(4):e17665. doi: 10.1371/journal.pone.0017665. [DOI] [PMC free article] [PubMed] [Google Scholar]
- 20.Van den Abbeele A, De Corte V, Van Impe K, Bruyneel E, Boucherie C, Bracke M, Vandekerckhove J, Gettemans J. Downregulation of gelsolin family proteins counteracts cancer cell invasion in vitro. Cancer Lett. 2007;255(1):57–70. doi: 10.1016/j.canlet.2007.03.023. [DOI] [PubMed] [Google Scholar]
- 21.Irobi J, Van Impe K, Seeman P, Jordanova A, Dierick I, Verpoorten N, Michalik A, De Vriendt E, Jacobs A, Van Gerwen V, Vennekens K, Mazanec R, Tournev I, Hilton-Jones D, Talbot K, Kremensky I, Van Den Bosch L, Robberecht W, Van Vandekerckhove J, Van Broeckhoven C, Gettemans J, De Jonghe P, Timmerman V. Hot-spot residue in small heat-shock protein 22 causes distal motor neuropathy. Nat Genet. 2004;36(6):597–601. doi: 10.1038/ng1328. [DOI] [PubMed] [Google Scholar]
- 22.Towbin H, Staehelin T, Gordon J. Electrophoretic transfer of proteins from polyacrylamide gels to nitrocellulose sheets: procedure and some applications. Proc Natl Acad Sci USA. 1979;76(9):4350–4354. doi: 10.1073/pnas.76.9.4350. [DOI] [PMC free article] [PubMed] [Google Scholar]
- 23.Delanote V, Vanloo B, Catillon M, Friederich E, Vandekerckhove J, Gettemans J. An alpaca single-domain antibody blocks filopodia formation by obstructing L-plastin-mediated F-actin bundling. FASEB J. 2010;24(1):105–118. doi: 10.1096/fj.09-134304. [DOI] [PubMed] [Google Scholar]
- 24.Van den Abbeele A, De Clercq S, De Ganck A, De Corte V, Van Loo B, Soror SH, Srinivasan V, Steyaert J, Vandekerckhove J, Gettemans J. A llama-derived gelsolin single-domain antibody blocks gelsolin-G-actin interaction. Cell Mol Life Sci. 2010;67(9):1519–1535. doi: 10.1007/s00018-010-0266-1. [DOI] [PMC free article] [PubMed] [Google Scholar]
- 25.Tsun A, Qureshi I, Stinchcombe JC, Jenkins MR, de la Roche M, Kleczkowska J, Zamoyska R, Griffiths GM. Centrosome docking at the immunological synapse is controlled by Lck signaling. J Cell Biol. 2011;192(4):663–674. doi: 10.1083/jcb.201008140. [DOI] [PMC free article] [PubMed] [Google Scholar]
- 26.Kuhn JR, Poenie M. Dynamic polarization of the microtubule cytoskeleton during CTL-mediated killing. Immunity. 2002;16(1):111–121. doi: 10.1016/S1074-7613(02)00262-5. [DOI] [PubMed] [Google Scholar]
- 27.Stinchcombe JC, Majorovits E, Bossi G, Fuller S, Griffiths GM. Centrosome polarization delivers secretory granules to the immunological synapse. Nature. 2006;443(7110):462–465. doi: 10.1038/nature05071. [DOI] [PubMed] [Google Scholar]
- 28.Shinomiya H, Hagi A, Fukuzumi M, Mizobuchi M, Hirata H, Utsumi S. Complete primary structure and phosphorylation site of the 65-kDa macrophage protein phosphorylated by stimulation with bacterial lipopolysaccharide. J Immunol. 1995;154(7):3471–3478. [PubMed] [Google Scholar]
- 29.Messier JM, Shaw LM, Chafel M, Matsudaira P, Mercurio AM. Fimbrin localized to an insoluble cytoskeletal fraction is constitutively phosphorylated on its headpiece domain in adherent macrophages. Cell Motil Cytoskeleton. 1993;25(3):223–233. doi: 10.1002/cm.970250303. [DOI] [PubMed] [Google Scholar]
- 30.Morley SC. The actin-bundling protein L-plastin: a critical regulator of immune cell function. Int J Cell Biol. 2012;2012:935173. doi: 10.1155/2012/935173. [DOI] [PMC free article] [PubMed] [Google Scholar]
- 31.Wabnitz GH, Kocher T, Lohneis P, Stober C, Konstandin MH, Funk B, Sester U, Wilm M, Klemke M, Samstag Y. Costimulation induced phosphorylation of L-plastin facilitates surface transport of the T cell activation molecules CD69 and CD25. Eur J Immunol. 2007;37(3):649–662. doi: 10.1002/eji.200636320. [DOI] [PubMed] [Google Scholar]
- 32.Kupfer A, Dennert G. Reorientation of the microtubule-organizing center and the Golgi apparatus in cloned cytotoxic lymphocytes triggered by binding to lysable target cells. J Immunol. 1984;133(5):2762–2766. [PubMed] [Google Scholar]
- 33.Griffiths GM, Tsun A, Stinchcombe JC. The immunological synapse: a focal point for endocytosis and exocytosis. J Cell Biol. 2010;189(3):399–406. doi: 10.1083/jcb.201002027. [DOI] [PMC free article] [PubMed] [Google Scholar]
- 34.Lasserre R, Alcover A. Cytoskeletal cross-talk in the control of T cell antigen receptor signaling. FEBS Lett. 2010;584(24):4845–4850. doi: 10.1016/j.febslet.2010.09.001. [DOI] [PubMed] [Google Scholar]
- 35.Le Goff E, Vallentin A, Harmand PO, Aldrian-Herrada G, Rebiere B, Roy C, Benyamin Y, Lebart MC. Characterization of L-plastin interaction with beta integrin and its regulation by micro-calpain. Cytoskeleton (Hoboken) 2010;67(5):286–296. doi: 10.1002/cm.20442. [DOI] [PubMed] [Google Scholar]
- 36.Baixauli F, Martin-Cofreces NB, Morlino G, Carrasco YR, Calabia-Linares C, Veiga E, Serrador JM, Sanchez-Madrid F. The mitochondrial fission factor dynamin-related protein 1 modulates T-cell receptor signalling at the immune synapse. EMBO J. 2011;30(7):1238–1250. doi: 10.1038/emboj.2011.25. [DOI] [PMC free article] [PubMed] [Google Scholar]
- 37.Holdorf AD, Lee KH, Burack WR, Allen PM, Shaw AS. Regulation of Lck activity by CD4 and CD28 in the immunological synapse. Nat Immunol. 2002;3(3):259–264. doi: 10.1038/ni761. [DOI] [PubMed] [Google Scholar]
- 38.Lee KH, Dinner AR, Tu C, Campi G, Raychaudhuri S, Varma R, Sims TN, Burack WR, Wu H, Wang J, Kanagawa O, Markiewicz M, Allen PM, Dustin ML, Chakraborty AK, Shaw AS. The immunological synapse balances T cell receptor signaling and degradation. Science. 2003;302(5648):1218–1222. doi: 10.1126/science.1086507. [DOI] [PubMed] [Google Scholar]
- 39.Pazdrak K, Young TW, Straub C, Stafford S, Kurosky A. Priming of eosinophils by GM-CSF is mediated by protein kinase CbetaII-phosphorylated L-plastin. J Immunol. 2011;186(11):6485–6496. doi: 10.4049/jimmunol.1001868. [DOI] [PMC free article] [PubMed] [Google Scholar]
- 40.Jones SL, Wang J, Turck CW, Brown EJ. A role for the actin-bundling protein L-plastin in the regulation of leukocyte integrin function. Proc Natl Acad Sci USA. 1998;95(16):9331–9336. doi: 10.1073/pnas.95.16.9331. [DOI] [PMC free article] [PubMed] [Google Scholar]
- 41.Fagerholm S, Morrice N, Gahmberg CG, Cohen P. Phosphorylation of the cytoplasmic domain of the integrin CD18 chain by protein kinase C isoforms in leukocytes. J Biol Chem. 2002;277(3):1728–1738. doi: 10.1074/jbc.M106856200. [DOI] [PubMed] [Google Scholar]
Associated Data
This section collects any data citations, data availability statements, or supplementary materials included in this article.
Supplementary Materials
Suppl. Figure S1. L-plastin is a highly and specifically expressed protein in hematopoietic cells. Lysates (10 µg) of PBMCs (monocytes and lymphocytes) from whole blood were analyzed by immunoblotting with gelsolin, fascin, L-plastin and CapG antibodies. (JPEG 274 kb)
Suppl. Figure S2. Actin and LPL localization in Jurkat T cells, conjugated with CD3/CD28 Dynabeads ®. (a, b) Jurkat T cells transfected with EGFP, LPL Nb5-EGFP or LPL Nb9-EGFP were incubated for 15 minutes with CD3/CD28 Dynabeads® and stained for actin (phalloidin-alexa 594, red) (a) or L-plastin (Alexa-594, red) (b). Transfected Jurkat cells are depicted in green (EGFP) and the beads can be seen (in black) in the DIC and merged images. (Note the autofluorescence of the beads when stained for LPL.) The pictures were acquired with a laser scanning confocal microscope. Bar: 5 µm. (JPEG 1638 kb)
Suppl. Figure S3. Actin and LPL localization in PBMCs, conjugated with CD3/CD28 Dynabeads ®. (a, b) PBMCs transfected with EGFP, LPL Nb5-EGFP or LPL Nb9-EGFP were incubated for 15 minutes with CD3/CD28 Dynabeads® and stained for actin (phalloidin-alexa 594, red) (a) or L-plastin (Alexa-594, red) (b). Transfected PBMCs are depicted in green (EGFP) and the beads can be seen (in black) in the DIC and merged images. (Note the autofluorescence of the beads when stained for LPL.) The pictures were acquired with a laser scanning confocal microscope. Bar: 5 µm. (JPEG 1269 kb)
Suppl. Figure S4. Phospho-LFA-1 interacts with phospho-LPL in stimulated Jurkat T cells. Lysates from unstimulated and CD3/CD28 stimulated Jurkat cells were incubated with IgG, monoclonal LPL (mLPL), LFA-1 (CD18) and phospho-LFA-1 antibodies (P-LFA-1) and LPL Nb5/9 in an immunoprecipitation experiment. The blots were stained for LFA-1, phospho-LFA-1, phospho-LPL (P-LPL) and LPL. Blots are representative for 2 independent experiments. (JPEG 412 kb)
Suppl. Figure S5. LPL Nbs do not affect the phosphorylation of cofilin and MEK1/2. EGFP, LPL Nb5 and LPL Nb9 transfected T cells were stimulated for different periods of time (indicated on top) with coated anti-CD3 (MEM92) and soluble anti-CD28. The blots were stained for phospho-cofilin and phospho-MEK1/2. The data are representative of three independent experiments. (JPEG 440 kb)
Suppl. Video S1. EGFP or LPL Nb5-EGFP transfected Jurkat cells were incubated for 45 min with SEE-pulsed Raji cells which were prelabeled with a fluorescent dye. Acquisition of the conjugated cells (stained for alpha-tubulin (alexa 594 (red) and DAPI (blue)) was done along the z-axis. A 3D reconstruction of the cell-cell interaction for EGFP (A) and LPL Nb5 (B) transfected cells is shown. Note: Jurkat cells are the polarized, elongated cells directly in front of the Raji cells. (MPEG 1408 kb)