

Abstract
Mammalian protease-activated-receptor-1 and -2 (PAR1 and PAR2) are activated by proteases found in the flexible microenvironment of a tumor and play a central role in breast cancer. We propose in the present study that PAR1 and PAR2 act together as a functional unit during malignant and physiological invasion processes. This notion is supported by assessing pro-tumor functions in the presence of short hairpin; shRNA knocked-down hPar2 or by the use of a truncated PAR2 devoid of the entire cytoplasmic tail. Silencing of hPar2 by shRNA-attenuated thrombin induced PAR1 signaling as recapitulated by inhibiting the assembly of Etk/Bmx or Akt onto PAR1-C-tail, by thrombin-instigated colony formation and invasion. Strikingly, shRNA-hPar2 also inhibited the TFLLRN selective PAR1 pro-tumor functions. In addition, while evaluating the physiological invasion process of placenta extravillous trophoblast (EVT) organ culture, we observed inhibition of both thrombin or the selective PAR1 ligand; TFLLRNPNDK induced EVT invasion by shRNA-hPar2 but not by scrambled shRNA-hPar2. In parallel, when a truncated PAR2 was utilized in a xenograft mouse model, it inhibited PAR1–PAR2-driven tumor growth in vivo. Similarly, it also attenuated the interaction of Etk/Bmx with the PAR1-C-tail in vitro and decreased markedly selective PAR1-induced Matrigel invasion. Confocal images demonstrated co-localization of PAR1 and PAR2 in HEK293T cells over-expressing YFP-hPar2 and HA-hPar1. Co-immuno-precipitation analyses revealed PAR1-PAR2 complex formation but no PAR1-CXCR4 complex was formed. Taken together, our observations show that PAR1 and PAR2 act as a functional unit in tumor development and placenta-uterus interactions. This conclusion may have significant consequences on future breast cancer therapeutic modalities and improved late pregnancy outcome.
Electronic supplementary material
The online version of this article (doi:10.1007/s00018-013-1498-7) contains supplementary material, which is available to authorized users.
Keywords: PAR1 PAR2, Protease, GPCR, Thrombin, Breast tumor
Introduction
G protein-coupled receptors (GPCRs) represent the largest family of cell surface receptors [1, 2] and are divided into six subfamilies (classes A–F) based on their ligand interaction and signature residues [3, 4]. Many class A subfamily are major drug targets [5] among which are mammalian protease-activated receptors (PARs). There are four PAR family members (PAR1–4), all of which are proteolytically activated at the N-terminal extra-cellular domain generating a new N-terminal site that functions as a tethered ligand by binding intramolecularly to the second loop of a given PAR [6]. Class A receptors are characterized by several features among which are conserved motifs in the third trans-membrane domain (TM3), three cytoplasmic loops (C1, C2, and C3), and a C-terminal tail (C4). X-ray structure of rhodopsin, a prototype of class A receptor, revealed the presence of a highly conserved amphipathic 8th helix (H8) within the C-tail that is likely to be physically interposed between the receptor and G protein [7]. Indeed, the H8 helix loop was also described in other class A receptors including PAR1 and PAR2 [8] and is formed by anchoring to the membrane by palmitoylation of the C-terminal cysteine residues.
Our view regarding the regulation and signaling of the large GPCR family has greatly evolved over the last several years. It has become apparent that while GPCRs switch between active conformations (capable of activating G proteins), and inactive conformations (that do not activate G-proteins) [9, 10]; additional options of activation exist. Adding to the complexity of GPCR signaling, it is now clear that GPCRs are capable of adopting more than one active conformation, in which each active state is capable of stimulating an overlapping yet distinct group of downstream effectors [9]. These properties are recapitulated by the discovery of biased-agonism/antagonism or as more frequently referred “biased-ligands”. This term has become synonymous with additional terms to indicate the more likely selective activation of GPCR signaling pathway for functional selectivity and including stimulus trafficking [11]. It allows an agonist to bind preferentially and stabilize one active signaling state over another, thus endowing the term activation in a more profound meaning, illustrating in-depth the dynamic nature of GPCR-stabilized signal activation.
Overall, the elucidation in recent years of the crystal structures of several archetypal GPCRs, such as rhodopsin [7], chemokine receptors, as well as others (such as: β2 and β1-adrenergic receptors; [12, 13], A2A adenosine receptor; [14, 15], dopamine D3 receptor; [16], and chemokine CXCR4 receptor; [17]) has provided new insights into the common features of general structures. It has become more evident that the significant differences and selectivity of receptors in fact relies on the extracellular/transmembrane ligand binding site determining a receptor with its unique features. In addition, the technology of high-resolution crystal structure of class A GPCRs demonstrated homodimer formation (as seen by the opioid receptors [18] and by CXCR4 [19]) and heterodimers. Evidence is accumulating showing that chemokine receptors, for example, can dimerize [19, 20]. CCR2 and CXCR4, which are more distantly related, form heterodimers as revealed by the observation that specific antagonists of one receptor inhibit the binding of chemokines to the other receptor [21]. The current emerging prospect is that dimers or oligomers of GPCRs are the functional units that interact with heterotrimeric G proteins and arrestins for signal generation and receptor desensitization. This form of heterodimer generation adds another layer of complexity to the regulation of GPCR signaling. GPCR heterodimerization affects receptor conformation and contributes to the activation of selective signaling, adding an extra level to the multifaceted action of GPCRs.
Members of the mammalian PAR family have been shown to form heterodimers. PAR1/PAR3 heterodimerization is required in endothelial cells for regulation of cell permeability in response to thrombin [22]. PAR1 and PAR4 also form stable heterodimeric complexes on the surface of platelets and PAR1 appears to assist in the activation of PAR4 in platelet-mediated thrombosis [23]. Recent studies suggest that PAR1 and PAR2, relatively distant receptors, exist in close proximity on the cell surface and can signal together during acute vascular inflammation [24]. The molecular basis for this interaction has been elucidated in endothelial cells, fibroblasts, and human embryonic kidney cells, whereby thrombin-cleaved PAR1 donates its tethered ligand to transactivate PAR2 [25, 26]. Although PAR2 is not activated directly by thrombin, the thrombin-generated PAR1-tethered ligand, SFLLRN, serves as an agonist for PAR2 [26, 27]. Sevigny et al. [28] have demonstrated that knocking-out PAR2 expression reduced neointimal vasculature hyperplasia induced by PAR1. Recently, it was demonstrated that PAR1 drives the trafficking behavior of PAR2, but not vice versa. Furthermore, thrombin activation of PAR1–PAR2 heterodimer results in co-internalization and β-arrestin recruitment, an event that is not observed with the activated PAR1 alone. Therefore, a biased and specific signaling response is demonstrated by PAR1–PAR2 inducing a distinct signaling β-arrestin recruitment [29].
Here, we demonstrate that PAR1-induced tumor-promoting processes depend on the presence of a PAR2. This was shown by either shRNA silencing of PAR2 expression or by the use of a truncated PAR2 construct. The importance of the PAR2 C-tail was evaluated in co-IP assays between PAR1 and signal proteins, colony formation in soft agar, migration and invasion, in vitro as well as tumor growth in a xenograft mouse model in vivo. Co-localization of PAR1–PAR2 was established by confocal immunofluorescence and co-IP between PAR1 and PAR2 but not CXCR4. It is well recognized in a physiological invasion process that placenta trophoblasts anchor to the uterus deciduas, in a similar manner as tumor cell invasion, providing an attractive model to study a highly regulated invasion scheme [30–32]. We demonstrate that shRNA-hPar2 silencing significantly inhibits thrombin-activated extravillous trophoblast (EVT) invasion in an organ culture system, recapitulating cytotrophoblast invasion in vivo. This was shown in the first-trimester trophoblasts that act in the establishment and bridging into the maternal tissues. Hence, PAR2 is also required for EVT invasion. Altogether, silencing of hPar2 expression or the use of a truncated PAR2 form modulates PAR1-induced tumor function. Our findings can be partially explained by the formation of PAR1–PAR2 functional unit, in PAR-driven breast tumor.
Experimental procedures
Cells
Breast cancer cells; MCF7, MDA-MB-231, and MDA-MB-468 (ATCC VA, USA) and HEK293T cells were maintained in DMEM with 10 % fetal calf serum. HU breast epithelial cells were generated by the late Dr. Aviva Horowitz of the Sharett-Institute of Oncology, Hadassah-Hebrew University Medical Center, Jerusalem.
Plasmids and transfection
A cDNA encoding wild-type human Par2 was kindly provided by Prof. Morley D. Hollenberg (Faculty of Medicine, University of Calgary, Canada). Truncated hPar2 were generated by insertion of a stop codon at position K348Z of hPar2. This was prepared by using QuikChange Lightning Site-Directed Mutagenesis Kit (Agilent Technologies Stratagene, Santa Clara, CA, USA) according to the manufacturer’s instructions. The designated primer used for inserting the stop codon TCA in hPar2 at position K348 is S348Z-5′-CGACCCCTTTGTCTAT TACTTTGTTTCACATGATTTCAGGG-3′. MCF7 (of endogenous hPar2) or HU (do not express either hPar1 or hPar2) cells were transfected with 1–2 μg of cDNA encoding wt human hPar1 or HA-tag-hPar1 or hPar2 or truncated hPar2 (devoid of the cytoplasmic tail), or T7-tag-etk/bmx or with a control pcDNA3 vector (Invitrogen, Carlsbad, CA, USA) using FuGene transfection reagent (Roche Molecular Biochemicals, Indianapolis, IN, USA). Transfected cells were selected with G418 (800 μg/ml) to obtain stable populations of cells expressing hPar1 and hPar2 or hPar1 and truncated hPar2.
RNA isolation and RT-PCR
RNA was isolated with Tri-Reagent (MRC, Cincinnati, OH, USA) according to the manufacturer’s instructions. After reverse transcription of 1 μg total RNA by oligo (dT) priming, cDNA was amplified using Taq DNA polymerase (Promega, Madison, WI, USA). Comparative semi-quantitative PCR was performed using the following primers: GAPDH sense: 5′-CCACCCATGGCAAATTCCATGGC-3′ and antisense: 5′-TCTAGACGGCAGGTCAGGTCC ACC-3′ primers. PAR1 N-terminus primers were as follows: hPar1-sense: 5′- CTCGTCCTCAAG GAGCAAAC-3′, antisense orientation: 5′-TGGGATCGGAACTTTCTTTG-3′ (resulting with a 564-bp PCR product). PAR2 primers: F: 5′-GGCCAATCTGGCCTTGGCTGA C-3′; R: 5′-GGC AGGAATGAAGATGGTCTG-3′.
Generation of shRNA for hPar2
To prepare shRNA constructs, we used a U6 promoter—driven and lentivirus (pLentiLox 3.7)—mediated delivery cassette of shRNA containing a stem-and-loop structure based on a 19-nucleotide sequence from the hPar2 coding region. shRNA cassette sequences were then ligated into pLentiLox 3.7 vector that encodes GFP (gift of Van Parij Laboratory, Massachusetts Institute of Technology, Cambridge, MA, USA). The sequence of shRNA for the hPar2 target gene is 5′- GGAAGAAGCCTTATTGGTA-3′. Scrambled sh-RNA hPar2 is 5′-GCAA GGTA AGCGTATGTTA-3′. The lentivirus particles were generated by a three-plasmid expression system, in which 293T cells were co-transfected with the following three vectors: packaging (CMVD R8.91), envelope (CMV-VSV-G), and the transfer vector pLentiLox 3.7. 293T cells were plated to 60 % confluency 1 day before transfection. Cells were transfected in fresh medium the following day with the three plasmids using Fugene 6 transfection reagent. Medium was replaced with fresh medium 24 h later. On days 2 and 3 after transfection, medium was collected and the viral particles were concentrated 100-fold by centrifuging for 1 h at 40,000 rpm.
Generation of a mutant R36A PAR2. In the extra-cellular portion of PAR2
GR/SLIGK whereby R36 was changed to A to generate R36A mutant by using QuikChange site-directed mutagenesis (Agilent Technologies, Santa Clara, CA, USA) using the following primer: 5′-GA ACC AAT AGA TCC TCT AAA GGA GCA AGC CTT ATT GGT AAG GTT GAT-3′. The inserted mutant R36A was confirmed by didoxy sequencing.
Western-blot and immunoprecipitation analysis
Cells were activated with agonist peptide TFLLRNPNDK for the indicated periods of time and solubilized in lysis buffer containing10 mM Tris–HCl, pH 7.4, 150 mM NaCl, 1 mM EDTA, 1 % TritonX-100, and protease inhibitors (5 mg/ml aprotinin, 1 mM phenylmethylsulfonylfluoride, and 10 mg/ml leupeptin) at 4 °C for 30 min. The cell lysates were subjected to centrifugation at 12,000 rpm at 4 °C for 20 min. Supernatant (400 μg) was incubated with on of the following antibodies: anti-PAR1 (ATAP, Santa Cruz, CA, USA; 1 μg/ml), anti-HA (HA.11 mAb COVANCE, Berkeley, CA, USA), anti-PAR2 (SAM11; Santa Cruz, CA, USA; 5 μg/ml), anti-GFP (mAb 6556; Abcam, Cambridge, England) or anti-T7 (T7-Tag antibody; Novagen, Madison, WI, USA). After overnight incubation, protein A-sepharose beads (Amersham Pharmacia Biotech, Buckinghamshire, UK) were added to the suspension (50 μl), which was rotated at 4 °C for 1 h. Extensive washes with lysis buffer then followed to specifically obtain the immunocomplexes. The immunocomplexes were eluted and separated on a 10 % SDS-PAGE gel, followed by transfer to an Immobilon-P membrane (Millipore, USA). Membranes were blocked and probed with 1 μg/ml amounts of the appropriate antibodies as follows: anti-PAR1 thrombin receptor mAb, (ATAP, from Santa Cruz, 1:1,000); anti-T7 (T7-Tag antibody; Novagen, Madison, WI, USA, 1:1,000) or a polyclonal anti-phospho-Akt (ser 473; 1:1,000; Cell Signaling, Boston, MA, USA), suspended in 3 % BSA in 20 mM Tris–HCl, pH 7.5, 15 mM NaCl, and 0.1 % Tween-20. After washing, the blots were incubated with secondary antibodies conjugated to horseradish-peroxidase. Immunoreactive bands were detected by enhanced chemiluminescence (ECL). Membranes were stripped and incubated with anti-IP antibodies to ensure equal protein load.
PAR1 and PAR2 and PAR4 activation and antagonist
Thrombin as an activator was used at 1 U/ml (e.g., 10 nM). Selective PAR1 activation was carried out by either TFLLRN or TFLLRNPNDK peptide and PAR2 activation by SLIGKV. PAR1 antagonist; SCH79797 (sc-203693, Santa Cruz Biotechnology, Inc. Dallas, TX, USA). PAR4 ligand; AYPGKF (GenSript, Piscataway, NJ, USA). tcY-NH2; PAR4 antagonist (Tocris Bioscience Inc, Minneapolis, MN, USA).
Immunofluorescence
HEK293T cells were plated on cover-slips that were pre-coated with poly-l-lysine, at least 24 h prior to transfections. Cells were transfected either with YFP-hPar2 (kindly provided by Dr. Morely D. Hollenberg, Department of Pharmacology and Therapeutics and Medicine, University of Calgary, Calgary, Canada; 0.5 μg/ml) or HA-hPar1 (0.5 μg/ml) or both for 48 h and then activated. Twenty-four hours before activation, the cells were starved in medium with 0.2 % BSA. The cells were activated by thrombin for brief periods (e.g., 2′, 5′ and 10 min) and then the medium was aspirated and the samples were washed twice with cold PBS and fixed with absolute cold methanol. Fixed cells were incubated with anti-HA antibodies (10 μg/ml, Covance Inc., Princeton, NJ, USA) followed by Cye3-conjugated anti-mouse IgG (4 μg/ml; Jackson Immuno-research Laboratories, PA, USA) as secondary antibodies. PAR2 was detected directly by fluorescence imaging (green) of the YFP (at 514 wave length; 514–542). Nuclear staining was performed using DRAQ5 (4 μM; Cell Signaling; Boston, MA, USA). Images were obtained using a Zeiss LSM 5 confocal microscope and analyzed with Zen software (Carl Zeiss).
Colony formation in soft agar
A total of 5 × 10³ cells per well were plated on a 0.5 % agarose base in six-well plates in growth medium containing 0.35 % agarose. Cells were either thrombin activated (1 U/ml) or not (control) added every 48 h. After 12 days of incubation, images of the colonies were either taken with phase microscopy or after staining with 0.005 % crystal violet at room temperature for 1 h.
Placenta tissue collection and preparation
Placental tissues were prepared as previously described [32]. Briefly, the placental tissues were extracted from discarded material provided by patients who voluntarily and legally chose to terminate pregnancy during the first trimester (between 5 and 12 weeks gestation). Gestational age was determined by the date of the last menstrual period and ultrasound measurement of the crown-rump length. All specimens were obtained strictly in adherence with the Hadassah Hospital Institutional Ethics Committee Guidelines.
First-trimester villous explants in cultures
The preparation and cultivation of villous explants of different first-trimester placentas were performed as described elsewhere [32–34]. Briefly, the placental tissue originated from samples between 7 and 9 weeks gestation were immediately rinsed in sterile cold phosphate-buffered saline (PBS) and processed within 2 h of collection. Following dissection under microscope, approximately 2–5 mg weight specimens were carefully laid on 200 μl of solid reconstituted undiluted Matrigel substrate (Becton–Dickinson, Bedford, MA, USA) in 0.4 μm pore-culture Millicell-CM culture dish inserts (pore size 0.4 μm, Millipore Corp., Bedford, MA, USA). Explants were cultured in DMEM/F-12 supplemented with 100 U/ml penicillin, 100 μg/ml streptomycin, and 0.25 μg/ml ascorbic acid, pH 7.4. Villous explants were maintained in culture for 3 days. Viability of the explants was assessed by adherence to Matrigel and emerging EVTs breaking from the tips as observed under a phase microscope. At 24 h in culture, explants were treated with thrombin (1 U/ml), TFLLRN (100 μM), and SLIGKV (100 μM) and infected or not with shRNA hPar2- GFP- or scrambled shRNAhPar2 viral vector. After 72 h in culture, the Matrigel cast cylinders with the EVTs were detached from the base of the insert cells by fine dissection under the microscope, fixed in 4 % paraformaldehyde, embedded in paraffin and further processed for histochemical tissue analysis. Each experimental condition was carried out in triplicate originating from eight different placental sets samples.
EVT invasion assessment
We assessed the H&E-stained serial sections of the EVT. We limited our study to the trophoblasts that penetrated through the Matrigel but remained on the surface of the polycarbonate membrane, that is, within the cast [33, 35, 36]. These were visualized on sequential slices of the entire Matrigel cast by hematoxylin staining. Slides were photographed by digital image capture software and all specimens were evaluated by two of the authors (S.G–G. and M.M.). Depth of invasion was assessed for each experiment (disappearance of trophoblast cells on the serial sections). At the deepest common level of invasion the total EVT cells at five randomly selected microscope fields (magnification 40×) were counted, for each experimental condition and the mean ± SEM/HPF calculated.
Matrigel invasion assay
Blind-well chemotaxis chambers with 13-μm-diameter filters were used for this assay. Polyvinylpyrrolidone-free polycarbonate filters, 8 μm pore size (Costar Scientific Co. Cambridge, MA, USA), were coated with basement membrane Matrigel (50 μl of 10 mg/ml Matrigel applied per blind well; 25 μg/filter). Briefly, the Matrigel was diluted to the desired final concentration with cold distilled water, applied to the filters and dried under a hood. Cells (2 × 10⁵) suspended in DMEM were added to the upper chamber. Conditioned medium of NIH-3T3 fibroblasts was added to the lower compartment of the Boyden chamber as a chemoattractant. Assays were carried out at 37 °C in 5 % CO2. Following incubation, cells on the upper surface of the filter were removed by wiping with a cotton swab. The filters were fixed and stained with DifQuick System (Dade Behring Inc, Newark, NY, USA). Cells from various areas of the lower surface were counted and each assay was performed in triplicate.
Animal studies
Female athymic nude mice at 6–8 weeks of age were implanted subcutaneously with 2 × 10⁶ HU cells stably transfected with either hPar1 and hPar2, hPar2 alone, or hPar1 and a truncated form of hPar2. Mice were monitored for tumor size by external caliber measurements (length and width) at the time points indicated. Tumor volume (V) was calculated by V = L × W 2 × 0.5, where L is length and W is width. After 3 weeks, the mice were killed and the tumors were excised, measured, and weighed (n = 5). All animal experiments were strictly in adherence with the Hadassah-Hospital Institutional Ethics Committee guidelines and approved by the animal committee of the Hebrew University, Jerusalem, Israel (MD-107.05-4).
Results
The silencing of hPar2 inhibits the association of signaling partners on PAR1 C-tail
Etk/Bmx specifically associates with the PAR1-C-tail via its pleckstrin homology (PH) domain and forms a scaffold assembly site that initiates the cell-signaling network [37]. To examine whether the association between the PAR1-C-tail and Etk/Bmx is modulated by PAR2, we utilized MCF7 clones expressing either HA-hPar1 and T7-tag-Etk/Bmx, HA-hPar1 7A mutant, which fails to bind Etk/Bmx (see supplementary data, Fig. S1A&B) or scrambled short hairpin (sh) RNA hPar2 in the presence of HA-hPar1 and T7-Etk/Bmx. Co-immuno precipitation analyses showed that while Etk/Bmx is immobilized onto PAR1-C-tail following thrombin activation, this complex formation is completely abrogated when hPar2 is knocked down (MCF7 cells express endogenously moderate levels of PAR2) (Fig. 1Ai and Supplementary data S4C). The complex formation is observed in the presence of scrambled shRNA-hPar2, similar to the association between control, non-treated cells of Etk/Bmx and PAR1-C-tail in MCF7 clone over-expressing HA-hPar1 and T7-tag-Etk/Bmx (Supplementary data Figs. S1 and S2). No co-immunoprecipitation was seen following empty vector transfection (data not shown). Strikingly, in the presence of shRNA-hPar2 inhibition of the specific TFLLRN PAR1 ligand [38] induced Etk/Bmx-PAR1 complex is observed as compared with the scrambled shRNA-hPar2 following TFLLRN activation (Fig. 1Aii). Interestingly, SLIGKV selective PAR2 activation also results with the immobilization of Etk/Bmx onto PAR2 C-tail (Kancharla A et al, Manuscript in preparation). Therefore, it appears that both PAR1 and PAR2 follow at least partly, a similar pattern of signal activation.
Fig. 1.
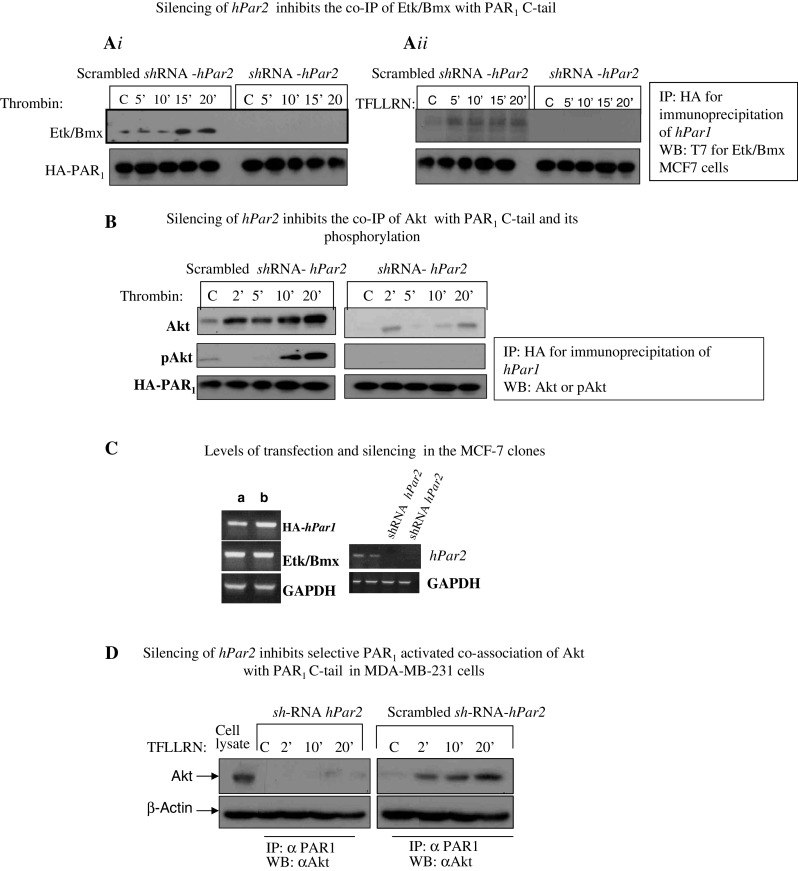
Silencing of hPar2 inhibits association of key signaling partners with the PAR1 C-tail. A i MCF7 cells stably over-expressing HA-hPar1 and T7-Etk/Bmx were infected with a lentiviral vector driving either shRNA- hPar2 expression or a scrambled shRNA-hPar2 and cultured with or without thrombin activation (1 U/ml) (A i) or the PAR1 selective ligand, TFLLRN (100 μM) (A ii). Cell lysates were collected at the indicated times and immunoprecipitated using anti-HA antibodies. Immunoprecipitates were separated on SDS-PAGE and Western blotted with anti-T7 antibody to detect T-7-tagged Etk/Bmx-T7. Etk/Bmx is seen after 15 and 20 min of thrombin treatment in cells without hPar2 silencing (scrambled shRNA-hPar2); but is not detectable in cells infected with shRNA-Par2. A specific, Etk/Bmx is seen associated after 5′, 10′, 15′, and 20 min following TFLLRN activation in cells expressing both HA-hPar1 and endogenous hPar2 (scrambled shRNA-hPar2). In-contrast, the Etk/Bmx association is not detected in the presence of shRNA-hPar2. B Silencing hPar2 inhibits thrombin-induced association between PAR1 and Akt. MCF7 clones overexpressing HA-hPar1, with shRNA hPar2 silencing (right), or scrambled shRNA hPar2 (left), were treated with thrombin for the indicated times. Cell lysates were immunoprecipitated with anti-HA to precipitate HA-PAR1 and analyzed by Western blot with anti-Akt antibodies, followed by antibodies to phosphorylated Akt (pAkt). HA-PAR1 serves as a loading control. C PAR2 expression in the MCF7 clone (expressing hPar1, hPar2, and etk/bmx) with and without shRNA silencing as compared with a housekeeping gene GAPDH. D Silencing hPar2 inhibits TFLLRN PAR1 activation in MDA-MB-231 cells. MDA-MB-231 cells expressing high endogenous levels of both PAR1 and PAR2 show a similar pattern (to MCF7 cells) of selective PAR1 inhibition in the presence of sh-RNA hPar2. TFLLRN activation induces the co-IP between PAR1 and Akt immediately after 2′, 10′, and 20′ activation (scrambled sh-RNA hPar2). In the presence of sh-RNA hPar2, this association is markedly inhibited. β-actin serves as a loading control
We also examined in these clones the interactions between the PAR1-C-tail and Akt, a prime signaling partner in cancer cells. For this purpose, anti-HA antibodies were used to immunoprecipitate the HA-tagged PAR1 protein, following thrombin activation. Association of Akt with the PAR1 C-tail increased with time. Furthermore, using anti-phospho-Akt antibodies, it is demonstrated that PAR1-bound Akt undergoes phosphorylation, indicating that Akt is functional in the PAR1-immobilized state. Knocking down hPar2 abrogated the association of Akt with PAR1 C-tail, as well as its phosphorylation following thrombin activation. A scrambled shRNA-hPar2 had no effect on the complex formation between PAR1-C-tail and Akt as also p-Akt (Fig. 1b see also Fig. S1). Similarly, empty vector transfection did not result in any co-immunoprecipitation (MCF7 cells do not express PAR1; data not shown). The levels of hPar1, hPar2, Etk/Bmx, and degree of hPar2 silencing in these clones are shown in Fig. 1c. A similar pattern of selective PAR1 inhibition (by shRNA- hPar2) is also observed in MDA-MB-231 cells expressing endogenously high levels of PAR1, PAR2, and Akt. In the presence of scrambled shRNA-hPar2, a potent co-association between PAR1 and Akt is observed following TFLLRN activation. This complex formation is completely abrogated in the presence of shRNA- hPar2 (Fig. 1d).
Silencing hPAR2 significantly reduces soft agar colony formation, Matrigel invasion, and wound migration
Anchorage-independent growth in soft agar as manifested by colony formation is a well-established indicator of tumorigenicity [39, 40]. Normal cells are incapable of multiplying in a semisolid environment. Furthermore, there is a good correlation between soft-agar colony formation and the extent of tumor generation in vivo in animal models. While MDA-MB-231 cells formed very small colonies prior to activation (Fig. 2Ai, a, b; control), large colonies in soft agar were observed following treatment with thrombin (Fig. 2Ai, panel c) or with the PAR1-specific ligand TFLLRNPNDK (Fig. 2Ai, panel d). In contrast, cells expressing shRNA-GFP-hPar2 were incapable of generating colonies following the addition of either thrombin (Fig. 2Ai, panel e, cells expressing shRNA-hPar2 visualized by GFP fluorescence) or TFLLRNPNDK (Fig. 2Ai, panel f; the small-size colonies shown, all express shRNA-hPar2 due to high lentiviral infection levels). Scrambled hPar2 had no effect on the formation of large colonies in the presence of thrombin activation (Fig. 2Ai panel g). Cells infected with shRNA- hPar1 and thrombin activated formed small-size colonies (Fig. 2Ai panel h, as compared with panel c; for control non-silenced cells after thrombin activation). SLIGKV PAR2-specific activation showed the formation of rather large colonies (Fig. 2Ai panels i, j). Overall, when grown on soft agar, MDA-MB-231 sh-hPar2 cells formed significantly smaller foci and a smaller number of foci than control MDA-MB-231-activated cells. In-contrast, MDA-MB-231 cells formed significantly larger foci following PAR activation than control cells, while the number of foci remained the same. Figure 2Aii shows that infection with the shRNA-hPar2 vector decreased hPAR2 expression to undetectable levels without altering hPar1 expression. Histograms represent the mean colony area size/cm2 under the different treatments (Fig. 2Aiii). Thus, reducing PAR2 expression alone not only attenuates PAR1 and PAR2-driven cell transformation but also considerably inhibits transformation induced by the selective activation of PAR1. The data were statistically evaluated by ANOVA Tukey HSD of multiple comparison, showing a p value of 0.004 within groups. The mean difference is significant at the 0.05 level.
Fig. 2.

A i Silencing hPar2 in a breast cancer cell line inhibits thrombin- or TFLLRNPNDK-induced colony formation in soft agar. 5 × 10³ MDA-MB-231 cells, either uninfected (a, b) or infected with virus expressing shRNA-GFP-hPar2 (e, f), were plated in soft agar and activated by thrombin (e) or TFLLRNPNDK (f). Uninfected cells were treated with thrombin (c) or TFLLRN (d) as also with SLIGKV (i, j). Controls of either scrambled shRNA hPar2 with thrombin activation (g) and shRNA hPar1 with thrombin activation (h) were shown as well. After 12 days, live images were collected using a Zeiss microscope at ×20 magnification. In uninfected cells, large colonies formed following treatment with either thrombin (c) and somewhat smaller with TFLLRNPNDK (d). MDA-MB-231 cells infected with sh-GFP-hPar2 formed only very small colonies after thrombin (e) or TFLLRNPNDK (f) treatment. Cells containing sh-hPar2 are visualized by GFP fluorescence (e). The colonies formed under different conditions were compared with control non-activated, non-treated cells (control; a, b). The colonies formed in the presence of shRNA-hPar1 and after thrombin activation is significantly smaller (panel h) than colonies formed after thrombin activation (c). Scrambled shRNA-hPar2 had no effect on the colonies formed (panel g). Comparable colony size is obtained by SLIGKV PAR2 activation (i, j) as found by TFLLRNPNDK (d). Images shown are representative of three independent experiments. A ii RT-PCR analysis of hPar1 and hPar2 mRNA expression before and after shRNA silencing. GAPDH levels were analyzed as a control. A iii Histogram shows mean ± SE of triplicate values from three independent experiments. Post hoc evaluation of multiple comparison (ANOVA Tukey HSD) showed a p value of 0.004 within groups. The mean difference is significant at the 0.05 level. For ANOVA evaluation we used IBM SPSS 20.0 software. B i Silencing hPar2 in MDA-MB-231 cells inhibits TFLLRN PAR1 invasion. Matrigel invasion in the presence of shRNA-hPar2-infected cells as compared with scrambled shRNA. While TFLLRN specific activation of PAR1 induces Matrigel invasion in MDA-MB-231 cells, this was attenuated in the presence of shRNA-hPar2-infected cells. In-contrast, no effect was observed when a scrambled shRNA was utilized to infect the cells, demonstrating a markedly induced Matrigel invasion similar to non-treated activated parental MDA-MB-231 cells. B ii Histograms represents quantification of the cells/HPF invaded the Matrigel layer. Unpaired Student’s t test was used. This experiment is a representative of three independent experiments performed in triplicates. B iii Silencing hPar1 in MDA-MB-231 cells did mot inhibit PAR2 function. In MDA-MB-231 cells silenced for hPar1, thrombin activation resulted with a low level of Matrigel invasion. In-contrast, SLIGKV PAR2 activation under conditions of sh-hPar1 silencing, resulted with potent Matrigel invasion. B iv Histograms represents quantification of the cells/HPF invaded the Matrigel layer in shRNA hPar1 silenced cells. Unpaired Student’s t test was used. This experiment is a representative of three independent experiments performed in triplicates
Silencing of hPar2 also inhibited significantly TFLLRN-induced invasion of MDA-MB-231 cells in a Matrigel invasion assay, while scrambled shRNA-hPar2 had no effect (Fig. 2Bi, ii). In parallel, when we analyzed Matrigel invasion in sh hPar1 MDA-MB-231-silenced cells, we observed a marked inhibition following thrombin activation. This was not seen following SLIGKV activation, whereby potent Matrigel invasion is observed (Fig. 2Biii, iv). Therefore, the same pattern as in MCF7 cells is observed inhibiting Matrigel invasion in the presence of silenced hPar2 but not vice versa by sh hPar1. We demonstrate specificity toward PAR1 by inhibition in the presence of PAR1 selective antagonist SCH79797 (Supplementary data Fig S3). In order to exclude the possibility that PAR4 is involved in MDA-MB-231 cell invasion (since these cells express also PAR4, see Supplementary data Fig. S4, C), we performed Matrigel invasion in the presence of a PAR4 agonist, AYPGKF. As can be observed, a low level of invasion was obtained (Fig. S4, Ai, Aii). Next, we performed Matrigel invasion following thrombin activation, in the presence of tcY-NH2 (Tocris Bioscience Inc, Minneapolis, MN, USA), a PAR4-specific antagonist. Thrombin activation induced Matrigel invasion with no significant impact of PAR4 antagonist on the invasion level Fig. S4, Ai, Aii). Similarly, we show that the PAR4 antagonist does not have a significant impact on Thrombin-induced co-association between PAR1 C-tail and Akt, in MDA-MB-231 cells (Fig. S4, B). We thus conclude that PAR2 affects PAR1 function and the involvement of PAR4 in this process is marginal.
Next, we looked at the effect of silencing by shRNA-hPar2 or shRNA-Par1 on the migration of tumor cells using a tissue monolayer-wound assay. Cells of the aggressive breast cancer line MDA-MB-468 (expressing high levels of PAR1 and PAR2; Supplementary data Fig. S5A) or PC3 prostate cancer cells (Supplementary data Fig. S5B) were infected with lentiviral vectors expressing either shRNA-hPar2 or shRNA-hPar1. A carefully defined wound (1-cm-wide scratch) was made in confluent MDA-MB-468 cells or PC3 cells following infection and in uninfected confluent cultures. Cells were then treated with thrombin and migration of cells into the empty space was assessed over time. There was extensive cell migration in the non-infected cells, closing the gap within 24 h. In-contrast, migration was clearly attenuated in cells infected with either shRNA-hPar1 or shRNA-hPar2; shRNA-hPar2 had a more pronounced effect than shRNA-hPar1 (Fig. S5Ai, iii and S3Bi, iii, Supplementary data). When either PC3 or MDA-MB-468 cells were either infected with shRNA-hPar1 or with shRNA-hPar2, there was no detectable expression of PAR1 or PAR2, respectively (Figs. S5Aii and S5Bii, Supplementary data).
Silencing of hPar2 significantly inhibits thrombin-induced EVT cell invasion
A decisive key step in the establishment of human pregnancy is the well-orchestrated invasion of the uterus wall by specialized cells termed extravillous trophoblast (EVT). These cells are in fact a subpopulation of placenta cytotrophoblast capable of forming anchoring villi that invade and reach the uterine wall thereby allowing direct contact with the maternal blood. A well-established in vitro model system based on the isolation of villi from early gestation placentas plated on Matrigel as a substitute for the extra cellular matrix (ECM) is utilized [33–36]. The advantage of this system is that cytotrophoblasts that differentiate along the invasive pathway mimic at large the development of normal early placenta villi [36]. We initiated our evaluation by comparing the depth of invasion under the different experimental conditions: infection of shRNA-hPar2- viral vector as compared with scrambled sh-RNA-hPar2 before and after either thrombin or TFLLRN or SLIGKV activation. The morphology of the villous trophoblast as well as the extra villous cell outgrowth columns in the various treatment groups is illustrated.
The EVT invasion into the Matrigel reached as deep as 110 μm, as observed by representative 5-μm serial sections of the Matrigel cast. Histological analyses of H&E staining are shown in Fig. 3a. The preparations of shRNA-hPar2 viral vector following activation of the PARs (e.g., thrombin, TFLLRN, SLIGKV) showed reduced EVT invasion, reaching levels of maximum 70 and 80 μm. In contrast, activation of PARs (e.g., thrombin and/or TFLLRN and SLIGKV), showed deeper invasion (e.g., 110 μm). The number of cells per high-power field for each of the treatments was evaluated at an equal level of invasion (60 μm), as shown in a representative histogram (Fig. 3a). A high level of invading cells was observed after either thrombin, TFLLRN, or SLIGKV activation, regardless of either before or after scrambled the shRNA hPar2 treatment. In conclusion, a significant inhibition was observed in the presence of shRNA-hPar2 lentiviral vector following the different activation treatments (e.g., thrombin, TFLLRN, and SLIGKV). The relative levels of PAR1 and PAR2 in the presence and absence of either sh hPar2 or scrambled sh hPar2 in the EVT organ culture is shown in Fig. 3c. The count/HPF data was statistically evaluated by ANOVA Tukey HSD of multiple comparison showing a p value of 0.0001 within groups. The mean difference is significant at the 0.05 level.
Fig. 3.

Placenta-EVT organ culture invasion. A Morphology of EVT column growth. Invasion of placental explants of EVT-Matrigel cylinder cast after H&E staining (magnification ×20). Serial sections (5 μm each) of the Matrigel cylinder casts were embedded in paraffin blocks prepared for each of the experimental treatment conditions. Images of representative H&E-stained sections at 60-μm depth are presented. a Non-treated (control); b Thrombin (1 U/ml) activation; c TFLLRN (100 μM) activation; d SLIGKV (100 μM) activation; e shRNA hPar2 lentiviral infected EVT and thrombin (1 U/ml) activated; f shRNA hPar2 lentiviral-infected EVT and TFLLRN (100 μM) activation; g Scrambled shRNA hPar2 lentiviral infected EVT and thrombin (1 U/ml) activation; h shRNA hPar2 lentiviral-infected EVT and SLIKGV (100 μM) activation; i shRNA hPar2 lentiviral-infected EVTs. Note the increase in the EVT migrating cells and cell mass at the tip of the villi following either of PAR activation. In contrast, a blunt end of the villi with no sprouting cells is seen at the villi tip column in the presence of shRNA hPar2 treatment following the different activation treatment. The experiment was terminated 3 days (72 h) after EVTs treatment. Each experiment was performed using three different placentas, in triplicates. Arrowheads show sprouting cytotrophoblasts. B Quantification of EVT outgrowth cell number at 60-μm depth of invasion as shown by histogram mean values. Cells (not the villous compartment) were counted per high-power field and expressed as mean ± SEM. C RT-PCR analyses of PAR1 and PAR2 in the cultured EVTs. GAPDH serves as a control. Post hoc evaluation of multiple comparison (ANOVA Tukey HSD) showed a p value of 0.0001 within groups. The mean difference is significant at the 0.05 level. For ANOVA evaluation, we used IBM SPSS 20.0 software. D Schematic representation of EVT experimental model for invasion
Co-localization of PAR1 and PAR2
It has been proposed previously that PAR1 and PAR2 are localized near each other on the cell membrane, enabling their activation as an intact functional unit. We examined their relative localization on breast cancer cells in situ by confocal microscopy. HEK293T cells were transfected with both HA-hPar1 and YFP-hPar2. Twenty-four hours later, the cells were serum deprived for an additional 24 h and then activated with thrombin for 5 min. PAR1 was visualized by anti-HA antibodies and Cy3-conjugated secondary antibodies or direct fluorescence detection for YFP-PAR2. Activation showed merge co-localization of both PAR1 and PAR2 in the cell membranes (Fig. 4A, panels d, iv) as compared with either PAR2 (Fig. 4A panels a, i) or HA-PAR1 (Fig. 4A, panels b, ii). Control cells prior to activation exhibited abundant PAR1 and PAR2 on the cell surface, indicating that the transfection was efficient (data not shown). Cell nuclei were detected by draq 5 (Fig. 4A, panels c, iii) and gross cell morphology was detected by phase-contrast microscopy (Fig. 4A, v).
Fig. 4.

Co-localization of PAR1 and PAR2. A Confocal immunofluorescence analysis. HEK-293T cells were transfected with both HA-hPar1 and YFP-hPar2. After 24 h, the cells were serum deprived for an additional 24 h then activated with thrombin for 5 min followed by fixation with cold methanol. PAR2 was visualized by direct fluorescence (a) and PAR1 was visualized by immunostaining with anti HA-antibodies followed by Cy3-conjugated IgG secondary antibodies (b). Merge staining for both PAR1 and PAR2 revealed co-localization confined to the cell membrane (d). For reference, staining of cell nuclei with Draq5 is shown (c). The bottom panel highlights staining in one cell exhibiting the expression of YFP-hPar2 and HA-hPar1 on the cell membrane prior to activation (i, ii). Significant co-localization recapitulated by merge fluorescence is observed following five minutes thrombin activation (iv). This is detected as compared with cell nuclei staining (iii) and phase-contract analysis (v). The percent of positive cells for HA-hPar1 was 58 % ± 1.2 and for YFP-hPar2 were 55 % ± 1.86; PAR1-PAR2 merge was observed in 45 % ± 2.1. B PAR1 and PAR2 co-immunoprecipitate. HEK 293T cells expressing either HA-hPar1, YFP-hPar2 or GFP-CXCR4 were treated with thrombin for 10 min and lysed. Cell lysates were then immunoprecipitated before (−) and after (+) thrombin activation by anti HA or IgG, resolved by SDS-PAGE and immunoblotted as indicated (by anti-GFP). While no specific complex is formed when CXCR4 and PAR1 were co-IP (following 10-min thrombin activation), a specific complex is observed between PAR1 and PAR2 following activation. No specific band is seen when IgG were applied in the immunoprecipitation assay. Expression of CXCR4, PAR2 (as indicated by anti-GFP, first lane), and PAR1 (as shown by anti-HA) were shown as controls for transfection efficiency. The figure shown is a representative of three independent experiments
Co-localization of PAR1 and PAR2 was quantitated with the “Image-Pro Plus” (version 4.5) program, which can specifically calculate the extent of co-localization within a defined field (co-localization is expressed using a scoring range from a low of 0.2 up to 1.0, which indicates maximal co-localization). When we used “Image Pro Plus” to analyze the HEK293T cell membrane compartment, scores of 0.97–0.98 were obtained throughout the field, indicating high co-localization between PAR1 and PAR2 following activation by thrombin.
To obtain direct evidence for PAR1–PAR2 heterodimer formation, we carried out co-immunoprecipitation analyses. For this purpose, we ectopically over-expressed HA-tagged-hPar1 with YFP-tagged-hPar2. As a control, we used CXCR4, another member of the GPCR family. For this purpose, we expressed GFP-cxcr4 in HEK293T cells along with HA-hPar1. The cells were treated with thrombin for 10 min and then lysed. Next, we performed immunoprecipitation using either anti-HA antibodies, or IgG (as control), separated on SDS-PAGE and Western blotted with anti-GFP antibodies. PAR2 were detected in the immunoprecipitates after thrombin activation; (+) as compared to PAR2 levels prior to activation; (−) and similar to the position of PAR2 in cell lysates expressing only PAR2 (PAR2) (Fig. 4B). No association was seen in cells expressing GFP-cxcr4 or following immunoprecipitation with IgG. These results provide supporting evidence that a specific complex is formed between PAR1 and PAR2 following activation, but not with PAR1 and CXCR4.
Modulation of PAR1-PAR2 induced breast tumors by a truncated PAR2
The basis for this study is the concept that PAR1 and PAR2 act together as a functional unit in response to thrombin application, based on the close proximity position enabling the formation of heterodimers or hetero-oligomers. Knocking down of PAR2 considerably attenuated the response to pro-tumor processes induced either by thrombin or the specific PAR1 ligand. We therefore sought to examine the effect of a truncated form of PAR2 (PAR2 lacking the cytoplasmic tail) both in vitro and in vivo on PAR1 tumor growth (for characterization of truncated hPar2 cell surface expression, see Supplementary data, Fig. S6). For this purpose, we have utilized HU cells, nearly normal breast epithelial cells that do not express neither hPar1 nor hPar2 (see Supplementary data; Fig. S4, C). Toward this, we generated stable clones of HU cells over-expressing the following plasmids. A clone expressing HA-tagged hPar1, T7-tagged-Etk/Bmx and wt hPar2; another clone expressing HA-tagged hPar1, T7-tagged-Etk/Bmx and a truncated hPar2; a clone of hPar2 alone or a clone expressing empty vector alone. The association between Etk/Bmx and PAR1 C-tail in these clones was first analyzed. Cell lysates were processed and immunoprecipitated with anti-HA antibodies, followed by Western-blot detection of the T7-tagged-Etk/Bmx immunocomplex with anti-T7 antibody. Etk/Bmx was detected with HA-tagged PAR1 in cells co-transfected with wt hPar1 and hPar2 following 10 min of thrombin activation. In contrast, in the clone expressing hPar1 and a truncated form of hPar2, thrombin treatment elicited a markedly less association between PAR1 C-tail and Etk/Bmx (Fig. 5A). The levels of Etk/Bmx, truncated PAR2, and HA-hPar1 expression is shown (Fig. 5Aii). This finding suggests that the presence of truncated PAR2, lacking the cytoplasmic C-tail inhibits PAR1-PAR2 functional activity. We further demonstrate that the truncated form of PAR2 co-immunoprecipitates with PAR1. For this purpose, we have used HEK293T cells expressing HA-hPar1 and truncated form of PAR2. The cells were treated for 10 min with thrombin (+), lysed, and immunoprecipitated using anti-PAR2 or IgG (as control). Western-blot analysis using anti-HA antibodies showed the presence of PAR1 in the PAR2 immunoprecipitates following thrombin activation but not prior to activation (−), or by the use of IgG. The position of PAR1 in the blot is compared with PAR1 size obtained in the cell lysates (Fig. 5Aiii). Hence, the truncated form of PAR2 is well expressed on the cell-surface (Supplementary data, Fig. S6) presumably in a close proximity with PAR1, and upon activation forms a complex with PAR1.
Fig. 5.
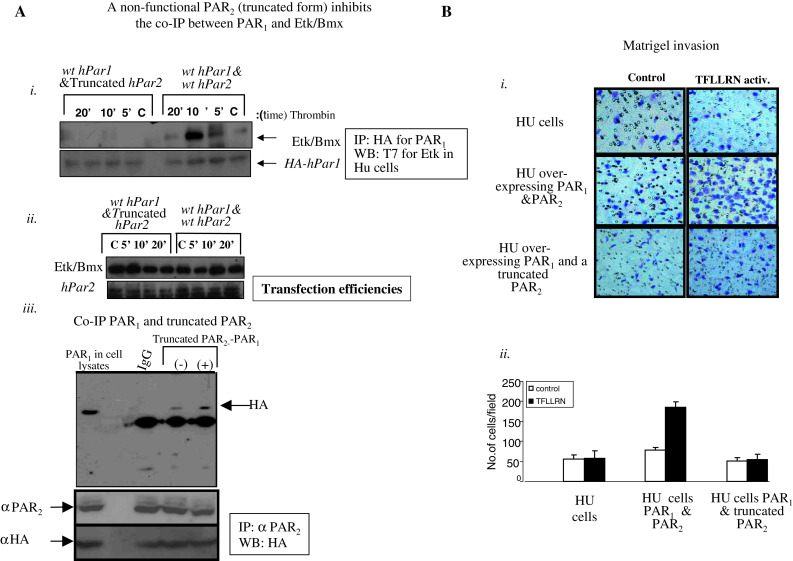
A A truncated form of hPar2 (devoid of C-tail) impairs PAR1 C-tail tail ability to associate with Etk/Bmx following thrombin activation. i HU stable clones over-expressing either hPar1&hPar2 or hPar1 and a truncated form of hPar2, also expressing T7-etk/bmx, were immunoprecipitated using anti-HA antibodies to immunoprecipitate HA-PAR1. The PAR1 immunoprecipitates were analyzed by Western blot with anti-T7 antibodies to detect T7-tagged Etk/Bmx. Anti-HA blotting is shown as a loading control. Plasmid expression levels in the various clones are indicated (ii). Clones expressing HA-hPar2 and T7-etk/bmx were analyzed for transfection efficiency (iii). PAR1 co-immunoprecipitates with a truncated PAR2 form. HEK 293T cells expressing HA-hPar1 and a truncated PAR2 form were treated with thrombin for 10 min and then lysed. Cell lysates before (−) and after (+) thrombin activation were then immunoprecipitated by either anti-PAR2 antibodies (SAM11; Santa Cruz, CA, USA) or IgG, resolved by SDS-PAGE and immunoblotted as indicated (by anti-HA abs). While no specific band is seen when IgG was used as a control, increased PAR1 is observed following thrombin activation (+) as compared to levels before activation (−). In lysates expressing hPar, blotting with anti-HA antibodies indicate the position of PAR1 (e.g., PAR1). Levels of truncated PAR2 are indicated by anti PAR2 antibodies (directed to the N-terminus of PAR2). Anti-HA was shown for PAR1 transfection levels. This experiment is a representative of three independent experiments. B Matrigel invasion induced by selective PAR1 activation. Matrigel invasion is induced by TFLLRN treatment of HU clones over-expressing hPar1 and hPar2. In contrast, TFLLRN fails to induce Matrigel invasion in cells over-expressing hPar1 and a truncated form of PAR2. Images are taken at ×20 magnification. Histograms representing the extent of Matrigel invasion are shown. Unpaired Student’s t test was used. This experiment is a representative of three independent experiments performed in triplicates. Error bars, ± SD; **p < 0.007
In a Matrigel invasion assay, selective activation of PAR1 with TFLLRN considerably enhanced the invasion of HU cells over-expressing both PAR1 and PAR2. This PAR1-induced invasion was noticeably inhibited in clones stably expressing PAR1 and the truncated form of PAR2 (Fig. 5Bi, ii).
Noticeably, TFLLRN activates specifically PAR1, but not PAR2 (see Supplementary data Figs. S8, S9). When the PAR2 mutant R36A, incapable of extra-cellular cleavage by trypsin for activation was silenced, a marked inhibition of TFLLRN PAR1 induced Matrigel invasion (Supplementary data Fig. S9) was observed. Hence, the physical presence of PAR2 in a non-activated state is sufficient and required in close proximity for PAR1 function. When the clone expressing wt hPar1 and a truncated form of hPar2 were re-infected with wt hPar2, a complete rescue was observed after TFLLRN activation showing a potent Matrigel invasion properties (Supplementary data, Fig. S7).
The various clones (e.g., wthPar2, hPar1&hPar2, hPar1, and truncated hPar2), were then inoculated subcutaneously into nude mice. The mice were monitored for 35 days (at which time the tumors became noticeable), killed, and tumors were collected and embedded in paraffin. While minimal to nearly no tumors were seen following injection of the parental HU cells, large tumors were observed after injection of HU clones over-expressing hPar1 and hPar2 (as well as the prime signal protein; T7-tagged-Etk/Bmx), similar to the tumors obtained following inoculation of cells expressing hPar2 alone. In the presence of hPar1 and a truncated form of hPar2, considerably smaller tumors were seen (Fig. 6A, B). These tumors were also significantly smaller than PAR1-driven tumors (data not shown). The levels of tag-PAR1, wt PAR2 and truncated PAR2 expression in two clones are shown (Fig. 6C).
Fig. 6.

Impaired tumor development in the presence of PAR1 and truncated PAR2. Stable clones of HU cells expressing either hPar2 or hPar1 and hPar2, or hPar1 and truncated hPar2 were injected subcutaneously into nude mice (2 × 10⁶ cell/mouse). Parental non-transfected HU cells were used as a control. A Tumor morphological appearance. Mice injected either with hPar1 and hPar2 or hPar2 developed tumors at the sites of injection. In-contrast, mice inoculated with wt hPar1 and a truncated form of hPar2 did not develop or developed very little tumors (a). By the end of the experiment (e.g., 35 days) the mice were killed and the tumors were excised, measured, and weighed (n = 4/per group). B Mouse tumor growth curve in nude mice. Tumors were excised, weighed and measured at the indicated times and tumor volume (mm3) was calculated. Error bars show SD; * indicates p < 0.006. Data shown are representative of three experiments performed. C i, ii RT-PCR analyses of the indicated clones (a and b; two different clones) show the expression of PAR1 and PAR2, truncated PAR2 and the prime signal protein Etk/Bmx
Together, the in vitro and in vivo effects of introducing a truncated PAR2 indicate that truncated PAR2 has an inhibitory effect on PAR1/PAR2-induced tumor-promoting processes similar to the inhibition seen following shRNA silencing.
Discussion
It has been shown that PAR1 transactivates PAR2 donating its cleaved new N-terminal domain to bind inter-molecularly and activate in trans PAR2 [26, 27]. Ample evidence has been gathered since the first demonstration by O’Brien et al. [26] showing conclusively that PAR1-tethered ligands can transactivate PAR2 and provide a full agonist for its function. This takes place in vivo as shown by Kaneider et al. [24] that PAR2 associates with PAR1 and switches thrombin-induced endothelial cell from a barrier disruption function to a protective role. In another work, PAR2 expression was shown necessary for PAR1-induced hyperplasia in mouse models [28]. Recently, an in-depth work by the group of Trejo JA showed that the internalization trafficking machinery of PAR1–PAR2 heterodimer differs from PAR1 trafficking [29]. Albeit, the molecular mechanisms that regulate PAR1–PAR2 heterodimer formation, signaling, and trafficking are not yet known.
In the present study, we show that PAR1 and PAR2 act as a functional unit in promoting breast cancer. We found that PAR1-induced breast tumor development and the corresponding signaling events are markedly inhibited when PAR2 expression is either knocked-down or lacking the C-tail portion. Hence, PAR2 must be present for a wide spectrum of tumorigenic activities and for the initiation of PAR1 early signaling events but not vice versa.
Our studies confirm the close proximity of PAR1 and PAR2, which leads to co-localization following appropriate activation. This was demonstrated by both confocal image analysis and co-immunoprecipitation of PAR1–PAR2 forming a complex as shown following the ectopic over-expression of either GFP-cxcr4, HA-hPar1, and YFP-hPar2 plasmids. While specific co-immunoprecipitation is seen between HA-hPar1 and YFP-hPar2, no such complex is observed when GFP-cxcr4 and HA-hPar1 are used. Certainly, the truncated form of PAR2 is also found localized in close proximity with PAR1 allowing a potent complex formation. The physiological significance of the presence of PAR2 cytoplasmic C-tail is demonstrated in a xenograft mouse model for tumor development, showing a markedly reduced tumor formation when a truncated hPar2 is present.
Our findings are in line with the elegant studies by Sevigny et al. on PAR1/PAR2-driven hyperplasia in medial and neointimal arterial SMC growth [28, 41], and support preceding work from this group and others on PAR1 and PAR2 trans-activation [25, 27]. It is not surprising that silencing of PAR2 reduces functional outcomes of PAR1/PAR2-driven tasks. However, the marked inhibition of a selective PAR1-initiated activities, previously shown by the PAR1-P1pal-13 intracellular specific activation [28, 41] and in the present study by TFLLRNPNDK, is not fully understood and needs further exploration. PAR2 was found inactivated in the VSMC system, suggesting that the physical presence of PAR2 is important even in the non-activated state. We present now data showing that the physical close proximity of PAR2 is sufficient and required for PAR1 selective function. When a mutant of PAR2 (R36A) that is not activated by trypsin was silenced by shRNA-hPar2, a marked inhibition of TFLLRN induced Matrigel invasion was obtained. In parallel, we demonstrate that while trypsin effectively induced PAR2-driven Matrigel invasion, TFLLRN had no effect resulting with null to very little PAR2-induced Matrigel invasion (see Supplementary data Figs S8, S9). Hence, the presence of PAR2 is required for PAR1 function also in a non-activated state. More specifically, it is suggested that the presence of PAR2 C-tail is essential, although this role needs yet to be further elucidated. The functional dependence of PAR1 on PAR2 may be due to the formation of heterodimers or oligomers, as shown in other cell types. However, it is also possible that PAR2 has a dominating regulatory effect on PAR1 in a manner that has not yet been discovered. Interestingly, recently it has been demonstrated that PAR1 drives the trafficking behavior of PAR2 [29]. In addition, the current data do not rule out the possibility that PAR2 acts through a third, yet unknown, partner that is necessary for PAR1 efficient activity. The fact that a truncated PAR2 inhibits PAR1 suggests that there is essential signaling cross-talk between PAR1 and PAR2.
Along this line of evidence, a different signaling interface was shown by PAR1-PAR2 heterodimers [29]. Thrombin-induced internalization trafficking indicates that PAR1–PAR2 heterodimer stability leads to a conformational change that allows co-internalization and β-arrestin recruitment, an event that is not observed by activated PAR1 (which rather binds the clathrin adaptor; AP-2) [42]. The β-arrestin recruitment to PAR1-PAR2 heterodimer occurs through a distinct interface and elicits a unique signaling response that is different from signaling by PAR1 alone. Therefore, thrombin PAR1-PAR2 dimer formation results in a biased response elicited by β-arrestins. We have previously demonstrated that PAR1 promotes the binding of β-arrestin-2 to disheveled (DVL), suggesting a role for β-arrestin-2 in PAR1-induced DVL phosphorylation dynamics and β-catenin stabilization [43]. It remains to elucidate whether thrombin PAR1–PAR2 formation evokes a biased pro-tumor signaling event that represents a different interface than either PAR1 or PAR2 alone.
In fact, it was demonstrated [29] that activated PAR2 requires its C-tail for the stable association with β-arrestins but not for internalization, whereby a truncated form of PAR2 effectively internalizes [44]. Indeed, the PAR2 C-tail is not required or necessary for thrombin-induced β-arrestin recruitment to the PAR1–PAR2 on the endosomes. Hence, it appears that the truncated PAR1–PAR2 dimer internalizes similar to PAR1–PAR2 and recruits β-arrestins. Notably, we provide the first demonstration in the context of cancer that the use of a truncated form of PAR2 attenuates PAR1-driven pro-tumor function in vitro and in vivo.
It is also not clear whether activation of PARs leads to homodimer as well as heterodimer formation is not clear. It was previously suggested, based on BRET2 analysis, that both PAR1–PAR3 heterodimers and PAR1–PAR1 homodimers are formed in vascular endothelial cells and induce distinct signaling repertoires: PAR1–PAR3 heterodimers appeared to be selectively coupled to Gα13 as compared with the PAR1–PAR1 homodimer, which coupled to both Gαq and Gα13 [22].
Formation of heterodimeric receptors most likely allows a broader range of activation outcomes and more complex regulation than obtained with a monomer. In the case of PAR1 and PAR2, a broader G-protein response may be observed as PAR1 functions via Gα12/13 and PAR2 via Gαq, Gα11, Gα19, Gα12, and Gα13 [45]. However, Etk/Bmx is immobilized onto the PAR1 C-tail as an early key partner [37], and we find a similar association of Etk/Bmx with PAR2-C-tail following activation (Kancharla et al., manuscript in preparation). This suggests that in the heterodimeric status when the two C-tails are in close proximity, the amplification of an early signal associating partner rather takes place and not expansion to additional signaling partners. At the present time, the possibility that the heterodimers affect receptor internalization and trafficking cannot be ruled out [46] and was recently addressed [29].
Emerging data appointed PAR2 with a major role in breast cancer development. This is based among others, on the observed delay in the onset of tumors, following intercross between PAR2 knock-out mice and polyoma middle T (PyMT) mammary gland mouse model for spontaneous tumor growth but not via the intercross with PAR −/−1mouse [47]. Although this was observed in one mouse model, it may suggest that PAR2 plays a dominant role and drives pro-tumor function. This PAR2 pro-tumor function may be initiated by another coagulation component, tissue factor (TF), since TF cytoplasmic domain-deleted mice have been shown also to delay the spontaneous breast cancer development in the polyoma middle T model [48].
A similar approach to assess the relative contribution of PAR1 and PAR2 in breast cancer was taken previously [49]; those studies used shRNA silencing of PAR1 or PAR2 and revealed a significant role of PAR2 in the process. Like PAR1, PAR2 was first identified as a cell receptor activated by FVIIa and Xa enzymes of the coagulation/hemostasis system. The location of FVIIa and Xa upstream of thrombin in the coagulation cascade suggests cross-talk and sequential trans-activation of PAR1 and PAR2 in breast cancer [49]. Our study is novel in demonstrating the significance of PAR2 C-tail rather than silenced expression. This was shown both in tumor-associated processes as well as in a physiological invasion procedure.
The placenta is characterized by extensive invasion of cytotrophoblasts into the uterus wall, thereby allowing a direct contact of cytotrophoblasts with the maternal blood [30–32]. It is well recognized that trophoblast invasion during the first trimester is a critical step in the establishment of human pregnancy outcome. We as well as others have demonstrated that PAR family members are spatially expressed along the invasive process of early human trophoblast development [50, 51]. While previously we have assessed PAR1 and PAR2 activation, β-catenin stabilization and invasion in the EVT organ-culture system [33], we now demonstrate that shRNA hPar2 silencing, following lentiviral infection significantly inhibits both the thrombin-induced and selective TFLLRN PAR1 activated EVT invasion. Hence, also in a highly regulated, spatial and time-limited physiological invasion process, the presence of hPar2 is essential. The outcome of these findings points out the importance of PAR2 during placenta implantation to the uterus deciduas. This may suggest that proper anchoring of the placenta to uterus deciduas may require PAR2.
As the number of reports demonstrating GPCR dimerization has recently increased enormously, it is becoming well established that most GPCRs form either homo- or hetero-oligomers. PARs are no exception to this principle, acting predominantly as heterodimers in several combinations (PAR1 and PAR3, PAR1 and PAR4, as well as PAR1 and PAR2). Other GPCRs, including the chemokine receptors CCR2 and CCR5, have been shown to form both homo- and heterodimers [21], as have CCR2 and CXCR4.
In the present study, we demonstrate that PAR1 and PAR2 act together as one functional unit in tumor biology and show that PAR2 C-tail is important for PAR1 activities by a mechanism that remains to be elucidated. Our findings suggest that the PAR1-PAR2 system will be the focus of future novel therapies in breast cancer treatment.
Electronic supplementary material
Below is the link to the electronic supplementary material.
Acknowledgments
We are grateful to Dr. Susan Lewis for editing the manuscript. This work was supported by grants from the Israel Science Foundation, and Nofar Chief Israeli Scientist, Trade and Industrial Office (to Bar-Shavit, R).
Conflict of interest
There are no potential conflicts of interest to disclose.
Footnotes
An erratum to this article is available at http://dx.doi.org/10.1007/s00018-016-2424-6.
References
- 1.Takeda S, Kadowaki S, Haga T, Takaesu H, Mitaku S. Identification of G protein-coupled receptor genes from the human genome sequence. FEBS Lett. 2002;520:97–101. doi: 10.1016/S0014-5793(02)02775-8. [DOI] [PubMed] [Google Scholar]
- 2.Fredriksson R, Lagerstrom MC, Lundin LG, Schioth HB. The G-protein-coupled receptors in the human genome form five main families. Phylogenetic analysis, paralogon groups, and fingerprints. Mol Pharmacol. 2003;63:1256–1272. doi: 10.1124/mol.63.6.1256. [DOI] [PubMed] [Google Scholar]
- 3.Kolakowski LF., Jr GCRDb: a G-protein-coupled receptor database. Receptors Channels. 1994;2:1–7. [PubMed] [Google Scholar]
- 4.Bockaert J, Pin JP. Molecular tinkering of G protein-coupled receptors: an evolutionary success. EMBO J. 1999;18:1723–1729. doi: 10.1093/emboj/18.7.1723. [DOI] [PMC free article] [PubMed] [Google Scholar]
- 5.Lagerstrom MC, Schioth HB. Structural diversity of G protein-coupled receptors and significance for drug discovery. Nat Rev. 2008;7:339–357. doi: 10.1038/nrd2518. [DOI] [PubMed] [Google Scholar]
- 6.Vu TK, Hung DT, Wheaton VI, Coughlin SR. Molecular cloning of a functional thrombin receptor reveals a novel proteolytic mechanism of receptor activation. Cell. 1991;64:1057–1068. doi: 10.1016/0092-8674(91)90261-V. [DOI] [PubMed] [Google Scholar]
- 7.Stenkamp RE, Teller DC, Palczewski K. Crystal structure of rhodopsin: a G-protein-coupled receptor. ChemBioChem. 2002;3:963–967. doi: 10.1002/1439-7633(20021004)3:10<963::AID-CBIC963>3.0.CO;2-9. [DOI] [PubMed] [Google Scholar]
- 8.Swift S, Leger AJ, Talavera J, Zhang L, Bohm A, Kuliopulos A. Role of the PAR1 receptor 8th helix in signaling: the 7-8-1 receptor activation mechanism. J Biol Chem. 2006;281:4109–4116. doi: 10.1074/jbc.M509525200. [DOI] [PubMed] [Google Scholar]
- 9.Kenakin T. Inverse, protean, and ligand-selective agonism: matters of receptor conformation. Faseb J. 2001;15:598–611. doi: 10.1096/fj.00-0438rev. [DOI] [PubMed] [Google Scholar]
- 10.Kenakin T. Functional selectivity and biased receptor signaling. J Pharm Exp Ther. 2011;336:296–302. doi: 10.1124/jpet.110.173948. [DOI] [PubMed] [Google Scholar]
- 11.Reiter E, Ahn S, Shukla AK, Lefkowitz RJ. Molecular mechanism of beta-arrestin-biased agonism at seven-transmembrane receptors. Annu Rev Pharmacol Toxicol. 2012;52:179–197. doi: 10.1146/annurev.pharmtox.010909.105800. [DOI] [PMC free article] [PubMed] [Google Scholar]
- 12.Cherezov V, Rosenbaum DM, Hanson MA, Rasmussen SG, Thian FS, Kobilka TS, Choi HJ, Kuhn P, Weis WI, Kobilka BK, Stevens RC. High-resolution crystal structure of an engineered human beta2-adrenergic G protein-coupled receptor. Science. 2007;318:1258–1265. doi: 10.1126/science.1150577. [DOI] [PMC free article] [PubMed] [Google Scholar]
- 13.Warne T, Serrano-Vega MJ, Baker JG, Moukhametzianov R, Edwards PC, Henderson R, Leslie AG, Tate CG, Schertler GF. Structure of a beta1-adrenergic G-protein-coupled receptor. Nature. 2008;454:486–491. doi: 10.1038/nature07101. [DOI] [PMC free article] [PubMed] [Google Scholar]
- 14.Jaakola VP, Griffith MT, Hanson MA, Cherezov V, Chien EY, Lane JR, Ijzerman AP, Stevens RC. The 2.6 angstrom crystal structure of a human A2A adenosine receptor bound to an antagonist. Science. 2008;322:1211–1217. doi: 10.1126/science.1164772. [DOI] [PMC free article] [PubMed] [Google Scholar]
- 15.Hanson MA, Cherezov V, Griffith MT, Roth CB, Jaakola VP, Chien EY, Velasquez J, Kuhn P, Stevens RC. A specific cholesterol binding site is established by the 2.8 a structure of the human beta2-adrenergic receptor. Structure. 2008;16:897–905. doi: 10.1016/j.str.2008.05.001. [DOI] [PMC free article] [PubMed] [Google Scholar]
- 16.Chien EY, Liu W, Zhao Q, Katritch V, Han GW, Hanson MA, Shi L, Newman AH, Javitch JA, Cherezov V, Stevens RC. Structure of the human dopamine D3 receptor in complex with a D2/D3 selective antagonist. Science. 2010;330:1091–1095. doi: 10.1126/science.1197410. [DOI] [PMC free article] [PubMed] [Google Scholar]
- 17.Wu B, Chien EY, Mol CD, Fenalti G, Liu W, Katritch V, Abagyan R, Brooun A, Wells P, Bi FC, Hamel DJ, Kuhn P, Handel TM, Cherezov V, Stevens RC. Structures of the CXCR4 chemokine GPCR with small-molecule and cyclic peptide antagonists. Science. 2010;330:1066–1071. doi: 10.1126/science.1194396. [DOI] [PMC free article] [PubMed] [Google Scholar]
- 18.Wu H, Wacker D, Mileni M, Katritch V, Han GW, Vardy E, Liu W, Thompson AA, Huang XP, Carroll FI, Mascarella SW, Westkaemper RB, Mosier PD, Roth BL, Cherezov V, Stevens RC. Structure of the human kappa-opioid receptor in complex with JDTic. Nature. 2012;485:327–332. doi: 10.1038/nature10939. [DOI] [PMC free article] [PubMed] [Google Scholar]
- 19.Hereld D, Jin T. Slamming the DOR on chemokine receptor signaling: heterodimerization silences ligand-occupied CXCR4 and delta-opioid receptors. Eur J Immunol. 2008;38:334–337. doi: 10.1002/eji.200738101. [DOI] [PubMed] [Google Scholar]
- 20.Mellado M, Rodriguez-Frade JM, Vila-Coro AJ, Fernandez S, de Martin Ana A, Jones DR, Toran JL, Martinez AC. Chemokine receptor homo- or heterodimerization activates distinct signaling pathways. EMBO J. 2001;20:2497–2507. doi: 10.1093/emboj/20.10.2497. [DOI] [PMC free article] [PubMed] [Google Scholar]
- 21.Sohy D, Parmentier M, Springael JY. Allosteric transinhibition by specific antagonists in CCR2/CXCR4 heterodimers. J Biol Chem. 2007;282:30062–30069. doi: 10.1074/jbc.M705302200. [DOI] [PubMed] [Google Scholar]
- 22.McLaughlin JN, Patterson MM, Malik AB. Protease-activated receptor-3 (PAR3) regulates PAR1 signaling by receptor dimerization. Proc Natl Acad Sci USA. 2007;104:5662–5667. doi: 10.1073/pnas.0700763104. [DOI] [PMC free article] [PubMed] [Google Scholar]
- 23.Leger AJ, Jacques SL, Badar J, Kaneider NC, Derian CK, Andrade-Gordon P, Covic L, Kuliopulos A. Blocking the protease-activated receptor 1-4 heterodimer in platelet-mediated thrombosis. Circulation. 2006;113:1244–1254. doi: 10.1161/CIRCULATIONAHA.105.587758. [DOI] [PubMed] [Google Scholar]
- 24.Kaneider NC, Leger AJ, Agarwal A, Nguyen N, Perides G, Derian C, Covic L, Kuliopulos A. ‘Role reversal’ for the receptor PAR1 in sepsis-induced vascular damage. Nat Immunol. 2007;8:1303–1312. doi: 10.1038/ni1525. [DOI] [PMC free article] [PubMed] [Google Scholar]
- 25.Nystedt S, Ramakrishnan V, Sundelin J. The proteinase-activated receptor 2 is induced by inflammatory mediators in human endothelial cells. Comparison with the thrombin receptor. J Biol Chem. 1996;271:14910–14915. doi: 10.1074/jbc.271.25.14910. [DOI] [PubMed] [Google Scholar]
- 26.O’Brien PJ, Prevost N, Molino M, Hollinger MK, Woolkalis MJ, Woulfe DS, Brass LF. Thrombin responses in human endothelial cells. Contributions from receptors other than PAR1 include the transactivation of PAR2 by thrombin-cleaved PAR1. J Biol Chem. 2000;275:13502–13509. doi: 10.1074/jbc.275.18.13502. [DOI] [PubMed] [Google Scholar]
- 27.Blackhart BD, Emilsson K, Nguyen D, Teng W, Martelli AJ, Nystedt S, Sundelin J, Scarborough RM. Ligand cross-reactivity within the protease-activated receptor family. J Biol Chem. 1996;271:16466–16471. doi: 10.1074/jbc.271.28.16466. [DOI] [PubMed] [Google Scholar]
- 28.Sevigny LM, Austin KM, Zhang P, Kasuda S, Koukos G, Sharifi S, Covic L, Kuliopulos A. Protease-activated receptor-2 modulates protease-activated receptor-1-driven neointimal hyperplasia. Arterioscler Thromb Vasc Biol. 2012;31:e100–e106. doi: 10.1161/ATVBAHA.111.238261. [DOI] [PMC free article] [PubMed] [Google Scholar]
- 29.Lin H, Trejo J. Transactivation of the PAR1-PAR2 heterodimer by thrombin elicits beta-arrestin-mediated endosomal signaling. J Biol Chem. 2013;288:11203–11215. doi: 10.1074/jbc.M112.439950. [DOI] [PMC free article] [PubMed] [Google Scholar]
- 30.Cross JC, Baczyk D, Dobric N, Hemberger M, Hughes M, Simmons DG, Yamamoto H, Kingdom JC. Genes, development and evolution of the placenta. Placenta. 2003;24:123–130. doi: 10.1053/plac.2002.0887. [DOI] [PubMed] [Google Scholar]
- 31.Cross JC, Werb Z, Fisher SJ. Implantation and the placenta: key pieces of the development puzzle. Science. 1994;266:1508–1518. doi: 10.1126/science.7985020. [DOI] [PubMed] [Google Scholar]
- 32.Aplin JD, Straszewski-Chavez SL, Kalionis B, Dunk C, Morrish D, Forbes K, Baczyk D, Rote N, Malassine A, Knofler M. Trophoblast differentiation: progenitor cells, fusion and migration: a workshop report. Placenta. 2006;27(Suppl A):S141–S143. doi: 10.1016/j.placenta.2006.01.011. [DOI] [PubMed] [Google Scholar]
- 33.Grisaru-Granovsky S, Maoz M, Barzilay O, Yin YJ, Prus D, Bar-Shavit R. Protease activated receptor-1, PAR1, promotes placenta trophoblast invasion and beta-catenin stabilization. J Cell Physiol. 2009;218:512–521. doi: 10.1002/jcp.21625. [DOI] [PubMed] [Google Scholar]
- 34.Genbacev O, Schubach SA, Miller RK. Villous culture of first trimester human placenta–model to study extravillous trophoblast (EVT) differentiation. Placenta. 1992;13:439–461. doi: 10.1016/0143-4004(92)90051-T. [DOI] [PubMed] [Google Scholar]
- 35.Bose P, Kadyrov M, Goldin R, Hahn S, Backos M, Regan L, Huppertz B. Aberrations of early trophoblast differentiation predispose to pregnancy failure: lessons from the anti-phospholipid syndrome. Placenta. 2006;27:869–875. doi: 10.1016/j.placenta.2005.09.007. [DOI] [PubMed] [Google Scholar]
- 36.Bischof P, Irminger-Finger I. The human cytotrophoblastic cell, a mononuclear chameleon. Int J Biochem Cell Biol. 2005;37:1–16. doi: 10.1016/j.biocel.2004.05.014. [DOI] [PubMed] [Google Scholar]
- 37.Cohen I, Maoz M, Turm H, Grisaru-Granovsky S, Maly B, Uziely B, Weiss E, Abramovitch R, Gross E, Barzilay O, Qiu Y, Bar-Shavit R. Etk/Bmx regulates proteinase-activated-receptor1 (PAR1) in breast cancer invasion: signaling partners, hierarchy and physiological significance. PLoS ONE. 2010;5:e11135. doi: 10.1371/journal.pone.0011135. [DOI] [PMC free article] [PubMed] [Google Scholar]
- 38.Hollenberg MD, Saifeddine M, al-Ani B, Kawabata A. Proteinase-activated receptors: structural requirements for activity, receptor cross-reactivity, and receptor selectivity of receptor-activating peptides. Can J Physiol Pharmacol. 1997;75:832–841. doi: 10.1139/y97-110. [DOI] [PubMed] [Google Scholar]
- 39.Colburn NH, Bruegge WF, Bates JR, Gray RH, Rossen JD, Kelsey WH, Shimada T. Correlation of anchorage-independent growth with tumorigenicity of chemically transformed mouse epidermal cells. Cancer Res. 1978;38:624–634. [PubMed] [Google Scholar]
- 40.Dodson MG, Slota J, Lange C, Major E. Distinction of the phenotypes of in vitro anchorage-independent soft-agar growth and in vivo tumorigenicity in the nude mouse. Cancer Res. 1981;41:1441–1446. [PubMed] [Google Scholar]
- 41.Pawlinski R, Holinstat M. We can do it together: PAR1/PAR2 heterodimer signaling in VSMCs. Arterioscler Thromb Vasc Biol. 2011;12:2775–2776. doi: 10.1161/ATVBAHA.111.238865. [DOI] [PMC free article] [PubMed] [Google Scholar]
- 42.Paing MM, Johnston CA, Siderovski DP, Trejo J. Clathrin adaptor AP2 regulates thrombin receptor constitutive internalization and endothelial cell resensitization. Mol Cell Biol. 2006;26:3231–3242. doi: 10.1128/MCB.26.8.3231-3242.2006. [DOI] [PMC free article] [PubMed] [Google Scholar]
- 43.Turm H, Maoz M, Katz V, Yin YJ, Offermanns S, Bar-Shavit R. Protease-activated receptor-1 (PAR1) acts via a novel Galpha13-dishevelled axis to stabilize beta-catenin levels. J Biol Chem. 2010;285:15137–15148. doi: 10.1074/jbc.M109.072843. [DOI] [PMC free article] [PubMed] [Google Scholar]
- 44.Stalheim L, Ding Y, Gullapalli A, Paing MM, Wolfe BL, Morris DR, Trejo J. Multiple independent functions of arrestins in the regulation of protease-activated receptor-2 signaling and trafficking. Mol Pharmacol. 2005;67:78–87. doi: 10.1124/mol.104.006072. [DOI] [PubMed] [Google Scholar]
- 45.McCoy KL, Traynelis SF, Hepler JR. PAR1 and PAR2 couple to overlapping and distinct sets of G proteins and linked signaling pathways to differentially regulate cell physiology. Mol Pharmacol. 2010;77:1005–1015. doi: 10.1124/mol.109.062018. [DOI] [PMC free article] [PubMed] [Google Scholar]
- 46.Lohse MJ. Dimerization in GPCR mobility and signaling. Curr Opin Pharmacol. 2010;10:53–58. doi: 10.1016/j.coph.2009.10.007. [DOI] [PubMed] [Google Scholar]
- 47.Versteeg HH, Schaffner F, Kerver M, Ellies LG, Andrade-Gordon P, Mueller BM, Ruf W. Protease-activated receptor (PAR) 2, but not PAR1, signaling promotes the development of mammary adenocarcinoma in polyoma middle T mice. Cancer Res. 2008;68:7219–7227. doi: 10.1158/0008-5472.CAN-08-0419. [DOI] [PMC free article] [PubMed] [Google Scholar]
- 48.Schaffner F, Versteeg HH, Schillert A, Yokota N, Petersen LC, Mueller BM, Ruf W. Cooperation of tissue factor cytoplasmic domain and PAR2 signaling in breast cancer development. Blood. 2010;116:6106–6113. doi: 10.1182/blood-2010-06-289314. [DOI] [PMC free article] [PubMed] [Google Scholar]
- 49.Morris DR, Ding Y, Ricks TK, Gullapalli A, Wolfe BL, Trejo J. Protease-activated receptor-2 is essential for factor VIIa and Xa-induced signaling, migration, and invasion of breast cancer cells. Cancer Res. 2006;66:307–314. doi: 10.1158/0008-5472.CAN-05-1735. [DOI] [PubMed] [Google Scholar]
- 50.Even-Ram SC, Grisaru-Granovsky S, Pruss D, Maoz M, Salah Z, Yong-Jun Y, Bar-Shavit R. The pattern of expression of protease-activated receptors (PARs) during early trophoblast development. J Pathol. 2003;200:47–52. doi: 10.1002/path.1338. [DOI] [PubMed] [Google Scholar]
- 51.O’Brien PJ, Koi H, Parry S, Brass LF, Strauss JF, Wang LP, Tomaszewski JE, Christenson LK. Thrombin receptors and protease-activated receptor-2 in human placentation: receptor activation mediates extravillous trophoblast invasion in vitro. Am J Pathol. 2003;163:1245–1254. doi: 10.1016/S0002-9440(10)63484-0. [DOI] [PMC free article] [PubMed] [Google Scholar]
Associated Data
This section collects any data citations, data availability statements, or supplementary materials included in this article.