

Abstract
Local and long-distance transport of cytoskeletal proteins is vital to neuronal maintenance and growth. Though recent progress has provided insight into the movement of microtubules and neurofilaments, mechanisms underlying the movement of actin remain elusive, in large part due to rapid transitions between its filament states and its diverse cellular localization and function. In this work, we integrated live imaging of rat sensory neurons, image processing, multiple regression analysis, and mathematical modeling to perform the first quantitative, high-resolution investigation of GFP-actin identity and movement in individual axons. Our data revealed that filamentous actin densities arise along the length of the axon and move short but significant distances bidirectionally, with a net anterograde bias. We directly tested the role of actin and microtubules in this movement. We also confirmed a role for actin densities in extension of axonal filopodia, and demonstrated intermittent correlation of actin and mitochondrial movement. Our results support a novel mechanism underlying slow component axonal transport, in which the stability of both microtubule and actin cytoskeletal components influence the mobility of filamentous actin.
Electronic supplementary material
The online version of this article (doi:10.1007/s00018-015-1933-z) contains supplementary material, which is available to authorized users.
Keywords: Axonal transport, Actin, Microtubule, Cytoskeleton, Slow component B
Introduction
Actin microfilaments play key structural and signaling roles in the development and maintenance of cell morphology, motility, and function [1–5]. In neurons, through the activity of myosin motors, actin also supports the short-range axonal movement of many cargoes [6–9], often complementing long-range transport upon microtubules [10, 11]. Measurements of in vivo rates of bulk protein transport indicate that actin, like microtubules and neurofilaments, is transported in the “slow component” (SC) of axonal transport [12].
Microtubules and neurofilaments in the axonal core are transported in the slower subpopulation of SC (SCa; [13–16]) as small filaments, via microtubule-based motor proteins in short bursts punctuated by frequent pauses [17–19]. Actin, which localizes largely to the axonal cortex and occasionally as short filaments within the axonal core [20–23], moves primarily, though not exclusively, in the faster subpopulation (SCb; [14, 24]). Other SCb cargoes move upon microtubules, independent of actin [25, 26], but mechanisms underlying the transport of actin itself are less clear. Biochemical studies indicate that axonal actin exists dynamically in soluble and filamentous states [27, 28]. Although soluble actin may move through diffusion [29], several studies indicate bulk transport of insoluble actin in a microtubule-dependent manner [24, 30–33]. Additionally, actin “waves” move anterogradely in vitro and in vivo [34–36], and patches of F-actin give rise to filopodia [20, 37]. Finally, indirect evidence suggests that mechanical deformation enhances actin mobility within axons [38]. In short, both the mechanism of actin transport, and the state of actin during that transport remain unclear.
To better integrate the seemingly disparate evidence of rapid transitions between actin filament states, variation in cellular localization, and diversity of function, a mechanistic understanding of the axonal movement of actin is essential, but complex. In this study, we quantitatively characterized axonal actin mobility using high-resolution imaging and image processing of fluorescently labeled actin and targeted perturbation of actin and microtubule stability. We supplemented experimental studies with multiple regression analysis and mathematical modeling of actin mobility. We observed transient filamentous actin densities that moved bidirectionally, but with an anterograde bias consistent with SC transport. These densities localized with axonal filopodia, focal adhesions and mitochondria, and required both actin and microtubule network stability for proper movement. Our data support a novel mechanism of slow transport, in which both microtubules and actin regulate the mobility of dynamic pools of filamentous actin.
Results
Biological roles for actin densities
Rat sensory neurons transfected with GFP-actin were imaged and frequent densities of GFP were noted above a general low level of background fluorescence. These densities arose and disappeared along the length of the axon and exhibited complex trajectories during their lifetime (Movie 1). Some moved bidirectionally with pauses, while others remained stationary. We first evaluated their dynamic co-localization with mitochondria and filopodia, two structures known to interact with actin in the axon. Stationary mitochondria co-localize with actin, are transported along the actin network by myosin, and require actin for docking in the growth cone [37, 39–42]. Similarly, filamentous actin densities are implicated in the formation of axonal filopodia in chick DRG [20, 37].
Mitochondria
Cells expressing GFP-actin were labeled with a dye targeting viable mitochondria (MitoTracker Red CMX Ros) to examine the possibility that the motion of GFP-actin correlated with that of mitochondria (Fig. 1). Kymographs illustrated the dynamic nature of actin (Fig. 1a–c) as well as the qualitative differences in the movement of actin densities compared to mitochondria [41, 42], and the varying durations of co-localized trajectories between actin and mitochondria. Actin densities not co-localizing with mitochondria appeared particularly dynamic (Fig. 1a), though they were often motile even in regions flanking mitochondria (Fig. 1b, arrow). Additionally, not all trajectories of stationary actin densities correlated with mitochondrial trajectories (Fig. 1c, arrows), and vice versa. Of the 104 events during which actin shared a common trajectory with a mitochondrion (for at least 30 s), 74 % of the mitochondria/actin pairs were stationary (77/104), and necessarily shared the same trajectory for the entire imaging duration (Fig. 1a). The remaining pairs reflected mobile mitochondria intermittently sharing a common trajectory with stationary actin (14.4 %; 15/104), mobile actin with stationary mitochondria (10.6 %; 11/104), and mobile mitochondria and actin (<1 %; 1/104). For these mobile populations, actin and mitochondrial trajectories overlapped for 53.9 ± 3.6 % of the sampling duration. Thus, co-localization of actin and mitochondrial trajectories within the axon, though not permanent, appeared to be persistent.
Fig. 1.

Actin and mitochondrial trajectories intermittently co-localize and actin localizes to filopodia in the axon. 104 co-localization events between actin and mitochondria were observed in axons transfected with GFP-actin and labeled with MitoTracker Red CMX Ros. Three sample kymographs are shown. a Correlation of actin and mitochondrial trajectories is intermittent. b Not all mitochondrial trajectories may be mapped to an actin trajectory (stars) and actin puncta that co-localize with mitochondria can still be motile. Here, an actin puncta moves away from the mitochondrion and later returns (arrow). c Not all stationary actin densities are localized to stationary mitochondria (arrows). d In 25 of the 48 axons examined, a subset of mobile actin densities gave rise to filopodia that protrude from the axon. Individual filopodia were dynamic, often protruding out of the axon at one angle, and then moving through an arc before retracting. e Immunohistochemistry showed talin localized to the base of filopodia, suggesting that filopodia protrude from regions of stable adhesion to the substrate. The starred filopodium at top is from another axon outside the field of view (horizontal scale bar 5 µm in d, e. 10 µm in all others. Vertical scale bar 1 min)
Filopodia
Only 25 of the 48 axons (54.5 %) examined developed any filopodia. Of those, an average of 1.75 filopodia developed per minute along the axon, comparable to previously reported rates [37]. 51.4 % of the observed filopodia were populated with GFP-actin densities. Filopodia containing GFP-actin densities were slightly longer, but not significantly so, than those without (mean ± SD 3 ± 1.57 μm vs. 2.4 ± 0.81 μm), and there was no difference between the total lifetime of filopodia with GFP-actin and those without (32.4 ± 15.2 s vs. 31.8 ± 14.0 s). Similarly, there was no difference between the time it took filopodia to reach their maximum length (5.9 ± 4.7 s vs. 6.3 ± 4.8 s) or to retract back into the axon (14.6 ± 9.1 s vs. 13.0 ± 7.8 s). Independent of actin content, most filopodia protruded perpendicular to the axon [94.6° ± 29° (GFP-actin) vs. 90.6° ± 30.3° (no GFP-actin)], but it was not uncommon for one to protrude at a more acute angle or to move with respect to the axon, so that the angle between the two changed, or even to fuse with neighboring filopodia, suggesting active structural remodeling (Fig. 1d). In fact, filopodia tended to protrude with their tips pointed slightly toward the cell body, but it is unclear if this implies a polarity within the underlying actin cytoskeleton. The focal adhesion protein talin localized to the base of filopodia, and in some cases, filled the bodies of individual filopodia as well, suggesting that filopodia protrude from stable adhesive islands along the axon (Fig. 1e). Analysis of actin and talin localization in axons with filopodia indicated strong and significant co-localization [Manders coefficients M1 (talin with actin) = 0.72, M2 (actin with talin) = 0.58, and p > 0.95 (Costes method)].
Polymerization state of actin in densities
A key and unique feature of the actin densities was their appearance and disappearance over time. Densities arose above, and disappeared back into, a low level of background fluorescence. Both soluble and filamentous pools of actin exist in the axon [43–45] and so we next examined possible contributions of these two pools to the birth, death, composition and movement of the observed densities.
Assembly of actin densities
Fluorescence recovery after photobleaching (FRAP) within a region of interest (ROI, e.g., green box, Fig. 2a) in the axon was performed as an initial assessment of actin movement. In GFP-actin expressing axons, the average rate of fluorescence recovery was quite rapid. The time constant for complete recovery in axons expressing GFP-actin after bleaching was 12.8 ± 8.3 s, corresponding to a diffusion constant of 70.2 μm2/s. This is similar to previous values reported for actin monomers in endothelial cells [46], suggesting that the GFP-actin FRAP signal predominantly reflected movement of soluble monomers.
Fig. 2.
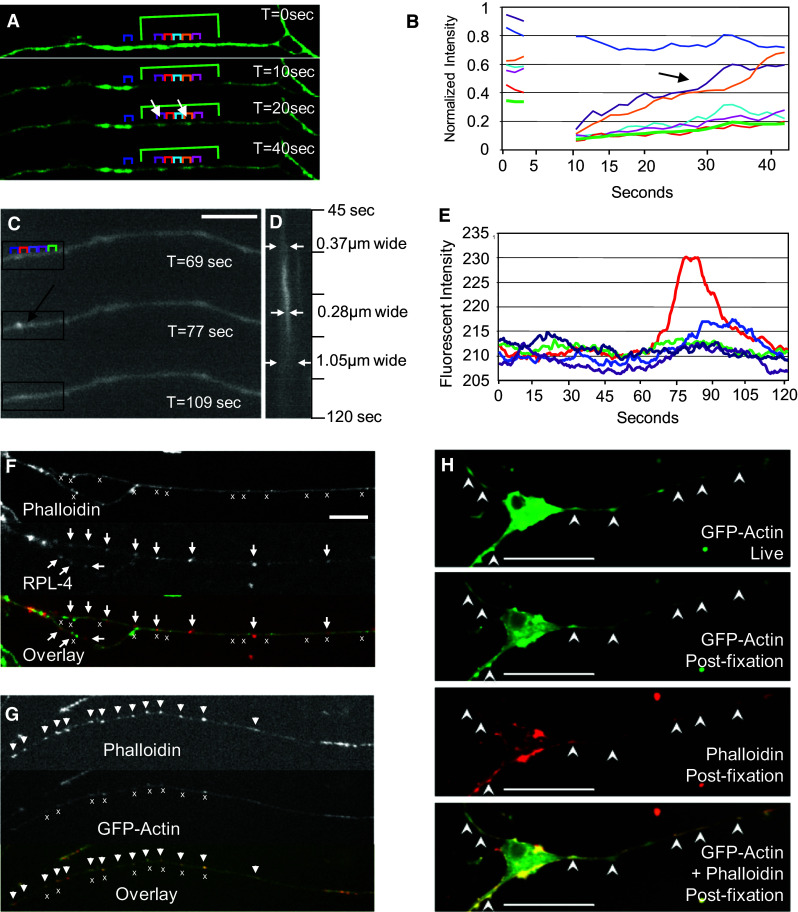
Contribution of soluble actin to the movement of actin densities in the axon. FRAP was used to determine the contribution of monomeric soluble actin to the movement of actin in the axon. a A 30 µm long region of the axon (indicated in green) was bleached and observed for recovery of fluorescence. 10 × 10 pixel regions of interest (ROIs, colored brackets) inside the axon were used to quantify the changing fluorescent signal over time. b Fluorescence recovery for the entire bleached region (thick green line) was used to calculate the time constant and diffusion coefficient for actin-GFP. Recovery was not uniform; the purple and the yellow regions recovered fluorescence much faster than the surrounding axon (black arrow). c Higher spatial and temporal resolution show the birth and death of an actin density (arrow). Selected frames are shown (scale bar 5 µm). d A kymograph of the region indicated in c, showing the change in width of the particle track (white arrows) over time. e Fluorescent intensity over time in the colored 10 × 10 pixel ROIs shown in c. Note the increased fluorescent intensity corresponding to the particle birth (red trace). f Lack of ribosomal co-localization with actin. Axons were stained for RPL-4 and labeled with phalloidin (cross symbols phalloidin, arrows RPL-4), scale bar 10 µm. g GFP-actin puncta co-labeled with phalloidin, suggesting they are composed of filamentous actin (cross symbols GFP-actin densities, arrows phalloidin). Nearly all of the GFP expressing puncta were phalloidin-positive, but some phalloidin-labeled puncta did not express GFP. h Localization of GFP-actin densities did not change before and after fixation. In addition, no new densities were formed, suggesting that fixation did not result in artifactual consolidation of actin or axonal collapse. Densities also co-localized with phalloidin, as in g
To ascertain whether GFP-actin FRAP was indeed attributable to diffusion of actin monomers, a second set of FRAP experiments were performed using axons expressing the Lifeact-TagGFP2 construct (lifeact). Lifeact is a fluorescently tagged actin filament binding protein, which does not label monomeric actin [47]. In lifeact expressing axons, the diffusion constant was more than threefold smaller (21.8 μm2/s) than for axons expressing GFP-actin, as expected for fluorescence recovery based on the diffusion of actin filaments (lifeact), rather than monomers (GFP-actin).
Interestingly, we rarely observed the movement of GFP-actin densities into the bleached region during the fluorescence recovery period; however, in several cases, actin densities spontaneously arose in the middle of the bleached region, at a site that happened to be bright before photobleaching, and recovered fluorescence much faster than surrounding regions of the axon (white arrows, Fig. 2a, and corresponding line traces indicated by black arrow in Fig. 2b).
To further examine the dynamics of a particle’s appearance and disappearance, movies captured at high magnification and high frame rate were analyzed in the absence of photobleaching. Selected frames from one of these movies (Fig. 2c) and the corresponding kymograph illustrate the characteristic appearance and disappearance of a particle (Fig. 2d). ROI analysis was used to calculate the average fluorescent intensity in sections of the axon around this particle (colored boxes in Fig. 2c) and line traces (Fig. 2e) illustrate the change in average fluorescent intensity over time for five of these regions. An obvious spot of fluorescence, representing an increase of ~10 % in intensity, emerged around 60 s and moved slightly in the anterograde direction before dissipating (Fig. 2d, e). This apparent coalescence followed by dissolution was characteristic of both GFP-actin densities as well as lifeact densities (Fig. 3), suggesting that small actin filaments may be undergoing bouts of organization and disorganization. The distinct narrowing of densities during coalescence suggests a consolidation of existing fluorescence rather than the de novo appearance of fluorescence. Nonetheless, to examine whether densities formed from newly synthesized protein translated by axonal ribosomes [48] in the axons of untransfected cells were co-labeled with phalloidin and an antibody against RPL-4, a ribosomal protein. Although both ribosomes and actin exhibited punctate expression in the axon, there was minimal overlap between the two [Fig. 2f, Manders coefficients M1 (ribosomes with actin) = 0.49 and M2 (actin with ribosomes) = 0.31, and p > 0.95 (Costes method)], suggesting that the birth of these densities did not occur at sites of local protein synthesis. Finally, to confirm that the actin densities were composed of filamentous actin, GFP-actin transfected cells were fixed and stained with Alexa-Fluor-594-phalloidin, which binds only to polymerized F-actin (Fig. 2g). Regions approximately 32 μm in length from four axons were analyzed. The average distance between phalloidin-labeled puncta was 1.1 μm. Almost all (97.8 %) of the GFP expressing puncta were labeled with phalloidin, consistent with a Manders co-localization coefficient of 0.9. Importantly, many phalloidin stained puncta did not express GFP and there was no spatial bias to GFP associated vs. non-GFP associated puncta, suggesting that densities containing GFP-actin are representative of native structures. Further, GFP-actin densities were identical before fixation, after fixation, and after phalloidin-labeling; thus, co-localization with phalloidin did not reflect the collapse of GFP-actin into puncta during fixation (Fig. 2h).
Fig. 3.
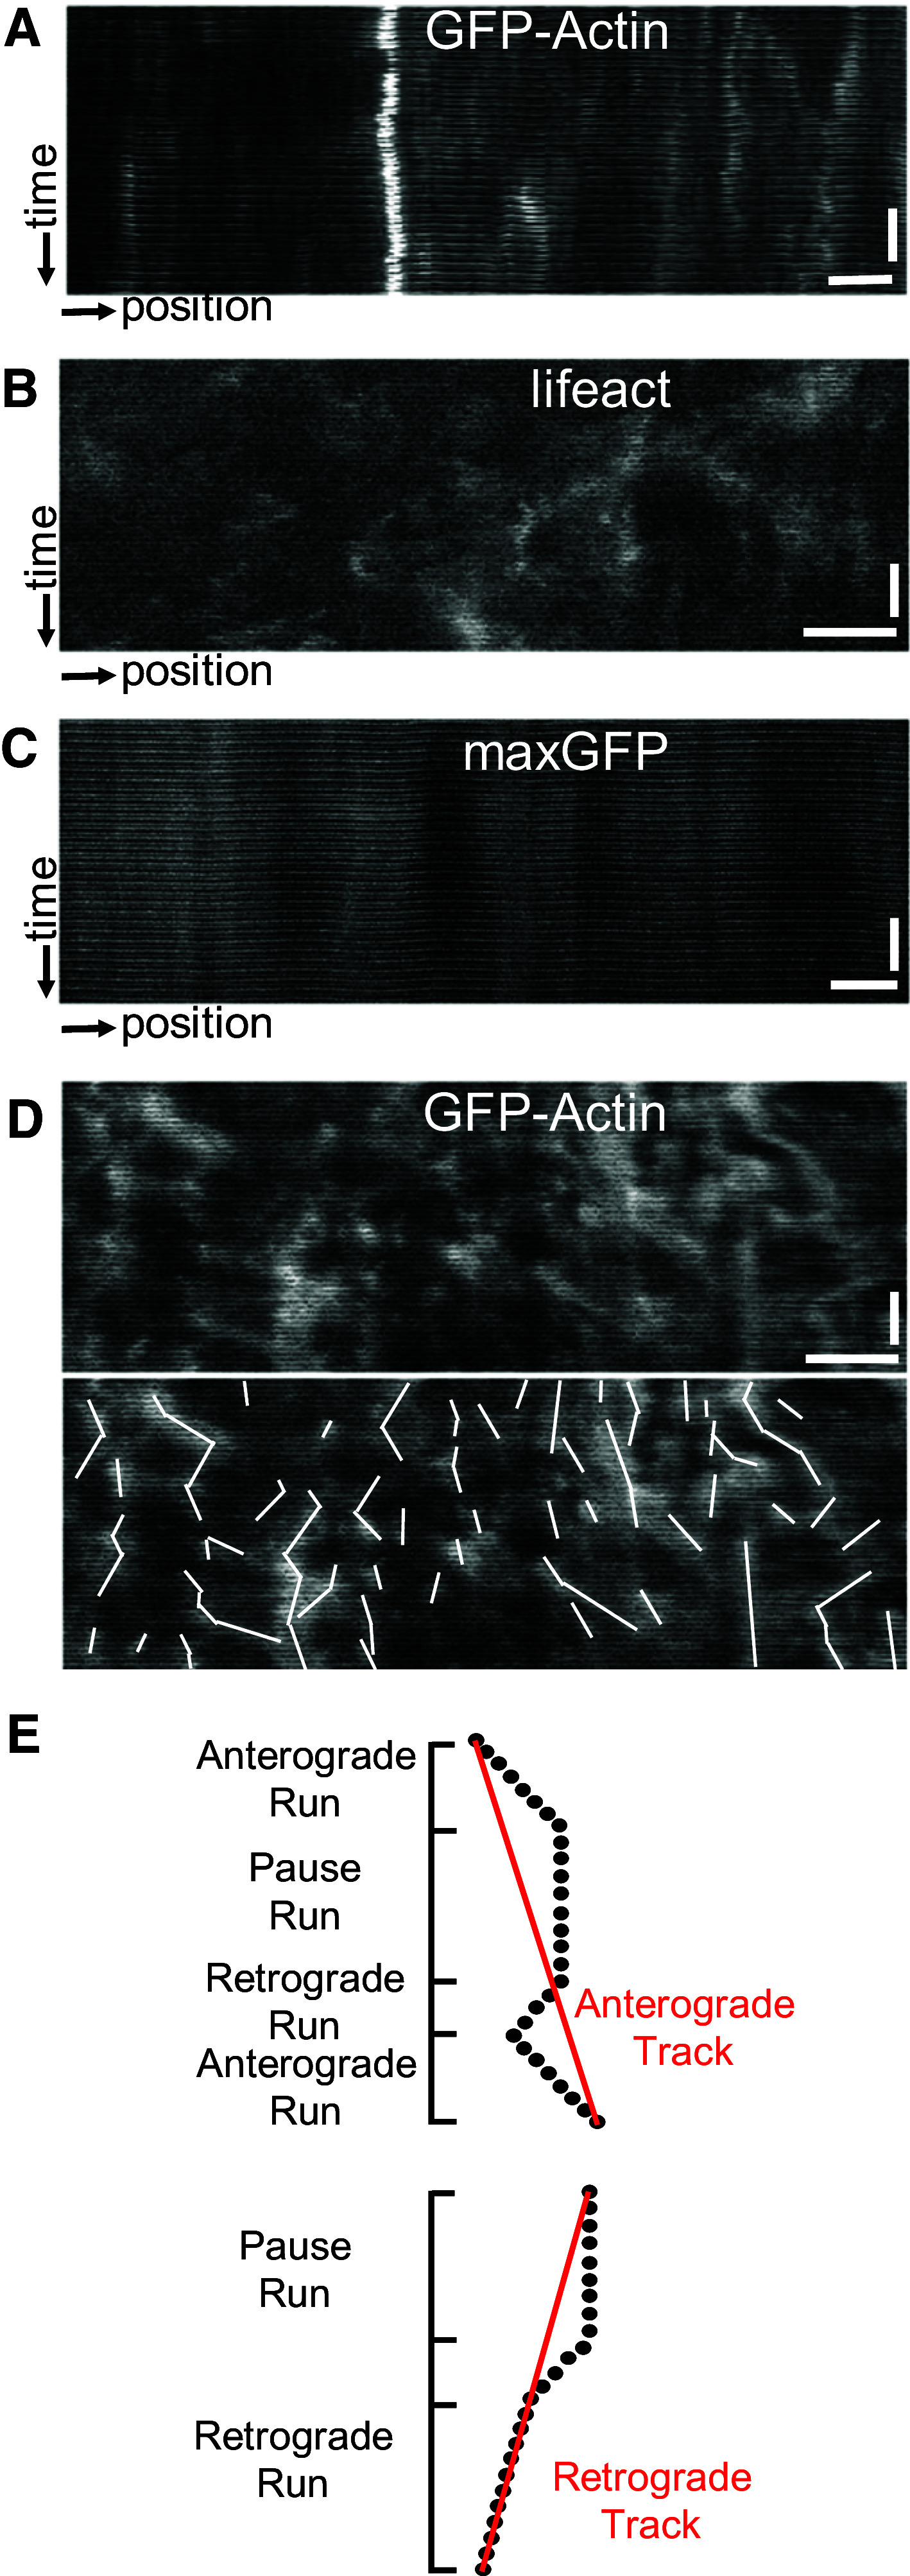
Actin densities move dynamically in the axon. Transport parameters were measured from kymographs of neurons with GFP-actin, Lifeact-TagGFP2 or maxGFP and are reported in Table 1. a GFP-actin axons showed transient dynamic puncta that moved bidirectionally. b Lifeact-TagGFP2, which binds to filamentous actin, exhibited punctate expression in the axon with similar dynamics to GFP-actin. c Puncta in axons with maxGFP exhibited distinct behavior compared to GFP-actin or Lifeact-TagGFP2 axons. Horizontal scale bar 10 µm. Vertical scale bar 1 min. d An example of the type of particle movement observed in the axon (top) and corresponding line traces of the particle paths (bottom) for GFP-actin expressing axons. e Particle tracks were divided into “runs” during which the particle moved in one direction or remained paused. A track was composed of sequential runs and categorized directionally directed based on its net displacement (red lines). Anterograde tracks could contain retrograde-directed runs, and vice versa. Also, a change in velocity without a change in direction was still counted as a single run (e.g., retrograde track)
Quantitative characterization of actin mobility
To further characterize GFP-actin densities, and confirm their identity as filamentous actin, kymography was used to quantify the movement characteristics of particles in axons expressing one of three different fluorescent proteins: GFP-actin, lifeact, or maxGFP. Previous results (above) showed no differences in cellular morphology or in phalloidin-labeled puncta between GFP-actin expressing and non-expressing neurons. Similarities in GFP-actin and lifeact densities also suggested that actin densities contained filamentous actin, as lifeact labels only filamentous actin. However, there was concern that GFP-actin expression would introduce artifacts associated with actin over-expression in the axon. Thus, dynamics of GFP-actin and lifeact densities were compared to test for differences in their behavior. In addition, a soluble, biologically inert fluorescent protein, maxGFP, was examined as a negative control, to determine whether the movement of actin-GFP (or lifeact) densities was specific to actin or due to the general behavior of soluble axoplasmic proteins.
Qualitatively, kymographs of GFP-actin and lifeact appeared similar to each other and distinct from those of maxGFP (Fig. 3a–d, Movies 1, 2). Because of its complexity, the trajectory of a particle over its entire lifetime (defined to be “a track”) was traced and divided into smaller directional trajectories (defined to be runs; Fig. 3d, e) for quantitative analysis. Though many particles moved directionally, they moved in a saltatory fashion; anterograde- and retrograde-directed tracks each spent approximately one-third of the total track duration paused. Similarly, particles with no net directional displacement exhibited brief bursts of movement bidirectionally, spending 10–15 % of the total track duration moving in either direction. The average velocity, duration, and distance traveled by a particle in each direction are summarized in Table 1, with particle numbers, births, and directional counts summarized in Table 2. There were no significant differences between GFP-actin and lifeact for all transport parameters measured, except for the slow drift velocity of densities classified as stationary (Table 1).
Table 1.
Physical parameters of GFP labeled particles
| GFP-actin | Lifeact | MaxGFP | Nocodazole | Latrunculin | |
|---|---|---|---|---|---|
| Anterograde duration (s) | 28.79 ± 2.45 |
25.39 ± 1.89 NS |
29.51 ± 1.96 NS |
36.97 ± 8.66 NS |
41.65 ± 4.64 p = 0.006* |
| Anterograde distance (µm) | 1.73 ± 0.16 |
1.28 ± 0.10 p = 0.08# |
2.30 ± 0.38 NS |
2.21 ± 0.25 p = 0.07# |
2.69 ± 0.36 p = 0.005* |
| Anterograde velocity (µm/s) | 0.06 ± 0.005 |
0.05 ± 0.004 NS |
0.08 ± 0.02 NS |
0.07 ± 0.01 NS |
0.07 ± 0.006 NS |
| Stationary duration (s) | 35.61 ± 4.84 |
46.60 ± 8.75 NS |
130.67 ± 12.39 p = 3.6 × 10⁻⁸ * |
67.70 ± 14.64 p = 0.01* |
87.86 ± 23.25 p = 0.002* |
| Stationary distance (µm) | 0.03 ± 0.02 |
−0.02 ± 0.005 NS |
0.05 ± 004 NS |
0.12 ± 0.09 NS |
−0.08 ± 0.08 p = 0.07# |
| Stationary velocity (µm/s) | 0 ± 0.00 |
−0.001 ± 0.000 p = 0.007* |
0.001 ± 0.001 p = 0.08# |
0.002 ± 0.001 p = 0.01* |
0.002 ± 0.000 p = 0.01* |
| Retrograde duration (s) | 26.29 ± 2.84 |
22.06 ± 1.74 NS |
43.10 ± 4.54 p = 0.002* |
32.90 ± 3.44 NS |
35.28 ± 5.24 p = 0.08# |
| Retrograde distance (µm) | −1.51 ± 0.16 |
−1.26 ± 0.18 NS |
−14.70 ± 3.36 p = 4 × 10⁻⁴ * |
−1.91 ± 0.23 NS |
−3.10 ± 0.81 p = 0.006* |
| Retrograde velocity (µm/s) | −0.06 ± 0.003 |
−0.06 ± 0.004 NS |
−0.24 ± 0.04 p = 8 × 10⁻⁵ * |
−0.06 ± 0.008 NS |
−0.08 ± 0.01 p = 0.01* |
Transport parameters for puncta in axons expressing GFP-actin (974 puncta in 16 axons), Lifeact (290 puncta in 5 axons), and maxGFP (394 puncta in 5 axons), and in GFP-actin axons after treatment with nocodazole (789 puncta in 9 axons) or latrunculin (370 puncta in 6 axons). Data is expressed as mean ± SEM. A t test with Bonferroni’s correction was used to determine significant differences compared to untreated GFP-actin axons (p values are reported for all comparisons; * significant difference from GFP-actin (p < 0.0125), # strong trend (p < 0.1); NS no significant difference)
Table 2.
Track numbers and directional populations per axon for all experimental groups
| Number of tracks | Number of new tracks | Retrograde tracks | Stationary tracks | Anterograde tracks | |
|---|---|---|---|---|---|
| Actin-GFP | 60.81 ± 9.89 | 47.8 ± 8.67 | 21.06 ± 3.18 | 15.313 ± 3.42 | 24.44 ± 4.84 |
| Lifeact-GFP | 60.08 ± 8.84 | 46.4 ± 8.18 | 19.04 ± 3.81 | 22.08 ± 4.63 | 18.96 ± 3.75 |
| GFP | 24.63 ± 4.34* | 13.3 ± 3.15* | 8 ± 1.36* | 8.44 ± 1.73* | 8.19 ± 2.08* |
| Nocodazole | 30.78 ± 3.93* | 27.7 ± 3.9* | 10.11 ± 2.16* | 5.33 ± 1.69* | 15.33 ± 1.82* |
| Latrunculin | 36.67 ± 3.70* | 29.7 ± 2.90* | 16.17 ± 2.09 | 4 ± 1.39* | 16.5 ± 1.52* |
Values are reported as mean ± SEM. Sample sizes are as for Table 1
* Significant difference from Actin-GFP (t test with Bonferroni’s correction)
In contrast, there were many significant differences between GFP-actin and lifeact compared to maxGFP. The number of overall puncta in maxGFP expressing axons (24 ± 15) was much lower than in axons expressing GFP-actin (61 ± 31) or lifeact (60 ± 20). Also, fewer new puncta appeared during the imaging period (13 ± 11 for maxGFP, 46 ± 18 for lifeact, 48 ± 27 for GFP-actin, Table 2). In addition, over 80 % of the total combined time for all runs in maxGFP expressing axons was spent stationary (Table 1). The most striking feature in maxGFP expressing axons was the observation of occasional fast cargoes (>1 m/s), which moved primarily in the retrograde direction and resulted in a very large retrograde average velocity, duration, and displacement (Table 1). Such cargoes likely “hitchhiked” on or in existing retrograde cargoes, and were observed only once in all of the GFP-actin kymographs (974 tracks) and never in the lifeact expressing axons. Importantly, maxGFP velocity calculated without including the fast moving maxGFP particles was not significantly different from zero.
Multiple regression analysis revealed a strong model fit (r 2 > 0.79), and emphasized key parameters contributing to particle movement. This analysis also indicated differences between GFP-actin and lifeact expressing axons and those expressing maxGFP (Table 3). The net displacement of particles in GFP-actin expressing axons was most dependent on the time spent moving either in the anterograde or retrograde direction (β = 0.48 and −0.41, respectively), followed by the overall average velocity (β = 0.24) and lastly by the average velocity in the anterograde and retrograde directions (β = 0.15 and 0.12, respectively). The β weights were similar for particles in lifeact expressing axons. Conversely, for maxGFP expressing axons, the displacement was dominated by the average velocity (β = 0.60) and the time spent moving in the retrograde direction (β = −0.39), again reflecting contributions of the apparently artifactual fast retrograde pool. Collectively, these results indicated a strong similarity in the movement of GFP-actin and lifeact, which was distinct from maxGFP, providing further evidence that GFP-actin densities were filamentous.
Table 3.
Beta weights of parameters from regression analysis
| GFP-actin | Lifeact | MaxGFP | Nocodazole | Latrunculin | |
|---|---|---|---|---|---|
| Average total velocity | 0.2412 | 0.2488 | 0.6024 | 0.2161 | 0.2372 |
| Total time | 0 | 0 | −0.0332 | 0 | −0.033 |
| Average anterograde velocity | 0.1544 | 0.1291 | −0.0279 | 0.1792 | 0.1739 |
| Time anterior | 0.4833 | 0.4171 | 0.0895 | 0.4676 | 0.3244 |
| Average stationary velocity | 0.0396 | 0.1036 | −0.0111 | 0.0615 | 0.0946 |
| Time stationary | 0.0089 | 0.0502 | 0 | 0.0479 | 0 |
| Average retrograde velocity | 0.1204 | 0.1704 | 0.0184 | 0.0616 | 0.3253 |
| Time retrograde | −0.4103 | −0.4863 | −0.386 | −0.3933 | −0.3112 |
| Goodness of fit (r 2) | 0.7901 | 0.8059 | 0.8107 | 0.7339 | 0.7134 |
The relative importance of parameters to the overall anterograde displacement of actin particles was analyzed by multiple regression analysis
Cytoskeletal influences on actin mobility
Having characterized the identity and movement of GFP-actin densities, we next investigated cytoskeletal regulation of the observed motion by perturbing polymerization of tubulin and actin. Pharmacological perturbation of these proteins was performed using the well-characterized reagents, nocodazole, latrunculin, and jasplakinolide, enabling temporal control and target specificity.
Nocodazole
We first examined the role of microtubule-based transport on actin mobility by exposing cells to 10 μM of the microtubule destabilizing agent nocodazole, a concentration that induced growth cone collapse within 5 min, but preserved axonal geometry. Untreated axons exhibited even tubulin staining (Fig. 4a) but treatment with nocodazole produced rapid and severe disruptions in the continuity of the microtubule cytoskeleton within 20 min (Fig. 4b). Despite these changes, axons were not globally destabilized and did not retract or bead, rendering them appropriate for mobility analysis (Fig. 4f, Movie 3). Nocodazole treatment resulted in a slightly increased average net displacement for actin densities compared to those in untreated axons (Fig. 4h). However, this increase was neither significant, nor were there significant changes in most directional parameters (Fig. 4i–k) or proportions of particle directionality (Fig. 4l). A significant increase in anterograde movement duration was observed (Table 1), but was offset by a significant increase in retrograde run length (Table 1). Changes in these two parameters as well as pause duration (Table 1) following microtubule disruption suggest that microtubule stability may influence the movement of individual actin densities, but that its aggregate influence is subtle. Consistent with measured parameters, multiple regression analysis suggested an increased importance of anterograde-directed velocity and decreased importance of retrograde time and velocity in accounting for the net displacement of particles compared to untreated axons (Table 3).
Fig. 4.
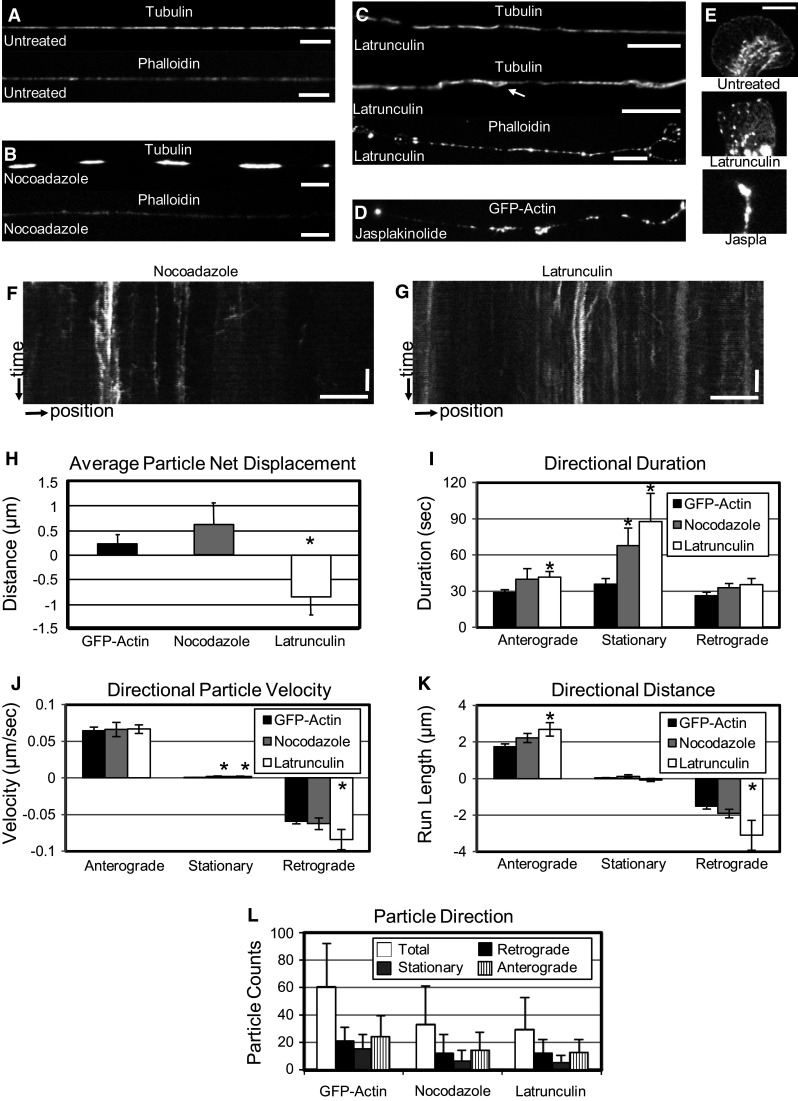
Both microtubule and actin stability are important for actin mobility. Cells were stained for filamentous actin and tubulin. a Untreated. b After nocodazole (10 μM) treatment. c After latrunculin (10 μM) treatment. d Jasplakinolide (10 μM) caused GFP-actin to form dense stationary puncta. e Latrunculin and jasplakinolide induced changes in growth cone morphology and actin disruption (scale bars 10 µm). Kymography was used to analyze the dynamics of GFP-actin particles after exposure to either f nocodazole, or g latrunculin. h Exposure to nocodazole increased anterograde-directed average net displacement in the axon, while exposure to latrunculin resulted in a retrograde-directed average net displacement. Average net displacement was calculated and influenced based on several measured parameters: i average particle velocity in a track, j average track duration, and k average distance traveled by a particle over the course of a track. Mathematically, average net displacement may be divided by the imaging period (6 min, in this case) to calculate net velocity. l Finally, treatment with either nocodazole or latrunculin decreased the total number of actin particles in axons, but had little effect on the direction of tracks. Asterisk indicates significance (p < 0.0125, Student’s t test with Bonferroni’s correction). Full data sets, including sample sizes and significance, are provided in Tables 1, 2
Latrunculin
We next evaluated the role of the structural integrity of the actin cytoskeleton on actin transport. Axons were exposed to 10 μM latrunculin, which, by binding to actin monomers, prevents the polymerization of actin filaments and disrupts the actin cytoskeleton [49]. Phalloidin staining of cells treated with latrunculin for 10 min revealed heterogeneous distribution of actin, with regions of the axons either void of actin or containing actin-enriched puncta as well as severely disrupted lamella (Fig. 4c). Additionally, the axonal microtubule network was also disrupted (Fig. 4c); there were regions of the axons devoid of microtubules and there was evidence of microtubules pushing out through the side of the axon (Fig. 4c, white arrow), emphasizing the interconnected nature of the actin and microtubule networks [50]. Despite these structural changes, many densities were still intact, and no global destabilization or retraction was observed (Fig. 4g, Movie 4). In contrast to nocodazole treatment, latrunculin treatment resulted in a large retrograde average net displacement (Fig. 4h), driven by significant increases in the duration (35 vs. 26 s), distance (3.1 vs. 1.5 μm) and velocity (0.08 vs. 0.06 μm/s) of retrograde-directed tracks, as well as a retrograde directionality for stationary tracks (Fig. 4i–k; Table 1). Latrunculin treatment also induced an increase in the duration (42 vs. 29 s) and distance (2.7 vs. 1.7 μm, Fig. 4i–k; Table 1) of anterograde-directed tracks, but did not have a significant effect on anterograde velocity. Results of multiple regression analysis support these observations as well; by far the most significant contributor to the observed dynamics was the retrograde velocity. Additionally, the importance of time spent in the anterograde direction was reduced compared to untreated or nocodazole treated axons. Finally, treating axons with latrunculin reduced the overall number of particle tracks. However, as for nocodazole, this reduction was primarily in paused tracks, with no directional bias (Fig. 4l).
Jasplakinolide
To further test the role of actin integrity on actin transport, neurons were exposed to 10 μM jasplakinolide, which promotes actin polymerization in cells by enhancing the rate of filament nucleation in a manner that depends on the concentration of monomeric actin [51, 52]. Treatment with jasplakinolide had a dramatic effect on actin in the axons (Fig. 4d). Almost immediately upon addition of the drug, large fluorescent accumulations appeared, which did not move for the remainder of the imaging time; there was a complete cessation of all activity. Growth cones were also severely compromised, collapsing rapidly to a dense fluorescent point (Fig. 4e). The rapid rate at which accumulations formed is consistent with the large pool of soluble monomeric actin implied by rapid FRAP (Fig. 2). In combination with the results following latrunculin treatment, these data suggest that actin polymerization and filament turnover both govern the formation and movement of actin densities.
Evaluation of directional changes using mathematical modeling
Treatment with nocodazole and latrunculin resulted in opposite changes to the directional displacement of actin particles. These contrasting responses were partially explained by differences in the contributions of specific transport parameters (Table 1). However, inspection of individual parameters and regression analysis cannot capture the significance of transitions of actin densities between the pools of stationary, anterograde-, or retrograde-directed particles, which could also drive directional biases. Thus, a simple reaction kinetics model was built in which rate constants, representing transition probabilities, were used to shift numbers and proportions of particles in each directional pool (Fig. 5c, cf. [53]), towards calculation of simulated average net displacement. Iterating the model through various combinations of a broad range of rate constants allowed identification of strong and, importantly, unique model fits, based on the minimization of error between model and measured displacement and directional particle numbers. For actin particles in untreated axons, the model found rate constants that fit with an extremely small mean square error (MSE; 0.010, ~0.08–0.36 %). In these axons, the rate constants suggest that for both retrograde- and anterograde-directed particles, the likelihood of stopping is approximately twice as great as the likelihood of a stationary particle initiating movement in either direction (Fig. 5e). Modeling of data from nocodazole treated axons also obtained a strong fit (MSE = 0.048, ~0.25–3.8 %). Compared to untreated axons, the likelihood of anterograde to stationary conversion decreased slightly, while the retrograde to stationary conversion likelihood remained unchanged. Additionally, stationary particles were much more likely to transition to the free pool than in untreated axons, and were also more likely to transition to this pool than to begin to move in either direction. Consistent with experimentally measured parameters, these results suggest an axon with overall decrease in actin densities, but an increased tendency of particles to move in the anterograde direction. Finally, modeling of data from latrunculin-treated axons resulted in a comparatively larger, but still reasonable MSE (0.316, ~1.2–14 %). This analysis showed a decrease in most rate constants, suggesting that transitions between directional pools have decreased. The notable exception was the large increase in the likelihood of anterograde-directed particles to stop moving. Such a difference would amplify the impact of observed increases in retrograde velocities and durations (Table 1), to further explain the retrograde-directed bias of actin particles following latrunculin treatment that we observed experimentally.
Fig. 5.

Proposed mechanism for actin mobility in the axon (a, b) and schematic of kinetic reaction model of particle movement (c, e). a Bundling of actin filaments, not polymerization seems to be responsible for the appearance of actin densities. b This study suggests that (1) stability of both microtubules and actin is important in axonal actin transport. (2) Actin does not behave as a conventional cargo. Actin densities are caught in a sort of tug-of-war between the actin-associated myosins and actin-binding microtubule associated proteins that facilitate actin piggy-backing. c A schematic of the model developed in this paper to map the transition of actin between the free filament pool and stationary particle pool, and of the particle’s transition between the stationary and bidirectional moving pools. d Data on net displacement of particles over time was fit using the model. e The resulting transition rate constants
Discussion
In cultured sensory neurons expressing GFP-actin, numerous fluorescent densities were observed, which moved bidirectionally in the axon. The function of these densities is likely to be diverse; we observed them to co-localize dynamically with both mitochondria and filopodia, and immunohistochemcial staining showed co-localization of these densities with adhesion proteins, but not with ribosomes. Our analysis suggests that these densities are composed of filamentous actin, and that their turnover is governed by filament bundling rather than de novo synthesis or in situ polymerization. Further, our quantification of their movement represents the first detailed analysis of actin transport in the axon. It is known that microtubules and neurofilaments, both SCa cargoes, move as filaments several microns in length at fast instantaneous velocities punctuated by frequent pauses [17–19]. Cytosolic SCb cargoes, however, form transiently associated multiprotein complexes which display a net anterograde drift [54]. Our results suggest that actin follows neither of these paradigms. Rather, we suggest that the bidirectional movement of filamentous actin densities is facilitated by both actin- and microtubule-based systems and occurs at rates consistent with slow axonal transport of bulk populations of actin (Fig. 5a, b).
Composition and formation of actin densities
Several results indicate that actin densities are composed of filamentous actin (Fig. 5a). Densities were labeled with either phalloidin or lifeact (Figs. 2, 3). The number and dynamics of events were similar in axons expressing lifeact compared to GFP-actin (Tables 1, 2). Additionally, FRAP and dynamic microscopy of GFP-actin and lifeact support coalescence and dissolution of filaments rather than polymerization as the mechanism for density formation (Fig. 2). Inhibiting actin polymerization with latrunculin decreased the total number of densities (Fig. 4l), likely due to a decrease in the number of filaments available for coalescence, but, importantly, did not change the dynamics of coalescence. The transient nature of actin densities suggests they arise from unincorporated actin filaments, but they could also represent filaments within the actin cortex. Electron microscopy studies show self-contained densities of F-actin lateral to the microtubule core as well as short actin filaments within the core [20–23].
FRAP experiments were used to determine the contribution of diffuse GFP-actin to directional transport of densities. Calculated diffusion constants were higher for GFP-actin compared to lifeact, consistent with reported biphasic recovery rates representing recovery due to diffusion of monomers (fast) compared to filament turnover through polymerization (slow) [46, 55]. The absence of a directional bias in the recovery of fluorescence for both GFP-actin and lifeact suggests that neither diffusion nor polymerization directly contributes to net transport rates. However, these processes likely play an indirect role by setting local concentrations of G- and F-actin, which ultimately drive filament polymerization. Lastly, the poor co-localization between actin puncta and ribosomes argues against a role for the formation of densities at sites of local protein synthesis [48].
Actin densities as a slow component cargo
Kymography has been used previously to analyze the transport of soluble SCb cargoes. Although diffuse actin particles appear qualitatively similar to previously studied proteins, quantitative transport profiles are dramatically different [25, 26, 54]. It is not unreasonable that the dynamics we observe are governed by a mechanism unique to actin, as actin itself is not responsible for SCb transport [26]. In our experiments, GFP-actin puncta exhibited a net anterograde displacement corresponding to a velocity of approximately 3 mm/day. If we considered the average displacement of only anterogradely directed particles, we calculated a velocity of ~8.5 mm/day, which matches the upper limits of published bulk SCb transport rates. These are comparable to rates found in classical radio-labeling studies for SCb cargoes, which have fundamental methodological differences from our approach. In previous studies, radiolabeled amino acids were injected into neuronal cell bodies prior to quantification of their axonal distribution at subsequent time points. This approach necessarily established a proximal to distal gradient of labeled protein, in contrast to our system, where fluorescently labeled actin was distributed throughout the cell and was observed to move bidirectionally based on the contributions from mobile particles as well as the directional drift of stationary particles. Our approach also offers additional insight into mechanisms by which actin mobility is regulated. Based on our regression analysis, the two most important factors in determining the displacement of actin particles were the time spent moving in both the anterograde and retrograde directions. The similar magnitudes of these two variables highlight the non-processive and bidirectional movement of actin densities.
Mechanisms underlying the movement of actin densities
A role for microtubules in actin transport
Typically, cargo transport by kinesin or dynein relies on motors moving upon stationary microtubule tracks. If actin was transported in this way, nocodazole treatment should inhibit its transport bidirectionally. Instead, mobility of individual particles increased bidirectionally (increased anterograde duration and retrograde distance, Table 1), with no decrease in overall mobility (Fig. 4). This is also supported by the results of the kinetic model; particles were no more likely to move in the anterograde direction as opposed to the retrograde direction from a standstill, despite slight differences between the processivity of anterograde-directed particles (kfor1/krev1 ratio) and retrograde-directed particles (kfor2/krev2 ratio). These results suggest that actin does not bind as a cargo to a conventional microtubule-based motor or as a hitchhiker on conventional vesicular cargoes or neurofilaments. This response also differs from other SCb cargoes, which are unaffected by actin disruption, but cease movement bidirectionally after microtubule destabilization, presumably due to the absence of tracks for kinesin and dynein motors [26].
The lack of impaired mobility following nocodazole treatment is reminiscent of the response of mobile microtubules, whose anterograde movement is enhanced after microtubule destabilization. This change is likely due to decreased microtubule connectivity in the axonal core with dynein anchored to actin serving to push short microtubules in the anterograde direction [56, 57]. Consistent with such a model, we have found that actin densities in axons exposed to the dynein inhibitor EHNA exhibited increased retrograde-directed motion (unpublished data). In light of this preliminary data along with structural and biochemical evidence for actin densities interacting with microtubules (discussed below), directly testing the possibility of actin hitchhiking on dynein-driven MTs will be an interesting future research direction.
A role for actin in actin transport
In addition to a role for microtubules, several results also support a role for actin integrity in the movement of actin densities. First, the calculated velocities are slower than those predicted for typical microtubule-based transport paradigms. GFP-actin particles moved in both directions with average velocities of 0.06 μm/s, identical to the velocity reported for movement of pigment granules carried along actin by myosin in fish melanocytes [58]. Second, in the same studies noted above, retrograde microtubule-based transport of other proteins is not affected by interfering with either dynein or actin [56, 57], but in our experiments, latrunculin significantly enhanced retrograde displacement of actin puncta (Table 2). Additionally, the results of our mathematical model suggest that latrunculin treatment reduces the overall mobility of the particles, with a particular impact on anterograde-directed puncta. Lastly, the cessation of movement following treatment with jasplakinolide raises the interesting possibility that polymerization and actin network integrity serve as a brake to the movement of actin particles. This would be consistent with a previous study in Xenopus melanophores, which showed that jasplakinolide inhibits the movement of vesicle-bound cargoes moving upon actin filaments [59].
Interactions between actin and microtubule-based transport systems
These pharmacological experiments, which enabled tight temporal control over filament state not possible through genetic manipulation, suggest a functional connection between actin and microtubules. Both nocodazole and latrunculin treatment increased the duration and distance traveled by particles, in both directions. The fact that destabilization of either component freed actin particles to move further and for a longer time suggests that both microtubule and actin network integrity inhibit the movement of actin densities. This is likely a direct result of the active force generating components and other cross-linking proteins engaging in a sort of tug-of-war over actin densities [60, 61], such that when one “loses its grip,” the actin is free to move for a short time, before it is re-bound and frozen again. Such interactions between MTs and actin are consistent with structural and biochemical studies. Electron microscopy reveals that actin associates closely with MTs in the axon [20–23]. Additionally, the microtubule associated proteins, MAP2c, doublecortin, pod1 and the formins have all been shown to mediate actin dynamics, raising the intriguing possibility that MTs could serve as a nucleation site for actin densities [62–64].
Functional pools of actin
Actin transport occurs because a supply of actin is required for a number of biological functions at specific locations along the axon. Our results have been pooled to draw the most conservative and general conclusions regarding mechanisms of movement. There is, however, a strong likelihood of functionally distinct populations within the pool of polymerized actin and the stability and mobility of actin densities are likely influenced by their functional role within the axon. We have built upon previous work to probe a subset of actin-related functions, providing evidence that filamentous actin densities give rise to filopodia (Fig. 1), and may also associate with mitochondria (Fig. 1) [20, 37]. Additionally, immunolabeling shows that actin densities co-localize with the focal adhesion protein talin (Fig. 1), as expected [65]. Surprisingly, there is minimal co-localization with ribosomes (Fig. 2); the literature suggests a much stronger association between the two based on the importance of actin in transporting ribosomes and maintaining their distribution along the length of mature axons [66, 67], as well as, conversely, axonal ribosomes contributing to the synthesis of axonal actin [68–70]. Quantification of dynamic associations between actin and ribosomes or focal adhesion proteins along the length of axons would elucidate these functional relationships.
Quantitative approaches to studying actin transport
GFP-actin represents a challenging cargo to analyze due to the complexity of its movement patterns as well as considerable background fluorescence, presumably from soluble GFP-actin. These challenges were overcome both through higher-resolution microscopy as well as generation of accurate kymographs via validated methods [71]. The extraction of dense datasets allowed us to incorporate deeper statistical evaluation of data, through multiple regression analysis, as well as the application of a simple, yet informative, rate kinetics model of actin transport. Such efforts may no doubt be expanded to include stochastic statistical models and simulations that may more effectively capture the variability in our datasets.
Summary and conclusions
Our data provide a quantification of the identity, dynamics and possible functional roles for filamentous densities of GFP-actin in the axon. The emergence of densities appears to be due to bundling of polymerized actin filaments, rather than de novo translation (Fig. 5a). Further, these densities moved in short but significant bursts at net velocities commensurate with slow component transport rates. Unlike other SCb cargoes, perturbation of cytoskeletal integrity revealed that actin movement appears to be dependent on both actin and MT cytoskeletal networks. Further, these two networks appear to serve as a brake on movements mediated by each other, likely through the activity of motor and static cross-linking proteins as well as intermediaries such as neurofilaments (Fig. 5b). Considerable research remains to determine the specific identity of these and other proteins that influence actin transport globally or within specific functional pools. However, this work establishes a fundamental quantitative, mechanistic framework upon which additional genetic, biochemical, and biophysical experiments and models may be layered and interpreted.
Materials and methods
See supplementary material for complete materials and methods.
Tissue culture and expression of fluorescent proteins
Cells from dissociated dorsal root ganglia (DRG) from 2- to 5-day-old rats were transfected with either GFP-actin, lifeact-tagGFP2, or maxGFP using an Amaxa Nucleofector II or lentivirus. Animal work was approved by the IACUC at the University of Maryland and the University of California, San Diego.
Chemical perturbation
For pharmacological cytoskeletal perturbation experiments, cells were imaged for 6 min in normal media. The drug was then added to the dish and the same axon was imaged for an additional 20 min with movies then divided into three 6-min segments, each of which was analyzed independently. The segment that provided the largest change in the particle average net displacement was used for comparison to untreated axons. Although the magnitude of the net displacement varied between the three time segments, the direction of the change was consistent within each drug (10 μM nocodazole—maximum change 6–12 min. 10 μM latrunculin—maximum change 0–6 min).
Immunocytochemistry
Cells were fixed in 4 % PFA in PBS, permeabilized with 0.2 % Triton X-100 in PBS, incubated in blocking buffer (10 % FBS, 3 % BSA in PBS), and either stained with primary and secondary antibodies, or with phalloidin. While formaldehyde does not optimally preserve microtubules compared to glutaraldehyde, we accepted the slight loss of quality to enable direct comparison with axons single-labeled with phalloidin. This did not influence our assessment of relative microtubule integrity across drug treatments.
Live imaging of actin and mitochondria
For tracking the movement of individual actin densities, images were captured using widefield fluorescence at 40× magnification every 5 s in an environmental chamber which controlled temperature (37 °C), humidity, and carbon dioxide (5 %). Mitochondria were labeled as previously reported using MitoTracker Red CMX-Ros [38], and imaged at a similar frame rate as actin, thus precluding the observation of very fast moving mitochondria [41, 42]. Additional movies for specific experiments were captured at a higher frame rate (1/600 ms) using a 100× objective. Care was taken to image axons with free growth cones, and which were not undergoing active bouts of elongation. Transport was imaged in axonal regions at least 5 µm from the growth cone; growth cones were not analyzed.
For FRAP experiments, a 30 μm long region of interest (ROI) in the axon was bleached using multiple high laser power scans from an argon laser and fluorescence recovery imaged at 63× magnification in an environmental stage enclosure at 37 °C and 5 % CO2. Images were captured every 1.2 s for the first minute and every 5 s until intensity in the bleached region recovered to that of surrounding unbleached regions. Fluorescence in the bleached region was normalized using an ROI in an unbleached region. The time constant, tau, and diffusion constant, D, for recovery were calculated by fitting the data with an exponential curve. Multiple small ROIs within the bleached region were also analyzed for spatial differences in recovery rate.
Filopodial dynamics
62 filopodia were observed and analyzed in 25 untreated GFP-actin expressing axons, in regions away from the growth cone. The time at which a filopodium first protruded from the axon, as well as when it reached its maximum length and had retracted completely back into the axon were recorded. Maximum length and the protrusion angle were also measured.
Image analysis
Kymographs were used to quantify particle motion in the axon using an image processing algorithm [71]. Individual particle trajectories on kymographs were traced manually, and due to their complex nature, the entire particle path was termed a “track,” composed of shorter connected directional “runs.” Tracks were categorized by the net displacement of the particle (Fig. 3b). Particles with a net displacement of less than 0.3 μm were considered stationary, and anterograde- or retrograde-directed tracks were labeled as such. Parameters from each category of track in each experiment were averaged, to produce an average duration, distance, and velocity for each direction (anterograde, retrograde, and stationary) in an axon. These nine parameters were then averaged over all axons from a given treatment group for statistical comparison (Table 1). Total particle number, number of particle births (new particles emerging during the course of a movie), and directional populations were also determined for each experimental group (Table 2).
The average net displacement for all particles in an axon was also calculated; the sum of the net displacement of all tracks was divided by the number of tracks. This calculation, which was insensitive to variation in particle lifetime, or complexity of trajectory, also enabled us to extrapolate activity over a 6-min imaging window to that of bulk movement over a longer duration, often reported as a net velocity.
Co-localization analysis
Mitochondrial co-localization with GFP-actin was performed based on cargo trajectories in kymographs. Cargoes were considered to co-localize for durations during which trajectories overlapped. Co-localization was assessed using the method of Manders [72], with Manders coefficients M1 and M2 reflecting overlapping pixels above a threshold specific for each color channel relative to the other. Costes’ method [73] was used to confirm the validity of the co-localization approach.
Statistics
To test for statistically significant differences in mean parameters, two-tailed heteroscedastic Student’s t tests was used, with Bonferroni’s correction to account for multiple comparisons with the GFP-actin group; p values were required to be less than the adjusted α = 0.0125 to be considered significant.
Multiple regression analysis
Multiple regression analysis was performed on the z-scored data of all individual traces within an experimental group as performed previously [74]. Net displacement was regressed against the independent variables average velocity, total duration, anterograde velocity, anterograde duration, stationary velocity, stationary duration, retrograde velocity, and retrograde duration. Higher β-weight magnitudes indicate a stronger contribution to the regression model, and β-weight sign indicates direction of correlation.
Modeling
Actin transport was modeled using reaction kinetics to simulate transitions between anterograde, retrograde, and stationary actin puncta states. An additional “free pool” state was added to account for the observed disappearance of actin. Transition from all non-stationary states had to pass through the stationary state (Fig. 5c).
Electronic supplementary material
Below is the link to the electronic supplementary material.
Acknowledgments
We gratefully acknowledge support from the National Science Foundation (CBET0932590 and CMMI1130997). We also acknowledge valuable discussions with members of the Neuromuscular Bioengineering Laboratory. The authors declare no competing interests.
References
- 1.Gallo G, Yee HF, Jr, Letourneau PC. Actin turnover is required to prevent axon retraction driven by endogenous actomyosin contractility. J Cell Biol. 2002;158(7):1219–1228. doi: 10.1083/jcb.200204140. [DOI] [PMC free article] [PubMed] [Google Scholar]
- 2.Peters A, Vaughn JE. Microtubules and filaments in the axons and astrocytes of early postnatal rat optic nerves. J Cell Biol. 1967;32(1):113–119. doi: 10.1083/jcb.32.1.113. [DOI] [PMC free article] [PubMed] [Google Scholar]
- 3.Yamada KM, Spooner BS, Wessells NK. Ultrastructure and function of growth cones and axons of cultured nerve cells. J Cell Biol. 1971;49(3):614–635. doi: 10.1083/jcb.49.3.614. [DOI] [PMC free article] [PubMed] [Google Scholar]
- 4.Heidemann SR, Joshi HC, Schechter A, Fletcher JR, Bothwell M. Synergistic effects of cyclic AMP and nerve growth factor on neurite outgrowth and microtubule stability of PC12 cells. J Cell Biol. 1985;100(3):916–927. doi: 10.1083/jcb.100.3.916. [DOI] [PMC free article] [PubMed] [Google Scholar]
- 5.Lee MK, Cleveland DW. Neuronal intermediate filaments. Annu Rev Neurosci. 1996;19:187–217. doi: 10.1146/annurev.ne.19.030196.001155. [DOI] [PubMed] [Google Scholar]
- 6.Vale RD, Reese TS, Sheetz MP. Identification of a novel force-generating protein, kinesin, involved in microtubule-based motility. Cell. 1985;42(1):39–50. doi: 10.1016/S0092-8674(85)80099-4. [DOI] [PMC free article] [PubMed] [Google Scholar]
- 7.Vale RD, Schnapp BJ, Mitchison T, Steuer E, Reese TS, Sheetz MP. Different axoplasmic proteins generate movement in opposite directions along microtubules in vitro. Cell. 1985;43(3 Part 2):623–632. doi: 10.1016/0092-8674(85)90234-X. [DOI] [PubMed] [Google Scholar]
- 8.Schnapp BJ, Reese TS. Dynein is the motor for retrograde axonal transport of organelles. Proc Natl Acad Sci USA. 1989;86(5):1548–1552. doi: 10.1073/pnas.86.5.1548. [DOI] [PMC free article] [PubMed] [Google Scholar]
- 9.Bridgman PC. Myosin-dependent transport in neurons. J Neurobiol. 2004;58(2):164–174. doi: 10.1002/neu.10320. [DOI] [PubMed] [Google Scholar]
- 10.Hollenbeck PJ, Saxton WM. The axonal transport of mitochondria. J Cell Sci. 2005;118(Pt 23):5411–5419. doi: 10.1242/jcs.02745. [DOI] [PMC free article] [PubMed] [Google Scholar]
- 11.Brown JR, Stafford P, Langford GM. Short-range axonal/dendritic transport by myosin-V: a model for vesicle delivery to the synapse. J Neurobiol. 2004;58(2):175–188. doi: 10.1002/neu.10317. [DOI] [PubMed] [Google Scholar]
- 12.Alvarez J, Giuditta A, Koenig E. Protein synthesis in axons and terminals: significance for maintenance, plasticity and regulation of phenotype: with a critique of slow transport theory. Prog Neurobiol. 2000;62(1):1–62. doi: 10.1016/S0301-0082(99)00062-3. [DOI] [PubMed] [Google Scholar]
- 13.Droz B, Leblond CP. Axonal migration of proteins in the central nervous system and peripheral nerves as shown by radioautography. J Comp Neurol. 1963;121:325–346. doi: 10.1002/cne.901210304. [DOI] [PubMed] [Google Scholar]
- 14.Willard M, Cowan WM, Vagelos PR. The polypeptide composition of intra-axonally transported proteins: evidence for four transport velocities. Proc Natl Acad Sci. 1974;71(6):2183–2187. doi: 10.1073/pnas.71.6.2183. [DOI] [PMC free article] [PubMed] [Google Scholar]
- 15.Black MM, Lasek RJ. Slow components of axonal transport: two cytoskeletal networks. J Cell Biol. 1980;86(2):616–623. doi: 10.1083/jcb.86.2.616. [DOI] [PMC free article] [PubMed] [Google Scholar]
- 16.Hoffman PN, Lasek RJ. The slow component of axonal transport. Identification of major structural polypeptides of the axon and their generality among mammalian neurons. J Cell Biol. 1975;66(2):351–366. doi: 10.1083/jcb.66.2.351. [DOI] [PMC free article] [PubMed] [Google Scholar]
- 17.Wang L, Brown A. Rapid intermittent movement of axonal neurofilaments observed by fluorescence photobleaching. Mol Biol Cell. 2001;12(10):3257–3267. doi: 10.1091/mbc.12.10.3257. [DOI] [PMC free article] [PubMed] [Google Scholar]
- 18.Wang L, Brown A. Rapid movement of microtubules in axons. Curr Biol. 2002;12(17):1496–1501. doi: 10.1016/S0960-9822(02)01078-3. [DOI] [PubMed] [Google Scholar]
- 19.Wang L, C-l Ho, Sun D, Liem RKH, Brown A. Rapid movement of axonal neurofilaments interrupted by prolonged pauses. Nat Cell Biol. 2000;2(3):137–141. doi: 10.1038/35004008. [DOI] [PubMed] [Google Scholar]
- 20.Spillane M, Ketschek A, Jones SL, Korobova F, Marsick B, Lanier L, Svitkina T, Gallo G. The actin nucleating Arp2/3 complex contributes to the formation of axonal filopodia and branches through the regulation of actin patch precursors to filopodia. Dev Neurobiol. 2011;71(9):747–758. doi: 10.1002/dneu.20907. [DOI] [PMC free article] [PubMed] [Google Scholar]
- 21.Chang C-M, Goldman RD. The localization of actin-like fibers in cultured neuroblastoma cells as revealed by heavy meromysin binding. J Cell Biol. 1973;57(3):867–874. doi: 10.1083/jcb.57.3.867. [DOI] [PMC free article] [PubMed] [Google Scholar]
- 22.Nagele RG, Kosciuk MC, Hunter ET, Bush KT, H-y Lee. Immunoelectron microscopic localization of actin in neurites of cultured embryonic chick dorsal root ganglia: actin is a component of granular, microtubule-associated crossbridges. Brain Res. 1988;474(2):279–286. doi: 10.1016/0006-8993(88)90441-6. [DOI] [PubMed] [Google Scholar]
- 23.Letourneau PC. Differences in the organization of actin in the growth cones compared with the neurites of cultured neurons from chick embryos. J Cell Biol. 1983;97(4):963–973. doi: 10.1083/jcb.97.4.963. [DOI] [PMC free article] [PubMed] [Google Scholar]
- 24.Tashiro T, Komiya Y. Stable and dynamic forms of cytoskeletal proteins in slow axonal transport. J Neurosci. 1989;9(3):760–768. doi: 10.1523/JNEUROSCI.09-03-00760.1989. [DOI] [PMC free article] [PubMed] [Google Scholar]
- 25.Roy S, Winton MJ, Black MM, Trojanowski JQ, Lee VMY. Rapid and intermittent cotransport of slow component-b proteins. J Neurosci. 2007;27(12):3131–3138. doi: 10.1523/JNEUROSCI.4999-06.2007. [DOI] [PMC free article] [PubMed] [Google Scholar]
- 26.Roy S, Winton MJ, Black MM, Trojanowski JQ, Lee VMY. Cytoskeletal requirements in axonal transport of slow component-b. J Neurosci. 2008;28(20):5248–5256. doi: 10.1523/JNEUROSCI.0309-08.2008. [DOI] [PMC free article] [PubMed] [Google Scholar]
- 27.Morris JR, Lasek RJ. Monomer-polymer equilibria in the axon: direct measurement of tubulin and actin as polymer and monomer in axoplasm. J Cell Biology. 1984;98(6):2064–2076. doi: 10.1083/jcb.98.6.2064. [DOI] [PMC free article] [PubMed] [Google Scholar]
- 28.Mills RG, Minamide LS, Yuan A, Bamburg JR, Bray JJ. Slow axonal transport of soluble actin with actin depolymerizing factor, cofilin, and profilin suggests actin moves in an unassembled form. J Neurochem. 1996;67(3):1225–1234. doi: 10.1046/j.1471-4159.1996.67031225.x. [DOI] [PubMed] [Google Scholar]
- 29.Okabe S, Hirokawa N. Differential behavior of photoactivated microtubules in growing axons of mouse and frog neurons. J Cell Biol. 1992;117(1):105–120. doi: 10.1083/jcb.117.1.105. [DOI] [PMC free article] [PubMed] [Google Scholar]
- 30.Komiya Y, Kurokawa M. Preferential blockade of the tubulin transport by colchicine. Brain Res. 1980;190(2):505–516. doi: 10.1016/0006-8993(80)90292-9. [DOI] [PubMed] [Google Scholar]
- 31.Gallant PE. Axonal protein synthesis and transport. J Neurocytol. 2000;29(11–12):779–782. doi: 10.1023/A:1010961022455. [DOI] [PubMed] [Google Scholar]
- 32.Banks P, Mayor D, Mitchell M, Tomlinson D. Studies on the translocation of noradrenaline-containing vesicles in post-ganglionic sympathetic neurones in vitro. Inhibition of movement by colchicine and vinblastine and evidence for the involvement of axonal microtubules. J Physiol. 1971;216(3):625–639. doi: 10.1113/jphysiol.1971.sp009544. [DOI] [PMC free article] [PubMed] [Google Scholar]
- 33.Banks P, Mayor D, Tomlinson DR. Further evidence for the involvement of microtubules in the intra-axonal movement of noradrenaline storage granules. J Physiol. 1971;219(3):755–761. doi: 10.1113/jphysiol.1971.sp009688. [DOI] [PMC free article] [PubMed] [Google Scholar]
- 34.Ruthel G, Banker G. Actin-dependent anterograde movement of growth-cone-like structures along growing hippocampal axons: a novel form of axonal transport? Cell Motil Cytoskelet. 1998;40(2):160–173. doi: 10.1002/(SICI)1097-0169(1998)40:2<160::AID-CM5>3.0.CO;2-J. [DOI] [PubMed] [Google Scholar]
- 35.Ruthel G, Banker G. Role of moving growth cone–like “wave” structures in the outgrowth of cultured hippocampal axons and dendrites. J Neurobiol. 1999;39(1):97–106. doi: 10.1002/(SICI)1097-4695(199904)39:1<97::AID-NEU8>3.0.CO;2-Z. [DOI] [PubMed] [Google Scholar]
- 36.Flynn KC, Pak CW, Shaw AE, Bradke F, Bamburg JR. Growth cone-like waves transport actin and promote axonogenesis and neurite branching. Dev Neurobiol. 2009;69(12):761–779. doi: 10.1002/dneu.20734. [DOI] [PMC free article] [PubMed] [Google Scholar]
- 37.Ketschek A, Gallo G. Nerve growth factor induces axonal filopodia through localized microdomains of phosphoinositide 3-kinase activity that drive the formation of cytoskeletal precursors to filopodia. J Neurosci. 2010;30(36):12185–12197. doi: 10.1523/JNEUROSCI.1740-10.2010. [DOI] [PMC free article] [PubMed] [Google Scholar]
- 38.Chetta J, Kye C, Shah SB. Cytoskeletal dynamics in response to tensile loading of mammalian axons. Cytoskeleton. 2009;67(10):650–665. doi: 10.1002/cm.20478. [DOI] [PubMed] [Google Scholar]
- 39.Miller KE, Sheetz MP. Direct evidence for coherent low velocity axonal transport of mitochondria. J Cell Biol. 2006;173(3):373–381. doi: 10.1083/jcb.200510097. [DOI] [PMC free article] [PubMed] [Google Scholar]
- 40.Kang J-S, Tian J-H, Pan P-Y, Zald P, Li C, Deng C, Sheng Z-H. Docking of axonal mitochondria by syntaphilin controls their mobility and affects short-term facilitation. Cell. 2008;132(1):137–148. doi: 10.1016/j.cell.2007.11.024. [DOI] [PMC free article] [PubMed] [Google Scholar]
- 41.Morris RL, Hollenbeck PJ. Axonal transport of mitochondria along microtubules and F-actin in living vertebrate neurons. J Cell Biol. 1995;131(5):1315–1326. doi: 10.1083/jcb.131.5.1315. [DOI] [PMC free article] [PubMed] [Google Scholar]
- 42.Ruthel G, Hollenbeck PJ. Response of mitochondrial traffic to axon determination and differential branch growth. J Neurosci. 2003;23(24):8618–8624. doi: 10.1523/JNEUROSCI.23-24-08618.2003. [DOI] [PMC free article] [PubMed] [Google Scholar]
- 43.Cotman CW, Banker G, Churchill L, Taylor D. Isolation of postsynaptic densities from rat brain. J Cell Biol. 1974;63(2):441–455. doi: 10.1083/jcb.63.2.441. [DOI] [PMC free article] [PubMed] [Google Scholar]
- 44.Allison DW, Gelfand VI, Spector I, Craig AM. Role of actin in anchoring postsynaptic receptors in cultured hippocampal neurons: differential attachment of NMDA versus AMPA receptors. J Neurosci. 1998;18(7):2423–2436. doi: 10.1523/JNEUROSCI.18-07-02423.1998. [DOI] [PMC free article] [PubMed] [Google Scholar]
- 45.Sankaranarayanan S, Atluri PP, Ryan TA. Actin has a molecular scaffolding, not propulsive, role in presynaptic function. Nat Neurosci. 2003;6(2):127–135. doi: 10.1038/nn1002. [DOI] [PubMed] [Google Scholar]
- 46.McGrath JL, Tardy Y, Dewey CF, Jr, Meister JJ, Hartwig JH. Simultaneous measurements of actin filament turnover, filament fraction, and monomer diffusion in endothelial cells. Biophys J. 1998;75(4):2070–2078. doi: 10.1016/S0006-3495(98)77649-0. [DOI] [PMC free article] [PubMed] [Google Scholar]
- 47.Riedl J, Crevenna AH, Kessenbrock K, Yu JH, Neukirchen D, Bista M, Bradke F, Jenne D, Holak TA, Werb Z, Sixt M, Wedlich-Soldner R. Lifeact: a versatile marker to visualize F-actin. Nat Methods. 2008;5(7):605–607. doi: 10.1038/nmeth.1220. [DOI] [PMC free article] [PubMed] [Google Scholar]
- 48.Jung H, Yoon BC, Holt CE. Axonal mRNA localization and local protein synthesis in nervous system assembly, maintenance and repair. Nat Rev Neurosci. 2012;13(5):308–324. doi: 10.1038/nrn3210. [DOI] [PMC free article] [PubMed] [Google Scholar]
- 49.Coué M, Brenner SL, Spector I, Korn ED. Inhibition of actin polymerization by latrunculin A. FEBS Lett. 1987;213(2):316–318. doi: 10.1016/0014-5793(87)81513-2. [DOI] [PubMed] [Google Scholar]
- 50.Baas PW, Vidya Nadar C, Myers KA. Axonal transport of microtubules: the long and short of it. Traffic. 2006;7(5):490–498. doi: 10.1111/j.1600-0854.2006.00392.x. [DOI] [PubMed] [Google Scholar]
- 51.Bubb MR, Senderowicz AM, Sausville EA, Duncan KL, Korn ED. Jasplakinolide, a cytotoxic natural product, induces actin polymerization and competitively inhibits the binding of phalloidin to F-actin. J Biol Chem. 1994;269(21):14869–14871. [PubMed] [Google Scholar]
- 52.Bubb MR, Spector I, Beyer BB, Fosen KM. Effects of jasplakinolide on the kinetics of actin polymerization. J Biol Chem. 2000;275(7):5163–5170. doi: 10.1074/jbc.275.7.5163. [DOI] [PubMed] [Google Scholar]
- 53.Sadegh Zadeh K, Shah S. Mathematical modeling and parameter estimation of axonal cargo transport. J Comput Neurosci. 2010;28(3):495–507. doi: 10.1007/s10827-010-0232-9. [DOI] [PubMed] [Google Scholar]
- 54.Scott David A, Das U, Tang Y, Roy S. Mechanistic logic underlying the axonal transport of cytosolic proteins. Neuron. 2011;70(3):441–454. doi: 10.1016/j.neuron.2011.03.022. [DOI] [PMC free article] [PubMed] [Google Scholar]
- 55.Tardy Y, McGrath JL, Hartwig JH, Dewey CF. Interpreting photoactivated fluorescence microscopy measurements of steady-state actin dynamics. Biophys J. 1995;69(5):1674–1682. doi: 10.1016/S0006-3495(95)80085-8. [DOI] [PMC free article] [PubMed] [Google Scholar]
- 56.Hasaka TP, Myers KA, Baas PW. Role of actin filaments in the axonal transport of microtubules. J Neurosci. 2004;24(50):11291–11301. doi: 10.1523/JNEUROSCI.3443-04.2004. [DOI] [PMC free article] [PubMed] [Google Scholar]
- 57.Ahmad FJ, He Y, Myers KA, Hasaka TP, Francis F, Black MM, Baas PW. Effects of dynactin disruption and dynein depletion on axonal microtubules. Traffic. 2006;7(5):524–537. doi: 10.1111/j.1600-0854.2006.00403.x. [DOI] [PubMed] [Google Scholar]
- 58.Rodionov VI, Hope AJ, Svitkina TM, Borisy GG. Functional coordination of microtubule-based and actin-based motility in melanophores. Curr Biol. 1998;8(3):165–169. doi: 10.1016/S0960-9822(98)70064-8. [DOI] [PubMed] [Google Scholar]
- 59.Semenova I, Burakov A, Berardone N, Zaliapin I, Slepchenko B, Svitkina T, Kashina A, Rodionov V. Actin dynamics is essential for myosin-based transport of membrane organelles. Curr Biol. 2008;18(20):1581–1586. doi: 10.1016/j.cub.2008.08.070. [DOI] [PMC free article] [PubMed] [Google Scholar]
- 60.Gross SP, Tuma MC, Deacon SW, Serpinskaya AS, Reilein AR, Gelfand VI. Interactions and regulation of molecular motors in Xenopus melanophores. J Cell Biol. 2002;156(5):855–865. doi: 10.1083/jcb.200105055. [DOI] [PMC free article] [PubMed] [Google Scholar]
- 61.Schroeder Iii HW, Mitchell C, Shuman H, Holzbaur ELF, Goldman YE. Motor number controls cargo switching at actin-microtubule intersections in vitro. Curr Biol. 2010;20(8):687–696. doi: 10.1016/j.cub.2010.03.024. [DOI] [PMC free article] [PubMed] [Google Scholar]
- 62.Tint I, Jean D, Baas PW, Black MM. Doublecortin associates with microtubules preferentially in regions of the axon displaying actin-rich protrusive structures. J Neurosci. 2009;29(35):10995–11010. doi: 10.1523/JNEUROSCI.3399-09.2009. [DOI] [PMC free article] [PubMed] [Google Scholar]
- 63.Fujiwara T, Tanaka K, Inoue E, Kikyo M, Takai Y. Bni1p regulates microtubule-dependent nuclear migration through the actin cytoskeleton in Saccharomyces cerevisiae . Mol Cell Biol. 1999;19(12):8016–8027. doi: 10.1128/mcb.19.12.8016. [DOI] [PMC free article] [PubMed] [Google Scholar]
- 64.Deeks MJ, Fendrych MÅ, Smertenko A, Bell KS, Oparka K, Cvrčková F, Žárský V, Hussey PJ. The plant formin AtFH4 interacts with both actin and microtubules, and contains a newly identified microtubule-binding domain. J Cell Sci. 2010;123(8):1209–1215. doi: 10.1242/jcs.065557. [DOI] [PubMed] [Google Scholar]
- 65.Gardel ML, Schneider IC, Aratyn-Schaus Y, Waterman CM. Mechanical integration of actin and adhesion dynamics in cell migration. Annu Rev Cell Dev Biol. 2010;26(1):315–333. doi: 10.1146/annurev.cellbio.011209.122036. [DOI] [PMC free article] [PubMed] [Google Scholar]
- 66.Koenig E, Martin R. Cortical plaque-like structures identify ribosome-containing domains in the Mauthner cell axon. J Neurosci. 1996;16(4):1400–1411. doi: 10.1523/JNEUROSCI.16-04-01400.1996. [DOI] [PMC free article] [PubMed] [Google Scholar]
- 67.Koenig E, Martin R, Titmus M, Sotelo-Silveira JR. Cryptic peripheral ribosomal domains distributed intermittently along mammalian myelinated axons. J Neurosci. 2000;20(22):8390–8400. doi: 10.1523/JNEUROSCI.20-22-08390.2000. [DOI] [PMC free article] [PubMed] [Google Scholar]
- 68.Donnelly CJ, Park M, Spillane M, Yoo S, Pacheco A, Gomes C, Vuppalanchi D, McDonald M, Kim HH, Merianda TT, Gallo G, Twiss JL. Axonally synthesized beta-actin and GAP-43 proteins support distinct modes of axonal growth. J Neurosci. 2013;33(8):3311–3322. doi: 10.1523/JNEUROSCI.1722-12.2013. [DOI] [PMC free article] [PubMed] [Google Scholar]
- 69.Perry RB, Fainzilber M. Local translation in neuronal processes—in vivo tests of a “heretical hypothesis”. Dev Neurobiol. 2014;74(3):210–217. doi: 10.1002/dneu.22115. [DOI] [PubMed] [Google Scholar]
- 70.Willis D, Li KW, Zheng JQ, Chang JH, Smit AB, Kelly T, Merianda TT, Sylvester J, van Minnen J, Twiss JL. Differential transport and local translation of cytoskeletal, injury-response, and neurodegeneration protein mRNAs in axons. J Neurosci. 2005;25(4):778–791. doi: 10.1523/JNEUROSCI.4235-04.2005. [DOI] [PMC free article] [PubMed] [Google Scholar]
- 71.Chetta J, Shah SB. A novel algorithm to generate kymographs from dynamic axons for the quantitative analysis of axonal transport. J Neurosci Methods. 2011;199(2):230–240. doi: 10.1016/j.jneumeth.2011.05.013. [DOI] [PubMed] [Google Scholar]
- 72.Manders EMM, Verbeek FJ, Aten JA. Measurement of co-localization of objects in dual-colour confocal images. J Microsc. 1993;169(3):375–382. doi: 10.1111/j.1365-2818.1993.tb03313.x. [DOI] [PubMed] [Google Scholar]
- 73.Costes SV, Daelemans D, Cho EH, Dobbin Z, Pavlakis G, Lockett S. Automatic and quantitative measurement of protein-protein colocalization in live cells. Biophys J. 2004;86(6):3993–4003. doi: 10.1529/biophysj.103.038422. [DOI] [PMC free article] [PubMed] [Google Scholar]
- 74.Pathak GKLJ, Chetta J, Shah SB. A comparative quantitative assessment of axonal and dendritic mRNA transport in maturing hippocampal neurons. PLoS ONE. 2013;8(7):e65917. doi: 10.1371/journal.pone.0065917. [DOI] [PMC free article] [PubMed] [Google Scholar]
Associated Data
This section collects any data citations, data availability statements, or supplementary materials included in this article.