Abstract
We have localized TACC to the microtubule-nucleating centrosomal corona and to microtubule plus ends. Using RNAi we proved that Dictyostelium TACC promotes microtubule growth during interphase and mitosis. For the first time we show in vivo that both TACC and XMAP215 family proteins can be differentially localized to microtubule plus ends during interphase and mitosis and that TACC is mainly required for recruitment of an XMAP215-family protein to interphase microtubule plus ends but not for recruitment to centrosomes and kinetochores. Moreover, we have now a marker to study dynamics and behavior of microtubule plus ends in living Dictyostelium cells. In a combination of live cell imaging of microtubule plus ends and fluorescence recovery after photobleaching (FRAP) experiments of GFP-α-tubulin cells we show that Dictyostelium microtubules are dynamic only in the cell periphery, while they remain stable at the centrosome, which also appears to harbor a dynamic pool of tubulin dimers.
Electronic supplementary material
The online version of this article (doi:10.1007/s00018-010-0453-0) contains supplementary material, which is available to authorized users.
Keywords: Dictyostelium, TACC, DdCP224, XMAP215, Microtubules, Centrosome
Introduction
The microtubule cytoskeleton is involved in many fundamental processes such as cell division, cell polarity, cell motility, vesicle trafficking, and organelle positioning. The organization of microtubules and their dynamic properties, which are prerequisites to fulfill these tasks, are regulated by microtubule-associated proteins (MAPs). MAPs bind to microtubules either directly or indirectly, in particular to their plus and minus ends. The minus ends are tethered to the largest known cellular protein complex, the centrosome. The latter organizes microtubule nucleation through γ-tubulin complexes with associated regulatory proteins that also have a capping function for minus ends to prevent them from disassembly as long as they are anchored to the centrosome. Although there are several examples of cell types with unanchored microtubules, which possess some extent of dynamics [1], the microtubule plus ends are considered as the main sites for microtubule growth and shrinkage. Furthermore, they are involved in tethering the microtubules to kinetochores as well as to the cortical actin cytoskeleton and membrane proteins. To fulfill these functions, microtubule plus ends are associated with a set of proteins that make up a supramolecular complex, which consists of a still growing number of proteins and whose composition depends on the cell cycle stage, cell type, microtubule dynamics, and interactions with the cell cortex. The latter play a key role in cell polarity, cell migration, cytokinesis, organelle positioning, mitotic spindle orientation, and nuclear migration. Many of these plus-end binding proteins, such as CLIP-170, p150glued and EB1, appear to be present only at the ends of growing microtubules and are also known as microtubule plus-end tracking proteins [2, 3], while others such as XMAP215 or TACC proteins, which are the subject of this article, are present at the plus ends of both growing and shrinking microtubules and also at centrosomes [4–6].
XMAP215-family proteins (named after their Xenopus representative) are ubiquitous, elongated, microtubule-associated proteins with a size of approximately 230 kDa [7]. It has long been known that XMAP215 family proteins play a crucial role in microtubule plus-end dynamics [8], but only recently it could be shown that they act as a processive microtubule polymerase [5]. CP224, the XMAP215 family member in our model organism, the social amoeba Dictyostelium discoideum, was among the first members of this protein family that could be verified as a genuine centrosomal component and the first that was clearly localized at microtubule plus ends not only at kinetochores but also in the periphery near the cell cortex [4, 9]. Overexpression of fragments of CP224 or the full-length protein, revealed functions of the protein in centrosome duplication, cytokinesis and dynein-dependent microtubule/cell cortex interactions [4, 10]. Its role in microtubule dynamics became evident upon underexpression of CP224, which caused a significant reduction in microtubule length and hypersensitivity against microtubule-depolymerizing drugs [11]. In a search for binding partners of CP224 that could participate in its functions we have performed a tandem affinity purification screen for binding partners [12]. Among other proteins including EB1, we could identify the Dictyostelium TACC-family protein as an interactor of CP224, which was confirmed by co-immunoprecipitation of both proteins [12].
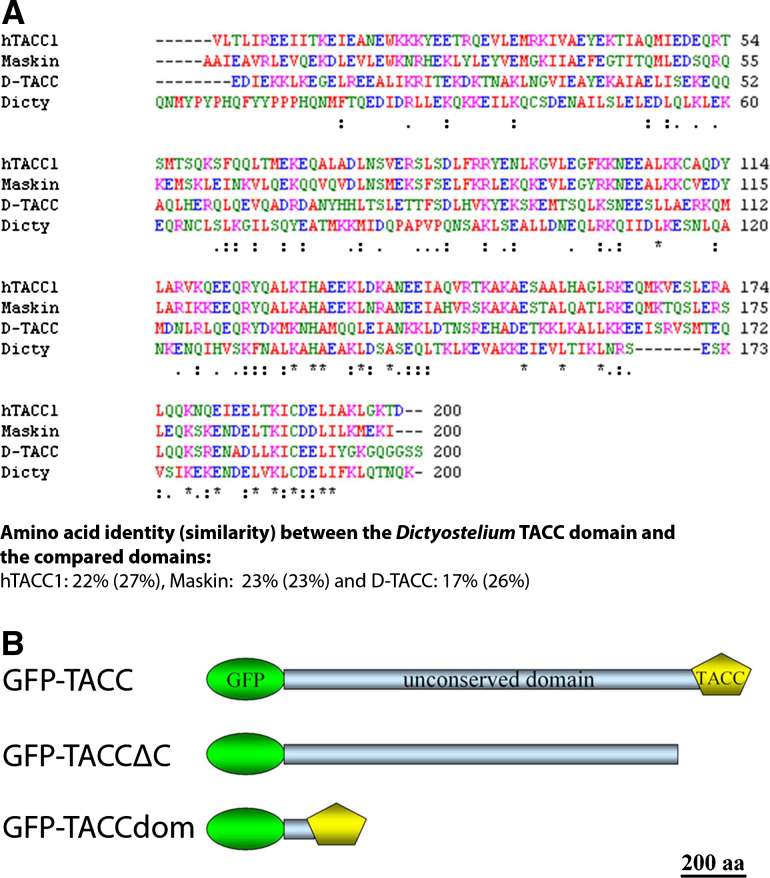
TACC was originally identified as a protein overexpressed in human breast cancer cells [13]. It was named “Transforming acidic coiled-coil 1” protein (hTACC1), due to its ability to transform cells and its C-terminal ~200 aa that are highly acidic and contain a putative coiled-coil domain. Soon TACC proteins were identified in many organisms ranging from yeast to humans. Yet, except from the conserved TACC domain (Fig. 1a), these proteins display only little similarity in length and sequence. The known functions of TACC proteins fall into two categories. The first one comprises functions related to regulation of gene expression including interactions with histone acetyltransferases and the RNA processing machinery. The second is related to localization of TACC proteins to microtubules and the centrosome [14, 15]. All TACC proteins investigated so far are recruited to the centrosome during mitosis, but only hTACC2, TAC-1 and D-TACC can also be found there during interphase albeit to a lesser extent. Moreover, Xenopus Maskin and C. elegans TAC-1 localize to spindle microtubules and the microtubule–kinetochore interface, while Drosophila D-TACC localizes alongside spindle microtubules as well as to astral microtubules [16–19]. A GFP-D-TACC fusion protein could also be observed as tiny dots moving towards and away the centrosome indicating a D-TACC localization at the microtubule plus ends [6]. Compromised TACC function is usually characterized by reduced microtubule lengths during interphase and mitosis [15]. The interaction of TACC proteins with XMAP215 family proteins is evolutionally conserved. Results from Drosophila, C. elegans and Xenopus have led to the current model, in which TACC is enriched at the centrosome during mitosis and recruits XMAP215 proteins to the centrosome [6, 18–22]. As a complex the two proteins may then be loaded onto emerging microtubule plus ends, where they could counteract the microtubule destabilizing kinesin MCAK [23]. Yet, this model became challenged by a recent study in Xenopus, where TACC3/Maskin depletion had no effect on dynamics of microtubules nucleated from isolated centrosomes, but appeared to be involved in anchoring microtubules to the centrosome in an Aurora A dependent manner [24]. Moreover, salt-stripped centrosomes were able to recruit XMAP215 from Maskin depleted egg extracts, but failed to organize normal microtubule asters indicating that TACC3/Maskin can function independently of XMAP215.
Fig. 1.
Sequence homology and domain organization of Dictyostelium TACC. Sequence homology of TACC family members is limited to ~250 C-terminal amino acids constituting the TACC domain. The sequence alignment of various TACC domain sequences from humans (hTACC1), Xenopus (Maskin) and Drosophila (D-TACC) with Dictyostelium TACC was generated with ClustalW (a). The domain organization of the three GFP fusion proteins generated in this work (b). The TACC domain is depicted as a pentagon and GFP as an ellipse
In this work we provide a functional analysis of Dictyostelium TACC. We confirm its role as a promoter of microtubule growth and we show for the first time in vivo that TACC is required for recruitment of the XMAP215 orthologue (CP224) to microtubule plus ends during interphase but not for its recruitment to centrosomes and kinetochores. Also for the first time we have now a marker to study dynamics and behavior of microtubule plus ends in living Dictyostelium cells. In a combination of live cell imaging of microtubule plus ends and fluorescence recovery after photobleaching (FRAP) experiments of GFP-α-tubulin cells we show that Dictyostelium microtubules are dynamic only in the cell periphery, while they remain stable at the centrosome, which also appears to harbor a dynamic pool of tubulin dimers.
Materials and methods
Plasmid constructions
The DNA coding sequence for the construction of GFP-TACC (full length) and GFP-TACC∆C were obtained by PCR using single stranded cDNA as a template and suitable linker primers. cDNA was obtained by reverse transcription using total RNA (total RNA isolation kit, Applichem, Darmstadt, Germany), Mu-MLV reverse transcriptase (Protoscript 1st strand synthesis kit, New England Biolabs, Frankfurt, Germany) and an oligo-dT primer. PCR fragments were cloned into SalI/BamHI digested pIS76, an N-terminal GFP fusion vector conferring blasticidin S resistance [25]. For TACC∆C the amplicon corresponded to base pairs 1–3,609 of the complete coding sequence (geneID DDB_G0275391 at http://dictybase.org). A stop codon was added at the 3′ end. The TACC full-length construct was build from two overlapping DNA fragments, first a 5′-PCR fragment flanked by SalI and the internal AflIII restriction site and a 3′-fragment obtained after digestion of GFP-TACCdom vector (pKK14, [12]) with AflIII and BamHI.
The TACC-RNAi construct was designed according to [26] employing the Dictyostelium N-terminal mCherry fusion vector pIS193, which was obtained by replacement of GFP by mCherry in pIS77 [25, 27] and was chosen because of suitable restriction sites. The transcribed RNA consists of a long inverted repeat consisting of 543 bp of the TACC coding sequence (base positions 1–543) and a stuffer fragment between the two complementary parts. Both complementary TACC fragments were amplified by PCR using linker primers. The sense fragment was flanked by SalI and BamHI sites and cloned into the polylinker downstream of the mCherry sequence. The preceding antisense fragment was flanked by AflII and KpnI sites and replaced the first part of the mCherry sequence leaving a 196-bp stuffer fragment consisting of the remaining mCherry sequence and restriction sites. The resulting TACC-RNAi vector confers G418 resistance and drives transcription of a double-stranded hairpin RNA under control of the actin-6 promoter.
The α-tubulin sequence for the expression of red-fluorescent tubulin was derived from a published GFP-tubulin vector by digestion with SalI and BamHI [9]. The coding sequence of marsRFP was amplified by PCR using HindIII and SalI linker primer and a marsRFP plasmid as a template [28]. Both, the marsRFP and α-tubulin sequences were cloned consecutively into pIS76 [25] to yield pIS254.
Microscopy
Light microscopy and image processing of fixed samples was performed as described previously on a Zeiss CellObserver HS system equipped with a PlanApo 1.4/100× objective, an Axiocam MRm Rev. 3 CCD camera and the Axiovision 4.6 fast iterative deconvolution software package [25]. All live cell imaging experiments including FRAP were conducted at a Zeiss LSM710 laser scanning confocal microscope equipped with a PlanApo 1.4/63× objective as reported recently [29]. Live cells were prepared in glass-bottom Petri dishes (Fluorodish, WPI, Berlin, Germany) and flattened by agar overlay [30]. Immunoelectron microscopy of isolated nucleus/centrosome complexes was performed as recently published [25]. In brief, nuclei were fixed with glutaraldehyde, labeled with anti-TACC and Nanogold-conjugated anti-rabbit Fab′ fragments (Aurion, Wageningen, Netherlands), silver enhanced, osmicated and finally embedded in Spurr’s resin. Uranyl acetate and lead citrate stained ultra-thin sections were viewed on a Philips CM100 electron microscope.
Other methods
Dictyostelium strain AX2 was cultured and transformed with the above-mentioned plasmids as reported earlier [4, 31]. SDS gel electrophoresis and Western blotting was performed as described [31]. Centrosomes were purified according to [31]. Preparation of cell extracts of Dictyostelium cells was reported by Daunderer and Gräf [32].
Antibodies
Mouse monoclonal anti-CP224 [33], rat monoclonal YL1/2 [34], rabbit polyclonal anti-Cenp68 [35], rabbit polyclonal anti-TACC (Dr. Katrin Pfütze, http://archiv.ub.uni-marburg.de/diss/z2006/0802/).
Results
Dictyostelium TACC localizes to the centrosomal corona and microtubule plus ends
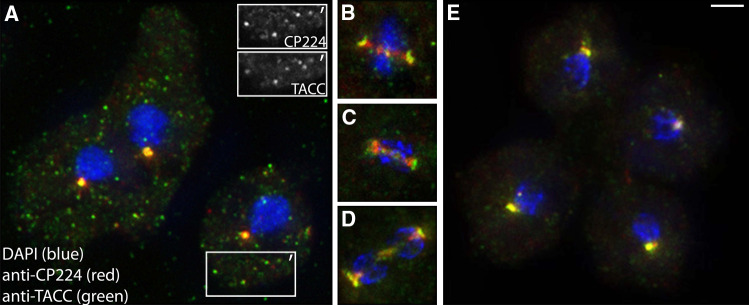
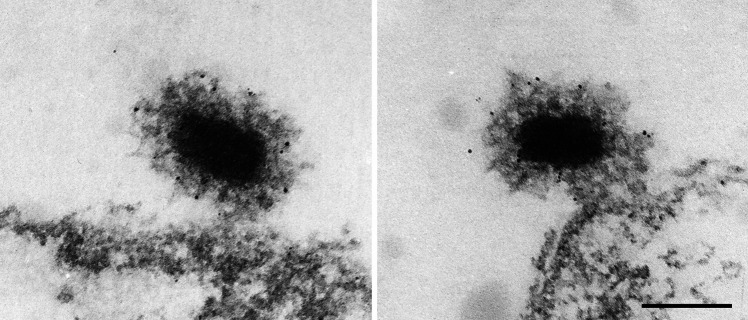
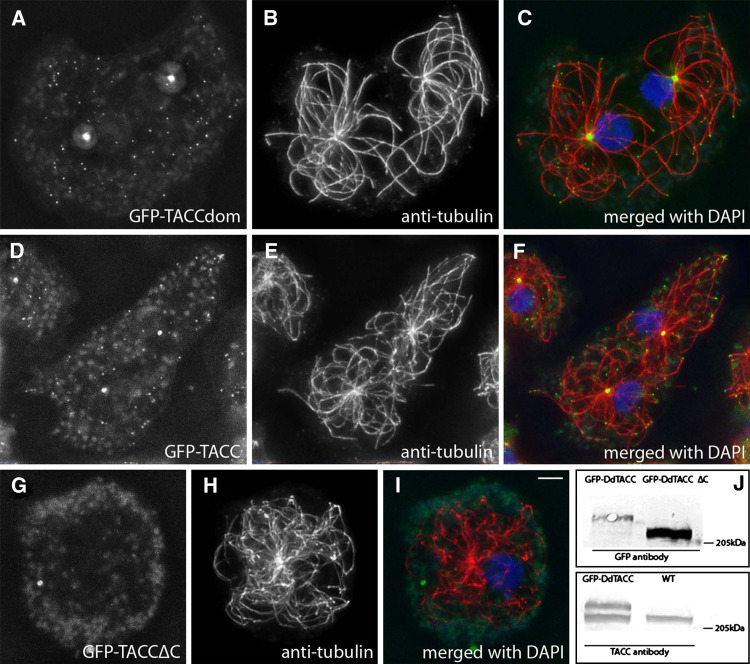
For our functional analysis of TACC in Dictyostelium, we have raised antibodies against the recombinant TACC domain (anti-TACC) and have generated Dictyostelium strains expressing full-length TACC, the TACC domain (275 aa) and the N-terminal part (1203 aa), respectively, as GFP fusion proteins (GFP-TACC, GFP-TACCdom GFP-TACC∆C) (Fig. 1b). Endogenous TACC and CP224 colocalized at microtubule plus ends and the centrosome during interphase (Fig. 2). Immunoelectron microscopy showed gold labeling of anti-TACC almost exclusively at the centrosomal corona demonstrating that TACC, as CP224, is a component of the centrosomal corona (Fig. 3). Centrosomal localization was independent of microtubules, since GFP-TACCdom was also present at isolated centrosomes, which are known to be free of microtubules [31] (Fig. 4). This proves that TACC is a genuine centrosomal component. The TACC domain alone was sufficient for all localizations of the full-length protein, however, deletion of the TACC domain (GFP-TACC∆C) abrogated all localizations of the GFP fusion protein to specific structures (Fig. 5). The sizes of the respective GFP fusion proteins were confirmed by Western blots (Fig. 5j).
Fig. 2.
Endogenous TACC localizes to centrosomes and microtubule plus ends during interphase and to spindle poles during mitosis. Dictyostelium cells were fixed with methanol and labeled with anti-TACC (green), anti-CP224 (red) and DAPI (blue). Whole cells (a, e) and mitotic spindles (b–d), respectively, are shown in interphase (a), metaphase (b), anaphase (c), early telophase (d), and late telophase (e). To point out TACC and CP224 colocalization at microtubule plus ends, the insets in a exclusively show TACC or CP224 staining within the boxed area depicted as (′). Bar 2 μm
Fig. 3.
Immunoelectron microscopy reveals TACC localization at the centrosomal corona. Two examples of centrosomes attached to isolated nuclei are shown. Note that gold particles are almost exclusively associated with the centrosomal corona surrounding the layered core structure. Bar 0.2 μm
Fig. 4.
GFP-TACCdom copurifies with isolated centrosomes. Centrosomes were isolated and fixed with methanol on coverslips as described. GFP fluorescence (left) and anti-CP224 labeling as a centrosomal marker are shown. The merged image displays colocalization of both proteins at isolated centrosomes. Bar 2 μm
Fig. 5.
The TACC domain is sufficient for localization at centrosomes and microtubule tips. GFP-TACCdom (a–c) and the full-length GFP-TACC (d–f) localize to the centrosomal corona, microtubule plus-end tips and to certain spots alongside of microtubules. By contrast, a C-terminally truncated fusionprotrein GFP-TACC∆C (g–i) lacking the TACC domain does not show any specific localization. GFP labeling (a, d, g) is shown in green, tubulin (b, e, h) in red and DNA in blue. Except for GFP-TACC∆C (i), merged images (c, f) clearly show the GFP-TACC and GFP-TACCdom spots at the microtubule tips. The Western blot of Dictyostelium extracts (j) shows labeling of GFP-TACC and GFP-TACC∆C with anti-GFP (upper panel) and of GFP-TACC and endogenous TACC with anti-TACC (lower panel). Bar 2 μm
TACC-RNAi results in moderate reduction of interphase microtubule length
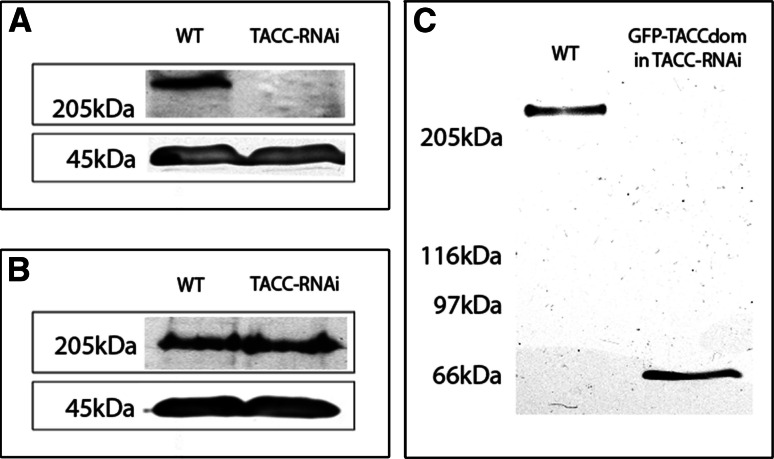
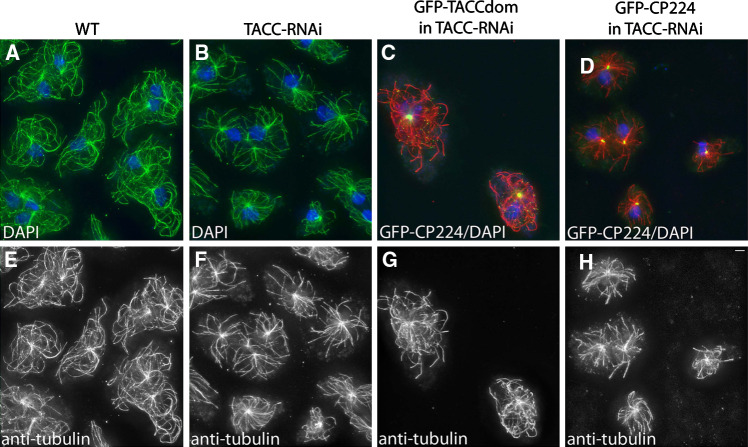
To investigate TACC function, we suppressed its expression by RNAi using the established method for Dictyostelium [26]. In the resulting TACC-RNAi strain, the amount of TACC protein was reduced to levels that were undetectable by immunoblotting (Fig. 6a). TACC-RNAi cells exhibited a moderate reduction of interphase microtubule length (Fig. 7; Table 1). Growth of cell cultures, number of nuclei and centrosomes per cell, chemotaxis and development were all unaffected by the RNAi treatment (data not shown). Since our RNAi construct was directed against the N-terminal part excluding the TACC domain, expression of GFP-TACCdom was unaffected by RNAi treatment (Fig. 6c). Thus, we could also determine to which extent expression of the TACC domain alone could rescue the reduction in interphase microtubule length. Expression of GFP-TACCdom in TACC-RNAi cells yielded heterogenous mutants. In many cells, this phenotype was fully or partially rescued, yet a fraction with no obvious effect of TACC domain expression remained (Table 1). In contrast, the TACC-RNAi phenotype could not be rescued by overexpression of the conserved TACC binding partner CP224 as a GFP fusion protein (Fig. 7c, g and d, h; Table 1).
Fig. 6.
RNAi depletion of TACC. Upon RNAi treatment TACC is no longer detectable in immunoblots (a). Depletion of TACC does not affect overall CP224 expression (b). After transfection of TACC-RNAi cells with GFP-TACCdom, the RNAi effect remained strong and no full-length TACC was detected (c). Western blots of whole cell lysates were stained with anti-TACC (c, upper panel in a), anti-CP224 (upper panel in b) and anti-actin (lower panel in a and b). Molecular weight is depicted on the left, strains used indicated on top of the respective lanes
Fig. 7.
Microtubule length is significantly reduced upon TACC RNAi and rescued by expression of the TACC domain as GFP fusion protein. Cell types indicated on top were fixed with glutaraldehyde and stained with anti-tubulin (e–h, green in a, b and red in c, d). Compared to wild-type cells, microtubule length is reduced in TACC-RNAi cells. Although GFP-TACCdom and GFP-CP224 expressed in TACC-RNAi cells both localize normally (green in c and d), only GFP-TACC-domain expression restores wild-type-like microtubule length in a large number of cells. The upper panel shows merged images of anti-tubulin, DNA (blue) and the respective GFP fusion proteins in c and d. Bar 2 μm
Table 1.
Microtubule length in wild-type and TACC mutant cells
| Cell line | Microtubule length μm (n) |
|---|---|
| Control cells (strain AX2) | 8.68 ± 2.59 (135) |
| TACC-RNAi | 6.17 ± 1.62 (132) |
| GFP-TACCdom in TACC-RNAi | 6.83 ± 2.38 (127) |
| GFP-CP224 in TACC-RNAi | 6.34 ± 1.89 (129) |
In order to assess microtubule length, the respective strains were fixed with glutaraldehyde and labeled with anti-tubulin. Evaluation of microtubule length was accomplished with ImageJ on maximum intensity projection images
TACC is almost absent from astral microtubules, but required for their formation
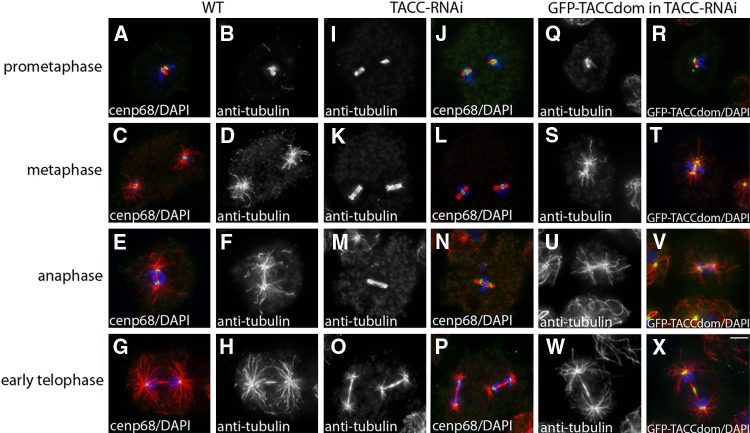
While GFP-TACC was strongly present at centrosomes and microtubule plus ends during interphase, it exhibited a differential pattern at these localizations during mitosis. From early prophase till late telophase GFP-TACC was still strongly present at centrosomes (Fig. 8a–u) and kinetochores (Fig. 8m–o). During telophase it was also found in the mid-body region (Fig. 8s). In contrast, GFP-TACC levels were dramatically reduced at the plus ends of astral microtubules. Despite the virtual absence of TACC at plus ends of astral microtubules, the protein appears to be required for astral microtubule formation. This became evident when we analyzed mitotic TACC-RNAi cells, where the effect of TACC depletion was much more prominent than during interphase. Particularly in metaphase the length of astral microtubules was drastically reduced, while spindle microtubules remained unaffected (Fig. 9c, d and k, l). Consequently, chromosome segregation as visualized by the behavior of the centromere/kinetorchore marker Cenp68 [35] proceeded normally (Fig. 9). In contrast to interphase microtubule length, astral microtubule length could fully be rescued by expression of GFP-TACCdom in TACC-RNAi cells (Fig. 9q–x).
Fig. 8.
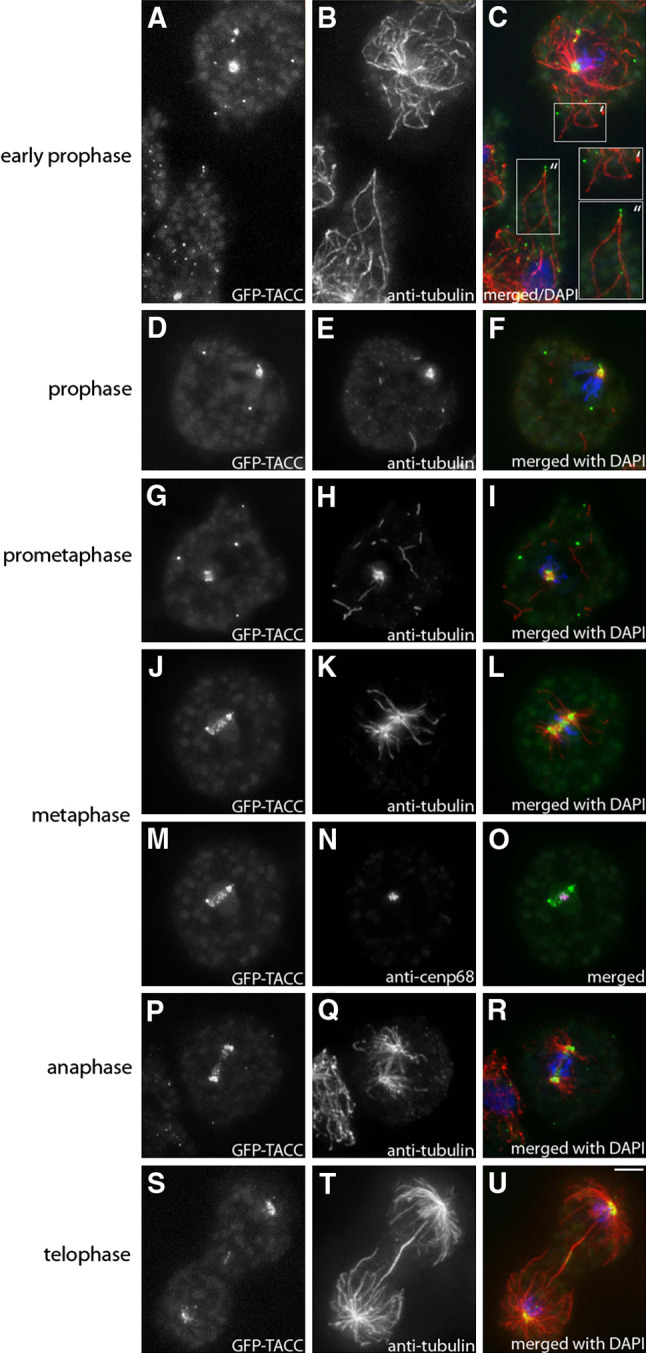
During mitosis GFP-TACC localizes to spindle poles, the kinetochores and the mid-body region but is virtually absent from tips of astral microtubules. GFP-TACC (grayscale images as indicated and green in merged images) expressing cells were fixed with glutaraldehyde and stained with anti-tubulin (grayscale images as indicated and red in merged images). To visualize the kinetochores, cells were also labeled with anti-Cenp68 as a centromere marker (N, magenta in O). DNA is shown in blue, mitotic stages are indicated on the left. In all interphase cells adjacent to the mitotic cells shown above, a clear GFP-TACC signal was visible at the microtubule plus-end tips. An example for that is shown in (c), where the upper right cell represents an early prophase stage as can be seen by its condensed DNA (′), with no GFP-TACC signal at the microtubules tips, while in an interphase cell at the lower left (″) TACC is clearly associated with microtubule plus ends. Throughout mitosis, GFP-TACCdom exhibited the same behavior as GFP-TACC (not shown). Bar 2 μm
Fig. 9.
Astral microtubule formation is impaired upon TACC RNAi. Cell types indicated on top were fixed with glutaraldehyde and labeled with anti-tubulin (grayscale images and red in merged images) and anti-Cenp68 as a kinetochore marker (green in merged images a, c, e, g and j, l, n, p). Aster formation is heavily impaired upon TACC RNAi while spindle microtubules are unaffected. Expression of GFP-TACCdom in TACC-RNAi cells (green in merged images r, t, v, x) restores normal astral microtubule length. DNA is shown in blue, Bar 2 μm
TACC depletion causes hypersensitivity against thiabendazole
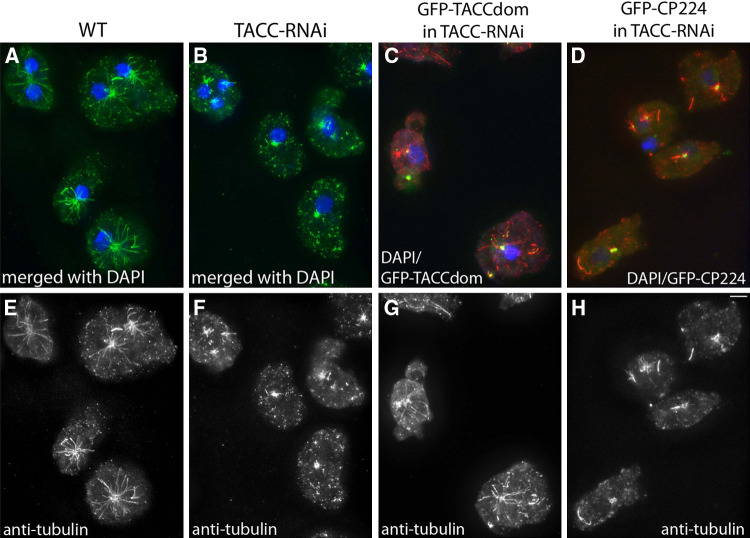
The reduced length of interphase microtubules was very reminiscent of the phenotype observed upon underexpression of CP224. Since reduced amounts of CP224 also caused a hypersensitivity of cells against microtubule-depolymerizing drugs such as nocodazole or thiabendazole (TBZ) [11], we analyzed the effect of TACC depletion on TBZ sensitivity. Wild-type cells are quite resistant against TBZ and treatment at a high concentration of 100 μM for 3 h does not lead to complete depolymerization of microtubules [9, 11] (Fig. 10a, e). In contrast, TACC-RNAi cells were hypersensitive against treatment with TBZ (Fig. 10b, f). TBZ hypersensitivity upon TACC depletion was rescued by GFP-TACCdom expression (Fig. 10c, g) but not by expression of GFP-CP224 (Fig. 10d, h). Thus, the TACC domain alone is sufficient for the microtubule stabilizing effect of TACC against TBZ treatment.
Fig. 10.
Cells depleted of TACC are hypersensitive against thiabendazole. Cell types indicated on top were treated with 100 μM thiabendazole for 3 h and microtubules were labeled with anti-tubulin (e–h, green in a, b and red in c, d). Thiabendazole treatment clearly has an effect on all cell types, but compared to wild-type cells remaining microtubules in TACC-RNAi cells are significantly shorter. Expression of GFP-TACCdom (green in c) rescues the hypersensitivity phenotype, while overexpression of GFP-CP224 (green in d) has no significant effect. In merged images DNA is shown in blue. Bar 2 μm
TACC is required for CP224 localization to microtubule tips but not to centrosomes and kinetochores
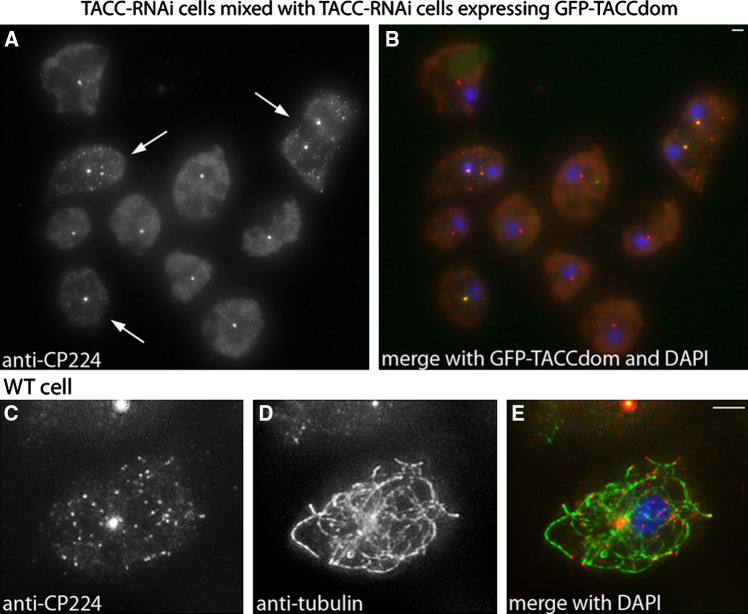
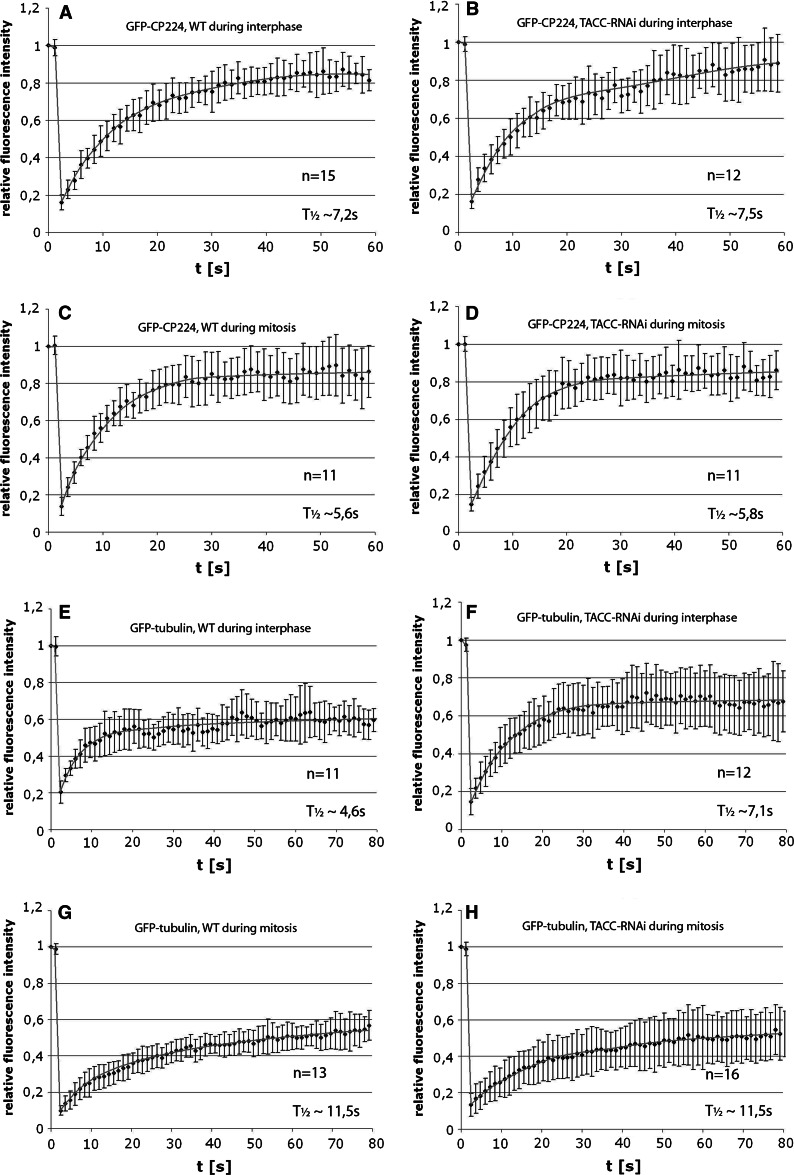
Despite previous reports that TACC is required for binding of XMAP215 proteins at the centrosome, centrosomal CP224 levels were not obviously affected in TACC-RNAi cells neither in interphase (Fig. 11a, b), nor mitosis (Fig. 12). CP224 stayed tightly associated with the spindle poles throughout mitosis and localized to the kinetochores in metaphase and the mid-body region in telophase. Neither in wild-type nor in TACC-RNAi cells, CP224 could be observed at the tips of astral microtubules (Fig. 12). All our observations indicated that the mitotic localization pattern of CP224 is independent of TACC expression. Furthermore, fluorescence recovery after photobleaching (FRAP) experiments in cells expressing GFP-CP224 revealed no effect of TACC RNAi on exchange rates of GFP-CP224 neither at interphase centrosomes nor at metaphase spindle poles (Fig. 13a–d). For representative examples of time series used for FRAP analysis, see supplementary material (movies 1 and 2 for GFP-CP224 dynamics during interphase and movies 3 and 4 for GFP-CP224 dynamics during mitosis). In contrast, at microtubule plus ends, CP224 levels were dramatically reduced to undetectable levels upon TACC RNAi (Fig. 11). Expression of a GFP-TACC-domain protein in TACC depletion mutants rescues this effect and CP224 is effectively loaded onto the microtubule plus ends. To show this effect clearly and to exclude misinterpretations owing to different labeling intensities in independently prepared specimens, TACC depleted cells were mixed and fixed together with GFP-TACCdom expressing TACC-RNAi cells (arrowheads in Fig. 11a) and stained with anti-CP224. Thus, depending on the absence or presence of a green fluorescent centrosome, TACC depleted cells could easily be distinguished from cells expressing GFP-TACCdom. In these experiments no or almost no CP224 could be observed at microtubule tips upon TACC depletion (Fig. 11a, b), while centrosomal CP224 levels remained largely unaffected. The virtual absence of CP224 at microtubule tips upon TACC RNAi could not be due to a generally reduced expression of CP224 under these conditions, since Western blots revealed similar cellular CP224 levels in TACC RNAi cells and control cells (Fig. 6b).
Fig. 11.
CP224 localization at the microtubule plus ends is greatly impaired upon TACC depletion and depends on presence of the TACC domain. TACC-RNAi cells and TACC-RNAi cells expressing GFP-TACCdom were mixed, fixed with methanol and labeled with anti-CP224 (a, b). GFP-TACCdom expressing cells (arrowheads in a) can easily be identified due to their green fluorescent centrosomes. The typical staining pattern of CP224 at mictrotubule tips can only be observed in cells expressing GFP-TACCdom, while centrosomal CP224 can be seen in both cell types. c–e proves the microtubule tip localization of CP224 in wild-type cells stained with anti-CP224 (c, red in e) and anti-tubulin (d, green in e). In merged images DNA is shown in blue. Bar 2 μm
Fig. 12.
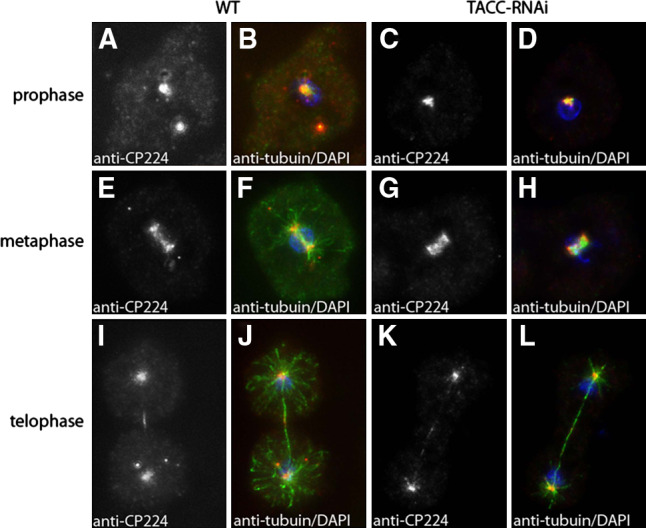
Depletion of TACC does not impair mitotic CP224 localization. Wild-type cells (a, b, e, f, i, j) and TACC-RNAi cells (c, d, g, h, k, l) were fixed with methanol and labeled with anti-CP224 (grayscale images, red in merged images) and anti-tubulin (green in merged images). Mitotic stages are indicated on the left, cell types on top. In merged images DNA is shown in blue. Bar 2 μm
Fig. 13.
Centrosomal dynamics of GFP-CP224 and GFP-tubulin are largely unaffected by TACC depletion. Fluorescence recovery after photobleaching (FRAP) of GFP-CP224 and GFP-tubulin in TACC-RNAi cells was compared with FRAP in GFP-tubulin cells and GFP-CP224 cells, respectively, which express TACC at wild-type levels. In interphase cells whole centrosomes were bleached. For analysis of GFP-CP224 and GFP-tubulin dynamics during mitosis exclusively metaphase cells were chosen and a single spindle pole was bleached. GFP-recovery was followed by 4D confocal live cell imaging. Fluorescence intensities in the bleached region of interest were evaluated with ImageJ. Representative examples of time series of all cell types used for analyses were added as supplementary material. The respective GFP fusion protein, the cell type used and the cell cycle stage is depicted on top of the respective graph. The half time of recovery and the number of individual experiments combined are indicated on the lower right. The standard deviation is indicated as error bars
Dictyostelium interphase microtubules show little length alterations but high tubulin turnover at centrosomes
For the first time our GFP-TACCdom and GFP-TACC strains allow visualization of microtubule plus ends in living Dictyostelium cells. The previously known markers, DdEB1 and CP224, are only concentrated at microtubule tips when expressed at endogenous levels. However, for sufficient brightness they have to be overexpressed, which causes them to distribute along the whole microtubule [4, 9]. In previous studies of Dictyostelium cells expressing GFP-α-tubulin or GFP-labeled MAPs, microtubules showed prominent lateral bending movements and a relatively stable length [36–38]. However, due to these rapid three-dimensional movements and insufficient time resolution of the available microscopic systems, it was virtually impossible to follow dynamic changes in length or catastrophe and rescue events of individual microtubules. However, when GFP-TACCdom was expressed in a marsRFP-α-tubulin Dictyostelium cell line with red fluorescent microtubules, tracking of individual microtubule ends was clearly facilitated, since GFP-TACCdom was present at plus ends of all microtubules (supplementary material Fig. S2 and movie 5). In these experiments we observed no complete catastrophe and rescue events during interphase, although microtubule behavior at the cell periphery close to the cortex suggested alterations in length. Some microtubule end movements may also be due to bending or straightening of microtubules. However FRAP experiments where the bleached region of interest was positioned in the cell periphery confirmed that there were indeed growth and shrinkage events in this region of the cell. Although the insufficient time resolution of the confocal laser scanning microscope made the study of fluorescence recovery at individual microtubules almost impossible, we recorded a few examples of rapid fluorescence recovery starting at the very tip of a single microtubule proceeding towards the minus end. This indicated considerable turnover of tubulin dimers (supplementary material movie 6). In contrast, bleaching of a square region of interest around the centrosome revealed a differential behavior of GFP-α-tubulin at microtubules emanating from the centrosome and the centrosome itself. While there was almost no recovery of fluorescence at microtubules close to the centrosome, GFP fluorescence rapidly re-appeared at the centrosome with a half time of recovery of 4,6 s (Fig. 13e, supplementary material movie 7). Yet, fluorescence at the centrosome never recovered to pre-bleach levels indicating the existence of an immobile fraction of tubulin.
TACC is not required for centrosomal turnover of tubulin dimers
Since TACC is involved in microtubule plus-end dynamics, which was concluded from the observation that TACC-RNAi cells were hypersensitive against TBZ treatment, we asked whether TACC is also needed for the observed GFP-α-tubulin dynamics at the centrosome. Therefore, we performed a FRAP analysis in TACC-RNAi cells expressing GFP-α-tubulin. Unexpectedly, these experiments demonstrated that the dynamic behavior of GFP-α-tubulin at the centrosome and the pericentrosomal area was unaffected by the lack of TACC (Fig. 13f, supplementary material movie 8). The slightly longer half time of GFP-α-tubulin recovery in TACC depleted interphase cells can be explained by a seemingly larger fraction of mobile GFP-α-tubulin, which certainly takes longer to replenish. In case of metaphase spindle poles our measurements revealed no differences in tubulin dynamics upon TACC RNAi at all (Fig. 13g, h; supplementary material movie 9 and 10). Since tubulin dimers are still efficiently recruited to the centrosome in the absence of TACC, a lack of free tubulin dimers at the centrosome is unlikely to explain the observed phenotypes of TACC depletion.
Discussion
With the GFP-labeled TACC domain we have established the first suitable marker to study dynamics and behavior of microtubule plus ends in living Dictyostelium cells. Our study revealed a differential dynamic behavior of microtubules in the cell periphery, in the pericentrosomal area and the centrosome itself. As in earlier studies [36–38], microtubules appeared rather stable in the first view. Thus, complete catastrophes, where microtubules shrink back to their origin at the centrosome, and growth of new microtubules from the centrosome were not observed. However, our Dictyostelium cell line co-expressing GFP-TACCdom and marsRFP-α-tubulin, revealed a considerably more pronounced dynamic behavior of microtubules in the cell periphery than expected. We think that this behavior was overlooked in earlier studies due to the difficulty to follow the ends of individual microtubules in these cells under the technical restrictions described above. The dynamic behavior of microtubules in the cell periphery was confirmed by our FRAP analyses of GFP-α-tubulin cells. In contrast, in the pericentrosomal area microtubules appeared to be rather stable, which was indicated by the persistence of the bleached zone around the centrosome. Surprisingly, at the centrosome itself GFP-α-tubulin recovered quickly within a few seconds. Our interpretation is that there are two populations of tubulin in this region. The first population showing no fluorescence recovery is incorporated into microtubules, whose minus ends are undynamic and firmly attached to the centrosome. The second population recovering quickly from photobleaching comprises a highly dynamic pool of tubulin dimers at the centrosome. This turnover was not slowed down by TBZ (Fig. S1, supplementary material). At TBZ concentrations effectively inhibiting microtubule growth, e.g. during spindle formation GFP-α-tubulin dimers still appear to be able to participate at the rapid turnover of tubulin dimers at the centrosome. The observed stability of Dictyostelium microtubules around the centrosome is in agreement with their resistance against TBZ, which reduces the pool of tubulin dimers available for assembly at microtubule ends below the critical concentration promoting microtubule growth. Although treatment of Dictyostelium cells with reagents such as TBZ or nocodazole never leads to complete microtubule depolymerization in wild-type cells, these substances have a clear effect, since they effectively prevent spindle formation and clearly shorten microtubules in interphase cells. Due to their mode of action these agents can only depolymerize dynamic microtubule arrays as they were observed in the periphery of Dictyostelium cells. Thus, our observation of a stable zone of microtubules in the pericentrosomal area perfectly explains the failure of these agents to depolymerize Dictyostelium microtubules completely. The microtubule stabilizing factors in Dictyostelium are unknown. CP224 and TACC, which both are clearly required for microtubule growth (this work and [11]), are unlikely to play an important role in this respect. This is based on the observation that GFP-α-tubulin recovery at the cell periphery, the pericentrosomal area and the centrosome itself were largely unaffected by TACC depletion through RNAi, although both TACC and CP224 were absent from microtubule plus ends. However, CP224 may be involved in loading tubulin dimers to the dynamic centrosomal pool of tubulin dimers that we have postulated in this work. This is corroborated by the fact that GFP-CP224 and GFP-α-tubulin show similar FRAP kinetics at the centrosome and since both their presence at the centrosome and FRAP kinetics were unaffected by TACC-RNAi.
Upon expression of GFP-TACCdom, many TACC-RNAi cells regained their normal microtubule length in interphase. Yet, some cells still displayed shortened microtubules although GFP-TACCdom, and thus CP224, was associated with their microtubule tips. This indicates that even though the TACC domain is crucial and sufficient for efficiently recruiting CP224 to microtubule plus ends, full-length TACC is likely to serve an additional microtubule-stabilizing function independent of CP224, which cannot under all circumstances be fulfilled by the TACC domain alone.
The virtual absence of astral microtubules in TACC RNAi metaphase cells is likely to be due to an impaired function of TACC at the centrosome and not at microtubule plus ends, since neither TACC nor CP224 could be observed at astral microtubule tips in wild-type cells. In prophase the corona of Dictyostelium centrosomes disassembles together with all interphase microtubules. Concomitantly most corona components are released into the cytoplasm. TACC instead remains tightly associated with prophase centrosomes and even gets enriched prior to tubulin disassembly (own observations, not shown). Recently it was shown that isolated, salt-striped Xenopus centrosomes regain their ability to form asters when incubated in Xenopus egg extract and purified tubulin. However, no asters were formed when centrosomes were treated with maskin depleted egg extract [24]. In analogy to these results, it is tempting to speculate that Dictyostelium TACC is either required for nucleation of astral microtubules in metaphase and/or for their anchorage of their minus ends at the mitotic centrosome.
Taken together, with this work we provide the first quantitative investigation of tubulin dynamics at the centrosome in Dictyostelium and the first explanations for the unusual behavior of Dictyostelium microtubules upon incubation with microtubule depolymerizing drugs. Furthermore, using RNAi we have proven that Dictyostelium TACC promotes microtubule growth during interphase and mitosis and that it is a genuine centrosomal component. For the first time we show that both TACC and XMAP215 family proteins can be differentially localized to microtubule plus ends during interphase and mitosis. While Dictyostelium TACC and CP224 are present at microtubule tips during interphase and kinetochore microtubules during mitosis, they are absent from plus ends of astral microtubules. Furthermore, we have demonstrated for the first time in vivo that TACC is mainly required for recruitment of an XMAP215-family protein to interphase microtubule plus ends but not for recruitment to centrosomes and kinetochores. The XMAP215 protein CP224 has to be bound to centrosomes and kinetochores through interactions with other proteins that are waiting to be identified in the near future.
Electronic supplementary material
Below is the link to the electronic supplementary material.
Fig. S1 Centrosomal dynamics of GFP-α-tubulin under the influence of the microtubule depolymerizing drug thiabendazole.A representative experiment of fluorescence recovery after photobleaching of centrosomal GFP-α-tubulin after incubation with 100 µM TBZ for 3 h is shown (the bleached region of interest was placed around the centrosome followed by 4D confocal live cell imaging. Fluorescence intensities in the bleached region of interest were evaluated with ImageJ. The half time of recovery and is indicated on the lower right (TIFF 14702 kb)
Fig. S2 Dynamic behavior of individual microtubules in the cell periphery of cells expressing marsRFP-α-tubulin and GFP-TACCdom.Two still images of movie 5 are shown. Tips of individual microtubules where movements are traceable are labeled with arrowheads (TIFF 23623 kb)
Movie 1For FRAP analysis of centrosomal GFP-CP224 during interphase the framed area was bleached followed by 4D confocal live cell imaging. For each time point, a z-stack consisting of 5 images with an interval of 0,5 µm was taken. Shown is a maximum intensity projection. The time interval is indicated on the upper left (MPG 721 kb)
Movie 2 For FRAP analysis of centrosomal GFP-CP224 in TACC depleted cells during interphase the framed area was bleached followed by 4D confocal live cell imaging. For each time point, a z-stack consisting of 5 images with an interval of 0,5 μm was taken. Shown is a maximum intensity projection. The time interval is indicated on the upper left (MPG 481 kb)
Movie 3 For FRAP analysis of spindle pole GFP-CP224 during mitosis the framed area was bleached followed by 4D confocal live cell imaging. For each time point, a z-stack consisting of five images with an interval of 0.5 µm was taken. Shown is a maximum intensity projection. The time interval is indicated on the upper left (MPG 512 kb)
Movie 4For FRAP analysis of spindle pole GFP-CP224 in TACC depleted cells during mitosis the framed area was bleached followed by 4D confocal live cell imaging. For each time point, a z-stack consisting of 5 images with an interval of 0,5 μm was taken. Shown is a maximum intensity projection. The time interval is indicated on the upper left (MPG 1926 kb)
Movie 5To study microtubule plus-end dynamics in vivo, a time series of confocal images of cells expressing marsRFP-α-tubulin and GFP-TACCdom as a microtubule plus-end marker were taken during interphase. For each time point, a z-stack consisting of five images with an interval of 0.5 µm was taken. Shown is a maximum intensity projection. The time interval is indicated on the upper left(MPG 6434 kb)
Movie 6For FRAP analysis of GFP-α-tubulin at microtubule plus ends the framed area was bleached followed by 4D confocal live cell imaging. For each time point, a z-stack consisting of five images with an interval of 0.5 µm was taken. Shown is a maximum intensity projection. The time interval is indicated on the upper left (MPG 2816 kb)
Movie 7For FRAP analysis of centrosomal GFP-α-tubulin during interphase the framed area was bleached followed by 4D confocal live cell imaging. For each time point, a z-stack consisting of five images with an interval of 0.5 µm was taken. Shown is a maximum intensity projection. The time interval is indicated on the upper left (MPG 5248 kb)
Movie 8For FRAP analysis of centrosomal GFP-α-tubulin in TACC depleted cells during interphase the framed area was bleached followed by 4D confocal live cell imaging. For each time point, a z-stack consisting of five images with an interval of 0.5 µm was taken. Shown is a maximum intensity projection. The time interval is indicated on the upper left (MPG 4994 kb)
Movie 9For FRAP analysis of spindle pole GFP-α-tubulin during mitosis the framed area was bleached followed by 4D confocal live cell imaging. For each time point, a z-stack consisting of five images with an interval of 0.5 µm was taken. Shown is a maximum intensity projection. The time interval is indicated on the upper left (MPG 2492 kb)
Movie 10For FRAP analysis of spindle pole GFP-α-tubulin in TACC depleted cells during mitosis the framed area was bleached followed by 4D confocal live cell imaging. For each time point, a z-stack consisting of five images with an interval of 0.5 µm was taken. Shown is a maximum intensity projection. The time interval is indicated on the upper left (MPG 3454 kb)
Acknowledgments
We would like to thank Dr. Katrin Pfütze for her engagement in the early stages of this project. We also acknowledge Anita Guhlan and Anne Krumbiegel for technical assistance. We are grateful to Dr. Annette Müller-Taubenberger (University of Munich, Institute for Cell Biology, Munich, Germany) for the marsRFP plasmid. This work was supported by the Deutsche Forschungsgemeinschaft GR1642/2-2.
Abbreviations
- FRAP
Fluorescence recovery after photobleaching
- MAP
Microtubule-associated protein
- TBZ
Thiabendazole
References
- 1.Dammermann A, Desai A, Oegema K. The minus end in sight. Curr Biol. 2003;13:R614–R624. doi: 10.1016/S0960-9822(03)00530-X. [DOI] [PubMed] [Google Scholar]
- 2.Carvalho P, Tirnauer JS, Pellman D. Surfing on microtubule ends. Trends Cell Biol. 2003;13:229–237. doi: 10.1016/S0962-8924(03)00074-6. [DOI] [PubMed] [Google Scholar]
- 3.Slep KC, Rogers SL, Elliott SL, Ohkura H, Kolodziej PA, Vale RD. Structural determinants for EB1-mediated recruitment of APC and spectraplakins to the microtubule plus end. J Cell Biol. 2005;168:587–598. doi: 10.1083/jcb.200410114. [DOI] [PMC free article] [PubMed] [Google Scholar]
- 4.Gräf R, Daunderer C, Schliwa M. Dictyostelium DdCP224 is a microtubule-associated protein and a permanent centrosomal resident involved in centrosome duplication. J Cell Sci. 2000;113:1747–1758. doi: 10.1242/jcs.113.10.1747. [DOI] [PubMed] [Google Scholar]
- 5.Brouhard GJ, Stear JH, Noetzel TL, Al-Bassam J, Kinoshita K, Harrison SC, Howard J, Hyman AA. XMAP215 is a processive microtubule polymerase. Cell. 2008;132:79–88. doi: 10.1016/j.cell.2007.11.043. [DOI] [PMC free article] [PubMed] [Google Scholar]
- 6.Lee MJ, Gergely F, Jeffers K, Peak-Chew SY, Raff JW. Msps/XMAP215 interacts with the centrosomal protein D-TACC to regulate microtubule behavior. Nat Cell Biol. 2001;3:643–649. doi: 10.1038/35083033. [DOI] [PubMed] [Google Scholar]
- 7.Gard DL, Becker BE, Josh Romney S. MAPping the eukaryotic tree of life: structure, function, and evolution of the MAP215/Dis1 family of microtubule-associated proteins. Int Rev Cytol. 2004;239:179–272. doi: 10.1016/S0074-7696(04)39004-2. [DOI] [PubMed] [Google Scholar]
- 8.Gard DL, Kirschner MW. A microtubule-associated protein from Xenopus eggs that specifically promotes assembly at the plus-end. J Cell Biol. 1987;105:2203–2215. doi: 10.1083/jcb.105.5.2203. [DOI] [PMC free article] [PubMed] [Google Scholar]
- 9.Rehberg M, Gräf R. Dictyostelium EB1 is a genuine centrosomal component required for proper spindle formation. Mol Biol Cell. 2002;13:2301–2310. doi: 10.1091/mbc.E02-01-0054. [DOI] [PMC free article] [PubMed] [Google Scholar]
- 10.Hestermann A, Gräf R. The XMAP215-family protein DdCP224 is required for cortical interactions of microtubules. BMC Cell Biol. 2004;5:24. doi: 10.1186/1471-2121-5-24. [DOI] [PMC free article] [PubMed] [Google Scholar]
- 11.Gräf R, Euteneuer U, Ho TH, Rehberg M. Regulated expression of the centrosomal protein DdCP224 affects microtubule dynamics and reveals mechanisms for the control of supernumerary centrosome number. Mol Biol Cell. 2003;14:4067–4074. doi: 10.1091/mbc.E03-04-0242. [DOI] [PMC free article] [PubMed] [Google Scholar]
- 12.Koch KV, Reinders Y, Ho TH, Sickmann A, Gräf R. Identification and isolation of Dictyostelium microtubule-associated protein interactors by tandem affinity purification. Eur J Cell Biol. 2006;85:1079–1090. doi: 10.1016/j.ejcb.2006.05.008. [DOI] [PubMed] [Google Scholar]
- 13.Still IH, Hamilton M, Vince P, Wolfman A, Cowell JK. Cloning of TACC1, an embryonically expressed, potentially transforming coiled coil containing gene, from the 8p11 breast cancer amplicon. Oncogene. 1999;18:4032–4038. doi: 10.1038/sj.onc.1202801. [DOI] [PubMed] [Google Scholar]
- 14.Gergely F. Centrosomal TACCtics. Bioessays. 2002;24:915–925. doi: 10.1002/bies.10162. [DOI] [PubMed] [Google Scholar]
- 15.Peset I, Vernos I. The TACC proteins: TACC-ling microtubule dynamics and centrosome function. Trends Cell Biol. 2008;18:379–388. doi: 10.1016/j.tcb.2008.06.005. [DOI] [PubMed] [Google Scholar]
- 16.Gergely F, Karlsson C, Still I, Cowell J, Kilmartin J, Raff JW. The TACC domain identifies a family of centrosomal proteins that can interact with microtubules. Proc Natl Acad Sci USA. 2000;97:14352–14357. doi: 10.1073/pnas.97.26.14352. [DOI] [PMC free article] [PubMed] [Google Scholar]
- 17.Gergely F, Kidd D, Jeffers K, Wakefield JG, Raff JW. D-TACC: a novel centrosomal protein required for normal spindle function in the early Drosophila embryo. EMBO J. 2000;19:241–252. doi: 10.1093/emboj/19.2.241. [DOI] [PMC free article] [PubMed] [Google Scholar]
- 18.Le Bot N, Tsai MC, Andrews RK, Ahringer J. TAC-1, a regulator of microtubule length in the C. elegans embryo. Curr Biol. 2003;13:1499–1505. doi: 10.1016/S0960-9822(03)00577-3. [DOI] [PubMed] [Google Scholar]
- 19.Peset I, Seiler J, Sardon T, Bejarano LA, Rybina S, Vernos I. Function and regulation of Maskin, a TACC family protein, in microtubule growth during mitosis. J Cell Biol. 2005;170:1057–1066. doi: 10.1083/jcb.200504037. [DOI] [PMC free article] [PubMed] [Google Scholar]
- 20.Cullen CF, Ohkura H. Msps protein is localized to acentrosomal poles to ensure bipolarity of Drosophila meiotic spindles. Nat Cell Biol. 2001;3:637–642. doi: 10.1038/35083025. [DOI] [PubMed] [Google Scholar]
- 21.Bellanger JM, Gonczy P. TAC-1 and ZYG-9 form a complex that promotes microtubule assembly in C. elegans embryos. Curr Biol. 2003;13:1488–1498. doi: 10.1016/S0960-9822(03)00582-7. [DOI] [PubMed] [Google Scholar]
- 22.Srayko M, Quintin S, Schwager A, Hyman AA. Caenorhabditis elegans TAC-1 and ZYG-9 form a complex that is essential for long astral and spindle microtubules. Curr Biol. 2003;13:1506–1511. doi: 10.1016/S0960-9822(03)00597-9. [DOI] [PubMed] [Google Scholar]
- 23.Kinoshita K, Noetzel TL, Arnal I, Drechsel DN, Hyman AA. Global and local control of microtubule destabilization promoted by a catastrophe kinesin MCAK/XKCM1. J Muscle Res Cell Motil. 2006;27:107–114. doi: 10.1007/s10974-005-9045-2. [DOI] [PubMed] [Google Scholar]
- 24.Albee AJ, Wiese C. Xenopus TACC3/maskin is not required for microtubule stability but is required for anchoring microtubules at the centrosome. Mol Biol Cell. 2008;19:3347–3356. doi: 10.1091/mbc.E07-11-1204. [DOI] [PMC free article] [PubMed] [Google Scholar]
- 25.Schulz I, Baumann O, Samereier M, Zoglmeier C, Gräf R. Dictyostelium Sun1 is a dynamic membrane protein of both nuclear membranes and required for centrosomal association with clustered centromeres. Eur J Cell Biol. 2009;88:621–638. doi: 10.1016/j.ejcb.2009.06.003. [DOI] [PubMed] [Google Scholar]
- 26.Martens H, Novotny J, Oberstrass J, Steck TL, Postlethwait P, Nellen W. RNAi in Dictyostelium: the role of RNA-directed RNA polymerases and double-stranded RNase. Mol Biol Cell. 2002;13:445–453. doi: 10.1091/mbc.01-04-0211. [DOI] [PMC free article] [PubMed] [Google Scholar]
- 27.Bretschneider T, Anderson K, Ecke M, Muller-Taubenberger A, Schroth-Diez B, Ishikawa-Ankerhold HC, Gerisch G. The three-dimensional dynamics of actin waves, a model of cytoskeletal self-organization. Biophys J. 2009;96:2888–2900. doi: 10.1016/j.bpj.2008.12.3942. [DOI] [PMC free article] [PubMed] [Google Scholar]
- 28.Müller-Taubenberger A, Vos MJ, Bottger A, Lasi M, Lai FP, Fischer M, Rottner K. Monomeric red fluorescent protein variants used for imaging studies in different species. Eur J Cell Biol. 2006;85:1119–1129. doi: 10.1016/j.ejcb.2006.05.006. [DOI] [PubMed] [Google Scholar]
- 29.Samereier M, Meyer I, Koonce MP, Gräf R (2010) Live cell imagine techniques for analyses of microtubules in Dictyostelium. Methods Cell Biol (in press) [DOI] [PubMed]
- 30.Fukui Y, Yumura S, Yumura TK. Agar-overlay immunofluorescence: high resolution studies of cytoskeletal components and their changes during chemotaxis. Methods Cell Biol. 1987;28:347–356. doi: 10.1016/S0091-679X(08)61655-6. [DOI] [PubMed] [Google Scholar]
- 31.Gräf R, Euteneuer U, Ueda M, Schliwa M. Isolation of nucleation-competent centrosomes from Dictyostelium discoideum . Eur J Cell Biol. 1998;76:167–175. doi: 10.1016/S0171-9335(98)80031-9. [DOI] [PubMed] [Google Scholar]
- 32.Daunderer C, Gräf R. Molecular analysis of the cytosolic Dictyostelium γ-tubulin complex. Eur J Cell Biol. 2002;81:175–184. doi: 10.1078/0171-9335-00241. [DOI] [PubMed] [Google Scholar]
- 33.Gräf R, Daunderer C, Schliwa M. Cell cycle-dependent localization of monoclonal antibodies raised against isolated Dictyostelium centrosomes. Biol Cell. 1999;91:471–477. doi: 10.1016/S0248-4900(99)80088-4. [DOI] [PubMed] [Google Scholar]
- 34.Wehland J, Willingham MC. A rat monoclonal antibody reacting specifically with the tyrosylated form of alpha-tubulin II. Effects on cell movement, organization of microtubules, and intermediate filaments, and arrangement of Golgi elements. J Cell Biol. 1983;97:1476–1490. doi: 10.1083/jcb.97.5.1476. [DOI] [PMC free article] [PubMed] [Google Scholar]
- 35.Schulz I, Erle A, Gräf R, Kruger A, Lohmeier H, Putzler S, Samereier M, Weidenthaler S. Identification and cell cycle-dependent localization of nine novel, genuine centrosomal components in Dictyostelium discoideum . Cell Motil Cytoskeleton. 2009;66:915–928. doi: 10.1002/cm.20384. [DOI] [PubMed] [Google Scholar]
- 36.Brito DA, Strauss J, Magidson V, Tikhonenko I, Khodjakov A, Koonce MP. Pushing forces drive the comet-like motility of microtubule arrays in Dictyostelium . Mol Biol Cell. 2005;16:3334–3340. doi: 10.1091/mbc.E05-01-0057. [DOI] [PMC free article] [PubMed] [Google Scholar]
- 37.Kimble M, Kuzmiak C, McGovern KN, de Hostos EL. Microtubule organization and the effects of GFP-tubulin expression in Dictyostelium discoideum . Cell Motil Cytoskeleton. 2000;47:48–62. doi: 10.1002/1097-0169(200009)47:1<48::AID-CM5>3.0.CO;2-Q. [DOI] [PubMed] [Google Scholar]
- 38.Koonce MP, Khodjakov A. Dynamic microtubules in Dictyostelium . J Muscle Res Cell Motil. 2002;23:613–619. doi: 10.1023/A:1024446821701. [DOI] [PubMed] [Google Scholar]
Associated Data
This section collects any data citations, data availability statements, or supplementary materials included in this article.
Supplementary Materials
Fig. S1 Centrosomal dynamics of GFP-α-tubulin under the influence of the microtubule depolymerizing drug thiabendazole.A representative experiment of fluorescence recovery after photobleaching of centrosomal GFP-α-tubulin after incubation with 100 µM TBZ for 3 h is shown (the bleached region of interest was placed around the centrosome followed by 4D confocal live cell imaging. Fluorescence intensities in the bleached region of interest were evaluated with ImageJ. The half time of recovery and is indicated on the lower right (TIFF 14702 kb)
Fig. S2 Dynamic behavior of individual microtubules in the cell periphery of cells expressing marsRFP-α-tubulin and GFP-TACCdom.Two still images of movie 5 are shown. Tips of individual microtubules where movements are traceable are labeled with arrowheads (TIFF 23623 kb)
Movie 1For FRAP analysis of centrosomal GFP-CP224 during interphase the framed area was bleached followed by 4D confocal live cell imaging. For each time point, a z-stack consisting of 5 images with an interval of 0,5 µm was taken. Shown is a maximum intensity projection. The time interval is indicated on the upper left (MPG 721 kb)
Movie 2 For FRAP analysis of centrosomal GFP-CP224 in TACC depleted cells during interphase the framed area was bleached followed by 4D confocal live cell imaging. For each time point, a z-stack consisting of 5 images with an interval of 0,5 μm was taken. Shown is a maximum intensity projection. The time interval is indicated on the upper left (MPG 481 kb)
Movie 3 For FRAP analysis of spindle pole GFP-CP224 during mitosis the framed area was bleached followed by 4D confocal live cell imaging. For each time point, a z-stack consisting of five images with an interval of 0.5 µm was taken. Shown is a maximum intensity projection. The time interval is indicated on the upper left (MPG 512 kb)
Movie 4For FRAP analysis of spindle pole GFP-CP224 in TACC depleted cells during mitosis the framed area was bleached followed by 4D confocal live cell imaging. For each time point, a z-stack consisting of 5 images with an interval of 0,5 μm was taken. Shown is a maximum intensity projection. The time interval is indicated on the upper left (MPG 1926 kb)
Movie 5To study microtubule plus-end dynamics in vivo, a time series of confocal images of cells expressing marsRFP-α-tubulin and GFP-TACCdom as a microtubule plus-end marker were taken during interphase. For each time point, a z-stack consisting of five images with an interval of 0.5 µm was taken. Shown is a maximum intensity projection. The time interval is indicated on the upper left(MPG 6434 kb)
Movie 6For FRAP analysis of GFP-α-tubulin at microtubule plus ends the framed area was bleached followed by 4D confocal live cell imaging. For each time point, a z-stack consisting of five images with an interval of 0.5 µm was taken. Shown is a maximum intensity projection. The time interval is indicated on the upper left (MPG 2816 kb)
Movie 7For FRAP analysis of centrosomal GFP-α-tubulin during interphase the framed area was bleached followed by 4D confocal live cell imaging. For each time point, a z-stack consisting of five images with an interval of 0.5 µm was taken. Shown is a maximum intensity projection. The time interval is indicated on the upper left (MPG 5248 kb)
Movie 8For FRAP analysis of centrosomal GFP-α-tubulin in TACC depleted cells during interphase the framed area was bleached followed by 4D confocal live cell imaging. For each time point, a z-stack consisting of five images with an interval of 0.5 µm was taken. Shown is a maximum intensity projection. The time interval is indicated on the upper left (MPG 4994 kb)
Movie 9For FRAP analysis of spindle pole GFP-α-tubulin during mitosis the framed area was bleached followed by 4D confocal live cell imaging. For each time point, a z-stack consisting of five images with an interval of 0.5 µm was taken. Shown is a maximum intensity projection. The time interval is indicated on the upper left (MPG 2492 kb)
Movie 10For FRAP analysis of spindle pole GFP-α-tubulin in TACC depleted cells during mitosis the framed area was bleached followed by 4D confocal live cell imaging. For each time point, a z-stack consisting of five images with an interval of 0.5 µm was taken. Shown is a maximum intensity projection. The time interval is indicated on the upper left (MPG 3454 kb)


