Abstract
The thyroid hormone T3 regulates differentiation, growth, and development. We demonstrated that methionine adenosyltransferase 1A (MAT1A) was positively regulated by T3 identified by cDNA microarray previously. The expression of the MAT1A was upregulated by T3 in hepatoma cell lines overexpressing thyroid hormone receptors (TRs). Additionally, these findings indicate that MAT1A may be regulated by CCAAT/enhancer binding protein (C/EBP). The critical role of the C/EBP binding sites was confirmed by the reporter or chromatin immuno-precipitation (ChIP) assay. In addition, C/EBP was upregulated in hepatoma cells after T3 treatment and ectopic expression of MAT1A inhibited cell migration and invasion in J7 hepatoma cells. Conversely, knockdown of MAT1A expression increased cell migration. Together, these findings suggest that the expression of the MAT1A gene is mediated by C/EBP and is indirectly upregulated by T3. Finally, TR was downregulated in a small subset of hepatocellular carcinoma cells concomitantly reduced the expression of C/EBPα and MAT1A.
Keywords: MAT1A, Thyroid hormone, Receptor, Invasion, Migration
Introduction
The thyroid hormone (3,3′,5-triiodo-l-thyronine; T3) is a potent mediator of many physiological processes, which include embryonic development, cellular differentiation, metabolism, and the regulation of cell proliferation [1–4]. T3 controls these processes in most, if not all, organs of the body. These activities are mediated by the nuclear thyroid hormone receptors TRs, of which two principal types have been identified. These are referred to as TRα and TRβ, which are encoded on human chromosomes 17 and 3, respectively [5, 6]. Transcripts of each of these genes undergo alternative promoter choice to generate TRα1 and α2 and TRβ1 and β2 receptor isoforms [7, 8]. Similarly to what is observed for other nuclear hormone receptors, the TRs are ligand-dependent transcription factors that comprise modular functional domains that mediate the binding of hormones (ligands), DNA binding, receptor homo- and hetero-dimerization, and interact with other transcription factors and cofactors [9, 10]. TRs regulate the transcription of target genes by binding to specific DNA elements, which are referred to as thyroid hormone response elements (TREs), in the promoter regions of these genes. In the absence of the T3 ligand, TRs repress the expression of target genes, a phenomenon known as transcriptional silencing [7]. This process is thought to be mediated by interaction with transcriptional corepressors such as the silencing mediator of retinoic acid and thyroid hormone receptor (SMRT) via the ligand-binding domain of the receptor [10]. The binding of the ligand is thought to induce dissociation of TRs from corepressors and to result in the recruitment of transcriptional coactivators such as the steroid receptor coactivator (SRC) and the subsequent activation of target gene expression [9]. However, the mechanisms underlying the selective TRα1-mediated maintenance of liver-specific gene transcription remain unknown. It has been long recognized that the liver is a target organ for TRs and is also the primary site of synthesis of the blood proteins involved in coagulation. Chamba et al. [11] reported that the abundance of TRα1 and TRβ1 in normal human liver is 0.8 and 1.08 absorbance units, respectively, as assessed by Western-blot analysis. Their results revealed abundant TRα1, TRα2, and TRβ1 protein in human hepatocytes.
The methionine adenosyltransferase 1A (MAT1A) gene catalyzes a two-step reaction that involves the transfer of the adenosyl moiety of ATP to methionine to form S-adenosylmethionine and tripolyphosphate, which is subsequently cleaved to PPi and Pi. S-adenosylmethionine is the source of methyl groups for most biological methylation reactions. The encoded protein is found as a homotetramer (MAT I) or a homodimer (MAT III), whereas a third form, MAT II (gamma), is encoded by the MAT2A gene [12–14]. The MAT1A was positively regulated by T3 identified by cDNA microarray previously [15].
The present results indicate that T3 upregulated the expression of MAT1A in HepG2 cells overexpressing TRα1 and TRβ1, which was observed at both the mRNA and protein levels. Thus, our results suggest that T3 controls MAT1A expression. Finally, we elucidated the potential physiological function of this regulation.
Materials and methods
Cell culture
The human hepatoma cell lines HepG2, HepG2-TRα1#1 and its sublines, J7, and Huh7 were routinely cultured in Dulbecco’s modified Eagle’s medium (DMEM) supplemented with 10% (v/v) fetal bovine serum. HepG2-TRα1 cells express TRα1 at high levels, as previously described [16, 17]. The serum was depleted of T3 (Td), as described [18]. Cells were cultured at 37°C in a humidified atmosphere of 95% air and 5% CO2.
Northern-blot analysis
Total RNA was extracted from cells using the TRIzol Reagent (Life Technologies, Rockville, MD) and equal amounts of total RNA (20 μg) were analyzed on a 1.2% agarose–formaldehyde gel, as described [19]. The separated RNA molecules were then transferred onto a nitrocellulose membrane and subjected to Northern-blot analysis, as described [19]. The probe used was a full-length MAT1A cDNA fragment that was polymerase chain reaction (PCR)-amplified and labeled with [α-32P]dCTP (3,000 Ci/mmol; Amersham Inc., Piscataway, NJ). The membrane was subsequently reprobed with a 32P-labeled 18S rRNA to verify equal loading of RNA in all lanes. In some experiments, cells were treated with T3 and 10 μg/ml cycloheximide (CHX) simultaneously for 12 or 24 h, after which total RNA was isolated and subjected to Northern-blot analysis.
Immunoblot analysis
Cell lysates were fractionated by SDS-PAGE on a 10% gel and the separated proteins were transferred onto a nitrocellulose membrane (pH 7.9; Amersham). The membrane was blocked for 2 h at room temperature in 5% (w/v) nonfat dried milk in Tris-buffered saline (TBS). The membrane was then washed three times with TBS and incubated for 1 h with a rabbit polyclonal antibody to MAT1A (1:1,000 dilution in TBS) (Santa Cruz Biotechnology, Santa Cruz, CA). After further washing, the membrane was incubated for 1 h with horseradish peroxidase-conjugated and affinity-purified antibodies to either rabbit (1:1,000 dilution in TBS) or mouse (1:1,000 dilution in TBS) immunoglobulins (Santa Cruz Biotechnology). Immune complexes were then visualized by chemiluminescence using an ECL detection kit (Amersham). The intensities of immunoreactive bands were quantitated via analysis using Image Gauge software (Fuji Film, Tokyo, Japan).
Cloning of the MAT1A 5′ flanking region and promoter activity assay
Fragments of the MAT1A promoter (nucleotides −1,707 to +18) were amplified using PCR according to the published nucleotide sequence [20] and were then inserted into the pGL3 or pA3TK-Luc vectors. The promoter sequence of the constructs was verified by automated DNA sequencing. To measure the influence of T3 on the transcriptional activity of the MAT1A promoter, HepG2-TRα1#1 cells (1 × 10⁵ per 12-well plate) were cotransfected with 1.2 μg/well of pGL3 or pA3TK-luc vectors containing MAT1A promoter sequences of various lengths using a lipofectamine protocol (Invitrogen Corp., Carlsbad, CA). Cells were also cotransfected with 0.33 μg of the β-galactosidase expression vector pSVβ (Clontech Laboratories, Inc., Palo Alto, CA), as described elsewhere [21].
Chromatin immunoprecipitation assays
Chromatin immunoprecipitation (ChIP) assays were performed to determine the interaction of TR with the TRE of the MAT1A promoter region. HepG2-TRα1 cells were treated with or without 10 nM T3 for 24 h, harvested, and crosslinked with 1% formaldehyde for 10 min. The reaction was terminated by the addition of 0.125 M glycine. Cells were washed four times in ice-cold PBS, resuspended in RIPA lysis buffer (0.1% SDS, 0.1% sodium deoxycholate, 150 mM NaCl, 50 mM Tris (pH 8.0), and 5 mM EDTA) in the presence of protease inhibitors (1 mM each of PMSF, aprotinin, and leupeptin), and sonicated to shear chromatin using a Misonix Sonicator 3000 Homogenizer (Mandel Scientific Company Inc., Guelph, ON, Canada). The sonicated DNA fragments were in the 200–2,000 bp range (average 450 bp). The samples were precleared with 60 μl protein A/G agarose (Sigma Chemicals, St. Louis, MO) for 30 min at 4°C. Complexes were immunoprecipitated using 2 μg of an anti-CAAT enhancer binding protein (C/EBP) antibody (Santa Cruz Biotechnology) or an anti-IgG antibody (R&D Systems, Inc., Minneapolis, MN). The fragments of the MAT1A promoter containing the predicted C/EBP binding sites was detected by PCR using the following primers: human epoxide hydrolase (EPHX1) [22], F: 5′-AGCAAGCTTCTCGAGCACT GATCATTTCAG-3′, R: 5′-TTGTCAAGGAGGCTGCGAGCATAA-3′; MAT (–969 to –656), F: 5′-CGGGGTACCATGCACAAGGT TATGGTTgATT-3′, R: 5′-CCG CTCGAGGGATTCATTACAGGGAAA-3′; MAT (–466 to –334), F: 5′-CGGGGTACCAATCTATCACAGCTGGCTCAGAATAC-3′, R: 5′-CCGCTC GAGCTGTTGGGTGTCCCCTCCTC-3′; MAT (–88 to +12), F: 5′-CGGGGT ACCTCCAGGTAAGAAGACCCC-3′, R: 5′-CCGCTCGAGCCTGAGCGACTCCT ATATA-3′.
Quantitative reverse transcription PCR
Total cellular RNA was extracted using the TRIzol reagent as described elsewhere. Subsequently, cDNA was synthesized using the Superscript II kit for RT-PCR (Life Technologies), as described previously [21]. Real-time quantitative reverse transcription PCR (qrt-PCR) was conducted as described previously [21]. The genes were normalized against the ribosomal binding protein (RiboL35A) gene, as specified in user bulletin no. 2 (Applied Biosystems).
Establishment of MAT1A or C/EBPα and β knockdown or overexpression of stable hepatocellular carcinoma (HCC) cell lines
Clones for shRNA targeting MAT1A, C/EBPα and β were purchased from the National RNAi Core Facility (Institute of Molecular Biology, Academia Sinica, Taiwan). The transfection of shRNA for the targeting of the endogenous MAT1A or C/EBPα and β gene in HepG2-TRα1 cells was performed using the Lipofectamine reagent (Invitrogen). After 24 h of incubation, cells were transferred to medium containing puromycin (2 μg/ml), for selection. After 2 weeks of selection, specific repression of the targeted gene was confirmed by Western-blot analysis. Alternatively, MAT1A was overexpressed in J7 cells.
Zymography assay for matrix metallopeptidase (MMP)-2 and -9
Cells (3 × 10⁶) were plated in DMEM containing 10% fetal bovine serum. After 24 h of incubation, the cells were washed and incubation was continued in serum-free medium. The medium was collected 24 h later and concentrated using an Amicon Ultra-4 membrane (Millipore, Bellerica, MA) to roughly 500 ng/μl. Forty micrograms of concentrated medium was diluted in 50 mM Tris–HCl pH 7.4 without a reducing agent and separated using 10% SDS-PAGE in the presence of 1 mg/ml gelatin. After electrophoresis, the gels were washed in 2.5% Triton X-100 for 30 min and incubated for 16 h at 37°C in buffer containing 50 mM Tris–HCl pH 7.4, 200 mM NaCl, and 10 mM CaCl2. Gels were stained with Coomassie Brilliant Blue R-250 and destained in 40% methanol and 10% acetic acid until clear bands appeared.
In vitro assay of invasive activity
The influence of T3 on the effect of MAT1A knockdown-mediated invasive activity in HepG2-TRα1 or J7-MAT1A cell lines was assessed using a Transwell rapid in vitro assay, as described previously [23]. Briefly, cell density was adjusted to 1 × 10⁵/ml and 200 μl of this suspension was added to each matrigel-coated well (Becton–Dickinson, Franklin Lakes, NJ) in triplicate. The medium in the upper chamber was serum-free DMEM and that in the lower chamber was supplemented with 10% fetal bovine serum. After incubation for 20 h at 37°C, we determined the number of viable cells that had traversed the filter to the lower chamber.
Human HCC specimens
With informed consent, 123 patients with HCC diagnosed between 2000 and 2003 were consecutively selected for this study. The study protocol was approved by the Medical Ethics and Human Clinical Trial Committee of the Chang-Gung Memorial Hospital (CGMH).
Statistical analysis
Values were expressed as the mean ± SEM of at least three observations. Statistical analysis was carried out with the help of the Statistical Package for Social Science, version 13.0 (SPSS, Inc., Chicago, IL, USA). Significance was set at P < 0.05.
Results
Effects of T3 treatment on MAT1A expression at both the mRNA and protein levels
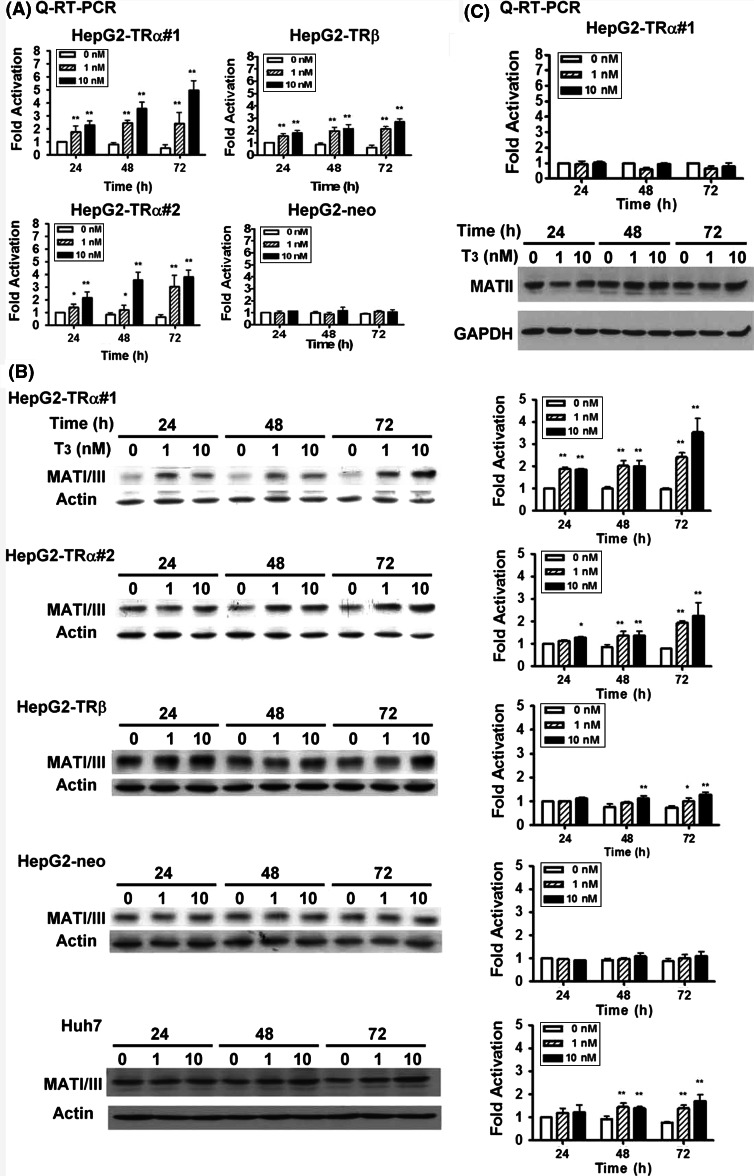
To examine the effect of T3 on MAT1A gene expression, we established and utilized the HepG2-TRα1#1, HepG2-TRα1#2, HepG2-TRβ1, and HepG2-Neo cells. HepG2-TRα1#1, HepG2-TRα1#2, and HepG2-TRβ1 cells overexpressed the TR protein at approximately 10.2-, 5.2-, and 3.3-fold, respectively, compared to the HepG2-Neo control cell line [16]. Total RNA was isolated and qRT-PCR analysis was carried out (Fig. 1a). Exposure of HepG2-TRα1#1, HepG2-TRα1#2, and HepG2-TRβ1 cells to 1 and 10 nM T3 for 24, 48, and 72 h, respectively, produced a dose-dependent increase in MAT1A expression, from 1.2- to 5.0-fold compared to treatment without T3 at 24 h (Fig. 1a). Furthermore, this T3-mediated induction was highest at 72 h in HepG2-TRα1#1 cells (Fig. 1a) and a higher T3 concentration (100 nM) induced MAT1A expression slightly (data not shown). Additionally, the effect of T3 on MAT1A expression in HepG2-Neo cells was minimal (Fig. 1a). In contrast, the expression of MAT2A was not influenced by treatment with T3 at RNA or protein levels as assessed by qRT-PCR or Western blot (Fig. 1c). These results imply that the effect of T3 on MAT1A gene expression is exerted, at least in part, at the transcription level.
Fig. 1.
Effects of T3 on MAT1A expression levels in HepG2 cell lines. Expression levels of MAT1A in HCC cell lines incubated for various periods in the absence or presence of T3 (1 and 10 nM). a Total RNA was isolated and sequentially analyzed by qRT-PCR. b Cell lysates (100 μg of protein) were then subjected to immunoblot analysis using polyclonal antibodies against MAT1A (Santa Cruz Biotechnology). The position of the 44-kDa MAT1A protein is indicated. The intensities of MAT1A bands in b were quantified and normalized to that of the actin. c MAT2A expression was analyzed by qRT-PCR (above panel) or Western blot (44 kDa). Data are means of values from three independent experiments. Values are shown as fold induction relative to 0 nM T3 at each time point. Differences were analyzed using Student’s t-test, **p < 0.01; *p < 0.05
The effect of TRs on the expression of the MAT1A protein (MAT I/III) was assessed by incubation of HepG2 isogenic or Huh7 cell lines in medium containing various concentrations of T3 at different time points (Fig. 1b). We detected one MAT1A protein species (44 kDa). In HepG2-TRα1#1 cells, MAT1A protein levels were increased by approximately 1.8-, 1.8-, and 3.3-fold after treatment with 10 nM T3 for 24, 48, and 72 h, respectively (Fig. 1b). In addition, an increase in the concentration of T3 to 100 nM enhanced the induced production of MAT1A slightly (data not shown). Similar or lower induction levels were observed for the HepG2-TRα1#2 and HepG2-TRβ1 cell lines (Fig. 1b). Moreover, exposure of control HepG2-Neo cells to 1–10 nM T3 for 24–72 h did not affect MAT1A protein expression significantly (Fig. 1b). One interpretation is that the effect of T3 on MAT1A expression in cells overexpressing TR depended on the level of TR proteins in these cells. However, it is also possible that posttranscriptional modification of MAT1A mRNA enhanced the T3-mediated translational efficiency. Similar results were observed in another HCC cell line, Huh7 (Fig. 1b), which expressed detectable endogenous TR proteins [17]. T3 (10 nM) induced MAT1A protein expression from 1.3- to 1.8-fold at 48 to 72 h (Fig. 1b).
Effects of T3 and cycloheximide on the expression of the MAT1A mRNA
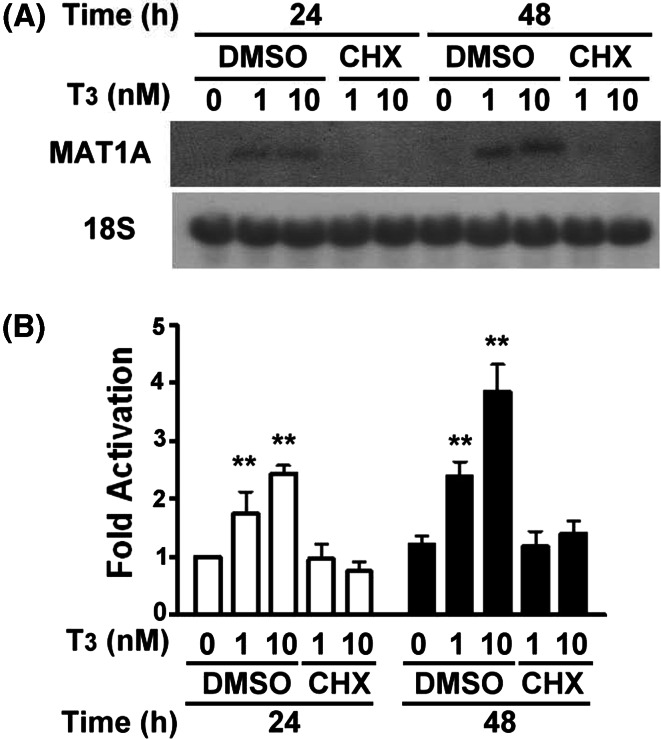
In an effort to further elucidate the regulatory action of T3 on the expression of MAT1A, we investigated the effect of cycloheximide, which is a protein synthesis inhibitor, on the T3-mediated induction of MAT1A expression for 24 and 48 h. Our results demonstrated that the blocking of protein synthesis using cycloheximide affected the transcriptional response of MAT1A to T3 significantly (Fig. 2a). In addition, the data included in Fig. 2a were reconfirmed by the qRT-PCR analysis and are shown in Fig. 2b. This result suggests that TRα1 may regulate MAT1A mRNA production indirectly, via the activation of T3, and that this effect involves synthesis of other new proteins that increase MAT1A transcription.
Fig. 2.
Cycloheximide (CHX) reduced the response of MAT1A to T3 activation. a HepG2-TRα1#1 cells were treated (as described in Fig. 1a) with or without 10 μg/ml CHX. After T3 activation for varying times, total RNA was isolated and subjected to Northern-blot analysis (20 μg per lane). b The data included in a were reconfirmed by the qRT-PCR analysis. Data are mean ± SEM of values from three independent experiments. Values are shown as fold induction relative to 24 or 48 h of 0 nM T3 control treatment. Differences were analyzed using Student’s t-test.**p < 0.01
T3-induced MAT1A expression at the transcriptional level
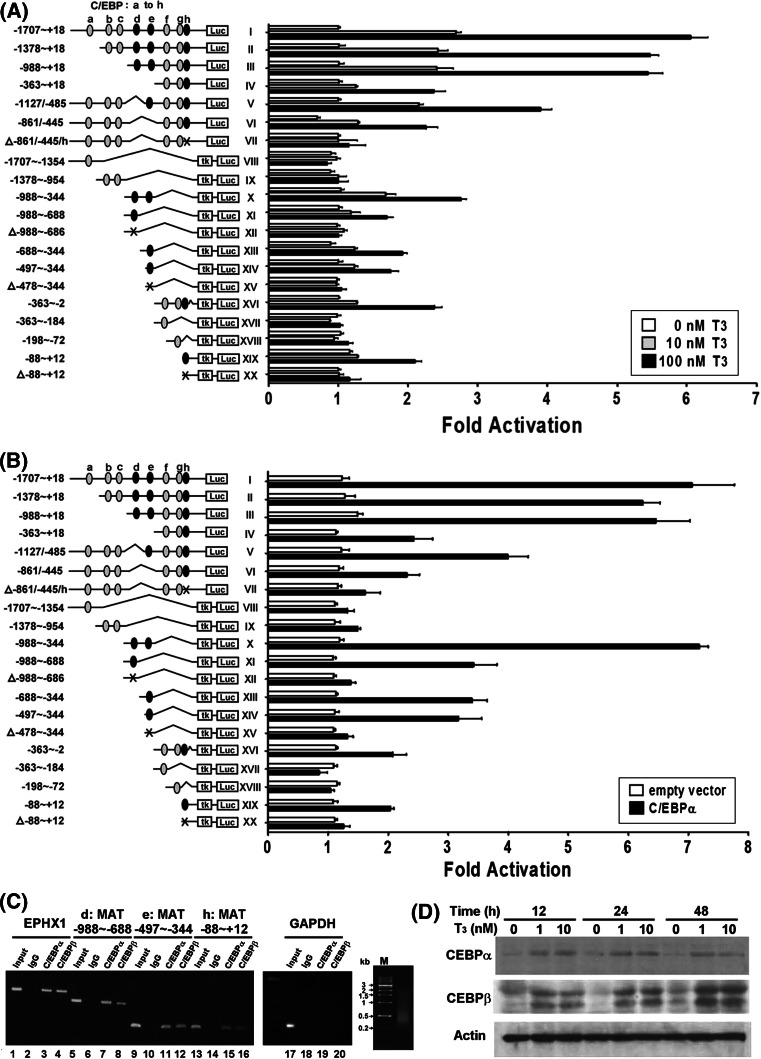
The expression of the MAT1A gene regulated by a region –1,707 to +18 bp upstream to its transcriptional start site (construct I) was induced by about 2.8- and 6.0-fold after treatment with 10 or 100 nM T3, respectively, in HepG2-TRα1 cells. This region contains eight putative C/EBP binding sites (a–h). We generated serially truncated mutants of the MAT1A promoter fragment (based on the –1,707 to +18 construct; Fig. 3a). The a, b, and c C/EBP binding sites were dispensable (construct III vs. constructs I and II). However, deletion of the d and e sites led to a downregulation of the promoter activity by about 50% (construct IV vs. III). The 3′-deleted constructs were inserted upstream to a minimal thymidine kinase promoter to create a luciferase-based reporter plasmid, the pA3TK-luc reporter (constructs VIII through XX). Construct III (–988 to +18 bp) was split into three fragments to generate constructs IV, X and XI. Those fragments led to a 1.7- to 1.9-fold enhancement of promoter activity after 100 nM T3 application. Furthermore, construct X was split into constructs XI, XIII, and XIV, which contain d and e C/EBP binding sites. They all yielded an increase in promoter activity of about 1.8- to 2.0-fold. Promoter activity was diminished after mutagenesis of these two biding sites (d and e) in constructs XII and XV. Similarly, only C/EBP binding site h was crucial for promoter activity in constructs XVI and XIX. To further determine the pivotal MAT1A promoter C/EBP binding sites that are regulated by T3, the activity of the promoters of constructs VIII to XX was assayed after transfection with the C/EBPα expression vector. Our experimental results strongly suggested the involvement of C/EBP in the promoter activity of constructs X, XI, XIII, XIV, XVI and XIX demonstrated the important role of C/EBP in the T3-mediated regulation of MAT1A promoter activity (Fig. 3b). To rule out the possibility of other transcription factors also involved in the MAT1A gene regulation, we have constructed the intact promoter (–1,707/+18) with three deleted/mutated C/EBPα binding sites (constructs V, VI, and VII). As expected, neither T3 nor the C/EBPα expression vector induced MAT1A promoter activity when transfected with construct VII (Fig. 3a, b). C/EBPα can replace T3 stimulation, as show in Fig. 3b. Taken together, our data suggest that the activation of MAT1A promoter activity by T3 is mediated by C/EBP.
Fig. 3.
T3-dependent activation of the MAT1A promoter via TR. HepG2-TRα1#1 cells were transfected with a luciferase reporter plasmid driven by the MAT1A 5′ flanking region (–1,707 to +18 bp) containing a minimal thymidine kinase promoter, together with β-galactosidase (used as a transfection efficiency control). Cells were then incubated for 24 h in the presence or absence of T3 (10–100 nM) before harvesting and determination of luciferase activity. The activity of luciferase was normalized to the activity of β-galactosidase. a Various deletion mutants (II–XX) of the MAT1A 5′ flanking region were also generated and transfected. The mutated three C/EBP binding regions (d, e, h) are shown (constructs: VII, XII, XV, XX) and indicated by symbol (Δ) in the left. Data are mean ± SEM of values from three independent experiments, each performed in triplicate. b Various deletion constructs (V–XX) (1.2 μg/well) obtained from a were individually transfected into HepG2 cells. Activation of reporters was assayed by cotransfection of HepG2 cells with or without the C/EBP expression vector (0.3 μg/well). Promoter activity was calculated relative to the pA3TK-luc control. Data are presented as mean ± SEM from at least three independent experiments, each performed in triplicate. c ChIP assays demonstrated that C/EBPα or β was recruited to the three MAT1A 5′ flanking regions (regions d, e, h). Two sets of primers for EPHX1, used as a positive control for a known C/EBP binding site, and for the negative control (GAPDH) were prepared. ChIP assay results were evaluated by PCR and gel electrophoresis. The range of chromatin fragments was shown. All ChIP assays were repeated at least three times. d Activation of C/EBPα (42 kDa) or β (45 and 40 kDa) by T3 in HepG2-TRα1#1 cell lines analyzed at the protein level
We also employed ChIP assays to examine whether intrinsic C/EBPα or β were recruited to the MAT1A promoter in living cells. As shown in Fig. 3c, a ChIP assay demonstrated that C/EBP was recruited to the C/EBP binding sites (d, –988 to –688 bp; e, –497 to –344 bp; and h, –88 to +12 bp; Fig. 3c, lanes 7, 8; 11, 12; and 15, 16, respectively), whereas control IgG showed only background levels (Fig. 3c, lanes 6, 10, and 14). In contrast, a set of primers designed for the negative control (the human GAPDH gene; Fig. 3c, lanes 18–20) did not yield any detectable bands, whereas the positive control (the human EPHX1 gene, which contains a C/EBP binding site [22]; Fig. 3c, lanes 3 and 4) exhibited a detectable band. The 2% input for the PCR control is shown in lanes 1, 5, 9, 13, and 17 of Fig. 3c. The size of chromatin fragments was also shown in Fig. 3c. The data are consistent with the C/EBPs being recruited to the three sites identified in mutation of the promoter–reporter. We performed immunoblotting to determine whether the C/EBPα or β transcription factors were stimulated by T3/TR and subsequently activated MAT1A expression. Clearly, the levels of the C/EBPα (42 kDa) or β (45 and 40 kDa) proteins increased by approximately twofold or three- to fourfold, respectively, after incubation with 10 nM T3 for 12–48 h (Fig. 3d). Similarly, the levels of the C/EBPα or β mRNA were also induced by T3 (data not shown).
MAT1A expression is C/EBP dependent
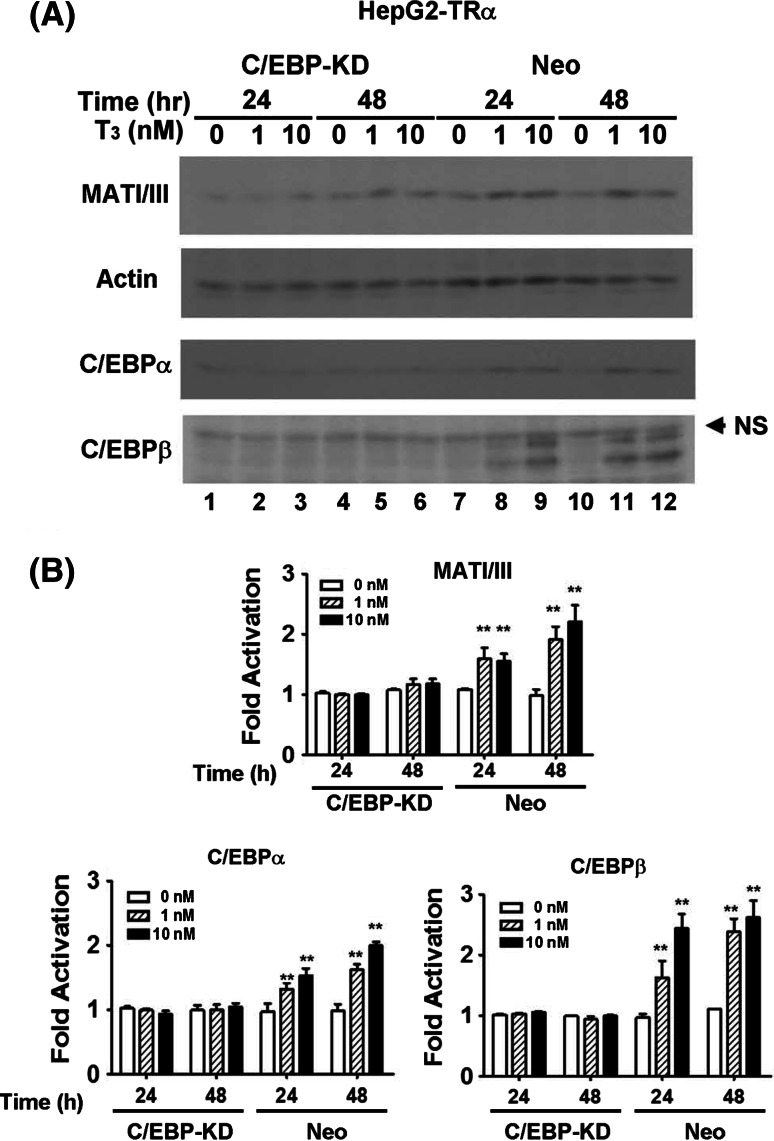
To determine whether MAT1A expression is C/EBP dependent, the expression of the C/EBPα or β proteins was knocked down using RNAi in the HepG2-TRα cell line. The siRNA expression vectors encoding antisense C/EBPα or β sequences and a control plasmid with a scrambled sequence were transfected. Figure 4a depicts the expression of MATI/III proteins in C/EBPα or β knockdown (KD) and control (Neo) cell lines. The data indicate that RNAi repressed the expression of almost all the C/EBPα or β proteins induced by T3 in KD cells (Fig. 4a, lanes 1–6). Subsequently, the activation of MATI/III by T3 was diminished in the KD but not in the Neo cell lines (Fig. 4a). The experimental results were quantified and are shown in Fig. 4b.
Fig. 4.
MAT1A expression is C/EBP dependent. C/EBPα or β protein was knocked down using RNAi in the HepG2-TRα cell line. a The expression levels of MATI/III, C/EBPα, and β proteins in C/EBPα or β knockdown (KD) and control (Neo) cell lines. NS, non-specific band. b The experimental results were quantified. Differences were analyzed using Student’s t-test. **p < 0.01. Significance was assessed by comparison with the 0 nM T3 at 24 h control
Knockdown of MAT1A expression-promoted cell migration
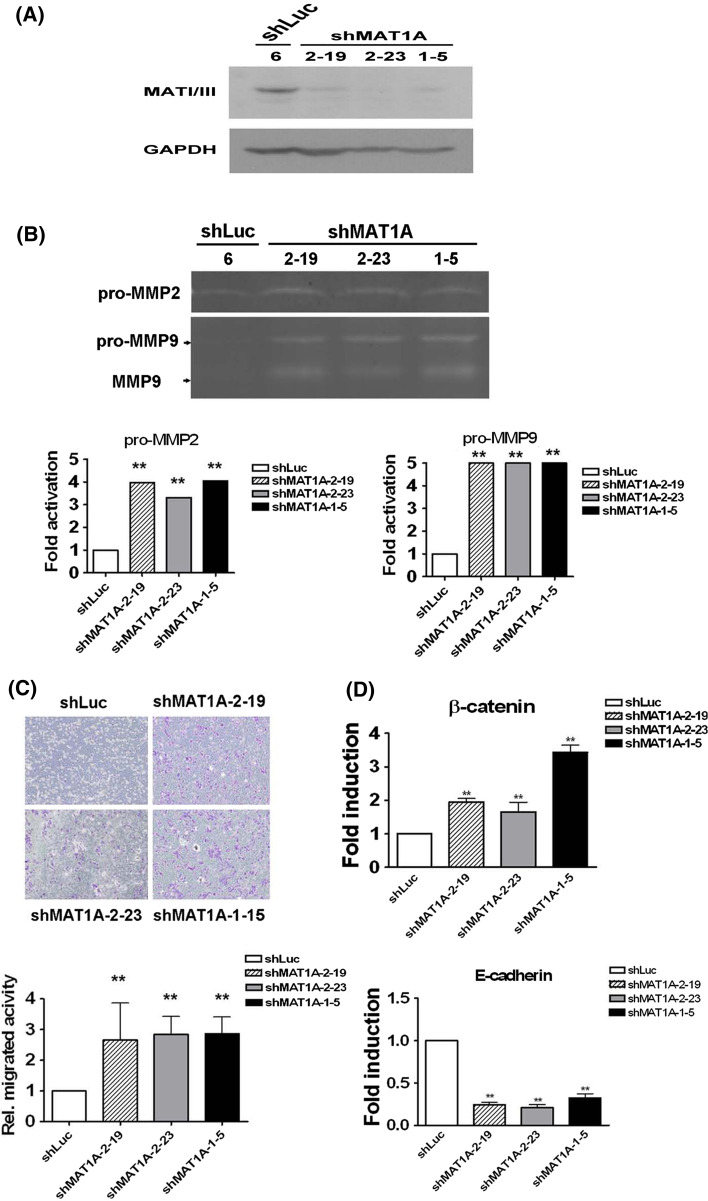
To determine the consequences of the aberrant expression of MAT1A, we performed experiments aimed at reducing or overexpressing the MAT1A protein. MAT1A was knocked down by RNAi in the HepG2-TRα1 cell line. HepG2 cells expressed endogenous MAT1A protein (Fig. 5a). siRNA expression vectors encoding antisense MAT1A sequences and a control plasmid with a scrambled sequence were transfected into each cell line. Figure 5a depicts the expression of MAT1A protein in three knockdown (shMAT1A) and control (shLuc) cell lines. The data indicate that RNAi repressed the expression of MAT1A proteins by 55–96%. MMPs are important zinc- and calcium-dependent proteinases that degrade extracellular matrix components and numerous other proteins [24]. Notably, pro-MMP2 and pro-MMP-9 were detected and were roughly increased by 3.2- to 4.1-fold and approximately fivefold, respectively, compared to the control cells (shLuc) in which luciferase expression had been knocked down (Fig. 5b). The expression of the active form of MMP-9 was also increased by about four- to fivefold in the MAT1A knockdown cell lines. The migration ability of HepG2 MAT1A knockdown cells clearly coincided with the appearance of MMP-2 and MMP-9. Results from the Transwell assay indicated that the migration ability of HepG2 cells increased by approximately 2.7- to 2.95-fold (Fig. 5c). T3 did not affect cell growing after 20 h at 37°C incubation compared with the control [25]. Images of cell density are shown for one control cell line and for three cell lines with reduced expression of MAT1A (Fig. 5c). The expression of the migration-associated genes E-cadherin and β-catenin was reduced and increased, respectively, in the three MAT1A knockdown cell lines (Fig. 5d). These experimental results demonstrated that TR and MAT1A are crucial determinants of migration ability.
Fig. 5.
Knockdown of MAT1A promoted HCC cell migration. a MAT1A protein expression levels in three siRNA knockdown HepG2-TRα1 cell lines (shMAT1A #2–19, #2–23, #1–5) or in luciferase knockdown control (shLuc#6) cells. b HepG2-TRα1 cells (4 × 10⁶) were plated in DMEM medium containing 10% fetal bovine serum. After 24 h incubation and subsequent washing, the medium was replaced with serum-free medium. The medium was collected for MMP detection. The position of the proenzymes and of the active forms of the MMP proteins is shown on the left. The quantification of the data is indicated below. c Migration of three MAT1A knockdown and one control cell lines. The cell lines were added to the upper chamber of Transwell units and incubated for 24 h. The number of cells that transversed the filter to the lower chamber was then determined and expressed as the total number of cells, to provide an index of migratory activity. d qRT-PCR determination of the RNA expression levels of migration-related genes. Data are mean ± SEM of values from three independent experiments. All assays were repeated at least three times. Differences were examined using Student’s t-test. **p < 0.01. Significance was assessed by comparison with the shLuc control
Overexpression of MAT1A inhibited cell migration and invasion
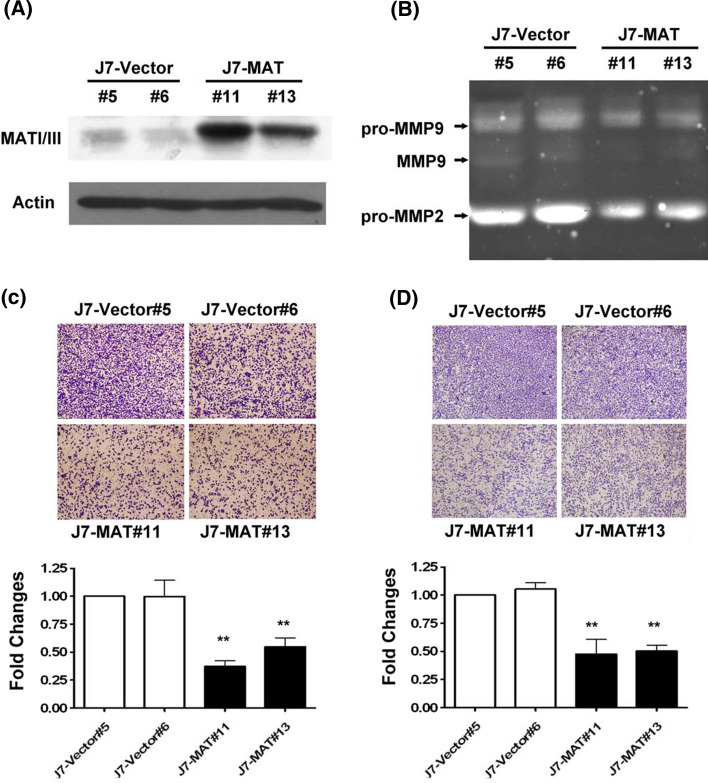
Alternatively, the function of MAT1A was determined by overexpressing (7.1- to 9.2-fold) the protein in J7 cells, which express very low levels of endogenous MAT1A protein (Fig. 6a). Overexpression of MAT1A reduced the expression of pro-MMP-9 and active MMP-9 by about 45 and 95%, respectively, in J7 cells (Fig. 6b). The expression of pro-MMP2 was also reduced by 45–50%. Consequently, the invasive ability of J7 cells overexpressing MAT1A was significantly reduced in (63 and 48% for clones #11 and #13, respectively) compared with the invasive ability detected in control cells (clones #5 and #6) (p < 0.01; Fig. 6c). The migration ability of J7 cell clones #11 and #13 was reduced by 51 and 49%, respectively, as assessed using the Transwell assay (Fig. 6d). Images of cell density were shown for two control clones (#5 and #6) and for two clones overexpressing MAT1A (#11 and #13; Fig. 6c, d).
Fig. 6.
Overexpression of MAT1A repressed HCC cell migration and invasion. a MAT1A protein expression levels in two J7 cell lines overexpressing MAT1A (clones #11 and #13) or in the J7-vector control cell lines (clones #5 and #6). b Zymography assayed for MMP activities. J7 cells and MAT1A overexpressing sublines (4 × 10⁶) were plated in DMEM medium. c Invasion or d migration of two MAT1A overexpression cell lines and two control cell lines. Cells were added to the upper chamber of Transwell units and incubated for 24 h, as described in Fig. 5, and repression of invasion or migration was quantified as fold changes using J7-vector as a control. All assays were repeated at least three times. Differences were examined using Student’s t-test. **p < 0.01. Significance was assessed by comparison with the control vector
MAT1A was downregulated in human HCC
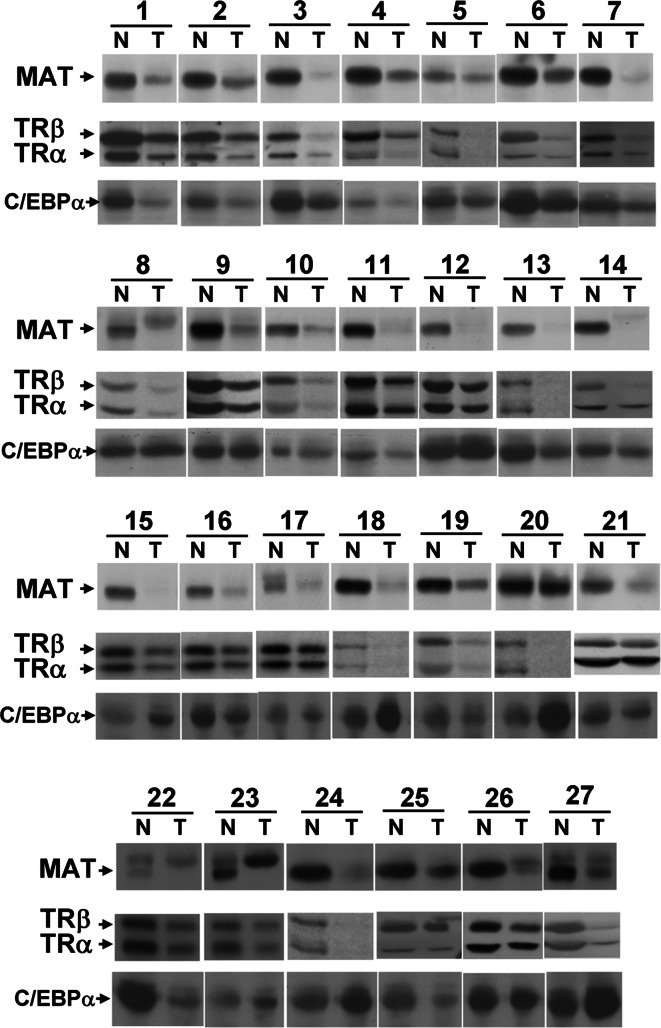
The clinicopathological significance of MAT1A expression in HCC was also investigated. One hundred twenty-three patients with HCC were consecutively selected for this study. An equal amount (100 μg) of protein from each specimen was used for electrophoresis and Western-blot analysis. Equal loading was confirmed by Coomassie Blue staining after SDS-PAGE (data not shown). The MAT1A protein was detected in most of the adjacent normal tissues. The percentage of all paired samples exhibiting downregulation of MAT1A in the cancerous tissues was 78.9% (97/123) compared with the matched noncancerous adjacent tissues. Additionally, the expression of both TRα1 and TRβ1 was decreased in 21.9% (27/123) of the cancerous tissues. Furthermore, among the 27 TR-reduced cases, 51.9% of cases (14/27) exhibited reduced C/EBPα expression. Similarly, Tseng et al. [26] reported that C/EBPα expression was reduced in 60% of HCC samples (50 cases). The expression of C/EBPβ was too low to be detected under our experimental conditions. Therefore, the regulation of MAT1A expression depends on the T3/TR/C/EBP axis only in a subset of HCC patients (14/123 = 11.4%). Several unknown factors are involved. This may explain the fact that the lowest levels of MAT1A expression did not necessarily correlate with the lowest levels of TR expression.
Regression analysis was performed for each pair of the four factors (tumor/normal (T/N) ratios of MAT1A, TRα, TRβ, and C/EBP expression in HCC). The data indicate that the use of the MAT1A T/N ratio as a dependent factor led to a positive association with the TRβ T/N ratio (β = 0.192; 95% CI = 0.008–0.375; p = 0.042). The use of the TRα T/N ratio as a dependent factor yielded a positive association with the TRβ T/N ratio (β = 0.856; 95% CI = 0.591–1.121; p < 0.001). Therefore, TRβ expression regulates MAT1A expression positively in human HCC. Unfortunately, C/EBPα levels did not correlate more closely with MAT1A than with TR. Additionally, multivariate analysis was performed using the MAT1A T/N ratio as a dependent factor. After adjustment for all other confounding variables, the presence of ascites was an independent predictor of MAT1A T/N ratio (β = 0.209; 95% CI = 0.029–0.389; p = 0.024). Ascites was a sign of liver failure. Therefore, these data indicate that MAT1A expression was associated with HCC in advanced liver cirrhosis. The results from 27 representative paired HCC specimens, which are shown in Fig. 7, revealed a decrease in TR expression and a concomitant decrease in MAT1A protein expression in HCC tissues.
Fig. 7.
Reduced expression of MAT1A in human HCC samples. The expression of the MAT1A, C/EBPα and TR proteins was reduced in the 27 representative tumor tissues (T) and was compared with matched noncancerous adjacent tissues (N) using Western-blot analysis. Equal loading was confirmed by Coomassie staining (data not shown). The figure shows a compilation of separate blots that were pieced together
Discussion
To identify the target genes regulated by T3 in a TRα1-overexpressing hepatoma cell line, we performed a cDNA microarray analysis previously. There are no reports on the regulation of MAT1A by T3 and on the significance of this regulation in HCC. This study examined the nature and significance of the molecular mechanism underlying the T3-mediated MAT1A regulation in isogenic HepG2 cell lines. The experimental results indicated that MAT1A regulation by T3 is indirect and is mediated by C/EBP. Further studies demonstrated that T3 upregulated C/EBP expression. Additionally, exogenous transfection of the C/EBPα expression vector into HepG2-TR cells increased MAT1A promoter activity. The promoter activity analysis demonstrated that three important C/EBP sites located at positions (in bp) –988 to –688, –497 to –344, and –88 to +12 upstream of the human MAT1A promoter participated in the T3-induced modulation of human MAT1A gene transcription. Notably, the expression of MAT1A correlated with the expression of TR proteins in HCC cells. Furthermore, T3 had a minimal effect on the abundance of MAT1A mRNA in HepG2-Neo cells. Thus, the effect of T3 on the activation of the MAT1A gene expression seems to be TR-dependent and to be mediated, at least partly, at the mRNA level.
Mice lacking MAT1A develop HCC spontaneously. In other words, MAT1A is downregulated in HCC [27]. In this study, we observed a decrease in TR expression and a concomitant decrease in MAT1A protein expression in 21.7% of the HCC tissue samples analyzed. Zeng et al. [20] reported that the MAT1A promoter contains several consensus binding sites for C/EBP and for hepatocyte-enriched nuclear factor (HNF), which are transcriptional factors that are important for liver-specific gene expression. However, HNF was not stimulated by T3. In summary, the reduced expression of TR during hepatocarcinogenesis accounts for the decreased expression of MAT1A protein mediated by reduced expression of C/EBPα.
Overexpression of MAT1A reduces cell migration, invasion, and/or tumorigenicity of cells derived from cancers of the human liver. Qin et al. [28] reported that cells expressing wild-type steroid receptor coactivator-1 (SRC-1) exhibit strong migration and invasion capabilities and reduced expression of the E-cadherin and β-catenin epithelial markers. Li et al. [29] used transfection of N-cadherin and β-catenin siRNAs into tongue cancer cells to demonstrate the inhibition of invasion capacity and metastasis in vitro, which are probably associated with downregulation of MMP-2 and MMP-9. Similarly to our observation, these authors showed that reduced E-cadherin and increased β-catenin expression is associated with cell invasion properties. However, the role of β-catenin in the process of cell invasion remains controversial. Earlier studies from this laboratory indicate that T3 suppresses the growth of HepG2-TR cells significantly [25]. However, T3 repression was not observed in the HepG2-Neo control cell line, which did not express detectable TR. A previous study showed that the suppressive effect is mediated at least partly by downregulation of Pituitary Tumor-Transforming Gene 1 (PTTG1), as overexpression of PTTG1 is associated with cell proliferation, angiogenesis, and poor prognosis in HCC [17]. In addition, the expression of PTTG1 is very low in normal cells.
Ikeda et al. [30] reported that C/EBPβ plays an important role in the epigenetic regulation of the mature MAT1A hepatic gene. Our data extended on this previous report by indicating that T3-induced C/EBP regulated the expression of MAT1A. In our study, we could not rule out the possibility that C/EBPα binds to other genes that indirectly act on MAT1A. The MAT1A gene may be regulated by other transcription factors or by hormones. For example, C2-ceramide decreases the expression of MAT1A [31]. Glucocorticoid treatment increases human MAT1A expression and promoter activity in a dose- and time-dependent manner [20]. C/EBP is a transcription factor and a tumor suppressor [26]. C/EBPα expression was reduced in 60% of the HCC samples (50 cases). Reduction of the expression of C/EBPα is associated with an advanced tumor stage (p = 0.001) [26]. Consistently, MAT1A protein expression was reduced in 78.86% of the HCC samples (123 cases). C/EBP is a positive stimulator of the MAT1A protein. Overexpression of MAT1A led to a significant reduction in the invasive and migratory abilities of transfected cells. Therefore, MAT1A also plays as a tumor suppressor role. In contrast, the invasive and migratory abilities of transfected cells were greatly enhanced by MAT1A knockdown.
The present study revealed an important role for T3 and C/EBP in the expression of the MAT1A mRNA and protein. The data presented here provides a greater insight into the action of TRα1 in hepatoma cell lines. The elucidation of the T3-mediated regulation of numerous migration- and invasion-related genes was of great importance. In conclusion, this investigation demonstrated that ligand-activated TR indirectly transactivated MAT1A gene expression. In addition, T3 indirectly regulated the expression of the MAT1A gene, thereby reducing cell invasiveness. Although this phenomenon was documented initially in a human tumor cell line, this regulation was also observed in a subset of HCC human samples.
Acknowledgments
This work was supported by grants from Chang-Gung University, Taoyuan, Taiwan (CMRPD 34013, NMRP 140511) and from the National Science Council of the Republic of China (NSC 94-2320-B-182-052).
Conflict of interest statement
The authors declare that there is no conflict of interest that would prejudice the impartiality of this scientific work.
References
- 1.Aranda A, Pascual A. Nuclear hormone receptors and gene expression. Physiol Rev. 2001;81:1269–1304. doi: 10.1152/physrev.2001.81.3.1269. [DOI] [PubMed] [Google Scholar]
- 2.Dayan CM, Panicker V. Novel insights into thyroid hormones from the study of common genetic variation. Nat Rev Endocrinol. 2009;5:211–218. doi: 10.1038/nrendo.2009.19. [DOI] [PubMed] [Google Scholar]
- 3.Oetting A, Yen PM. New insights into thyroid hormone action. Best Pract Res Clin Endocrinol Metab. 2007;21:193–208. doi: 10.1016/j.beem.2007.04.004. [DOI] [PubMed] [Google Scholar]
- 4.Puzianowska-Kuznicka M, Pietrzak M, Turowska O, Nauman A. Thyroid hormones and their receptors in the regulation of cell proliferation. Acta Biochim Pol. 2006;53:641–650. [PubMed] [Google Scholar]
- 5.Huang YH, Tsai MM, Lin KH. Thyroid hormone dependent regulation of target genes and their physiological significance. Chang Gung Med J. 2008;31:325–334. [PubMed] [Google Scholar]
- 6.Hulbert AJ. Thyroid hormones and their effects: a new perspective. Biol Rev Camb Philos Soc. 2000;75:519–631. doi: 10.1017/S146479310000556X. [DOI] [PubMed] [Google Scholar]
- 7.Cheng SY. Multiple mechanisms for regulation of the transcriptional activity of thyroid hormone receptors. Rev Endocr Metab Disord. 2000;1:9–18. doi: 10.1023/A:1010052101214. [DOI] [PubMed] [Google Scholar]
- 8.Yen PM. Physiological and molecular basis of thyroid hormone action. Physiol Rev. 2001;81:1097–1142. doi: 10.1152/physrev.2001.81.3.1097. [DOI] [PubMed] [Google Scholar]
- 9.Ding XF, Anderson CM, Ma H, Hong H, Uht RM, Kushner PJ, Stallcup MR. Nuclear receptor-binding sites of coactivators glucocorticoid receptor interacting protein 1 (GRIP1) and steroid receptor coactivator 1 (SRC-1): multiple motifs with different binding specificities. Mol Endocrinol. 1998;12:302–313. doi: 10.1210/me.12.2.302. [DOI] [PubMed] [Google Scholar]
- 10.Li J, Wang J, Nawaz Z, Liu JM, Qin J, Wong J. Both corepressor proteins SMRT and N-CoR exist in large protein complexes containing HDAC3. EMBO J. 2000;19:4342–4350. doi: 10.1093/emboj/19.16.4342. [DOI] [PMC free article] [PubMed] [Google Scholar]
- 11.Chamba A, Neuberger J, Strain A, Hopkins J, Sheppard MC, Franklyn JA. Expression and function of thyroid hormone receptor variants in normal and chronically diseased human liver. J Clin Endocrinol Metab. 1996;81:360–367. doi: 10.1210/jc.81.1.360. [DOI] [PubMed] [Google Scholar]
- 12.Ara AI, Xia M, Ramani K, Mato JM, Lu SC. S-adenosylmethionine inhibits lipopolysaccharide-induced gene expression via modulation of histone methylation. Hepatology. 2008;47:1655–1666. doi: 10.1002/hep.22231. [DOI] [PMC free article] [PubMed] [Google Scholar]
- 13.Lu SC, Mato JM. S-Adenosylmethionine in cell growth, apoptosis and liver cancer. J Gastroenterol Hepatol. 2008;23(suppl 1):S73–S77. doi: 10.1111/j.1440-1746.2007.05289.x. [DOI] [PMC free article] [PubMed] [Google Scholar]
- 14.Mato JM, Martinez-Chantar ML, Lu SC. Methionine metabolism and liver disease. Annu Rev Nutr. 2008;28:273–293. doi: 10.1146/annurev.nutr.28.061807.155438. [DOI] [PubMed] [Google Scholar]
- 15.Shih CH, Chen SL, Yen CC, Huang YH, Chen CD, Lee YS, Lin KH. Thyroid hormone receptor-dependent transcriptional regulation of fibrinogen and coagulation proteins. Endocrinology. 2004;145:2804–2814. doi: 10.1210/en.2003-1372. [DOI] [PubMed] [Google Scholar]
- 16.Chen RN, Huang YH, Lin YC, Yeh CT, Liang Y, Chen SL, Lin KH. Thyroid hormone promotes cell invasion through activation of furin expression in human hepatoma cell lines. Endocrinology. 2008;149:3817–3831. doi: 10.1210/en.2007-0989. [DOI] [PMC free article] [PubMed] [Google Scholar]
- 17.Chen RN, Huang YH, Yeh CT, Liao CH, Lin KH. Thyroid hormone receptors suppress pituitary tumor transforming gene 1 activity in hepatoma. Cancer Res. 2008;68:1697–1706. doi: 10.1158/0008-5472.CAN-07-5492. [DOI] [PubMed] [Google Scholar]
- 18.Samuels HH, Stanley F, Casanova J. Depletion of l-3, 5, 3′-triiodothyronine and l-thyroxine in euthyroid calf serum for use in cell culture studies of the action of thyroid hormone. Endocrinology. 1979;105:80–85. doi: 10.1210/endo-105-1-80. [DOI] [PubMed] [Google Scholar]
- 19.Tai PJ, Huang YH, Shih CH, Chen RN, Chen CD, Chen WJ, Wang CS, Lin KH. Direct regulation of androgen receptor-associated protein 70 by thyroid hormone and its receptors. Endocrinology. 2007;148:3485–3495. doi: 10.1210/en.2006-1239. [DOI] [PubMed] [Google Scholar]
- 20.Zeng Z, Huang ZZ, Chen C, Yang H, Mao Z, Lu SC. Cloning and functional characterization of the 5′-flanking region of human methionine adenosyltransferase 1A gene. Biochem J. 2000;346(Pt 2):475–482. [PMC free article] [PubMed] [Google Scholar]
- 21.Huang YH, Lee CY, Tai PJ, Yen CC, Liao CY, Chen WJ, Liao CJ, Cheng WL, Chen RN, Wu SM, Wang CS, Lin KH. Indirect regulation of human dehydroepiandrosterone sulfotransferase family 1A member 2 by thyroid hormones. Endocrinology. 2006;147:2481–2489. doi: 10.1210/en.2005-1166. [DOI] [PubMed] [Google Scholar]
- 22.Zhu QS, Qian B, Levy D. Regulation of human microsomal epoxide hydrolase gene (EPHX1) expression by the transcription factor GATA-4. Biochim Biophys Acta. 2004;1676:251–260. doi: 10.1016/j.bbaexp.2004.01.002. [DOI] [PubMed] [Google Scholar]
- 23.Repesh LA. A new in vitro assay for quantitating tumor cell invasion. Invasion Metastasis. 1989;9:192–208. [PubMed] [Google Scholar]
- 24.Sternlicht MD, Werb Z. How matrix metalloproteinases regulate cell behavior. Annu Rev Cell Dev Biol. 2001;17:463–516. doi: 10.1146/annurev.cellbio.17.1.463. [DOI] [PMC free article] [PubMed] [Google Scholar]
- 25.Yen CC, Huang YH, Liao CY, Liao CJ, Cheng WL, Chen WJ, Lin KH. Mediation of the inhibitory effect of thyroid hormone on proliferation of hepatoma cells by transforming growth factor-beta. J Mol Endocrinol. 2006;36:9–21. doi: 10.1677/jme.1.01911. [DOI] [PubMed] [Google Scholar]
- 26.Tseng HH, Hwang YH, Yeh KT, Chang JG, Chen YL, Yu HS. Reduced expression of C/EBP alpha protein in hepatocellular carcinoma is associated with advanced tumor stage and shortened patient survival. J Cancer Res Clin Oncol. 2009;135:241–247. doi: 10.1007/s00432-008-0448-5. [DOI] [PubMed] [Google Scholar]
- 27.Rountree CB, Senadheera S, Mato JM, Crooks GM, Lu SC. Expansion of liver cancer stem cells during aging in methionine adenosyltransferase 1A-deficient mice. Hepatology. 2008;47:1288–1297. doi: 10.1002/hep.22141. [DOI] [PMC free article] [PubMed] [Google Scholar]
- 28.Qin L, Liu Z, Chen H, Xu J. The steroid receptor coactivator-1 regulates twist expression and promotes breast cancer metastasis. Cancer Res. 2009;69:3819–3827. doi: 10.1158/0008-5472.CAN-08-4389. [DOI] [PMC free article] [PubMed] [Google Scholar]
- 29.Li S, Jiao J, Lu Z, Zhang M. An essential role for N-cadherin and beta-catenin for progression in tongue squamous cell carcinoma and their effect on invasion and metastasis of Tca8113 tongue cancer cells. Oncol Rep. 2009;21:1223–1233. doi: 10.3892/or_00000345. [DOI] [PubMed] [Google Scholar]
- 30.Ikeda R, Nishida T, Watanabe F, Shimizu-Saito K, Asahina K, Horikawa S, Teraoka H. Involvement of CCAAT/enhancer binding protein-beta (C/EBPbeta) in epigenetic regulation of mouse methionine adenosyltransferase 1A gene expression. Int J Biochem Cell Biol. 2008;40:1956–1969. doi: 10.1016/j.biocel.2008.02.004. [DOI] [PubMed] [Google Scholar]
- 31.Frago LM, Paneda C, Fabregat I, Varela-Nieto I. Short-chain ceramide regulates hepatic methionine adenosyltransferase expression. J Hepatol. 2001;34:192–201. doi: 10.1016/S0168-8278(00)00022-2. [DOI] [PubMed] [Google Scholar]


