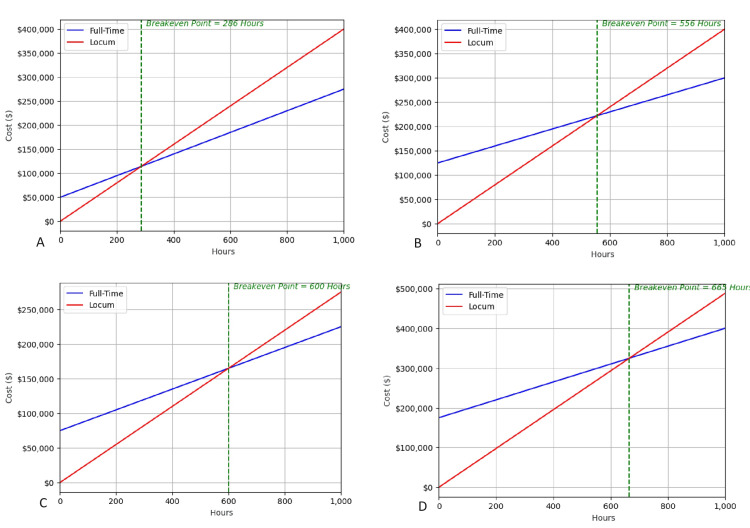
Figure 2. This is a sampling of four scenarios out of the 10,000. We start with a set of initial conditions based on average values to get a breakeven point. The Python program then changes the numbers to see how it affects the breakeven point. We re-run the scenarios 10,000 times, adjusting the values based on a normal distribution each time. This creates a final list of 10,000 breakeven points that are then analyzed. Here, we show a sampling of four simulations to illustrate how the parameters are changed each time. The breakeven point is denoted by the green line.
Simulation A shows the breakeven point when the full-time salary is set at $200/hr, onboarding is set at $50,000, and locum tenens salary is set at $400/hr.
Simulation B shows the breakeven point when the full-time salary is set at $150/hr, onboarding is set at $125,000, and locum tenens salary is set at $400/hr.
Simulation C shows the breakeven point when the full-time salary is set at $174/hr, onboarding is set at $75,000, and locum tenens salary is set at $350/hr.
Simulation D shows the breakeven point when the full-time salary is set at $165/hr, onboarding is set at $175,000, and locum tenens salary is set at $433/hr.

