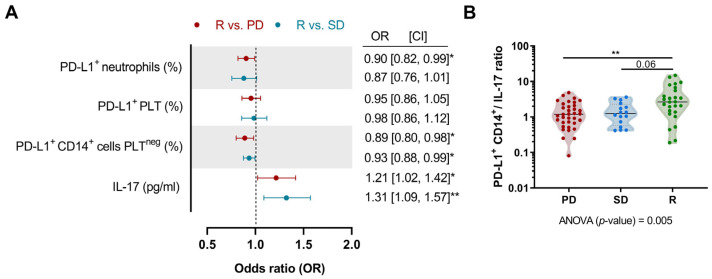
Figure 6.
Multinomial logistic regression analysis and pretreatment PD-L1+ CD14+ cells/IL-17 ratio. (A) The reference group is R patients (PD vs. R in red; SD vs. R in blue). Dots represent the odds ratio and the error bars represent the 95% CI. (B) Ratio between the percentage of PD-L1+ CD14+ cells and plasma IL-17 concentration before starting anti-PD-(L)1 therapy. The Kruskal–Wallis test with Dunn’s correction was used to compare the baseline ratio between studied groups. p-values are shown in graphs (*) p < 0.05; (**) p < 0.01. CI, confidence interval.

