

Summary
While many novel gene-metabolite and gene-protein associations have been identified using high throughput biochemical profiling, systematic studies that leverage human genetics to illuminate causal relationships between circulating proteins and metabolites are lacking. Here, we performed protein-metabolite association studies in 3,626 plasma samples from three human cohorts. We detected 171,800 significant protein-metabolite pairwise correlations between 1,265 proteins and 365 metabolites, including established relationships in metabolic and signaling pathways such as the protein thyroxine binding globulin and the metabolite thyroxine – as well as thousands of new findings. In Mendelian Randomization (MR) analyses, we identified putative causal protein-to-metabolite associations. We experimentally validated top MR associations in proof-of-concept plasma metabolomics studies in three murine knockout strains of key protein regulators. These analyses identified previously unrecognized associations between bioactive proteins and metabolites in human plasma. We provide publicly available data to be leveraged for studies in human metabolism and disease.
eTOC Blurb
Benson et al. integrate proteomic, metabolomic, and genomic data in 3,626 individuals from three human cohorts to identify putative causal relationships amongst 1,302 circulating proteins and 365 metabolites in human plasma. Top protein-to-metabolite associations were experimentally validated in plasma metabolomics studies in three murine knockout strains of key protein regulators.
Graphical Abstract

Introduction
The integration of metabolomic and proteomic profiling data from large-scale population studies offers the opportunity to connect circulating proteins and metabolites as pathway partners in human physiology. Mass spectrometry-based metabolomics approaches measure low-molecular weight lipids, organic acids, nucleic acids, and other key chemical mediators of central metabolic and signaling pathways. Affinity-based proteomics techniques measure many of the secreted enzymes, transporters, cytokines, peptide hormones, and other proteins that catalyze and regulate these pathways. For example, small molecule profiling techniques can measure thyroxine, while proteomics can measure the transporter thyroxine binding globulin that regulates circulating levels of this metabolite in the thyroid hormone signaling pathway. Similarly, the amino acids aspartate and glutamate, as well as the enzyme aspartate transaminase that catalyzes the interconversion of these two compounds can be assayed by these complementary techniques in the same biological sample. Combining metabolomics and proteomics data may provide insights into new transporter-ligand, enzyme-substrate, and other protein-metabolite pairs that can be used for pathway discovery. However, the systematic integration of metabolomics and proteomics data from large-scale population studies to identify these biological relationships is still in its nascent stages.
Genome-wide association studies (GWAS) of plasma metabolite1–12 and protein levels13–28 in large-scale population studies have been increasingly leveraged to identify causal determinants of circulating factors in human plasma. For example, plasma proline levels are strongly associated with genetic variants in the PRODH locus that encodes proline dehydrogenase, as well as variants in other enzymes that are important in the catabolism of this metabolite4,5. Similarly, GWAS of thrombin protein levels and other blood clotting factors have confirmed pathway relationships within the coagulation cascade27,29. While novel gene-metabolite or gene-protein associations have been identified and then validated in experimental model systems5,15,30–32, systematic studies that leverage human genetics to illuminate novel protein-metabolite associations are lacking.
To begin to determine causal associations between circulating proteins and metabolites, we analyzed mass spectrometry-based metabolomics and aptamer-based proteomics profiling of plasma samples from 3,626 individuals in three cohorts: the Jackson Heart Study (JHS), the Multi-Ethnic Study of Atherosclerosis (MESA), and the Health, Risk Factors, Exercise Training and Genetics (HERITAGE) Family study. In total, we studied the relationships between circulating levels of 1,302 proteins and 365 metabolites measured in the same banked plasma samples. Toward this goal, we first examined correlation data between every pairwise combination of each protein and metabolite and then performed enrichment analyses to detect individual proteins that are significantly associated with specific classes of metabolites. We leveraged the genetic data in each study to perform Mendelian Randomization (MR) analyses to identify putative causal relationships of circulating proteins with metabolite plasma levels. Top protein-to-metabolite MR associations were experimentally validated in proof-of-concept plasma metabolomics studies in three murine knockout models. Further, we provide all protein-metabolite association results as a publicly available dataset for pathway discovery in human metabolism and disease.
Results
We studied the relationships between circulating levels of 1,302 proteins and 365 metabolites measured in fasting plasma samples from participants of the Jackson Heart Study (JHS, n=1,985), the Multi-Ethnic Study of Atherosclerosis (MESA, n=983), and the Health, Risk Factors, Exercise Training and Genetics (HERITAGE) Family study (n=658). Clinical characteristics of the study populations are detailed in Supplementary Table 1a. A list of the studied proteins and metabolites are provided in Supplemental Tables 2 and 3, respectively. An overview of the study design is provided in Figure 1, which included 1) correlation analyses between every pairwise combination of each protein and metabolite, 2) enrichment analyses to detect proteins that are highly associated with specific classes of metabolites, 3) Mendelian Randomization (MR) analyses to identify putative causal relationships of circulating proteins and metabolite plasma levels, and 4) experimental validation of a subset of the top protein-to-metabolite MR associations in proof of concept plasma metabolomics studies in three murine knockout models.
Figure 1. The integration of human plasma proteomic, metabolomic, and genomic profiling data for pathway discovery.
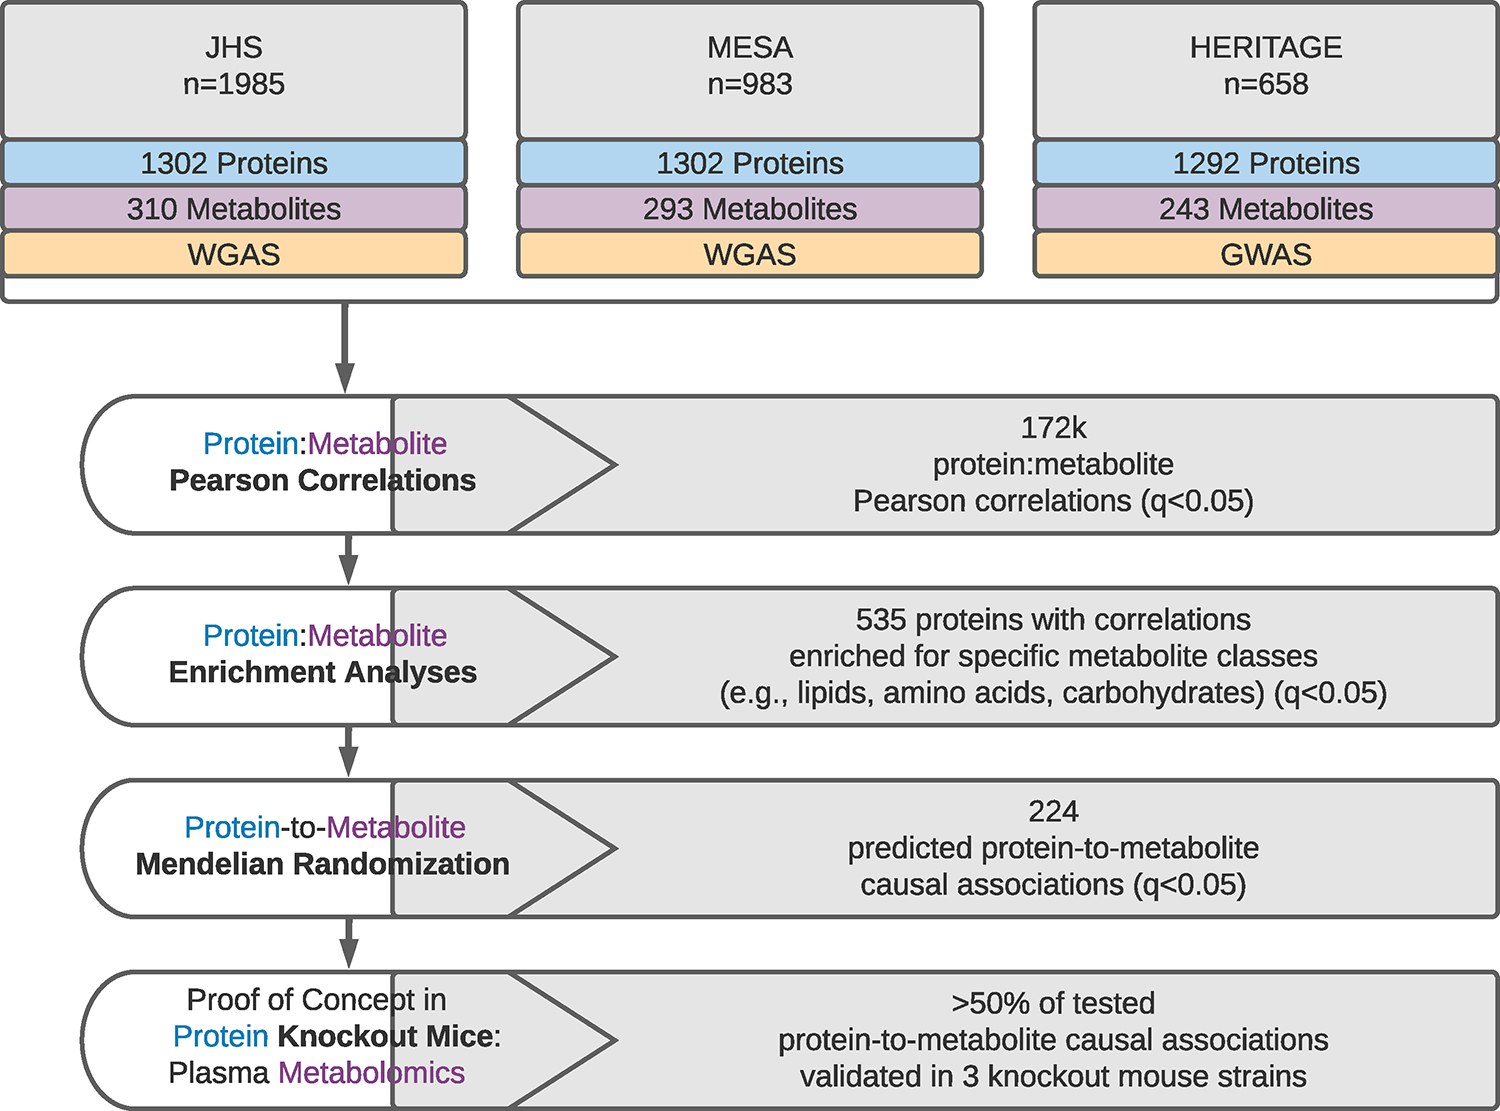
Flow diagram detailing the experimental pipeline and main results from the integration of plasma proteomic, metabolomic, and genomic profiling datasets in the Jackson Heart Study (JHS), Multi-Ethnic Study of Atherosclerosis (MESA), and Health, Risk Factors, Exercise Training and Genetics Study (HERITAGE Family study). WGAS = whole genome association study, GWAS = genome wide association study.
Protein-metabolite correlations in human plasma
Pearson correlation coefficients were calculated for every pairwise protein-metabolite combination within the JHS, MESA, and HERITAGE Family study using age- and sex-adjusted, log-normalized, and standardized protein and metabolite levels. We identified a set of protein and metabolite pairs in each cohort that were significantly correlated with an FDR-adjusted q-value ≤ 0.05 (Figure 2a). Meta-analyses of these correlations across the three studies identified 171,800 significant protein-metabolite correlations (q-value ≤ 0.05) (Supplemental Table 4). Ninety-seven percent of these correlations remained significant when further adjusted for body mass index (BMI), and 87% remained significant when additionally adjusted for estimated glomerular filtration rate (eGFR) to account for potential effects of kidney function on the circulating proteins in multivariable adjusted (MVA) analyses (Figure 2b). Among the 1,614 participants in JHS with available medication histories, 76% of protein-metabolite correlations remained significant when further adjusted for use of antihypertensive (n=992), antidiabetic (n=256), and statin (n=220) medications (Supplemental Figure 1). The magnitude and directionality of correlation coefficients were consistent across the individual studies (Figure 2c).
Figure 2. Protein-metabolite correlations in human plasma.
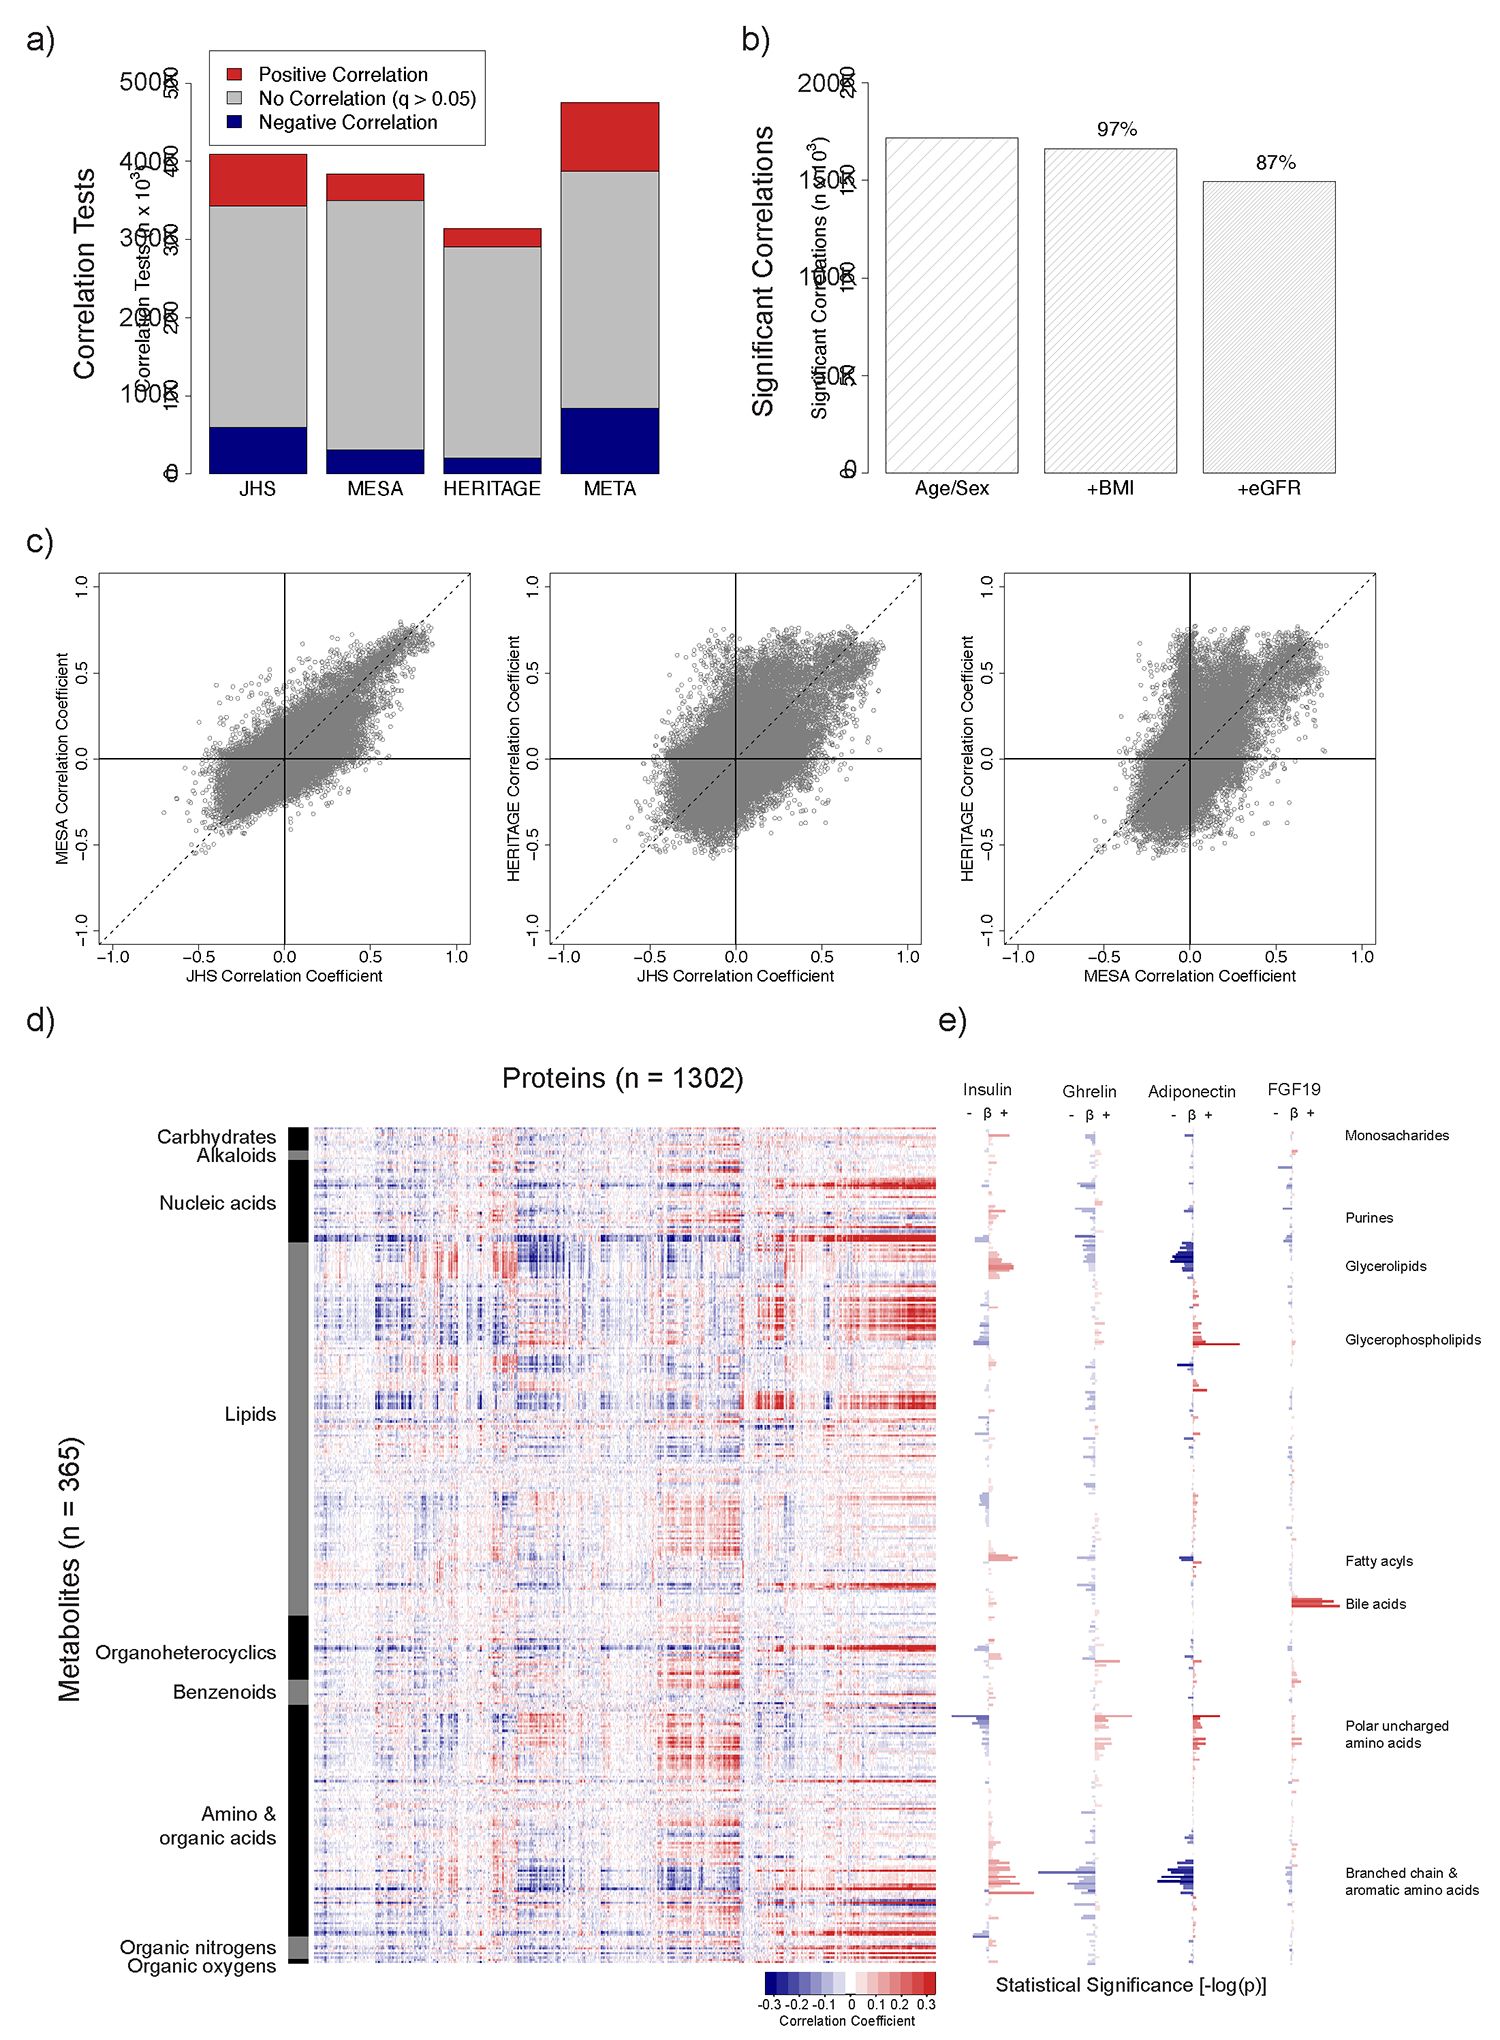
Pearson correlation coefficients were calculated for every pairwise protein-metabolite combination within the JHS, MESA, and HERITAGE Family study using age- and sex-adjusted, log-normalized, and standardized protein and metabolite levels. (A) A subset of proteins and metabolites were positively (red) or negatively (blue) correlated with an FDR-adjusted q-value ≤ 0.05 in each study, and in a meta-analysis of the three studies. (B) Ninety-seven percent of the meta-analyzed age- and sex-adjusted protein-metabolite correlations remained significant with an FDR-adjusted q-value ≤0.05 when further adjusted for BMI, and 87% remained significant when additionally adjusted for eGFR. (C) The magnitude and directionality of the meta-analyzed age- and sex-adjusted protein-metabolite correlations were consistent across studies. (D) Visualization of the protein-metabolite correlations using a heat map demonstrated distinct patterns of associations between individual proteins and members of specific classes of metabolites. Individual metabolites were ordered according to RefMet class along the y-axis, and proteins were allowed to order using a hierarchical cluster analysis along the x-axis. The magnitude and directionality of the correlation coefficient for each protein-metabolite association is depicted by color, as indicated in the legend. (E) The statistical significance (−log(p-value)) of the correlation between each metabolite and four representative protein hormones is shown.
As anticipated, several of the most significant correlations reflected well-characterized protein-metabolite biological relationships. These included associations between plasma binding proteins such as thyroxine binding globulin and thyroxine (correlation coefficient = 0.51, q-value ≤ 1.0 × 10−300), plasma transporters such as apolipoprotein E (APOE) and lipids including diacylglycerol C36:3 (correlation coefficient = 0.51, q-value ≤ 1.0 × 10−300), and plasma enzymes such as aspartate transaminase (AST) and its canonical substrate aspartate (correlation coefficient = −0.07, q-value = 8.4 × 10⁻⁵) and product glutamate (correlation coefficient = 0.23, q-value = 5.3 × 10−48). Visualization of the tens of thousands of additional, previously unexplored protein-metabolite correlations using a heat map demonstrated distinct patterns of correlations between individual proteins and members of specific metabolite classes (Figure 2d). For example, the protein hormone insulin demonstrated positive correlations with metabolites within the carbohydrate, glycerolipid, acyl carnitine, branched chain amino acid, and aromatic amino acid classes and inverse correlations with metabolites within the lysophosphatidylethanolamine (LPE), lysophosphatidylcholine (LPC), and polar uncharged amino acid classes (Figure 2e)(Supplemental Table 4). The hormones adiponectin and ghrelin similarly demonstrated strong metabolite correlations within lipid and amino acid class lines. Finally, the hormone fibroblast growth factor 19 (FGF19), a regulator of bile acid synthesis33, demonstrated marked positive correlations within the bile acid metabolite class. While the clustering of these correlations within specific metabolite classes was consistent with known functions of each of these central metabolic hormones, these analyses also provided novel details regarding interactions with specific subclasses of metabolite species for each protein, particularly in the context of human physiology. For example, insulin demonstrated strong positive correlations with several saturated fatty acids (e.g., butyric acid, q-value = 5.6 × 10⁻³) and quinolone carboxylic acids (e.g., xanthurenic acid, q-value = 7.3 × 10⁻¹⁰), as well as inverse correlations with unsaturated fatty acids (e.g., linoleic acid, q-value = 3.7 × 10⁻³), amino fatty acids (e.g., 2-aminoisobutyric acid, q-value = 4.9 × 10⁻⁸), N-acyl amines (e.g., N-oleoyl-glycine, q-value = 8.1 × 10⁻⁸) and dicarboxylic acids (e.g., malonic acid, q-value = 2.9 × 10⁻³).
Protein correlations are enriched for specific classes of metabolites in human plasma
To characterize protein-metabolite correlations more systematically, we investigated whether ranked metabolite correlations for each protein were significantly enriched for specific sets of metabolite classes, analogous to Gene Set Enrichment Analyses (GSEA)34,35. As an initial proof of concept, we confirmed that the most significantly correlated metabolites with plasma levels of APOE protein were members of the lipid metabolite class, consistent with the well-established role of APOE in lipid transport (Figure 3a). To quantitate this overrepresentation of lipid metabolites among the strongest correlations with APOE, a plot of the running sum statistic for these lipids in the ranked correlation data was used to generate an enrichment score (ES)(Figure 3b). The enrichment score could be assessed for statistical significance from the null hypothesis of no enrichment of correlations for lipid metabolites for APOE using a permutation test as detailed in Methods. This analysis was then repeated for each of the 1,302 measured plasma proteins in the dataset.
Figure 3. Protein correlations are significantly enriched for specific metabolite classes.
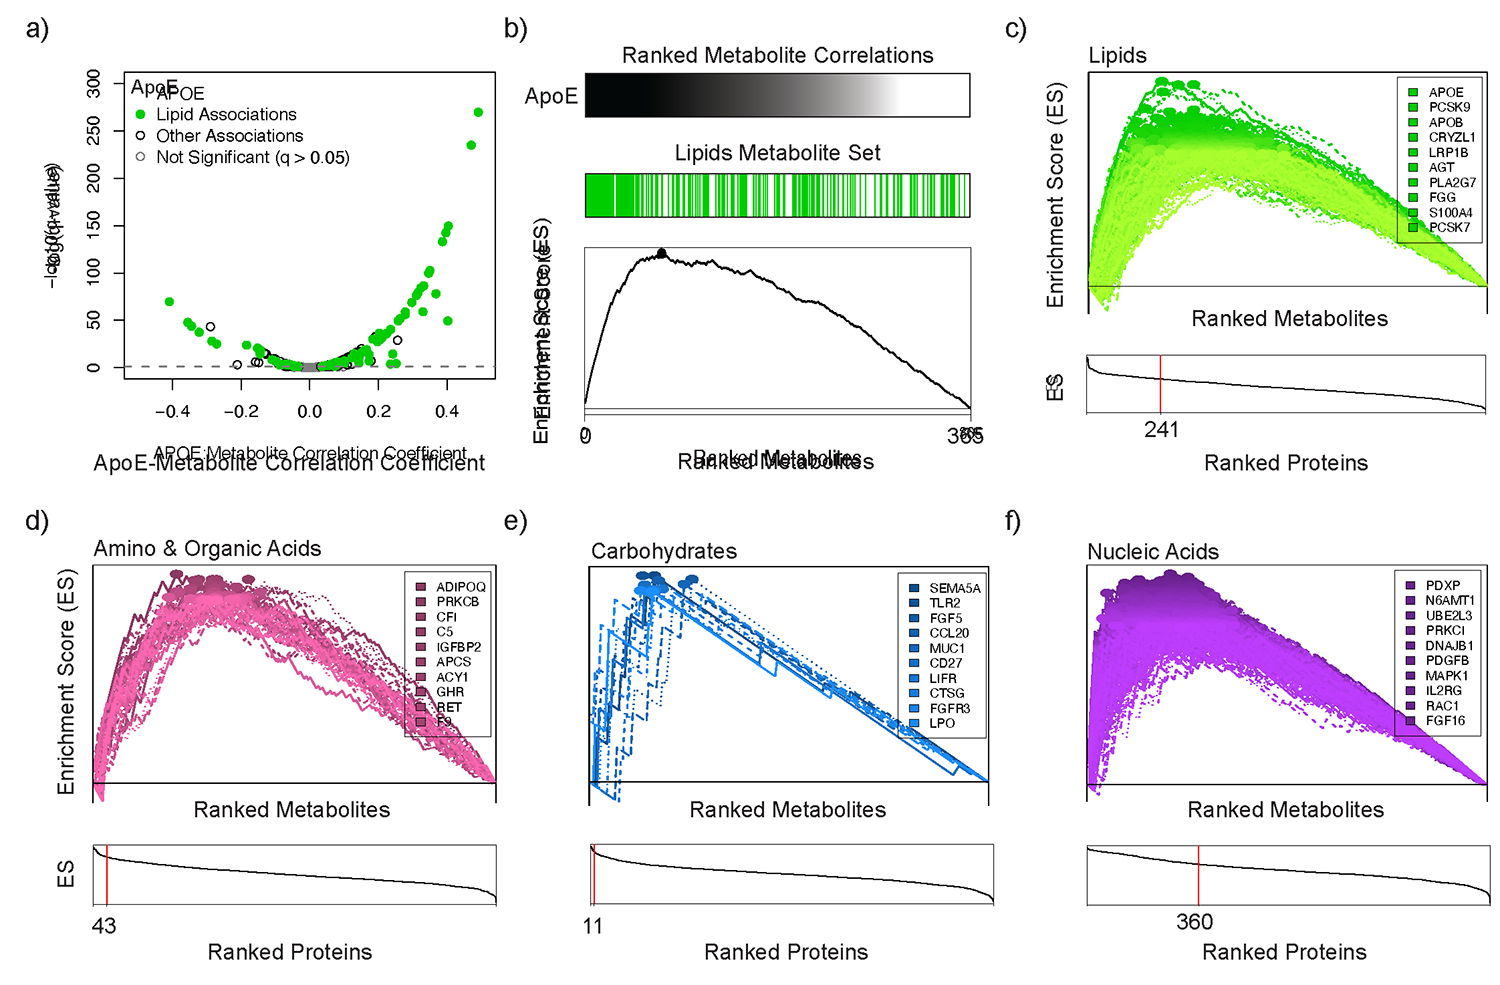
(A) A volcano plot demonstrates that the most significantly correlated metabolites with plasma levels of APOE protein were members of the lipid metabolite class. (B) To evaluate this enrichment for lipids more quantitatively, an enrichment score (ES) was computed and visualized as the maximum point (marked with ●) of a running sum statistic that increases proportionally with each lipid and decreases with non-lipids along the ranked list of metabolite correlations with plasma levels of APOE. (C) 241 proteins were significantly enriched for correlations with plasma lipids (FDR-adjusted q-value ≤ 0.05). In the top panel, the ES tracings are shown for each individual protein, and the ten proteins with the highest enrichment scores are listed. In the bottom panel, proteins are ordered in descending order of calculated enrichment scores (x-axis), and the number of proteins significantly enriched for correlations with lipids (FDR-adjusted q-value ≤ 0.05) is indicated with the vertical red line. Similar enrichment analyses are shown for Amino and Organic Acids (D), Carbohydrates (E), and Nucleic Acids (F). The complete enrichment analysis dataset is available in Supplemental Table 5.
As shown in Figure 3c, we identified 241 proteins that were significantly enriched for correlations with plasma lipids (q-value ≤ 0.05; Supplemental Table 5). These included proteins with well-established roles in lipid metabolism such as proprotein convertase subtilisin/kexin type 9, apolipoprotein B, low-density lipoprotein receptor-related protein 1B, and angiopoietin-like 4. Many novel protein-lipid findings included associations with several members of the cathepsin proteases (CTSA, CTSB, and CTSF), serpin peptidase inhibitors (AGT, SERPING1, and SERPIND1), and secreted glycoproteins (NID1, NID2, LAMA1, and GPC6) (Supplemental Table 5). Further, the broad survey of proteins in this analysis identified additional protein pathway partners that demonstrated enriched correlations for lipid metabolites. A notable example of this included the identification of a pathway node centered on the scavenger receptor CD36, which functions as a high-affinity receptor for long chain fatty acids and other ligands in rodent models and has been implicated in fat metabolism traits in humans36–40. The CD36 receptor was not only itself highly enriched for correlations with plasma lipid metabolites (q-value = 1.1 × 10⁻³), but two well-established regulatory protein ligands of the receptor, thrombospondin 141 and CD5 Molecule Like42, were also highly enriched for correlations with plasma lipids (THBS1, q-value = 8.3 × 10⁻³; CD5L, q-value = 4.5 × 10⁻³), highlighting the potential role for this receptor and associated ligands in human lipid metabolism.
We next expanded our analysis to identify proteins with correlations that were enriched for additional major classes of metabolites (Figure 3d–f, Supplemental Table 5). Interestingly, we identified 360 proteins with correlations that were significantly enriched for circulating nucleic acids. Among these were proteins with well-established roles in nucleotide metabolism, such as nucleoside diphosphate kinase B, nucleoside diphosphate kinase A, ectonucleoside triphosphate diphosphohydrolase 1, thymidine kinase 1, and adenylate kinase isoenzyme 1 (Supplemental Table 5). These nucleoside kinases maintain the balance between nucleoside mono-, di-, and triphosphates (e.g., AMP, ADP, and ATP) and several are known to circulate in human plasma with ~1 nM concentrations43. While they have been demonstrated to be secreted and to regulate extracellular ATP synthesis in model systems44–46, their role in human plasma has not previously been fully elucidated.
We also identified 43 proteins with correlations that were significantly enriched for amino and organic acids. Several of these included proteins with well-established roles in the regulation of protein metabolism such as growth hormone receptor, insulin-like growth factor binding protein 2, and adiponectin (Supplemental Table 5). Interestingly, one of the top proteins enriched for correlations with amino and organic acids was the enzyme aminoacylase-1 (ACY1, q-value = 2.9 × 10⁻³) which can hydrolyze N-acetyl-amino acids to free amino acids in isolated human and murine plasma47. These enrichment data suggest that ACY1 may play a broader role in human plasma amino acid homeostasis, extending prior observations19,48–51.
Mendelian Randomization analyses identify causal protein-to-metabolite correlations in human plasma.
Pearson correlations do not provide information in regard to the causality or directionality of the relationship between protein and metabolite. To identify potential causal relationships of circulating proteins on metabolite levels in human plasma, we next performed Mendelian Randomization (MR) analyses. This approach leveraged whole genome- or genome-wide association studies (WGAS, GWAS) of each plasma protein and metabolite level in JHS, MESA, and HERITAGE Family study participants. Genetic variants within 1 mega-base (Mb) of the coding gene for each protein (“cis” variants) that were independent (linkage disequilibrium r2 ≤ 0.001) and strongly associated with circulating levels of the protein (Bonferroni-adjusted p-value ≤ 0.05) were used as instrumental variables to assess whether plasma levels of each protein (exposure) had a causal effect on correlated plasma metabolite levels (outcome) using the Wald method with a single genetic variant and the inverse-variance weighted (IVW) method when multiple genetic variants were available52–57. Several methods, including the limited information maximum likelihood (LIML)58, as well as the median59, median-weighted60, and MR-Egger61 robust methods when instruments contained more than two genetic variants, were used to assess the sensitivity of these analyses, as described in Methods and included in Supplemental Table 6.
We found that 547 of the 1302 proteins had cis variants that could be used as instrumental variables in MR analyses (Figure 4a) (Supplemental Tables 7–9). Proteins with available cis instruments spanned the genome (Figure 4b), and the majority of instruments were located in very close proximity to the transcriptional start site (TSS) of the protein coding gene (Figure 4c). We restricted our analyses to include only instruments in cis to the coding gene for each protein so that the effect of these instruments on the metabolite was likely to run through the protein exposure, rather than through an alternative, potentially pleiotropic biochemical pathway62–64.
Figure 4. Mendelian Randomization analyses identify putative causal protein-to-metabolite associations in humans.
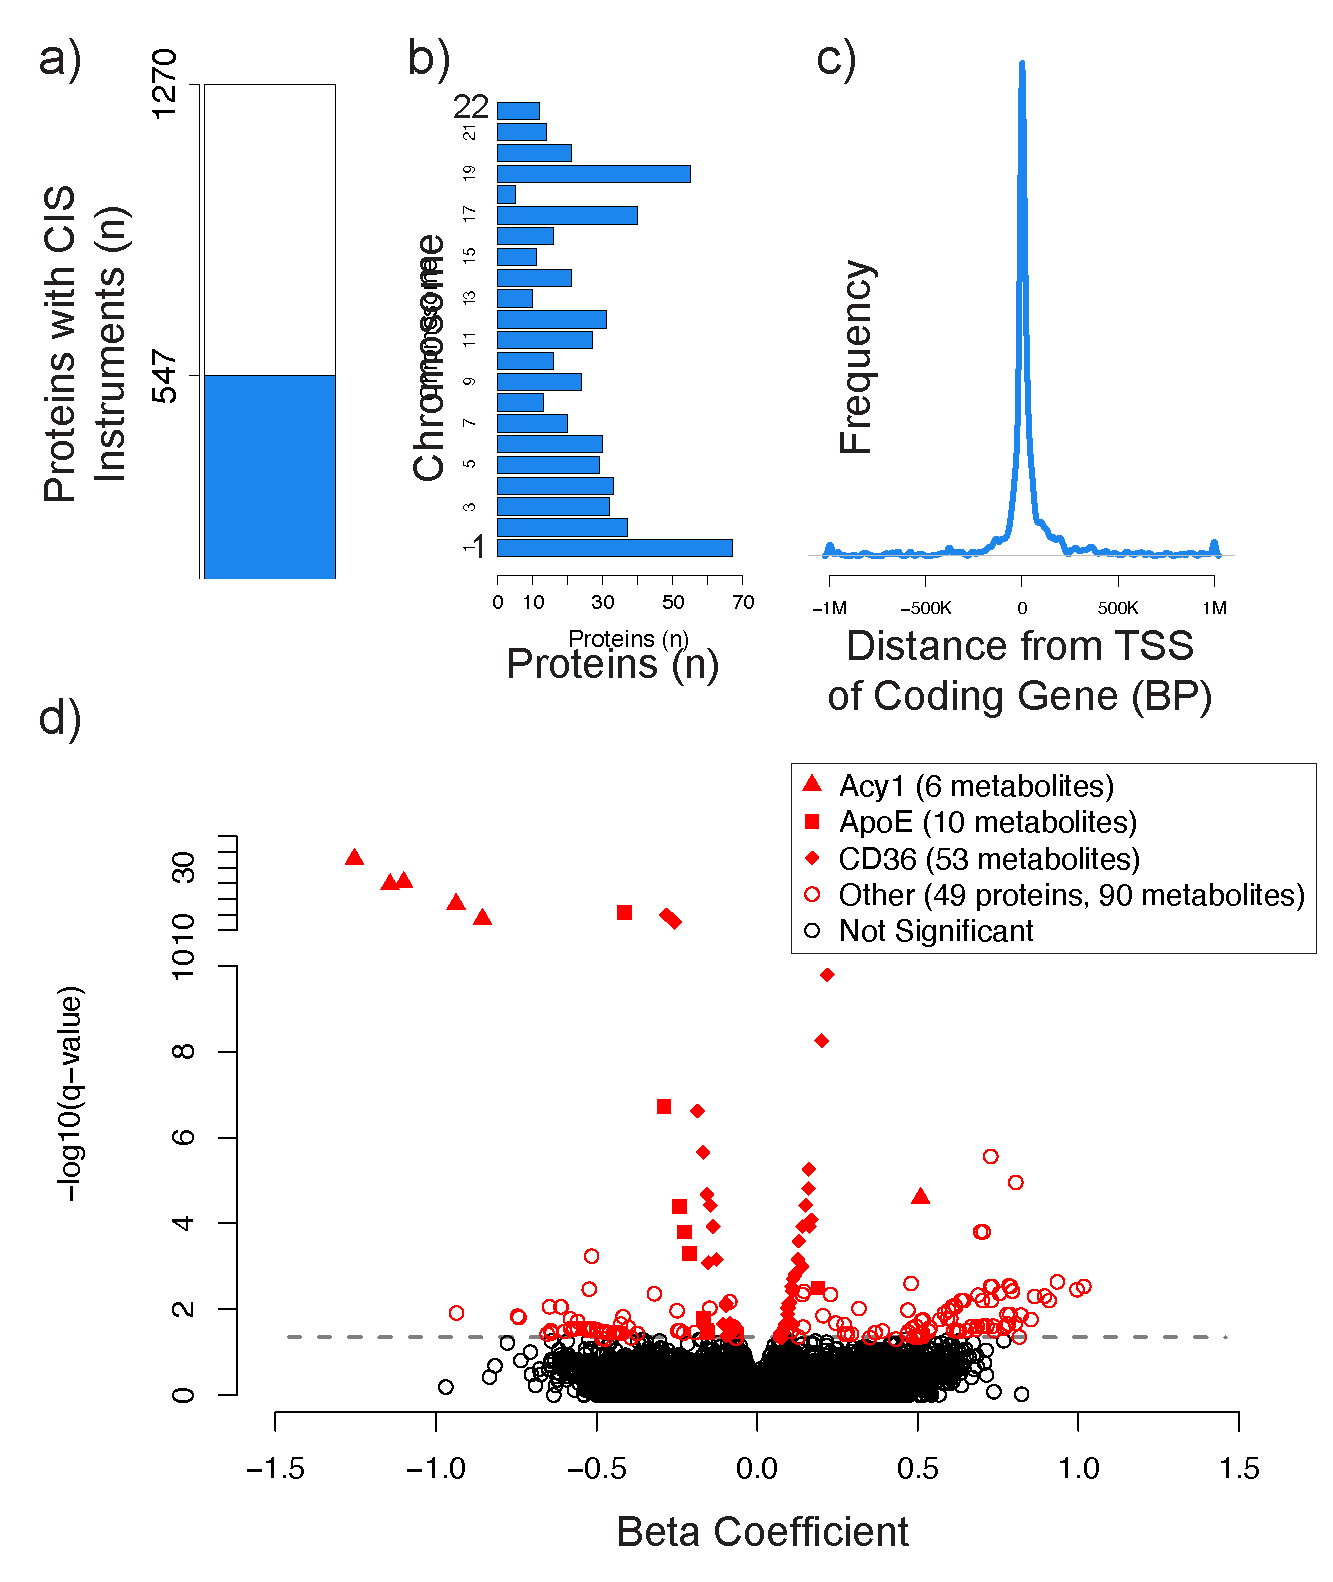
Proteins with at least one pQTL in cis (located within 1Mb) of the protein coding gene that could be used as an instrumental variable (IV) in Mendelian Randomization (MR) analyses are depicted in blue (a). The proteins with available cis instruments were distributed evenly across the genome (b). pQTLs used in IVs were generally located near the transcriptional start site (TSS) of the protein coding gene (c). A volcano plot depicts the 224 significant MR associations between 52 proteins and 146 metabolites with an FDR-adjusted q-value ≤ 0.05 (d). The three proteins with the most significant MR metabolite associations are depicted by distinct shapes described in the figure legend.
In total, we identified 224 putative protein-to-metabolite causal associations between 52 proteins and 146 metabolites that were highly significant (q-value ≤ 0.05) (Figure 4d, Supplemental Table 6). 162 of these associations were identified using the Wald method with a single genetic variant, and 62 of these associations were identified using the IVW method when multiple genetic variants were available. Notably, 58/62 (94%) of the associations that had multiple available genetic variants had concordant weighted median estimates with p ≤ 0.05, suggesting that a majority of the genetic variants used in these IVW analyses were valid instruments. Similarly, 214/224 (96%) of the associations had concordant LIML estimates with p ≤ 0.05, suggesting against weak instrument bias. Finally, although potentially under-powered (but consistent with our use of only genetic instruments in cis to the coding gene for the protein exposure), 61/62 (98%) of the associations that had multiple available genetic variants had a non-significant MR-Egger intercept test with p ≥ 0.05, identifying no obvious evidence of horizontal pleiotropy. A complete list of all protein-to-metabolite MR associations that reached nominal levels of significance (p-value ≤ 0.05) is provided in Supplemental Table 6.
Among the top MR findings were several examples of the well-established causal role that APOE protein plays in modulating plasma levels of lipids and fat-soluble vitamins. These included MR associations between APOE protein and several glycerophospholipids (e.g., C38:5 PE plasmalogen; IVW beta −0.29, q-value 1.9×10⁻⁷, LIML q-value 1.0×10⁻⁶), phosphosphingolipids, and the lipid-soluble vitamin retinol (Supplemental Table 6).
These analyses also detected strong putative causal associations for several other proteins that were identified to have correlations with lipids, amino and organic acids, and nucleic acids in the enrichment analyses above. For example, we detected strong MR associations between the CD36 scavenger receptor and numerous lipid species not previously associated with this protein, including glycerophospholipids (e.g., C38:7 PE plasmalogen; IVW beta −0.28, q-value 1.2×10⁻¹⁵, LIML q-value 9.6×10⁻¹⁵), acyl carnitines, sphingomyelins, ceramides, and steroids (Figure 4d) (Supplemental Table 6). Notably, we detected strong MR associations between CD36 and several polyunsaturated fatty acids, including eicosapentaenoic acid (EPA), docosahexaenoic acid (DHA), and arachidonic acid (Supplemental Table 6). These polyunsaturated fatty acids play a key role in eicosanoid signaling. CD36 has been implicated in the cellular uptake of polyunsaturated fatty acids using in vitro models65,66. However, these findings may suggest a broader role for CD36 as a central regulator of lipid homeostasis in human plasma.
There were also strong MR associations between the enzyme ACY1 and several N-acetyl amino acids, including N-acetyl-glutamate (IVW beta −1.25, q-value 1.9×10⁻³³, LIML q-value 4.5×10⁻¹²), N-acetyl-alanine, N-acetyl-glutamine, and N-acetyl-serine (Figure 4d)(Supplemental Table 6). Circulating levels of N-acetyl amino acids are known to be tightly regulated and have recently been tied to several cardiometabolic phenotypes in human population studies, such as insulin resistance47, incident coronary artery disease67, and incident heart failure68. These MR results are consistent with the known role of ACY1 in modulating the levels of these N-acetyl-amino acids in human plasma.
Intriguingly, proprotein convertase subtilisin/kexin type 9 (PCSK9) demonstrated putative causal associations with multiple acyl carnitines, including CAR 18:1 (IVW beta −0.52, q-value 5.8 × 10⁻⁴, LIML q-value 1.5 × 10⁻³), CAR 18:2, CAR 16:0, and CAR 14:1 (Figure 4d) (Supplemental Table 6). Acyl carnitines were among the most strongly associated metabolites with PCSK9 protein in pairwise Pearson correlation analyses (e.g., CAR 18:1 correlation coefficient −0.26, q-value 6.5 × 10−64) (Supplemental Table 4). Carnitines play a key role in the regulation of energy metabolism by facilitating the transport of long-chain fatty acids from adipose tissues to target cells. While PCSK9 has recently been shown to reduce the uptake of long-chain fatty acids by adipocytes in a cell culture system69, these MR association data suggest a potential role for PCSK9 in regulating the carnitine transport system in human plasma.
Protein-to-metabolite causal associations predicted by MR analyses in human plasma experimentally validated in three murine knockout models.
As a proof of concept to test the causal protein-to-metabolite associations predicted by MR analyses above, we conducted plasma metabolomics on available C57BL/6 murine knockout (KO) strains for the three proteins that had the most significant MR metabolite associations (CD36, APOE, and ACY1) and compared these to wild-type (WT) controls.
The CD36 scavenger receptor was predicted to have a causal association with 68 metabolites in the human MR analyses above (q-value ≤ 0.10) (Supplemental Table 6), 50 of which were also measured in the CD36 KO mouse. We identified significant differences in the plasma levels of 27 of these metabolites (54%) in metabolomic profiling studies of the CD36 KO animals (n=6) versus WT controls (n=8; p ≤ 0.05) (Figure 5a). These included experimental validation of predicted causal relationships with specific glycerophospholipids, sphingolipids, and fatty acyls, including causal associations of CD36 with circulating levels of the central signaling fatty acids docosahexaenoic acid (DHA; CD36 KO/WT fold-change = 0.73 ± 0.06, p-value = 0.01) and arachidonic acid (CD36 KO/WT fold-change = 0.74 ± 0.04, p-value = 0.01) (Figure 5b)(Supplemental Table 10).
Figure 5. Protein-to-metabolite causal associations predicted by Mendelian Randomization analyses in humans experimentally validate in murine knockout models.
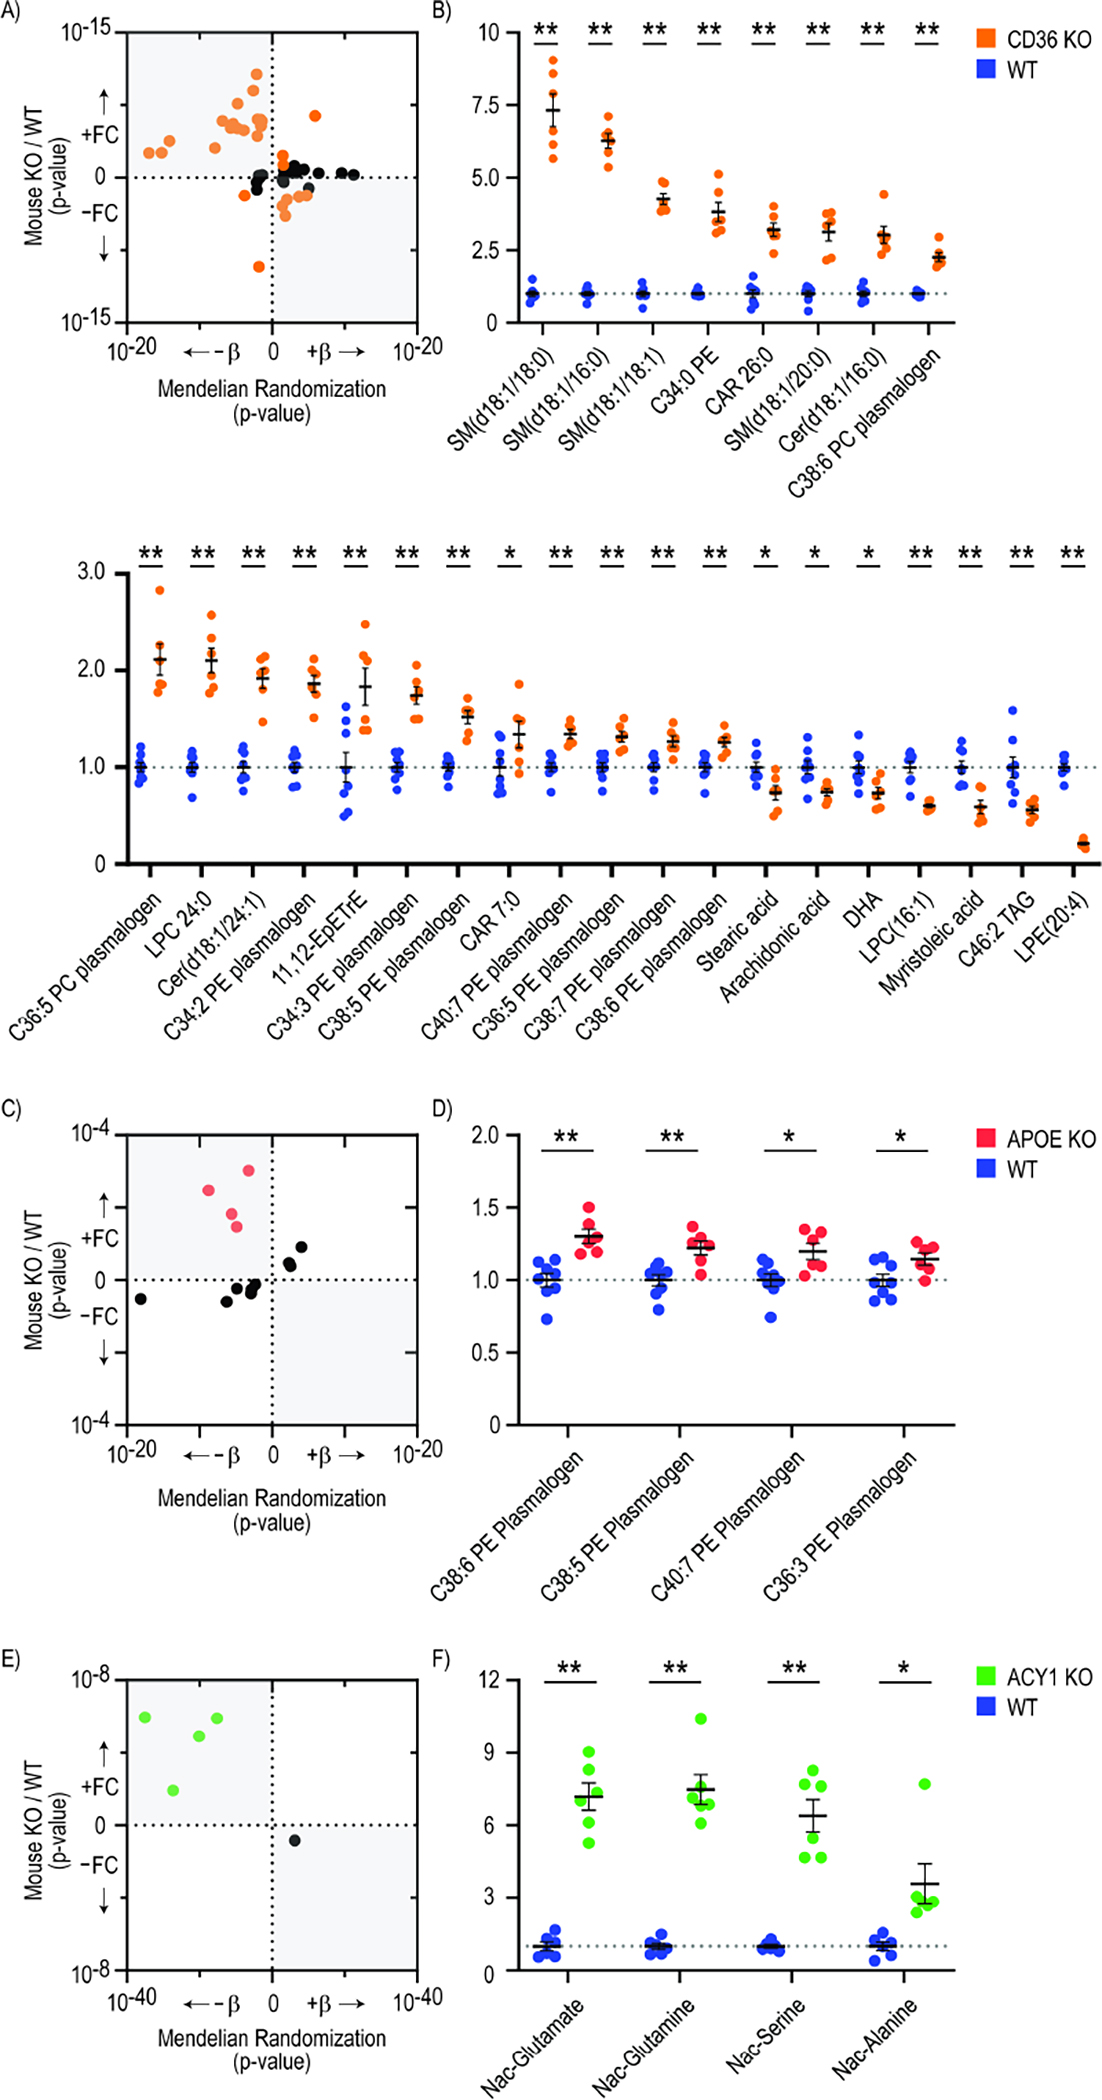
Plasma metabolomics was conducted on C57BL/6 murine knockout (KO) strains for CD36 (n=6), APOE (n=6), and ACY1 (n=6) and compared to wild type (WT) controls (n=8). Scatterplots depict the number of predicted protein-to-metabolite MR associations in humans (with q≤0.1) that validated in each murine model (with p≤0.05, highlighted in color), as well as the concordance in directionality of these associations (a, c, e). The position on the x axis represents the p-value of the predicted MR association between each protein and metabolite level in the human studies. The position on the y axis represents the p-value of the difference in metabolite level between KO and WT mice. Metabolites on the right half of the scatterplots are predicted to be positively associated with each protein by MR, whereas metabolites on the left half are predicted to be inversely associated with each protein. Similarly, metabolites on the top half of the scatterplots were higher in KO vs WT animals, whereas metabolites on the bottom half were lower in KO vs. WT animals. The northwest and southeast quadrants of each scatter plot are shaded to depict consistent directionality between the MR predictions and KO experiments. The levels of each metabolite that were significantly different in KO vs. WT animals (p≤0.05) are shown as fold changes compared to WT animals (b, d, f). * indicates P<0.05, and ** indicates P<0.01 by students two tailed t-test.
Similarly, APOE was predicted to have causal associations with 13 metabolites in the human MR analyses (q-value ≤ 0.10) (Supplemental Table 6), and we detected significant differences with the expected directionality in the plasma levels of four of these metabolites in APOE KO animals (n=6) versus WT controls (n=8; p≤0.05) (Figure 5c). Notably, each of the four experimentally validated metabolites were phosphatidylethanolamine (PE) plasmalogens, including C38:6 (APOE KO/WT fold-change = 1.30 ± 0.05, p-value = 9.47×10⁻⁴), C38:5, C36:3, and C40:7 PE plasmalogens (Figure 5d)(Supplemental Table 10). PEs have been speculated to interact with APOE following the hepatic secretion of nascent very low density lipoprotein (VLDL) particles in cell-based in vitro studies70,71. These findings may suggest a causal role for APOE in the regulation of circulation PE plasmalogen levels in human plasma.
Finally, the circulating enzyme ACY1 was predicted to have causal associations with five metabolites in human MR studies, and we detected directionally-consistent significant differences in the plasma levels of four of these metabolites (80%) in ACY1 KO animals (n=6) versus WT controls (n=6; p ≤ 0.05)(Figure 5e), including N-acetyl-glutamate (ACY1 KO/WT fold-change = 7.19 ± 0.57, p-value = 1.11×10⁻⁶), N-acetyl-glutamine, N-acetyl-serine, and N-acetyl-alanine (Figure 5f)(Supplemental Table 10).
In total, we experimentally validated 35 of the 68 (51%) predicted protein-to-metabolite MR associations. Further, we experimentally validated 62 additional protein-metabolite associations with significant pairwise Pearson correlations (q ≤ 0.05) that either did not have an available MR instrumental variable or were not captured by MR analyses (Supplemental Table 10). These data may provide new insight into potential downstream biological pathways that connect disease-associated proteins to end clinical phenotypes that can be further investigated at the bench. Association analyses between ACY1, APOE, and CD36 and cardiometabolic traits are provided in Supplemental Table 11.
Discussion
This study leveraged metabolomic and proteomic profiling of plasma samples from three human cohorts to determine if the integration of these datasets may identify novel causal relationships between specific circulating proteins and metabolites. The profiling data from the JHS, MESA, and HERITAGE Family studies were “harmonized,” in that we used the same mass spectrometry-based metabolomics and aptamer-based proteomics platforms in parallel across each of the 3,626 samples, providing an ideal opportunity to perform protein-metabolite association studies. Additionally, genomic data were available for each participant, allowing for the study of putative protein-to-metabolite causal associations with Mendelian Randomization analyses and follow-up studies in a select group of knockout mice. This analysis provides several important initial insights into the integration of metabolomic and proteomic profiling data for pathway discovery.
First, we show that known protein-metabolite associations that are key to established metabolic and signaling pathways (e.g., thyroxine binding globulin protein and thyroxine metabolite) can be detected in banked samples from population studies. Further, as might be expected for proteins and metabolites that are related though a shared biological pathway, these associations persist despite adjustment for broad baseline characteristics of study participants (e.g., age, sex, BMI, eGFR, medication use) and are reproducible across studies conducted at different geographical locations at different times, and in participants of diverse race and ethnicity. Finally, the directionality of these associations may provide insight into the biological relationship between each protein and metabolite. For example, we detected strong correlations between the enzyme aspartate transaminase in the biologically-expected negative direction with its catalytic substrate aspartate and positive direction with its catalytic product glutamate (higher protein enzyme levels are associated with lower metabolite substrate and higher metabolite product levels. It is important to note that these correlation data reflect a single cross-sectional point in time, however, and the directionality of certain protein-metabolite relationships may change over different physiological (and pathophysiological) states.
Second, this study leverages protein-metabolite association data to link protein-metabolite relationships previously identified in model systems to human biology. We used protein-metabolite correlation data to perform enrichment analyses and identify several examples of protein-lipid, protein-amino acid, and protein-nucleic acid associations that have been studied in cell- and animal-based systems, but that have not to our knowledge been previously demonstrated in human plasma. For example, the secreted protease Cathepsin B has emerged as a potential novel lipid regulatory protein in several experimental model systems. Knockout of the Cathepsin B gene results in marked improvements in liver triglyceride and blood total cholesterol levels in a murine model of nonalcoholic fatty liver disease72. Mechanistically, Cathepsin B has been shown in cultured cell-based model systems to regulate very-low-density lipoprotein (VLDL) secretion and free fatty acid uptake by cleaving liver fatty acid-binding protein (LFAB)73. The protein-metabolite enrichment analyses presented here extend these experimental findings and provide strong rationale for further study of Cathepsin B in human plasma lipid homeostasis.
Similarly, extensive experimental data have demonstrated a key role for adenylate kinase and ecto-nucleoside diphosphokinase nucleotide conversion enzymes in the regulation of extracellular ATP levels in cultured hepatocytes74, endothelial cells75, and lymphoid cells75, as well as in human vitreous fluid76. The protein-metabolite association data in the current study build on these mechanistic observations and suggest a role for these enzymes in the regulation of extracellular ATP and purine signaling that is reflected in human plasma. Importantly, while we used an enrichment analysis strategy based on GSEA34,35 to interrogate the protein-metabolite association data in this study, additional methods could be employed to query these extensive data for pathway discovery. Thus, we have made the complete protein-metabolite association study dataset publicly available for further analyses.
Third, this study demonstrates how Mendelian Randomization analyses can be leveraged to “triage” putative causal protein-to-metabolite associations from protein-metabolite correlation data for further experimental study. By integrating genetic data with our protein-metabolite association findings, we were able to use genetic variants located in or near the coding gene for a measured protein to examine the causal effect of that protein exposure on a metabolite outcome in human plasma. Approximately 40% of the measured proteins in our studies had strong, independent associations with genetic variants in cis to the protein cognate gene that could be used as instruments in MR analyses. Notably, the use of three cohorts representing diverse race/ethnicities and minor allele frequencies improved the ability to identify MR instruments. For example, the inclusion of African Americans in the JHS highlighted the variant rs2229152 (JHS MAF=1.7%) as an instrument for circulating ACY1 protein. This missense variant has been linked to the rare autosomal recessive inborn error of metabolism ACY1 deficiency that often manifests with neurologic symptoms in humans (MIM 609924)77, was strongly associated with circulating levels of ACY1 protein in JHS, and provided an MR instrument to support putative causal roles for ACY1 protein on plasma levels of N-acetyl-glutamate, N-acetyl-glutamine, N-acetyl-serine, and N-acetyl-alanine in JHS, each of which was experimentally validated in our murine ACY1 knockout studies. This variant is too rare in European populations (ALFA European MAF=0.0003) to have been captured for study in the MESA (MAF=0.006) or HERITAGE Family study (MAF=0.004), and thus would not have been available for analysis if not for inclusion of the JHS. This suggests that as an increasing number of multi-omics studies in diverse populations become available, our ability to study biologically significant protein-metabolite relationships will also improve.
It is also notable that over half (51%, 35 of 68) of the tested protein-to-metabolite MR associations experimentally validated in our three murine knockout models with at least nominal levels of significance (p ≤ 0.05). This suggests that a significant fraction of the 224 total protein-to-metabolite MR associations that we have identified point to biological relationships that can be further elucidated in model systems. Further, 62 additional protein-metabolite associations that were identified in the pair-wise Pearson correlation analyses but either did not have an available MR instrumental variable or were not captured by MR analyses validated in the murine models. This indicates that the protein-metabolite association data may highlight a substantial number of additional, biologically significant relationships, and that MR and Pearson correlation data can identify both overlapping and distinct causal associations. In terms of the protein-to-metabolite MR associations that did not experimentally validate, there were examples of strong MR associations that closely missed statistically-significant experimental validation in the studied knockout models. For example, we identified an MR association between the fatty acid scavenger receptor CD36 and the fatty acid EPA in humans with an IVW beta of 0.17 and a q-value of 8.8 × 10⁻⁵ that closely missed the statistical threshold for validation in the CD36 knockout studies (CD36 KO/WT fold-change = 1.31 ± 0.06, p-value = 0.08). It is possible that this relationship would have experimentally validated with increased statistical power. Whether our findings reflect the specific experimental conditions of our studies (e.g. 5-week old male mice maintained on a normal chow diet) or bona-fide biological differences in protein-metabolite relationships between the human populations and mouse models that we analyzed will be the subject of future study.
We have identified several specific examples of protein-metabolite associations that suggest novel regulatory mechanisms affecting plasma metabolites. These included experimental validation of 27 (54%) of the predicted MR associations between the scavenger receptor CD36 protein and levels of plasma lipid metabolites. CD36 has been well-documented to regulate fatty acid uptake in a number of cell types and rodent models, including hematopoietic stem cells78, leukemic stem cells79, cardiac myocytes80, adipocytes81, endothelial cells81, and macrophages82. CD36 is further known to regulate plasma levels of non-esterified fatty acids in murine models83. Our experimentally-validated protein-metabolite association data extend these findings and suggest that CD36 may play a central role in regulating plasma levels of a range of glycerophospholipid, sphingolipid, and fatty acyl metabolites. These include the polyunsaturated fatty acids arachidonic acid and docosahexaenoic acid (DHA), two key metabolites that participate in a wide array of eicosanoid-mediated biological pathways important in inflammation, nociception, the immune response, cell growth, atherosclerosis, and blood pressure regulation. DHA has furthermore been used clinically to reduce the risk of coronary heart disease, hypertension, and hypertriglyceridemia. While CD36 has been implicated in the regulation of polyunsaturated fatty acid cellular uptake using cultured cell-based in vitro models65,66, these findings provide a rationale for further studies of the role of CD36 in regulating key lipid metabolites in human plasma.
Finally, we note that circulating levels of ACY1, APOE, and CD36 proteins are strongly associated with several cardiometabolic traits in humans. For example, plasma levels of ACY1 and APOE have previously been associated with the future development of type 2 diabetes (T2D) in healthy, non-diabetic individuals47,84. Interestingly, several of the metabolites that are predicted to be downstream of ACY1 and APOE in the current MR analyses have also been associated with the future risk of T2D in the same populations. For example, plasma levels of N-acetyl-alanine are associated with future T2D in participants of the JHS85 and are modulated by ACY1 in our human MR analyses and in murine ACY1 knockout studies. Similarly, plasma levels of C36:3 PE plasmalogen and C34:3 PC plasmalogen are associated with future T2D in JHS85 and modulated by APOE in our human MR analyses and murine APOE knockout studies. These MR data may provide new insight into potential downstream biological pathways that connect disease-associated proteins to end clinical phenotypes that can be further investigated at the bench.
In summary, we demonstrate that the integration of proteomic and metabolomic profiling data can be used to identify novel protein determinants of circulating metabolite levels in human plasma. We provide proof-of-concept that these insights can be tested successfully in model systems. Finally, we are making all protein-metabolite association data from three large human cohorts available as a public resource for the further study of human metabolism.
Limitations of Study
Our study had several limitations. Although the metabolomics and proteomics platforms applied in these studies provide broad coverage, they are targeted platforms that include sentinel proteins and metabolites designed to survey a wide array of biological processes and do not provide a complete catalogue of every circulating protein and metabolite species in human plasma. The proteomics platform is further agnostic to post-translational changes in proteins. We expect that our ability to refine these initial association data for pathway discovery will improve as platform coverage improves. Similarly, although our study used “harmonized” metabolomics and proteomics data across three human cohort studies, the sample size is relatively modest compared with many GWAS. We expect that insight from protein-metabolite association studies will improve as increasing numbers of multi-omics studies become available, especially in populations including diverse ethnicities and races. It should be noted that we were only able to perform MR analyses on the 42% of proteins with available cis instrumental variables. We limited our analyses to include only cis instruments to limit the risk for horizontal pleiotropy and to validate the specificity of the affinity-based aptamer, but note that many additional causal protein-to-metabolite relationships likely exist within our data. Finally, while the use of cis instruments provided a biologically-plausible link to the protein exposure and thus allowed for the identification of putative causal association in the direction of protein-to-metabolite, we were not able to definitively assess for possible causal associations flowing in the opposite direction from metabolite-to-protein. In exploratory studies, we attempted to perform bidirectional (i.e. metabolite-to-protein) MR analyses for the 146 metabolites that we identified in our protein-to-metabolite MR studies above. A challenge in conducting metabolite-to-protein MR analyses has been in identifying genetic instruments that have as clear a biological tie to the metabolite exposure as is the case for a protein exposure (which has a coding gene). Despite a systematic search using data from the Kyoto Encyclopedia of Genes and Genomes (KEGG) Pathway Maps, we were unable to identify candidate genetic instruments for these metabolites that were located in cis (1Mb upstream or downstream) to genes that encoded enzymes with a biological link to the metabolite exposure (e.g., the gene MAOA, which encodes the enzyme serotonin deaminase, for the metabolite exposure serotonin). We anticipate that our ability to perform metabolite-to-protein MR associations will improve as larger multiomics datasets becomes available.
STAR Methods
Resource Availability
Lead Contact
Further information and requests for resources and reagents should be directed to and will be fulfilled by the lead contact, Robert E. Gerszten, MD (rgerszte@bidmc.harvard.edu).
Materials Availability
This study did not generate new unique reagents.
Data and Code Availability
Individual-level metabolomic, proteomic, and genomic data from JHS, MESA, and the HERITAGE Family study are available through application to the respective cohorts. All protein-metabolite association data, including pairwise Pearson correlation, enrichment, and Mendelian Randomization data, are included in the article and Supplemental Data. An excel file containing the values that were used to create all graphs in the article are available in Data S1 – Source Data. Data are also available through a Shiny app user interface that can be accessed through the following link: https://github.com/aeisman/protein-metabolite. Any additional information required to reanalyze the data reported in this paper is available from the lead contact upon request.
All analyses except where specifically noted were performed using code written in The Julia Programming Language86 and R project for statistical computing. All original code has been deposited at https://github.com/aeisman/protein-metabolite and is publicly available as of the date of publication. DOIs are listed in the key resources table.
Any additional information required to reanalyze the data reported in this paper is available from the lead contact upon request.
Key resources table.
| REAGENT or RESOURCE | SOURCE | IDENTIFIER |
|---|---|---|
| Antibodies | ||
| Bacterial and virus strains | ||
| Biological samples | ||
| Chemicals, peptides, and recombinant proteins | ||
| Critical commercial assays | ||
| Deposited data | ||
| Experimental models: Cell lines | ||
| Experimental models: Organisms/strains | ||
| B6.129P2-Apoetm1Unc/J | Jackson Labs | RRID:IMSR_JAX:002052 |
| B6.129S1-Cd36tm1Mfe/J | Jackson Labs | RRID:IMSR_JAX:019006 |
| C57BL/6N-Acy1em1(IMPC)J/Mmucd | The Knockout Mouse Project | RRID:MMRRC_046467-UCD |
| C57BL/6J | Jackson Labs | RRID:IMSR_JAX:000664 |
| Oligonucleotides | ||
| Recombinant DNA | ||
| Software and algorithms | ||
| Original code to perform protein-metabolite association studies | This paper | https://zenodo.org/record/7930898 |
| Other | ||
| protein-metabolite association data | This paper | https://zenodo.org/record/7930898 |
Experimental Model and Study Participant Details
Human Cohort Study Participants
The JHS, MESA, and the HERITAGE Family studies have been previously described87–89. Briefly, JHS is a community-based longitudinal cohort study that started in 2000 and included 5306 self-identified Black individuals from the Jackson, Mississippi metropolitan area. Proteomic profiling was performed on fasting baseline plasma samples from 2143 individuals; 399 samples were from a nested case-cohort study of incident coronary artery disease and the remaining were randomly selected from individuals with available plasma samples, as previously described90. Metabolomic profiling was performed on 2750 individuals as nested case-control studies for coronary disease (n=400) and chronic kidney disease (759) with the remaining samples randomly selected (n=1,591), as previously described68. Samples from 1985 individuals from JHS had available baseline metabolomics, proteomics, and genomics data from Visit 1 and were included in the present study. Baseline characteristics of the participants with available multi-omics profiling were comparable to the broader JHS population, as shown Supplemental Table 1b. MESA is a population-based study that started in 2000 and included 6814 self-identified White, Black, Hispanic, and Asian individuals recruited from six clinical centers across the United States. Samples from 983 randomly-selected individuals with available baseline metabolomics, proteomics, and genomics data from Visit 1 were included in the present study. The HERITAGE Family study is an exercise training study that started in 1994 and included 763 self-identified White and Black individuals in family units recruited from four clinical centers across the United States and Canada. Samples from 658 individuals with available baseline metabolomics and proteomics data from Visit 1 were included in the present study.
Study Approval
The JHS human study protocol was approved by the Jackson State University, Tougaloo College, and the University of Mississippi Medical Center Institutional Review Boards, and all participants provided written informed consent. The MESA human protocol was approved by The Lundquist Institute (formerly Los Angeles BioMedical Research Institute) at Harbor-University of California, Los Angeles Medical Center, University of Washington, Wake Forest School of Medicine, Northwestern University, University of Minnesota, Columbia University, Johns Hopkins University, and University of California, Los Angeles Institutional Review Boards, and all participants provided written informed consent. The HERITAGE Family study human study protocol was approved by the Institutional Review Boards at the Beth Israel Deaconess Medical Center, University of Washington, and the four clinical centers of the HERITAGE Family study, and all participants provided written informed consent. All animal experiments were approved by the Institutional Animal Care and Use Committee at Beth Israel Deaconess Medical Center.
Animal Studies
Plasma was collected for LC-MS studies by cardiac puncture from the following fasting 5-week old, male mice maintained on a normal chow diet in housing conditions with a 14-hour light/10-hour dark cycle and temperatures of 18–23 deg C with 40–60% humidity: B6.129P2-Apoetm1Unc/J (RRID:IMSR_JAX:002052, obtained from Jackson Labs), B6.129S1-Cd36tm1Mfe/J (RRID:IMSR_JAX:019006, obtained from Jackson Labs), C57BL/6N-Acy1em1(IMPC)J/Mmucd (RRID:MMRRC_046467-UCD, obtained from The Knockout Mouse Project (KOMP)), and C57BL/6J (RRID:IMSR_JAX:000664, obtained from Jackson Labs). Homozygous APOE and CD36 knockout animals were compared to wild-type C57BL/6J controls. Homozygous ACY1 knockout animals were compared to wild-type littermates. LC-MS was conducted using the same methods as described above.
Method Details
Proteomic Profiling
Aptamer-based proteomic profiling methods using the SOMAscan platform have been described previously91–93. Briefly, in each study, proteomics was performed on baseline plasma samples that were collected during Visit 1 in EDTA tubes and subsequently stored at −70 degrees C. The SOMAscan 1.3k platform was used in JHS and MESA studies, and the SOMAscan 5k platform was used in the HERITAGE Family study. Only proteins included in the 1.3k platform were used for this analysis in HERITAGE. A list of SOMAmer IDs and corresponding protein targets is included in Supplemental Table 2.
Metabolomics Profiling
Metabolomics profiling was performed using liquid chromatography mass spectrometry (LC-MS) on fasting baseline plasma samples that were collected during Visit 1 in JHS, MESA, and the HERITAGE Family study, as previously described68,94. Briefly, amino acids, amines, acylcarnitines, lipids, and other water-soluble, polar metabolites were measured using a Nexera X2 U-HPLC (Shimadzu) equipped with a 150 × 2 mm, 3 μm Atlantis hydrophilic interaction LC column (Waters) coupled to a Q Exactive hybrid quadrupole Orbitrap MS (ThermoFisher Scientific). Metabolites were extracted from 10 μl plasma by adding 90 μl of Acetonitrile:Methanol:Formic acid (74.9:24.9:0.2,v/v/v) solution spiked with valine-d8 (Sigma) and Phenylalanine-d8 (Cambridge Isotope Laboratories). The metabolites were eluted at 0.25 ml/min with 5% buffer A (10 mM Ammonium-Formate, 0.1% formic acid in water) for 0.5 minutes followed by a linear gradient to 40% buffer B (0.1% formic acid in acetonitrile) over 10 minutes. MS analyses were carried out using electrospray ionization in the positive mode and full scan spectra were acquired over 70–800 m/z. Raw data were processed using Trace Finder (v3.3, Thermo Fisher Scientific) and Progenesis QI (Waters). Sugars, purines, pyrimidines, organic acids and other intermediary metabolites were measured using a 1290 Infinity LC system (Agilent Technologies) equipped with a 100 × 2.1 mm XBridge amide column (Waters) coupled to a 6490 Triple Quad MS (Agilent Technologies) in negative ionization mode via multiple reaction monitoring (MRM) scanning. Data were quantified using MassHunter Quantitative Analysis software (V10.1, Agilent).
To ensure quality control, a mixture of ~150 reference standards was analyzed before, during periodic intervals throughout, and after each MS run to ensure reproducibility of LC retention times, LC peak shapes, and MS sensitivity. Isotope labeled internal standards were monitored in each sample throughout the duration of each run. Pooled plasma samples were monitored after every 10 participant samples to standardize for MS drift over time using “nearest neighbor” normalization and between batches. Separate pooled plasma samples were monitored after every 20 participant samples to determine coefficient of variation (CV) for each metabolite. Metabolite identities were confirmed using authentic reference standards. All metabolite peaks were manually reviewed for peak quality in a blinded manner. None of the included metabolites had poor peak quality or CVs ≥ 30% averaged across batches. A complete list of metabolites included in this study is included in Supplemental Table 3.
Genotyping
Whole-genome sequencing (WGS) in JHS and MESA has been described95. Participant samples underwent >30× WGS through the Trans-Omics for Precision Medicine project at the Northwest Genome Center at University of Washington and joint genotype calling with participants in Freeze 6. Genotype calling was performed by the Informatics Resource Center at the University of Michigan. Genotyping in HERITAGE was performed on the Illumina Infinium Global Screening Array, and genotypes were called using Illumina’s GenCall based on the TOP/BOT strand method. Genotype imputation to the TOPMed Freeze5 reference panel was performed using the University of Michigan Imputation Server Minimac4. Phasing was performed with Eagle v2.4. Sites with call rate <90%, mismatched alleles, or invalid alleles were excluded.
Genome-Wide Association Studies
Metabolite and protein levels in the JHS, MESA, and HERITAGE Family Study were log-transformed, scaled to a mean of zero and standard deviation of 1, and residualized on age, sex, batch (for metabolites), plate (for proteins), and principal components of ancestry 1–10 as determined by the Genetic Estimation and Inference in Structured samples (GENESIS)95. These values were inverse normalized and tested for association with genetic variants using linear mixed effects models adjusted for age, sex, the genetic relationship matrix, and principal components of ancestry 1–10 using the fastGWA model implemented in the GCTA software package.
Correlation Analyses
Metabolite and protein levels were log-transformed, scaled to a mean of zero and standard deviation of 1, and residualized on age, sex, batch (for metabolites), and plate (for proteins). Additional models included further adjustment for body mass index (BMI) and estimated glomerular filtration rate (eGFR; not available in HERITAGE Family study), where indicated. Pearson correlation coefficients were calculated for each pairwise protein-metabolite combination within each study and meta-analyzed across studies using the metacor function within the General Package for Meta-Analysis in R96. A correlation heat map was generated using the Heatmap3 R package97, in which the organization of metabolites was fixed by RefMet superclass, main class, and subclass98, and proteins were allowed to self-organize using the default complete linkage method of the hierarchical clustering function.
Enrichment Analyses
Enrichment analyses were performed to identify proteins with pairwise metabolite correlations that were enriched for a specific metabolite class using a method analogous to Gene Set Enrichment Analysis (GSEA) 34,35. Sets of metabolites were generated according to RefMet superclasses, with fatty acyls, glycerolipids, glycerophospholipids, prenol lipids, sphingolipids, and sterol lipids combined into a single, combined lipid set. Members of the lipid set were evaluated in the lipid enrichment analysis and not included in other metabolite set enrichment analyses due to the large size of this set.
Meta-analyzed metabolite correlation results for each protein were ranked by p-value, annotated by metabolite RefMet class set, and a running sum statistic was calculated to generate an enrichment score (ES). The running sum statistic increased when it encountered a member of the analyzed RefMet metabolite class set and decreased when it encountered a nonmember of the analyzed set. Each increase was weighted by the strength of the metabolite correlation with the protein (according to p-value) normalized by the sum of the correlations over all the metabolites (p=1 in equation 1)35. The significance of each ES was assessed by comparison to the null distribution of calculated ES for each metabolite class generated by running 100000 simulations of the analysis.
Mendelian Randomization Analyses
Genetic instrumental variables (IV) for MR were selected from variants that were located in cis to the coding gene for each protein (≤ 1 million bases upstream or downstream of the transcriptional start site for the protein cognate gene, or to the transcription end site for genes > 1 million bases) that had a study-specific observed minor allele frequency (MAF) ≥ 0.01 and were associated with circulating levels of the measured protein with a p ≤ 0.05 that was Bonferroni-adjusted for the total number of variants within this cis window. Candidate instruments that met these criteria were then pruned using a study-specific linkage disequilibrium (LD) threshold of 0.001 with PLINK 1.999–101. A complete list of MR IVs used in this study is available in Supplemental Tables 7–9. One-sample MR using individual level data was performed since genetic variants, plasma protein levels, and plasma metabolite levels were available in the same individuals, and because samples between studies represented different ethnic groups with different patterns of linkage disequilibrium, minor allele frequencies, and population characteristics (Supplementary Table 1). Pairwise significant associations from meta-analyzed Pearson correlation and enrichment analyses were considered candidate protein-to-metabolite causal associations for MR. Causal effect estimates were obtained using the inverse-variance weighted (IVW) method using the MendelianRandomization R package102 and then meta-analyzed across all three studies using a fixed effect model96. The limited information maximum likelihood (LIML) robust method was performed to assess the sensitivity for findings, and further supplemented with MR-Egger, median, and median-weighted methods when instruments contained more than two genetic variants (Supplemental Table 6). MR was performed on each protein that had ≥ 1 available IV and associated metabolites with q-value ≤ 0.05 (either by pairwise correlation analysis or enrichment analysis).
Quantification and Statistical Analyses
Reported p-values were estimated using the Fisher transformation. Throughout the manuscript, significance levels were adjusted for multiple hypothesis testing by computing Benjamini-Hochberg FDR-adjusted q-values for each protein using the Bioconductor q-value package in R103. The significance of metabolite associations was calculated for each protein so that findings would remain agnostic to the specific proteomic platform used in each study, and to establish an analytical pipeline that will be scalable to the addition of future datasets that may use different proteomics platforms.
Supplementary Material
Data S1. Unprocessed source data underlying all graphs. Related to Figures 2–5 and Supplemental Figure 1.
Supplemental Tables 1a, 1b. Study Participant Baseline Characteristics. Related to Figure 1.
Supplemental Table 2. Somalogic Proteomics Information. Related to Figure 1.
Supplemental Table 3. LC-MS Metabolomics Information. Related to Figure 1.
Supplemental Table 5. Protein-Metabolite Enrichment Data. Related to Figure 3.
Supplemental Table 6. Protein-Metabolite Mendelian Randomization Data. Related to Figure 4.
Supplemental Table 7. JHS MR Genetic Instruments. Related to Figure 4.
Supplemental Table 8. MESA MR Genetic Instruments. Related to Figure 4.
Supplemental Table 9. HERITAGE MR Genetic Instruments. Related to Figure 4.
Supplemental Table 10. Mouse Knockout Plasma Metabolomics Data. Related to Figure 5.
Supplemental Table 4. Protein-Metabolite Correlation Data. Related to Figure 2.
Highlights.
Integrating human plasma proteomic and metabolomic data informs pathway discovery
Genomic data can help identify putative protein-to-metabolite causal associations
Top protein-metabolite causal associations validated in experimental mouse models
Protein-metabolite association data have been made publicly available
Acknowledgements
Dr. Benson is supported by NHLBI K08HL145095. Aaron Eisman is supported by NIH F30LM013320. Drs. Gerszten, Wang and Wilson are supported by NIH R01 DK081572.
Jackson Heart Study
The Jackson Heart Study (JHS) is supported and conducted in collaboration with Jackson State University (HHSN268201800013I), Tougaloo College (HHSN268201800014I), the Mississippi State Department of Health (HHSN268201800015I/HHSN26800001) and the University of Mississippi Medical Center (HHSN268201800010I, HHSN268201800011I and HHSN268201800012I) contracts from the National Heart, Lung, and Blood Institute and the National Institute for Minority Health and Health Disparities (NIMHD).
Molecular data for the Trans-Omics in Precision Medicine (TOPMed) program was supported by the National Heart, Lung and Blood Institute. Genome sequencing for “NHLBI TOPMed: The Jackson Heart Study” (phs000964.v1.p1) was performed at the Northwest Genomics Center (HHSN268201100037C). Core support including centralized genomic read mapping and genotype calling, along with variant quality metrics and filtering were provided by the TOPMed Informatics Research Center (3R01HL-117626–02S1; contract HHSN268201800002I). Core support including phenotype harmonization, data management, sample-identity QC, and general program coordination were provided by the TOPMed Data Coordinating Center (R01HL-120393; U01HL-120393; contract HHSN268201800001I). We gratefully acknowledge the studies and participants who provided biological samples and data for TOPMed. The authors wish to thank the staff and participants of the JHS.
TOPMed MESA Multi-Omics/MESA Study Acknowledgement
Whole genome sequencing (WGS) for the Trans-Omics in Precision Medicine 41 program was supported by the National Heart, Lung and Blood Institute 41. WGS for “NHLBI TOPMed: Multi-Ethnic Study of Atherosclerosis (MESA)” (phs001416.v1.p1) was performed at the Broad Institute of MIT and Harvard (3U54HG003067–13S1). Centralized read mapping and genotype calling, along with variant quality metrics and filtering were provided by the TOPMed Informatics Research Center (3R01HL-117626–02S1). Phenotype harmonization, data management, sample-identity QC, and general study coordination, were provided by the TOPMed Data Coordinating Center (3R01HL-120393–02S1). The MESA projects are conducted and supported by the National Heart, Lung, and Blood Institute 41 in collaboration with MESA investigators.
Support for the Multi-Ethnic Study of Atherosclerosis (MESA) projects are conducted and supported by the National Heart, Lung, and Blood Institute 41 in collaboration with MESA investigators. Support for MESA is provided by contracts 75N92020D00001, HHSN268201500003I, N01-HC-95159, 75N92020D00005, N01-HC-95160, 75N92020D00002, N01-HC-95161, 75N92020D00003, N01-HC-95162, 75N92020D00006, N01-HC-95163, 75N92020D00004, N01-HC-95164, 75N92020D00007, N01-HC-95165, N01-HC-95166, N01-HC-95167, N01-HC-95168, N01-HC-95169, UL1-TR-000040, UL1-TR-001079, and UL1-TR-001420. Also supported in part by the National Center for Advancing Translational Sciences, CTSI grant UL1TR001881, and the National Institute of Diabetes and Digestive and Kidney Disease Diabetes Research Center (DRC) grant DK063491 to the Southern California Diabetes Endocrinology Research Center.
HERITAGE
We thank Drs. Arthur S. Leon, D.C. Rao, James S. Skinner, Tuomo Rankinen, Jacques Gagnon, and the late Jack H. Wilmore for contributions to the planning, data collection, and conduct of the HERITAGE project.
This research was partially funded by National Heart, Lung, and Blood Institute Grants HL-45670, HL-47317, HL-47321, HL-47323, and HL-47327, all in support of the HERITAGE Family Study. C. B. is partially funded by the John W. Barton Sr. Chair in Genetics and Nutrition, and NIH COBRE grant (NIH P30GM118430–01). Dr. Sarzynski is supported by R01HL146462.
Inclusion and Diversity
We support inclusive, diverse, and equitable conduct of research.
Footnotes
Declaration of Interests
Dr. Benson reports investigator-initiated grants from Amgen and Boehringer-Ingelheim. Dr. Natarajan reports investigator-initiated grants from Amgen, Apple, AstraZeneca, Boston Scientific, and Novartis, personal fees from Apple, AstraZeneca, Blackstone Life Sciences, Foresite Labs, Novartis, Roche / Genentech, is a co-founder of TenSixteen Bio, is a shareholder of geneXwell, TenSixteen Bio, and Vertex, is a scientific advisory board member of geneXwell and TenSixteen Bio, and spousal employment at Vertex, all unrelated to the present work.
Publisher's Disclaimer: This is a PDF file of an unedited manuscript that has been accepted for publication. As a service to our customers we are providing this early version of the manuscript. The manuscript will undergo copyediting, typesetting, and review of the resulting proof before it is published in its final form. Please note that during the production process errors may be discovered which could affect the content, and all legal disclaimers that apply to the journal pertain.
References
- 1.Gieger C, Geistlinger L, Altmaier E, Hrabé de Angelis M, Kronenberg F, Meitinger T, Mewes HW, Wichmann HE, Weinberger KM, Adamski J, et al. (2008). Genetics meets metabolomics: a genome-wide association study of metabolite profiles in human serum. PLoS Genet 4, e1000282. 10.1371/journal.pgen.1000282. [DOI] [PMC free article] [PubMed] [Google Scholar]
- 2.Illig T, Gieger C, Zhai G, Römisch-Margl W, Wang-Sattler R, Prehn C, Altmaier E, Kastenmüller G, Kato BS, Mewes HW, et al. (2010). A genome-wide perspective of genetic variation in human metabolism. Nat Genet 42, 137–141. 10.1038/ng.507. [DOI] [PMC free article] [PubMed] [Google Scholar]
- 3.Suhre K, Shin SY, Petersen AK, Mohney RP, Meredith D, Wägele B, Altmaier E, Deloukas P, Erdmann J, Grundberg E, et al. (2011). Human metabolic individuality in biomedical and pharmaceutical research. Nature 477, 54–60. 10.1038/nature10354. [DOI] [PMC free article] [PubMed] [Google Scholar]
- 4.Kettunen J, Tukiainen T, Sarin AP, Ortega-Alonso A, Tikkanen E, Lyytikäinen LP, Kangas AJ, Soininen P, Würtz P, Silander K, et al. (2012). Genome-wide association study identifies multiple loci influencing human serum metabolite levels. Nat Genet 44, 269–276. 10.1038/ng.1073. [DOI] [PMC free article] [PubMed] [Google Scholar]
- 5.Rhee EP, Ho JE, Chen MH, Shen D, Cheng S, Larson MG, Ghorbani A, Shi X, Helenius IT, O’Donnell CJ, et al. (2013). A genome-wide association study of the human metabolome in a community-based cohort. Cell Metab 18, 130–143. 10.1016/j.cmet.2013.06.013. [DOI] [PMC free article] [PubMed] [Google Scholar]
- 6.Shin SY, Fauman EB, Petersen AK, Krumsiek J, Santos R, Huang J, Arnold M, Erte I, Forgetta V, Yang TP, et al. (2014). An atlas of genetic influences on human blood metabolites. Nat Genet 46, 543–550. 10.1038/ng.2982. [DOI] [PMC free article] [PubMed] [Google Scholar]
- 7.Rhee EP, Yang Q, Yu B, Liu X, Cheng S, Deik A, Pierce KA, Bullock K, Ho JE, Levy D, et al. (2016). An exome array study of the plasma metabolome. Nat Commun 7, 12360. 10.1038/ncomms12360. [DOI] [PMC free article] [PubMed] [Google Scholar]
- 8.Long T, Hicks M, Yu HC, Biggs WH, Kirkness EF, Menni C, Zierer J, Small KS, Mangino M, Messier H, et al. (2017). Whole-genome sequencing identifies common-to-rare variants associated with human blood metabolites. Nat Genet 49, 568–578. 10.1038/ng.3809. [DOI] [PubMed] [Google Scholar]
- 9.Yousri NA, Fakhro KA, Robay A, Rodriguez-Flores JL, Mohney RP, Zeriri H, Odeh T, Kader SA, Aldous EK, Thareja G, et al. (2018). Whole-exome sequencing identifies common and rare variant metabolic QTLs in a Middle Eastern population. Nat Commun 9, 333. 10.1038/s41467-017-01972-9. [DOI] [PMC free article] [PubMed] [Google Scholar]
- 10.Lotta LA, Pietzner M, Stewart ID, Wittemans LBL, Li C, Bonelli R, Raffler J, Biggs EK, Oliver-Williams C, Auyeung VPW, et al. (2021). A cross-platform approach identifies genetic regulators of human metabolism and health. Nat Genet 53, 54–64. 10.1038/s41588-020-00751-5. [DOI] [PMC free article] [PubMed] [Google Scholar]
- 11.Tahir UA, Katz DH, Avila-Pachecho J, Bick AG, Pampana A, Robbins JM, Yu Z, Chen ZZ, Benson MD, Cruz DE, et al. (2022). Whole Genome Association Study of the Plasma Metabolome Identifies Metabolites Linked to Cardiometabolic Disease in Black Individuals. Nat Commun 13, 4923. 10.1038/s41467-022-32275-3. [DOI] [PMC free article] [PubMed] [Google Scholar]
- 12.Yin X, Chan LS, Bose D, Jackson AU, VandeHaar P, Locke AE, Fuchsberger C, Stringham HM, Welch R, Yu K, et al. (2022). Genome-wide association studies of metabolites in Finnish men identify disease-relevant loci. Nat Commun 13, 1644. 10.1038/s41467-022-29143-5. [DOI] [PMC free article] [PubMed] [Google Scholar]
- 13.Lourdusamy A, Newhouse S, Lunnon K, Proitsi P, Powell J, Hodges A, Nelson SK, Stewart A, Williams S, Kloszewska I, et al. (2012). Identification of cis-regulatory variation influencing protein abundance levels in human plasma. Hum Mol Genet 21, 3719–3726. 10.1093/hmg/dds186. [DOI] [PMC free article] [PubMed] [Google Scholar]
- 14.Suhre K, Arnold M, Bhagwat AM, Cotton RJ, Engelke R, Raffler J, Sarwath H, Thareja G, Wahl A, DeLisle RK, et al. (2017). Connecting genetic risk to disease end points through the human blood plasma proteome. Nat Commun 8, 14357. 10.1038/ncomms14357. [DOI] [PMC free article] [PubMed] [Google Scholar]
- 15.Benson MD, Yang Q, Ngo D, Zhu Y, Shen D, Farrell LA, Sinha S, Keyes MJ, Vasan RS, Larson MG, et al. (2017). The Genetic Architecture of the Cardiovascular Risk Proteome. Circulation. 10.1161/CIRCULATIONAHA.117.029536. [DOI] [PMC free article] [PubMed] [Google Scholar]
- 16.Di Narzo AF, Telesco SE, Brodmerkel C, Argmann C, Peters LA, Li K, Kidd B, Dudley J, Cho J, Schadt EE, et al. (2017). High-Throughput Characterization of Blood Serum Proteomics of IBD Patients with Respect to Aging and Genetic Factors. PLoS Genet 13, e1006565. 10.1371/journal.pgen.1006565. [DOI] [PMC free article] [PubMed] [Google Scholar]
- 17.Folkersen L, Fauman E, Sabater-Lleal M, Strawbridge RJ, Frånberg M, Sennblad B, Baldassarre D, Veglia F, Humphries SE, Rauramaa R, et al. (2017). Mapping of 79 loci for 83 plasma protein biomarkers in cardiovascular disease. PLoS Genet 13, e1006706. 10.1371/journal.pgen.1006706. [DOI] [PMC free article] [PubMed] [Google Scholar]
- 18.Sun BB, Maranville JC, Peters JE, Stacey D, Staley JR, Blackshaw J, Burgess S, Jiang T, Paige E, Surendran P, et al. (2018). Genomic atlas of the human plasma proteome. Nature 558, 73–79. 10.1038/s41586-018-0175-2. [DOI] [PMC free article] [PubMed] [Google Scholar]
- 19.Emilsson V, Ilkov M, Lamb JR, Finkel N, Gudmundsson EF, Pitts R, Hoover H, Gudmundsdottir V, Horman SR, Aspelund T, et al. (2018). Co-regulatory networks of human serum proteins link genetics to disease. Science 361, 769–773. 10.1126/science.aaq1327. [DOI] [PMC free article] [PubMed] [Google Scholar]
- 20.Yao C, Chen G, Song C, Keefe J, Mendelson M, Huan T, Sun BB, Laser A, Maranville JC, Wu H, et al. (2018). Genome-wide mapping of plasma protein QTLs identifies putatively causal genes and pathways for cardiovascular disease. Nat Commun 9, 3268. 10.1038/s41467-018-05512-x. [DOI] [PMC free article] [PubMed] [Google Scholar]
- 21.Folkersen L, Gustafsson S, Wang Q, Hansen DH, Hedman Å, Schork A, Page K, Zhernakova DV, Wu Y, Peters J, et al. (2020). Genomic and drug target evaluation of 90 cardiovascular proteins in 30,931 individuals. Nat Metab 2, 1135–1148. 10.1038/s42255-020-00287-2. [DOI] [PMC free article] [PubMed] [Google Scholar]
- 22.Pietzner M, Wheeler E, Carrasco-Zanini J, Raffler J, Kerrison ND, Oerton E, Auyeung VPW, Luan J, Finan C, Casas JP, et al. (2020). Genetic architecture of host proteins involved in SARS-CoV-2 infection. Nat Commun 11, 6397. 10.1038/s41467-020-19996-z. [DOI] [PMC free article] [PubMed] [Google Scholar]
- 23.Png G, Barysenka A, Repetto L, Navarro P, Shen X, Pietzner M, Wheeler E, Wareham NJ, Langenberg C, Tsafantakis E, et al. (2021). Mapping the serum proteome to neurological diseases using whole genome sequencing. Nat Commun 12, 7042. 10.1038/s41467-021-27387-1. [DOI] [PMC free article] [PubMed] [Google Scholar]
- 24.Ferkingstad E, Sulem P, Atlason BA, Sveinbjornsson G, Magnusson MI, Styrmisdottir EL, Gunnarsdottir K, Helgason A, Oddsson A, Halldorsson BV, et al. (2021). Large-scale integration of the plasma proteome with genetics and disease. Nat Genet 53, 1712–1721. 10.1038/s41588-021-00978-w. [DOI] [PubMed] [Google Scholar]
- 25.Pietzner M, Wheeler E, Carrasco-Zanini J, Cortes A, Koprulu M, Wörheide MA, Oerton E, Cook J, Stewart ID, Kerrison ND, et al. (2021). Mapping the proteo-genomic convergence of human diseases. Science 374, eabj1541. 10.1126/science.abj1541. [DOI] [PMC free article] [PubMed] [Google Scholar]
- 26.Zhong W, Edfors F, Gummesson A, Bergström G, Fagerberg L, and Uhlén M (2021). Next generation plasma proteome profiling to monitor health and disease. Nat Commun 12, 2493. 10.1038/s41467-021-22767-z. [DOI] [PMC free article] [PubMed] [Google Scholar]
- 27.Katz DH, Tahir UA, Bick AG, Pampana A, Ngo D, Benson MD, Yu Z, Robbins JM, Chen ZZ, Cruz DE, et al. (2022). Whole Genome Sequence Analysis of the Plasma Proteome in Black Adults Provides Novel Insights Into Cardiovascular Disease. Circulation 145, 357–370. 10.1161/CIRCULATIONAHA.121.055117. [DOI] [PMC free article] [PubMed] [Google Scholar]
- 28.Gudjonsson A, Gudmundsdottir V, Axelsson GT, Gudmundsson EF, Jonsson BG, Launer LJ, Lamb JR, Jennings LL, Aspelund T, Emilsson V, and Gudnason V (2022). A genome-wide association study of serum proteins reveals shared loci with common diseases. Nat Commun 13, 480. 10.1038/s41467-021-27850-z. [DOI] [PMC free article] [PubMed] [Google Scholar]
- 29.Olson NC, Butenas S, Lange LA, Lange EM, Cushman M, Jenny NS, Walston J, Souto JC, Soria JM, Chauhan G, et al. (2015). Coagulation factor XII genetic variation, ex vivo thrombin generation, and stroke risk in the elderly: results from the Cardiovascular Health Study. J Thromb Haemost 13, 1867–1877. 10.1111/jth.13111. [DOI] [PMC free article] [PubMed] [Google Scholar]
- 30.Kraus WE, Muoio DM, Stevens R, Craig D, Bain JR, Grass E, Haynes C, Kwee L, Qin X, Slentz DH, et al. (2015). Metabolomic Quantitative Trait Loci (mQTL) Mapping Implicates the Ubiquitin Proteasome System in Cardiovascular Disease Pathogenesis. PLoS Genet 11, e1005553. 10.1371/journal.pgen.1005553. [DOI] [PMC free article] [PubMed] [Google Scholar]
- 31.Solomon T, Smith EN, Matsui H, Braekkan SK, Wilsgaard T, Njølstad I, Mathiesen EB, Hansen JB, Frazer KA, and Consortium I (2016). Associations Between Common and Rare Exonic Genetic Variants and Serum Levels of 20 Cardiovascular-Related Proteins: The Tromsø Study. Circ Cardiovasc Genet 9, 375–383. 10.1161/CIRCGENETICS.115.001327. [DOI] [PMC free article] [PubMed] [Google Scholar]
- 32.Carayol J, Chabert C, Di Cara A, Armenise C, Lefebvre G, Langin D, Viguerie N, Metairon S, Saris WHM, Astrup A, et al. (2017). Protein quantitative trait locus study in obesity during weight-loss identifies a leptin regulator. Nat Commun 8, 2084. 10.1038/s41467-017-02182-z. [DOI] [PMC free article] [PubMed] [Google Scholar]
- 33.Holt JA, Luo G, Billin AN, Bisi J, McNeill YY, Kozarsky KF, Donahee M, Wang DY, Mansfield TA, Kliewer SA, et al. (2003). Definition of a novel growth factor-dependent signal cascade for the suppression of bile acid biosynthesis. Genes Dev 17, 1581–1591. 10.1101/gad.1083503. [DOI] [PMC free article] [PubMed] [Google Scholar]
- 34.Mootha VK, Lindgren CM, Eriksson KF, Subramanian A, Sihag S, Lehar J, Puigserver P, Carlsson E, Ridderstråle M, Laurila E, et al. (2003). PGC-1alpha-responsive genes involved in oxidative phosphorylation are coordinately downregulated in human diabetes. Nat Genet 34, 267–273. 10.1038/ng1180. [DOI] [PubMed] [Google Scholar]
- 35.Subramanian A, Tamayo P, Mootha VK, Mukherjee S, Ebert BL, Gillette MA, Paulovich A, Pomeroy SL, Golub TR, Lander ES, and Mesirov JP (2005). Gene set enrichment analysis: a knowledge-based approach for interpreting genome-wide expression profiles. Proc Natl Acad Sci U S A 102, 15545–15550. 10.1073/pnas.0506580102. [DOI] [PMC free article] [PubMed] [Google Scholar]
- 36.Harmon CM, and Abumrad NA (1993). Binding of sulfosuccinimidyl fatty acids to adipocyte membrane proteins: isolation and amino-terminal sequence of an 88-kD protein implicated in transport of long-chain fatty acids. J Membr Biol 133, 43–49. 10.1007/BF00231876. [DOI] [PubMed] [Google Scholar]
- 37.Ibrahimi A, Bonen A, Blinn WD, Hajri T, Li X, Zhong K, Cameron R, and Abumrad NA (1999). Muscle-specific overexpression of FAT/CD36 enhances fatty acid oxidation by contracting muscle, reduces plasma triglycerides and fatty acids, and increases plasma glucose and insulin. J Biol Chem 274, 26761–26766. 10.1074/jbc.274.38.26761. [DOI] [PubMed] [Google Scholar]
- 38.Coburn CT, Knapp FF, Febbraio M, Beets AL, Silverstein RL, and Abumrad NA (2000). Defective uptake and utilization of long chain fatty acids in muscle and adipose tissues of CD36 knockout mice. J Biol Chem 275, 32523–32529. 10.1074/jbc.M003826200. [DOI] [PubMed] [Google Scholar]
- 39.Yanai H, Chiba H, Morimoto M, Abe K, Fujiwara H, Fuda H, Hui SP, Takahashi Y, Akita H, Jamieson GA, et al. (2000). Human CD36 deficiency is associated with elevation in low-density lipoprotein-cholesterol. Am J Med Genet 93, 299–304. 10.1002/1096-8628(20000814)93:4<299::aid-ajmg9>3.0.co;2-7. [DOI] [PubMed] [Google Scholar]
- 40.Melis M, Carta G, Pintus S, Pintus P, Piras CA, Murru E, Manca C, Di Marzo V, Banni S, and Tomassini Barbarossa I (2017). Polymorphism. Front Physiol 8, 1006. 10.3389/fphys.2017.01006. [DOI] [PMC free article] [PubMed] [Google Scholar]
- 41.Asch AS, Barnwell J, Silverstein RL, and Nachman RL (1987). Isolation of the thrombospondin membrane receptor. J Clin Invest 79, 1054–1061. 10.1172/JCI112918. [DOI] [PMC free article] [PubMed] [Google Scholar]
- 42.Kurokawa J, Arai S, Nakashima K, Nagano H, Nishijima A, Miyata K, Ose R, Mori M, Kubota N, Kadowaki T, et al. (2010). Macrophage-derived AIM is endocytosed into adipocytes and decreases lipid droplets via inhibition of fatty acid synthase activity. Cell Metab 11, 479–492. 10.1016/j.cmet.2010.04.013. [DOI] [PubMed] [Google Scholar]
- 43.Desiere F, Deutsch EW, King NL, Nesvizhskii AI, Mallick P, Eng J, Chen S, Eddes J, Loevenich SN, and Aebersold R (2006). The PeptideAtlas project. Nucleic Acids Res 34, D655–658. 10.1093/nar/gkj040. [DOI] [PMC free article] [PubMed] [Google Scholar]
- 44.Choo HJ, Kim BW, Kwon OB, Lee CS, Choi JS, and Ko YG (2008). Secretion of adenylate kinase 1 is required for extracellular ATP synthesis in C2C12 myotubes. Exp Mol Med 40, 220–228. 10.3858/emm.2008.40.2.220. [DOI] [PMC free article] [PubMed] [Google Scholar]
- 45.Yokdang N, Tellez JD, Tian H, Norvell J, Barsky SH, Valencik M, and Buxton IL (2011). A role for nucleotides in support of breast cancer angiogenesis: heterologous receptor signalling. Br J Cancer 104, 1628–1640. 10.1038/bjc.2011.134. [DOI] [PMC free article] [PubMed] [Google Scholar]
- 46.Romani P, Ignesti M, Gargiulo G, Hsu T, and Cavaliere V (2018). Extracellular NME proteins: a player or a bystander? Lab Invest 98, 248–257. 10.1038/labinvest.2017.102. [DOI] [PubMed] [Google Scholar]
- 47.Ngo D, Benson MD, Long JZ, Chen ZZ, Wang R, Nath AK, Keyes MJ, Shen D, Sinha S, Kuhn E, et al. (2021). Proteomic profiling reveals biomarkers and pathways in type 2 diabetes risk. JCI Insight 6. 10.1172/jci.insight.144392. [DOI] [PMC free article] [PubMed] [Google Scholar]
- 48.Van Coster RN, Gerlo EA, Giardina TG, Engelke UF, Smet JE, De Praeter CM, Meersschaut VA, De Meirleir LJ, Seneca SH, Devreese B, et al. (2005). Aminoacylase I deficiency: a novel inborn error of metabolism. Biochem Biophys Res Commun 338, 1322–1326. 10.1016/j.bbrc.2005.10.126. [DOI] [PubMed] [Google Scholar]
- 49.Sass JO, Mohr V, Olbrich H, Engelke U, Horvath J, Fliegauf M, Loges NT, Schweitzer-Krantz S, Moebus R, Weiler P, et al. (2006). Mutations in ACY1, the gene encoding aminoacylase 1, cause a novel inborn error of metabolism. Am J Hum Genet 78, 401–409. 10.1086/500563. [DOI] [PMC free article] [PubMed] [Google Scholar]
- 50.Sass JO, Olbrich H, Mohr V, Hart C, Woldseth B, Krywawych S, Bjurulf B, Lakhani PK, Buchdahl RM, and Omran H (2007). Neurological findings in aminoacylase 1 deficiency. Neurology 68, 2151–2153. 10.1212/01.wnl.0000264933.56204.e8. [DOI] [PubMed] [Google Scholar]
- 51.Corey KE, Pitts R, Lai M, Loureiro J, Masia R, Osganian SA, Gustafson JL, Hutter MM, Gee DW, Meireles OR, et al. (2022). ADAMTSL2 protein and a soluble biomarker signature identify at-risk non-alcoholic steatohepatitis and fibrosis in adults with NAFLD. J Hepatol 76, 25–33. 10.1016/j.jhep.2021.09.026. [DOI] [PMC free article] [PubMed] [Google Scholar]
- 52.Smith GD, and Ebrahim S (2003). ‘Mendelian randomization’: can genetic epidemiology contribute to understanding environmental determinants of disease? Int J Epidemiol 32, 1–22. 10.1093/ije/dyg070. [DOI] [PubMed] [Google Scholar]
- 53.Burgess S, Butterworth A, and Thompson SG (2013). Mendelian randomization analysis with multiple genetic variants using summarized data. Genet Epidemiol 37, 658–665. 10.1002/gepi.21758. [DOI] [PMC free article] [PubMed] [Google Scholar]
- 54.Davey Smith G, and Hemani G (2014). Mendelian randomization: genetic anchors for causal inference in epidemiological studies. Hum Mol Genet 23, R89–98. 10.1093/hmg/ddu328. [DOI] [PMC free article] [PubMed] [Google Scholar]
- 55.Burgess S, and Thompson SG (2015). Mendelian Randomization: Methods for Using Genetic Variants in Causal Estimation (CRC Press; ). [Google Scholar]
- 56.Burgess S, Bowden J, Fall T, Ingelsson E, and Thompson SG (2017). Sensitivity Analyses for Robust Causal Inference from Mendelian Randomization Analyses with Multiple Genetic Variants. Epidemiology 28, 30–42. 10.1097/EDE.0000000000000559. [DOI] [PMC free article] [PubMed] [Google Scholar]
- 57.Burgess S, Davey Smith G, Davies NM, Dudbridge F, Gill D, Glymour MM, Hartwig FP, Holmes MV, Minelli C, Relton CL, and Theodoratou E (2019). Guidelines for performing Mendelian randomization investigations. Wellcome Open Res 4, 186. 10.12688/wellcomeopenres.15555.2. [DOI] [PMC free article] [PubMed] [Google Scholar]
- 58.Burgess S, Thompson SG, and Collaboration CCG (2011). Avoiding bias from weak instruments in Mendelian randomization studies. Int J Epidemiol 40, 755–764. 10.1093/ije/dyr036. [DOI] [PubMed] [Google Scholar]
- 59.Han C (2008). Detecting invalid instruments using L1-GMM. Economics Letters. [Google Scholar]
- 60.Bowden J, Davey Smith G, Haycock PC, and Burgess S (2016). Consistent Estimation in Mendelian Randomization with Some Invalid Instruments Using a Weighted Median Estimator. Genet Epidemiol 40, 304–314. 10.1002/gepi.21965. [DOI] [PMC free article] [PubMed] [Google Scholar]
- 61.Bowden J, Davey Smith G, and Burgess S (2015). Mendelian randomization with invalid instruments: effect estimation and bias detection through Egger regression. Int J Epidemiol 44, 512–525. 10.1093/ije/dyv080. [DOI] [PMC free article] [PubMed] [Google Scholar]
- 62.Wensley F, Gao P, Burgess S, Kaptoge S, Di Angelantonio E, Shah T, Engert JC, Clarke R, Davey-Smith G, Nordestgaard BG, et al. (2011). Association between C reactive protein and coronary heart disease: mendelian randomisation analysis based on individual participant data. BMJ 342, d548. 10.1136/bmj.d548. [DOI] [PMC free article] [PubMed] [Google Scholar]
- 63.Sarwar N, Butterworth AS, Freitag DF, Gregson J, Willeit P, Gorman DN, Gao P, Saleheen D, Rendon A, Nelson CP, et al. (2012). Interleukin-6 receptor pathways in coronary heart disease: a collaborative meta-analysis of 82 studies. Lancet 379, 1205–1213. 10.1016/S0140-6736(11)61931-4. [DOI] [PMC free article] [PubMed] [Google Scholar]
- 64.Mokry LE, Ross S, Ahmad OS, Forgetta V, Smith GD, Goltzman D, Leong A, Greenwood CM, Thanassoulis G, and Richards JB (2015). Vitamin D and Risk of Multiple Sclerosis: A Mendelian Randomization Study. PLoS Med 12, e1001866. 10.1371/journal.pmed.1001866. [DOI] [PMC free article] [PubMed] [Google Scholar]
- 65.Franekova V, Angin Y, Hoebers NT, Coumans WA, Simons PJ, Glatz JF, Luiken JJ, and Larsen TS (2015). Marine omega-3 fatty acids prevent myocardial insulin resistance and metabolic remodeling as induced experimentally by high insulin exposure. Am J Physiol Cell Physiol 308, C297–307. 10.1152/ajpcell.00073.2014. [DOI] [PubMed] [Google Scholar]
- 66.Glatz JF, and Luiken JJ (2015). Fatty acids in cell signaling: historical perspective and future outlook. Prostaglandins Leukot Essent Fatty Acids 92, 57–62. 10.1016/j.plefa.2014.02.007. [DOI] [PubMed] [Google Scholar]
- 67.Cruz DE, Tahir UA, Hu J, Ngo D, Chen ZZ, Robbins JM, Katz D, Balasubramanian R, Peterson B, Deng S, et al. (2022). Metabolomic Analysis of Coronary Heart Disease in an African American Cohort From the Jackson Heart Study. JAMA Cardiol 7, 184–194. 10.1001/jamacardio.2021.4925. [DOI] [PMC free article] [PubMed] [Google Scholar]
- 68.Tahir UA, Katz DH, Zhao T, Ngo D, Cruz DE, Robbins JM, Chen ZZ, Peterson B, Benson MD, Shi X, et al. (2021). Metabolomic Profiles and Heart Failure Risk in Black Adults: Insights From the Jackson Heart Study. Circ Heart Fail 14, e007275. 10.1161/CIRCHEARTFAILURE.120.007275. [DOI] [PMC free article] [PubMed] [Google Scholar]
- 69.Demers A, Samami S, Lauzier B, Des Rosiers C, Ngo Sock ET, Ong H, and Mayer G (2015). PCSK9 Induces CD36 Degradation and Affects Long-Chain Fatty Acid Uptake and Triglyceride Metabolism in Adipocytes and in Mouse Liver. Arterioscler Thromb Vasc Biol 35, 2517–2525. 10.1161/ATVBAHA.115.306032. [DOI] [PubMed] [Google Scholar]
- 70.Hamilton RL, and Fielding PE (1989). Nascent very low density lipoproteins from rat hepatocytic Golgi fractions are enriched in phosphatidylethanolamine. Biochem Biophys Res Commun 160, 162–173. 10.1016/0006-291x(89)91635-5. [DOI] [PubMed] [Google Scholar]
- 71.Agren JJ, Kurvinen JP, and Kuksis A (2005). Isolation of very low density lipoprotein phospholipids enriched in ethanolamine phospholipids from rats injected with Triton WR 1339. Biochim Biophys Acta 1734, 34–43. 10.1016/j.bbalip.2005.02.001. [DOI] [PubMed] [Google Scholar]
- 72.Fang W, Deng Z, Benadjaoud F, Yang C, and Shi GP (2020). Cathepsin B deficiency ameliorates liver lipid deposition, inflammatory cell infiltration, and fibrosis after diet-induced nonalcoholic steatohepatitis. Transl Res 222, 28–40. 10.1016/j.trsl.2020.04.011. [DOI] [PMC free article] [PubMed] [Google Scholar]
- 73.Thibeaux S, Siddiqi S, Zhelyabovska O, Moinuddin F, Masternak MM, and Siddiqi SA (2018). Cathepsin B regulates hepatic lipid metabolism by cleaving liver fatty acid-binding protein. J Biol Chem 293, 1910–1923. 10.1074/jbc.M117.778365. [DOI] [PMC free article] [PubMed] [Google Scholar]
- 74.Fabre AC, Vantourout P, Champagne E, Tercé F, Rolland C, Perret B, Collet X, Barbaras R, and Martinez LO (2006). Cell surface adenylate kinase activity regulates the F(1)-ATPase/P2Y (13)-mediated HDL endocytosis pathway on human hepatocytes. Cell Mol Life Sci 63, 2829–2837. 10.1007/s00018-006-6325-y. [DOI] [PMC free article] [PubMed] [Google Scholar]
- 75.Yegutkin GG, Henttinen T, Samburski SS, Spychala J, and Jalkanen S (2002). The evidence for two opposite, ATP-generating and ATP-consuming, extracellular pathways on endothelial and lymphoid cells. Biochem J 367, 121–128. 10.1042/BJ20020439. [DOI] [PMC free article] [PubMed] [Google Scholar]
- 76.Zeiner J, Loukovaara S, Losenkova K, Zuccarini M, Korhonen AM, Lehti K, Kauppinen A, Kaarniranta K, Müller CE, Jalkanen S, and Yegutkin GG (2019). Soluble and membrane-bound adenylate kinase and nucleotidases augment ATP-mediated inflammation in diabetic retinopathy eyes with vitreous hemorrhage. J Mol Med (Berl) 97, 341–354. 10.1007/s00109-018-01734-0. [DOI] [PMC free article] [PubMed] [Google Scholar]
- 77.Sommer A, Christensen E, Schwenger S, Seul R, Haas D, Olbrich H, Omran H, and Sass JO (2011). The molecular basis of aminoacylase 1 deficiency. Biochim Biophys Acta 1812, 685–690. 10.1016/j.bbadis.2011.03.005. [DOI] [PubMed] [Google Scholar]
- 78.Mistry JJ, Hellmich C, Moore JA, Jibril A, Macaulay I, Moreno-Gonzalez M, Di Palma F, Beraza N, Bowles KM, and Rushworth SA (2021). Free fatty-acid transport via CD36 drives β-oxidation-mediated hematopoietic stem cell response to infection. Nat Commun 12, 7130. 10.1038/s41467-021-27460-9. [DOI] [PMC free article] [PubMed] [Google Scholar]
- 79.Ye H, Adane B, Khan N, Sullivan T, Minhajuddin M, Gasparetto M, Stevens B, Pei S, Balys M, Ashton JM, et al. (2016). Leukemic Stem Cells Evade Chemotherapy by Metabolic Adaptation to an Adipose Tissue Niche. Cell Stem Cell 19, 23–37. 10.1016/j.stem.2016.06.001. [DOI] [PMC free article] [PubMed] [Google Scholar]
- 80.Coort SL, Hasselbaink DM, Koonen DP, Willems J, Coumans WA, Chabowski A, van der Vusse GJ, Bonen A, Glatz JF, and Luiken JJ (2004). Enhanced sarcolemmal FAT/CD36 content and triacylglycerol storage in cardiac myocytes from obese zucker rats. Diabetes 53, 1655–1663. 10.2337/diabetes.53.7.1655. [DOI] [PubMed] [Google Scholar]
- 81.Daquinag AC, Gao Z, Fussell C, Immaraj L, Pasqualini R, Arap W, Akimzhanov AM, Febbraio M, and Kolonin MG (2021). Fatty acid mobilization from adipose tissue is mediated by CD36 posttranslational modifications and intracellular trafficking. JCI Insight 6. 10.1172/jci.insight.147057. [DOI] [PMC free article] [PubMed] [Google Scholar]
- 82.Podrez EA, Poliakov E, Shen Z, Zhang R, Deng Y, Sun M, Finton PJ, Shan L, Febbraio M, Hajjar DP, et al. (2002). A novel family of atherogenic oxidized phospholipids promotes macrophage foam cell formation via the scavenger receptor CD36 and is enriched in atherosclerotic lesions. J Biol Chem 277, 38517–38523. 10.1074/jbc.M205924200. [DOI] [PubMed] [Google Scholar]
- 83.Guy E, Kuchibhotla S, Silverstein R, and Febbraio M (2007). Continued inhibition of atherosclerotic lesion development in long term Western diet fed CD36o /apoEo mice. Atherosclerosis 192, 123–130. 10.1016/j.atherosclerosis.2006.07.015. [DOI] [PubMed] [Google Scholar]
- 84.Chen ZZ, Gao Y, Keyes MJ, Deng S, Mi M, Farrell LA, Shen D, Tahir UA, Cruz DE, Ngo D, et al. (2023). Protein Markers of Diabetes Discovered in an African American Cohort. Diabetes. 10.2337/db22-0710. [DOI] [PMC free article] [PubMed] [Google Scholar]
- 85.Chen ZZ, Pacheco JA, Gao Y, Deng S, Peterson B, Shi X, Zheng S, Tahir UA, Katz DH, Cruz DE, et al. (2022). Nontargeted and Targeted Metabolomic Profiling Reveals Novel Metabolite Biomarkers of Incident Diabetes in African Americans. Diabetes 71, 2426–2437. 10.2337/db22-0033. [DOI] [PMC free article] [PubMed] [Google Scholar]
- 86.Bezanson J, Karpinski S, Shah VB, and Edelman A Julia: A Fast Dynamic Language for Technical Computing. [Google Scholar]
- 87.Bouchard C, Leon AS, Rao DC, Skinner JS, Wilmore JH, and Gagnon J (1995). The HERITAGE family study. Aims, design, and measurement protocol. Med Sci Sports Exerc 27, 721–729. [PubMed] [Google Scholar]
- 88.Bild DE, Bluemke DA, Burke GL, Detrano R, Diez Roux AV, Folsom AR, Greenland P, Jacob DR, Kronmal R, Liu K, et al. (2002). Multi-Ethnic Study of Atherosclerosis: objectives and design. Am J Epidemiol 156, 871–881. 10.1093/aje/kwf113. [DOI] [PubMed] [Google Scholar]
- 89.Isezuo SA (2005). Is high density lipoprotein cholesterol useful in diagnosis of metabolic syndrome in native Africans with type 2 diabetes? Ethn Dis 15, 6–10. [PubMed] [Google Scholar]
- 90.Katz DH, Tahir UA, Ngo D, Benson MD, Gao Y, Shi X, Nayor M, Keyes MJ, Larson MG, Hall ME, et al. (2021). Multiomic Profiling in Black and White Populations Reveals Novel Candidate Pathways in Left Ventricular Hypertrophy and Incident Heart Failure Specific to Black Adults. Circ Genom Precis Med 14, e003191. 10.1161/CIRCGEN.120.003191. [DOI] [PMC free article] [PubMed] [Google Scholar]
- 91.Ngo D, Sinha S, Shen D, Kuhn EW, Keyes MJ, Shi X, Benson MD, O’Sullivan JF, Keshishian H, Farrell LA, et al. (2016). Aptamer-Based Proteomic Profiling Reveals Novel Candidate Biomarkers and Pathways in Cardiovascular Disease. Circulation 134, 270–285. 10.1161/CIRCULATIONAHA.116.021803. [DOI] [PMC free article] [PubMed] [Google Scholar]
- 92.Raffield LM, Dang H, Pratte KA, Jacobson S, Gillenwater LA, Ampleford E, Barjaktarevic I, Basta P, Clish CB, Comellas AP, et al. (2020). Comparison of Proteomic Assessment Methods in Multiple Cohort Studies. Proteomics 20, e1900278. 10.1002/pmic.201900278. [DOI] [PMC free article] [PubMed] [Google Scholar]
- 93.Robbins JM, Peterson B, Schranner D, Tahir UA, Rienmüller T, Deng S, Keyes MJ, Katz DH, Beltran PMJ, Barber JL, et al. (2021). Human plasma proteomic profiles indicative of cardiorespiratory fitness. Nat Metab 3, 786–797. 10.1038/s42255-021-00400-z. [DOI] [PMC free article] [PubMed] [Google Scholar]
- 94.Robbins JM, Herzig M, Morningstar J, Sarzynski MA, Cruz DE, Wang TJ, Gao Y, Wilson JG, Bouchard C, Rankinen T, and Gerszten RE (2019). Association of Dimethylguanidino Valeric Acid With Partial Resistance to Metabolic Health Benefits of Regular Exercise. JAMA Cardiol 4, 636–643. 10.1001/jamacardio.2019.1573. [DOI] [PMC free article] [PubMed] [Google Scholar]
- 95.Raffield LM, Zakai NA, Duan Q, Laurie C, Smith JD, Irvin MR, Doyle MF, Naik RP, Song C, Manichaikul AW, et al. (2017). D-Dimer in African Americans: Whole Genome Sequence Analysis and Relationship to Cardiovascular Disease Risk in the Jackson Heart Study. Arterioscler Thromb Vasc Biol 37, 2220–2227. 10.1161/ATVBAHA.117.310073. [DOI] [PMC free article] [PubMed] [Google Scholar]
- 96.Schwarzer G, Carpenter JR, Rücker G, and SpringerLink. (2015). Meta-Analysis with R, 1st 2015. Edition (Springer International Publishing : Imprint: Springer; ). [Google Scholar]
- 97.Zhao S, Guo Y, Sheng Q, and Shyr Y (2014). Advanced heat map and clustering analysis using heatmap3. Biomed Res Int 2014, 986048. 10.1155/2014/986048. [DOI] [PMC free article] [PubMed] [Google Scholar]
- 98.Fahy E, and Subramaniam S (2020). RefMet: a reference nomenclature for metabolomics. Nat Methods 17, 1173–1174. 10.1038/s41592-020-01009-y. [DOI] [PubMed] [Google Scholar]
- 99.Gaunt TR, Rodríguez S, and Day IN (2007). Cubic exact solutions for the estimation of pairwise haplotype frequencies: implications for linkage disequilibrium analyses and a web tool ‘CubeX’. BMC Bioinformatics 8, 428. 10.1186/1471-2105-8-428. [DOI] [PMC free article] [PubMed] [Google Scholar]
- 100.Chang CC, Chow CC, Tellier LC, Vattikuti S, Purcell SM, and Lee JJ (2015). Second-generation PLINK: rising to the challenge of larger and richer datasets. Gigascience 4, 7. 10.1186/s13742-015-0047-8. [DOI] [PMC free article] [PubMed] [Google Scholar]
- 101.Purcell S, and Chang C PLINK 1.9. [Google Scholar]
- 102.Yavorska OO, and Burgess S (2017). MendelianRandomization: an R package for performing Mendelian randomization analyses using summarized data. Int J Epidemiol 46, 1734–1739. 10.1093/ije/dyx034. [DOI] [PMC free article] [PubMed] [Google Scholar]
- 103.Gentleman RC, Carey VJ, Bates DM, Bolstad B, Dettling M, Dudoit S, Ellis B, Gautier L, Ge Y, Gentry J, et al. (2004). Bioconductor: open software development for computational biology and bioinformatics. Genome Biol 5, R80. 10.1186/gb-2004-5-10-r80. [DOI] [PMC free article] [PubMed] [Google Scholar]
Associated Data
This section collects any data citations, data availability statements, or supplementary materials included in this article.
Supplementary Materials
Data S1. Unprocessed source data underlying all graphs. Related to Figures 2–5 and Supplemental Figure 1.
Supplemental Tables 1a, 1b. Study Participant Baseline Characteristics. Related to Figure 1.
Supplemental Table 2. Somalogic Proteomics Information. Related to Figure 1.
Supplemental Table 3. LC-MS Metabolomics Information. Related to Figure 1.
Supplemental Table 5. Protein-Metabolite Enrichment Data. Related to Figure 3.
Supplemental Table 6. Protein-Metabolite Mendelian Randomization Data. Related to Figure 4.
Supplemental Table 7. JHS MR Genetic Instruments. Related to Figure 4.
Supplemental Table 8. MESA MR Genetic Instruments. Related to Figure 4.
Supplemental Table 9. HERITAGE MR Genetic Instruments. Related to Figure 4.
Supplemental Table 10. Mouse Knockout Plasma Metabolomics Data. Related to Figure 5.
Supplemental Table 4. Protein-Metabolite Correlation Data. Related to Figure 2.
Data Availability Statement
Individual-level metabolomic, proteomic, and genomic data from JHS, MESA, and the HERITAGE Family study are available through application to the respective cohorts. All protein-metabolite association data, including pairwise Pearson correlation, enrichment, and Mendelian Randomization data, are included in the article and Supplemental Data. An excel file containing the values that were used to create all graphs in the article are available in Data S1 – Source Data. Data are also available through a Shiny app user interface that can be accessed through the following link: https://github.com/aeisman/protein-metabolite. Any additional information required to reanalyze the data reported in this paper is available from the lead contact upon request.
All analyses except where specifically noted were performed using code written in The Julia Programming Language86 and R project for statistical computing. All original code has been deposited at https://github.com/aeisman/protein-metabolite and is publicly available as of the date of publication. DOIs are listed in the key resources table.
Any additional information required to reanalyze the data reported in this paper is available from the lead contact upon request.
Key resources table.
| REAGENT or RESOURCE | SOURCE | IDENTIFIER |
|---|---|---|
| Antibodies | ||
| Bacterial and virus strains | ||
| Biological samples | ||
| Chemicals, peptides, and recombinant proteins | ||
| Critical commercial assays | ||
| Deposited data | ||
| Experimental models: Cell lines | ||
| Experimental models: Organisms/strains | ||
| B6.129P2-Apoetm1Unc/J | Jackson Labs | RRID:IMSR_JAX:002052 |
| B6.129S1-Cd36tm1Mfe/J | Jackson Labs | RRID:IMSR_JAX:019006 |
| C57BL/6N-Acy1em1(IMPC)J/Mmucd | The Knockout Mouse Project | RRID:MMRRC_046467-UCD |
| C57BL/6J | Jackson Labs | RRID:IMSR_JAX:000664 |
| Oligonucleotides | ||
| Recombinant DNA | ||
| Software and algorithms | ||
| Original code to perform protein-metabolite association studies | This paper | https://zenodo.org/record/7930898 |
| Other | ||
| protein-metabolite association data | This paper | https://zenodo.org/record/7930898 |