Abstract
Background
Health systems planning is a challenging task, exacerbated by a lack of detailed information on the role played by family physicians, as indicated by practice variations across regions and demographic characteristics. Outcome measures used in past studies of family physician practice patterns were not uniform. Furthermore, past research has generally been limited to narrowly defined geographic regions. A national study of family physician practice patterns was undertaken to allow regional-level comparisons of clinical workload and range of medical services offered.
Methods
The 1997/98 National Family Physician Survey was mailed to a sample of 5198 Canadian family physicians and general practitioners (FP/GPs); the overall response rate was 58.4% (3036 questionnaires returned, of which 3004 were analyzable). Sampling strata were based on College of Family Physicians of Canada (CFPC) membership status and regions of Canada.
Results
Clinical workload varied considerably across the demographic categories studied. Male physicians reported 8.9 more total weekly work hours than female physicians, but the mean number of medical and clinical services offered did not differ between the sexes. Solo practitioners reported 53.8 (95% confidence interval [CI] 52.7–55.0) total weekly work hours, whereas those practising in multidisciplinary clinics reported 45.0 (95% CI 43.2–46.8) hours. FP/GPs in the Atlantic and Prairie provinces reported 5.6 and 5.1 more weekly work hours, respectively, than the national average of 51.4 (95% CI 50.8–52.0) hours. Finally, FP/GPs who served inner-city populations reported 48.6 (95% CI 46.8–50.5) total weekly work hours, whereas those serving rural populations reported 57.0 (95% CI 54.7–59.2) hours. Mean weekly work hours were similar for all age cohorts less than 65 years. FP/GPs practising in less populated provinces and in rural areas reported the highest numbers of work hours, medical services offered and clinical procedures performed.
Interpretation
These data suggest significant variations in FP/GP clinical workload in relation to key demographic variables.
Physician resource planning in Canada is a challenging and inexact science. Past attempts have resulted in variable estimates of the ultimate need for physician services. There is a clear recognition that we need more information than simple head counts of physicians. We need to know, for example, what physicians do and how they work with other physicians, and we need to identify regional variations and differences in practice patterns.
Past studies of family physician practice patterns have measured workload in terms of hours worked,1,2,3 number of patient visits,2,3 billings to health insurance plans4,5 and range of clinical procedures performed.5,6,7 These outcomes have been analyzed in relation to practice setting,1,2,6,7 geographic physician density,4,5 sex,1,2,3,4,5,6,7 age,1,2,4,5,7 years in practice3,6 and type of practice.1,2,3,6,7
Although past studies have proven useful in describing the significant relations that exist between physician workloads and demographic characteristics, they have not addressed the broader issue of access to family physicians' services throughout Canada. By gathering uniform information from family doctors across the country, the College of Family Physicians of Canada (CFPC) National Family Physician Survey (NFPS) addresses this information gap. In this report we present the results of the 1997/98 NFPS, describing physician workload measures in relation to a comprehensive set of demographic variables.
Methods
A stratified random sample of 5198 family physicians and general practitioners (FP/GPs) was used for the 1997/98 NFPS. Sampling strata were based on CFPC membership status and regional setting. The Southam Medical Database and the CFPC membership database were used to select only FP/GPs engaged in active practice in Canada.
Records within the final data set were weighted to reflect known FP/GP distributions, with respect to the sampling strata, at the time of the survey. Ninety-five percent confidence intervals (95% CIs) are given for all point estimates. Complete methodological details of the 1997/98 NFPS appear elsewhere in the medical literature8 and are also available on the CFPC Web site.9
The demographic characteristics studied were age, sex, medical practice setting, primary population served and regional setting. Respondents who indicated more than one type of medical practice were assigned exclusively to their primary category for analysis of this variable. Also, 9.1% of respondents indicated that they served more than one geographic population (e.g., inner city and urban). These respondents were excluded for analysis of this variable.
Results
The overall survey response rate was 58.4% (3036 questionnaires returned, of which 3004 were analyzable). The precision of regional estimates ranged from ±12.8 percentage points in the Northwest Territories and Yukon to ±4.8 percentage points in Ontario, not including Metro Toronto.
Analysis of basic demographic characteristics suggested no significant difference between the 3004 survey respondents and the randomly selected total sample of 5198: 34.0% of the respondents were female, compared with only 32.4% of the total sample (p = 0.129); 16.6% of respondents and 15.2% of the original sample were classified as rural (i.e., second digit of postal code was 0) (p = 0.09); and exactly the same proportion of both groups were less than 45 years of age, with only minor differences in 10-year age cohorts among those older than 44 years (p = 0.09).
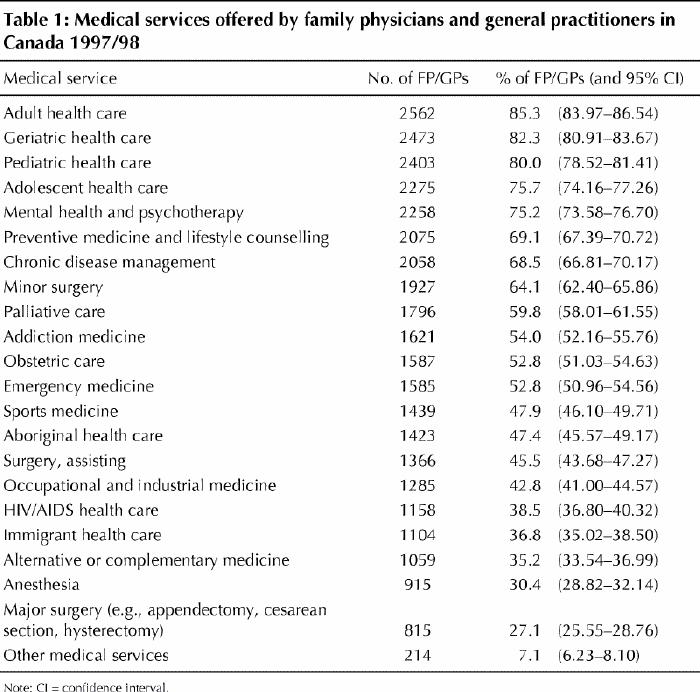
From a list of 22 items, respondents identified which medical services were part of their practice (Table 1). More than half of the respondents reported that they offered specific medical services such as mental health or psychotherapy counselling, minor surgery, palliative care and obstetric care. On average, respondents offered 11.9 (95% CI 11.7–12.2) of the 22 medical services listed.
Table 1

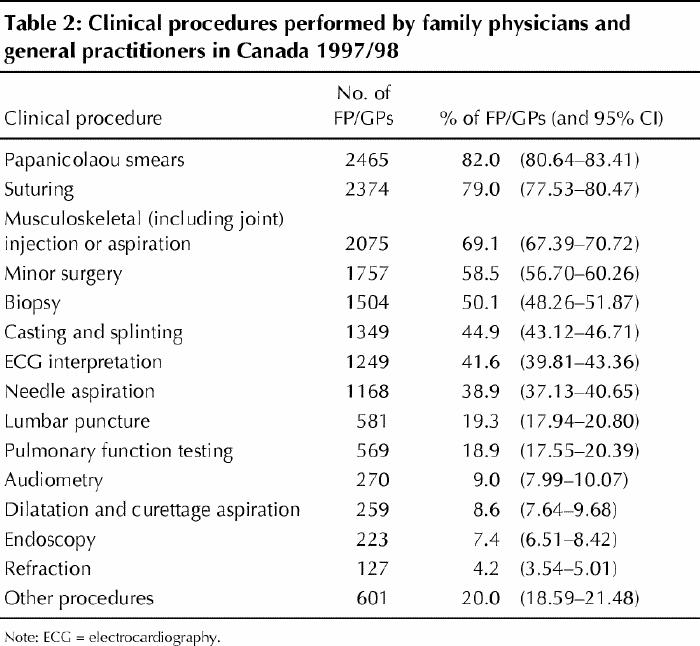
Respondents also identified clinical procedures performed as part of their practice (Table 2). Papanicolaou smears, suturing, and musculoskeletal injection or aspiration were key clinical procedures performed by more than half of the respondents. On average, FP/GPs performed 5.5 (95% CI 5.4–5.6) of the 14 listed clinical procedures.
Table 2

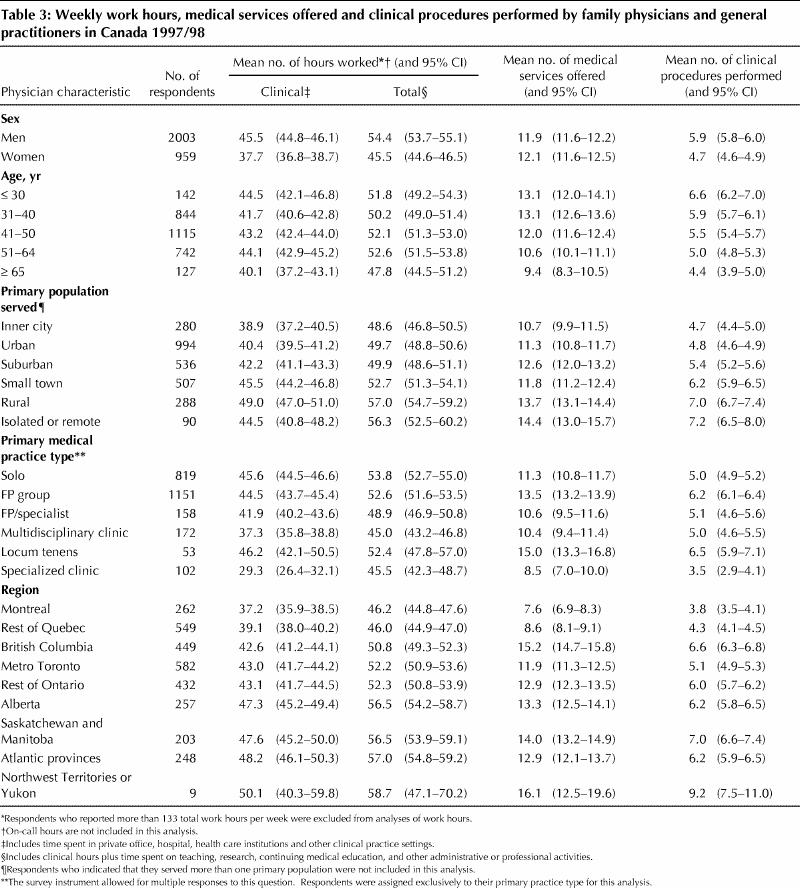
The respondents indicated the number of hours spent weekly in clinical, academic, administrative and other professional activities. Total weekly work hours were calculated as the sum of the hours spent weekly on all work activities, excluding on-call work hours. On average, FP/GPs worked 51.4 (95% CI 50.8–52.0) hours per week. This total was divided between clinical (83.3%), academic (7.8%), administrative (6.5%) and other professional (2.5%) activities. Only clinical and total hours are shown in Table 3.
Table 3

Table 3 presents summary statistics for the main outcome variables in relation to key demographic variables. Male respondents reported working, on average, 54.4 (95% CI 53.7–55.1) total hours per week, whereas female respondents reported working 45.5 (95% CI 44.6–46.5) total hours per week. No differences were found between male and female physicians in terms of mean number of medical services offered and clinical procedures performed.
Mean weekly work hours, both clinical and total, were fairly constant for all age groups up to 65 years of age; for older physicians, mean weekly work hours decreased. There was, however, a steady decrease in the mean number of medical services offered and clinical procedures performed by successively older age cohorts (Table 3).
An obvious gradient appeared for all study outcomes in relation to the primary populations served by respondents (Table 3). All outcome measures were greater for those who served populations further away from urban centres. For instance, relative to their inner city counterparts, FP/GPs who served primarily rural populations worked 10.1 (95% CI 7.5–12.8) more clinical hours per week and performed 2.3 (95% CI 1.9–2.8) more clinical procedures.
Table 3 also suggests demographic variations according to region and type of medical practice. FP/GPs in multidisciplinary and specialized clinics tended to report fewer weekly work hours, fewer medical services offered and fewer clinical procedures performed. The regional analysis showed that these same outcome measures were generally highest in the least populated regions, the Atlantic and Prairie provinces.
Interpretation
FP/GPs in less populated provinces and regions tended to work longer hours, offer more medical services and perform more clinical procedures than those in other regions. Also, physicians who served populations further away from the inner city had longer work hours and performed more clinical procedures than those serving populations closer to urban centres. These findings are certainly related to the issues of physician resources, migration, and recruitment and retention in underserviced areas.
Although physicians' age did not surface as a key factor in this study, a number of interesting observations can be made with regard to this variable. In particular, we found that mean total weekly work hours appeared constant across age cohorts. Perhaps younger family doctors choose to work fewer hours and, in so doing, bolster the demand for services provided by aging family doctors. Future surveys of family physicians should help to clarify these data.
The 58.4% response rate may limit the generalizability of the NFPS study results. Demographic characteristics of the survey respondents and the randomly selected sample were similar. Nevertheless, those who did not respond to the survey may be notably different from the respondent group on the basis of other factors that were not measured, a possibility that must be taken into account in attempting to generalize these study results to the entire Canadian FP/GP population.
We have endeavoured to describe family physician workloads, the variety of medical services they offer and the amount of time they spend offering those services. Certain FP/GP subpopulations worked more than an extra day per week delivering twice as many medical services and clinical procedures than other groups. The salient factors were sex, geographic or regional setting, and type of medical practice.
The NFPS provides new information about the contribution of family doctors to Canada's health care system. Because this was a national survey, we have been able to identify important regional variations in FP/GP practice patterns, thus addressing the broader issue of access to family physicians' services in Canada. Family doctors were surveyed again in January 2001 as part of the second NFPS. The new data should serve health information needs by revealing shifts in family physician practice patterns over time.
Footnotes
This article has been peer reviewed.
Contributors: Steve Slade helped to formulate the basic concept for the paper, conducted the statistical analysis, and drafted and revised the manuscript. Nick Busing helped to formulate the basic concept and content for the paper, made contributions to the writing of the paper, and reviewed the original manuscript and all subsequent revisions.
Competing interests: None declared.
Correspondence to: Mr. Steve Slade, Canadian Institute for Health Information, 200-377 Dalhousie St., Ottawa ON K1N 9N8; fax 613 241-8120; sslade@cihi.ca
References
- 1.Taking the pulse: the Canadian Medical Association physician resource survey. Ottawa: Canadian Medical Association; 1997.
- 2.Norton PG, Dunn EV, Soberman L. Family practice in Ontario: how physician demographics affect practice patterns. Can Fam Physician 1994;40:249-56. [PMC free article] [PubMed]
- 3.Bass MJ, McWhinney IR, Stewart M, Grinrod A. Changing face of family practice: trends from 1974 to 1994 in one Canadian city. Can Fam Physician 1998;44:2143-9. [PMC free article] [PubMed]
- 4.Coyte PC, Catz M, Stricker M. Distribution of physicians in Ontario: Where are there too few or too many family physicians and general practitioners? Can Fam Physician 1997;43:677-83,733. [PMC free article] [PubMed]
- 5.Chan B, Anderson GM, Thériault M. High-billing general practitioners and family physicians in Ontario: How do they do it? An analysis of practice patterns of GP/FPs with annual billings over $400 000. CMAJ 1998;158(6):741-6. Abstract and PDF available: www.cmaj.ca/cgi/content/abstract/158/6/741 [PMC free article] [PubMed]
- 6.Wetmore SJ, Agbayani R, Bass MJ. Procedures in ambulatory care: Which family physicians do what in southwestern Ontario? Can Fam Physician 1998;44:521-9. [PMC free article] [PubMed]
- 7.Eliason BC, Lofton SA, Mark DH. Influence of demographics and profitability on physician selection of family practice procedures. J Fam Pract 1994; 39 (4): 341-7. [PubMed]
- 8.Reid AJ, Grava-Gubins I, Carroll JC. Family physicians in maternity care. Still in the game? Can Fam Physician 2000;46:601-11. [PMC free article] [PubMed]
- 9.The CFPC National Family Physician Survey methodology report — October 1998. Mississauga (ON): College of Family Physicians of Canada; 1998. Available: www.cfpc.ca/research/janus/janusmethodscontents.asp (accessed 2002 Mar 20).


