

Abstract
An individual’s disease risk is affected by the populations that they belong to, due to shared genetics and environmental factors. The study of fine-scale populations in clinical care is important for identifying and reducing health disparities and for developing personalized interventions. To assess patterns of clinical diagnoses and healthcare utilization by fine-scale populations, we leveraged genetic data and electronic medical records from 35,968 patients as part of the UCLA ATLAS Community Health Initiative. We defined clusters of individuals using identity by descent, a form of genetic relatedness that utilizes shared genomic segments arising due to a common ancestor. In total, we identified 376 clusters, including clusters with patients of Afro-Caribbean, Puerto Rican, Lebanese Christian, Iranian Jewish and Gujarati ancestry. Our analysis uncovered 1,218 significant associations between disease diagnoses and clusters and 124 significant associations with specialty visits. We also examined the distribution of pathogenic alleles and found 189 significant alleles at elevated frequency in particular clusters, including many that are not regularly included in population screening efforts. Overall, this work progresses the understanding of health in understudied communities and can provide the foundation for further study into health inequities.
Individuals belong to many populations (Fig. 1), each with unique health risks. This can be a consequence of a population’s shared cultural or physical environment, genetics or a combination of both. Structural factors, including racism and socioeconomic status, also shape the health of populations, particularly in the United States1–3. Therefore, understanding population-level differences in disease risk is important for reducing health disparities and developing personalized interventions4,5. New large-scale biobanks tied to electronic health records (EHRs) present an ideal opportunity to study population health6. Previous biobank studies have identified new genetic associations to complex traits7, examined how diseases track through families8 and produced polygenic risk scores for multiple ancestries9.
Fig. 1 |. Definitions of key phrases.
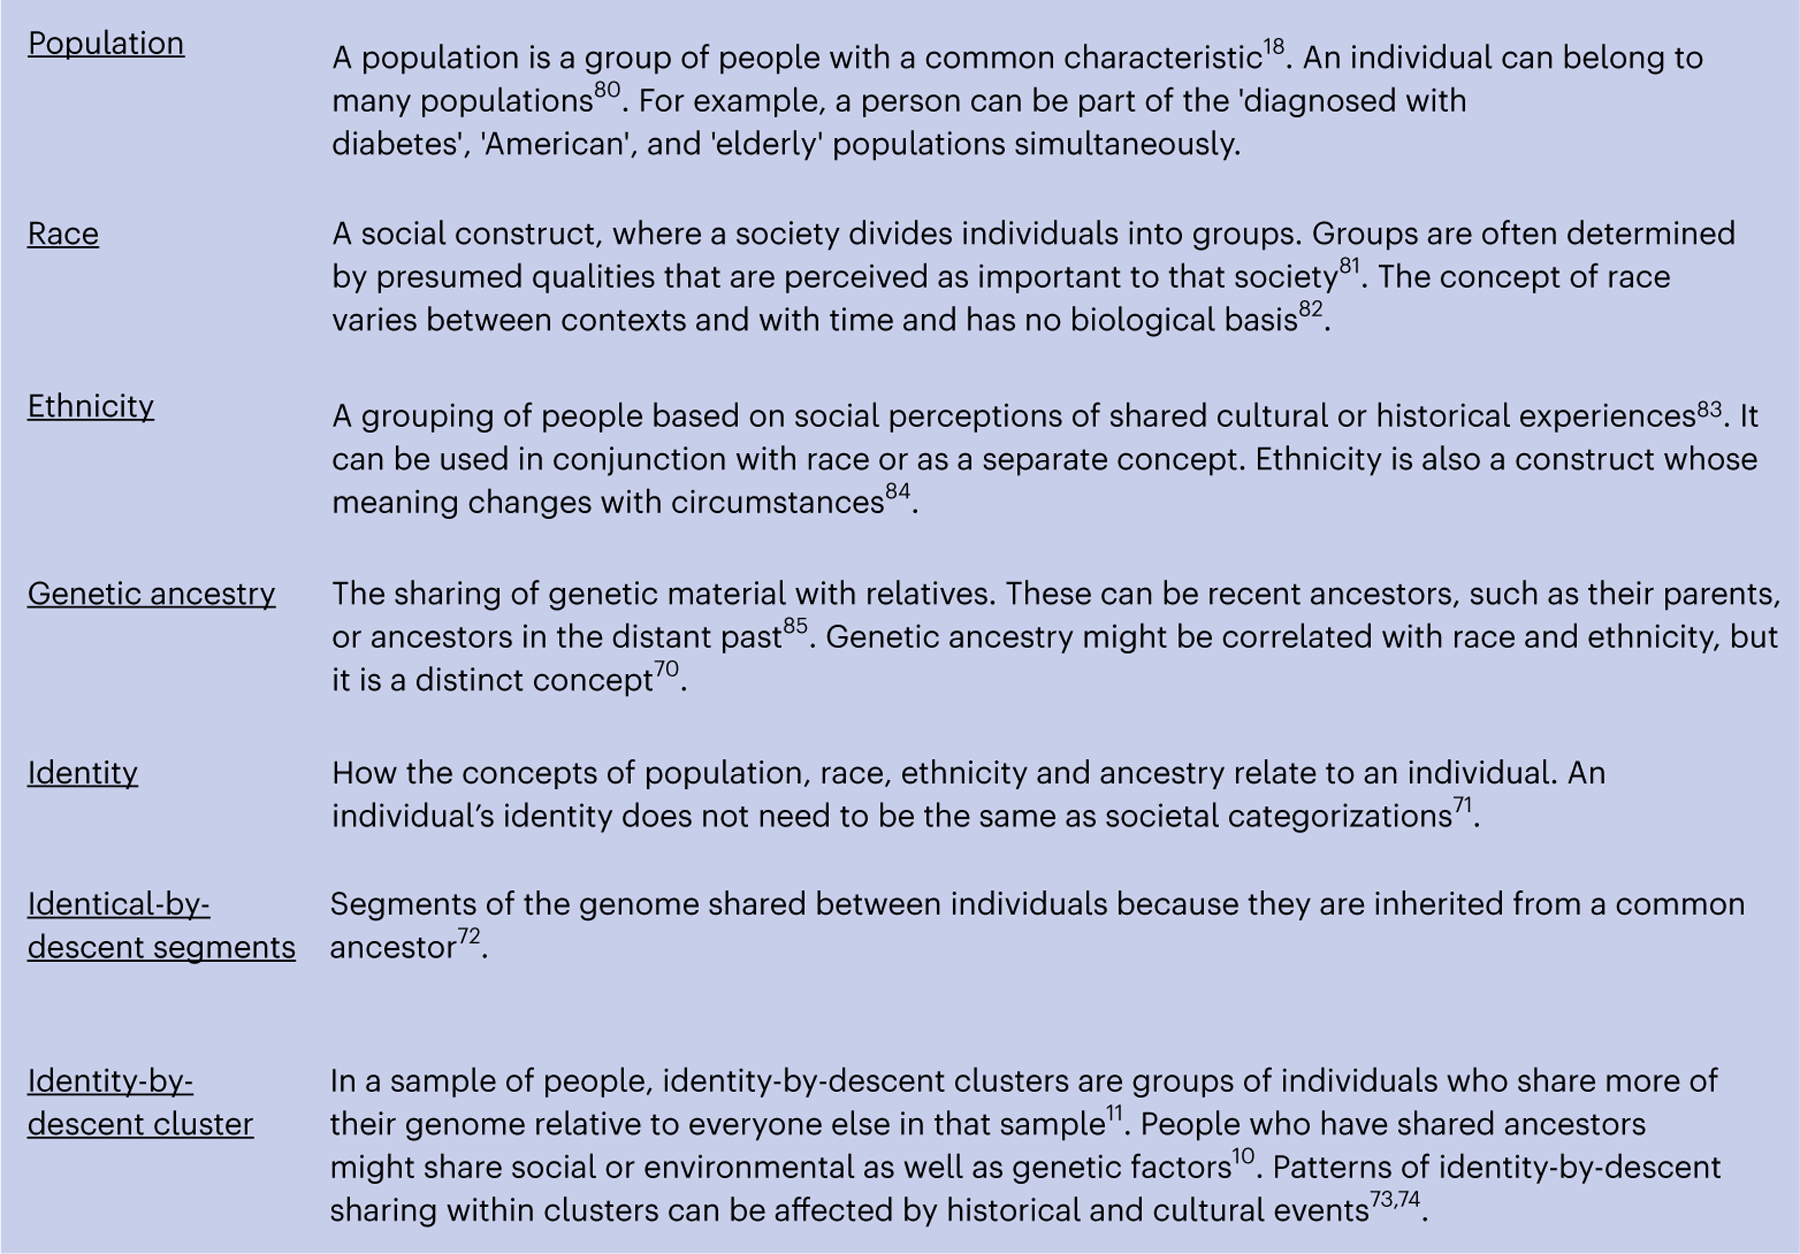
For several frequently used words relating to ancestry and identity, we contextualize each word and provide a working definition.
Our work, as well as other previous work10–14, uses identity-by-descent segments (Fig. 1) to find fine-scale populations who share genetic ancestry in biobanks. Identity-by-descent segments are identical stretches of DNA inherited from a shared ancestor. People whose ancestors lived in the same geographic location or who were part of the same ethnolinguistic group tend to have a greater proportion of their genome identical by descent15. These clusters of people may also share an environment, including structural factors such as discrimination, which can be relevant for understanding why or how patients visit the hospital. We previously showed that individuals within identity-by-descent-based clusters often share clinical diagnoses10. Importantly, we note that identity-by-descent clusters offer one lens into the study of health outcomes alongside others, including socially determined concepts of race and ethnicity (Fig. 1).
In this study, we used identity-by-descent sharing to define fine-scale population clusters and to analyze their health system utilization within the ATLAS Community Health Initiative16 (ATLAS). ATLAS is part of the University of California, Los Angeles (UCLA) health system, located in Los Angeles, a city with a rich history of recent and past immigration17,18. We examined the relationship between identity-by-descent clusters and healthcare system utilization inferred from electronic medical records and we identified thousands of cluster-specific health associations and cluster-specific enrichments of clinically actionable genetic variants. To facilitate the use of the large set of associations, we developed a web framework allowing interactive access to the results presented.
Results
ATLAS Community Health Initiative
The ATLAS Community Health Initiative16 includes 35,968 patients with genotyping and de-identified EHR data (Methods) Patients are diverse both genetically (Extended Data Fig. 1a,b) and in terms of EHR-reported demographic characteristics7. ATLAS demographics are consistent with the overall patient population of UCLA Health (Extended Data Fig. 2a–d), but the demographics of UCLA differ from those of Los Angeles. Socioeconomic factors and racial discrimination strongly influence where people live in Los Angeles, especially as West Los Angeles contains some of the wealthiest zip codes in the nation according to Census and IRS income data19,20 (Extended Data Fig. 2e,f). Despite this, 40% of ATLAS patients identify as a race other than White, making it substantially more diverse than many other biobanks that have participants with predominantly European ancestry21. Some groups, including Middle Eastern and North African (MENA) populations, such as Iranians or Armenians, are not well represented in current biobanks. Thus, ATLAS offers opportunities to study health in diverse communities16.
Identifying fine-scale identity-by-descent clusters
To identify fine-scale clusters, we first inferred patient relationships using identity-by-descent sharing (Fig. 2). Studying identity-by-descent clusters offers advantages over clustering patients through EHR-reported measures alone10. In ATLAS, a large proportion of patients have missing or ‘other race’ specified in their EHR (Extended Data Fig. 2a). Other demographic characteristics may be missing for complex and non-random reasons, and, when included, they are not guaranteed to be accurate10. Therefore, for this study, we focused on groups identified by genetic ancestry. Genetic ancestry is a distinct concept from race, which is a social construct (Fig. 1)22.
Fig. 2 |. An overview of the fine-scale cluster detection approach.
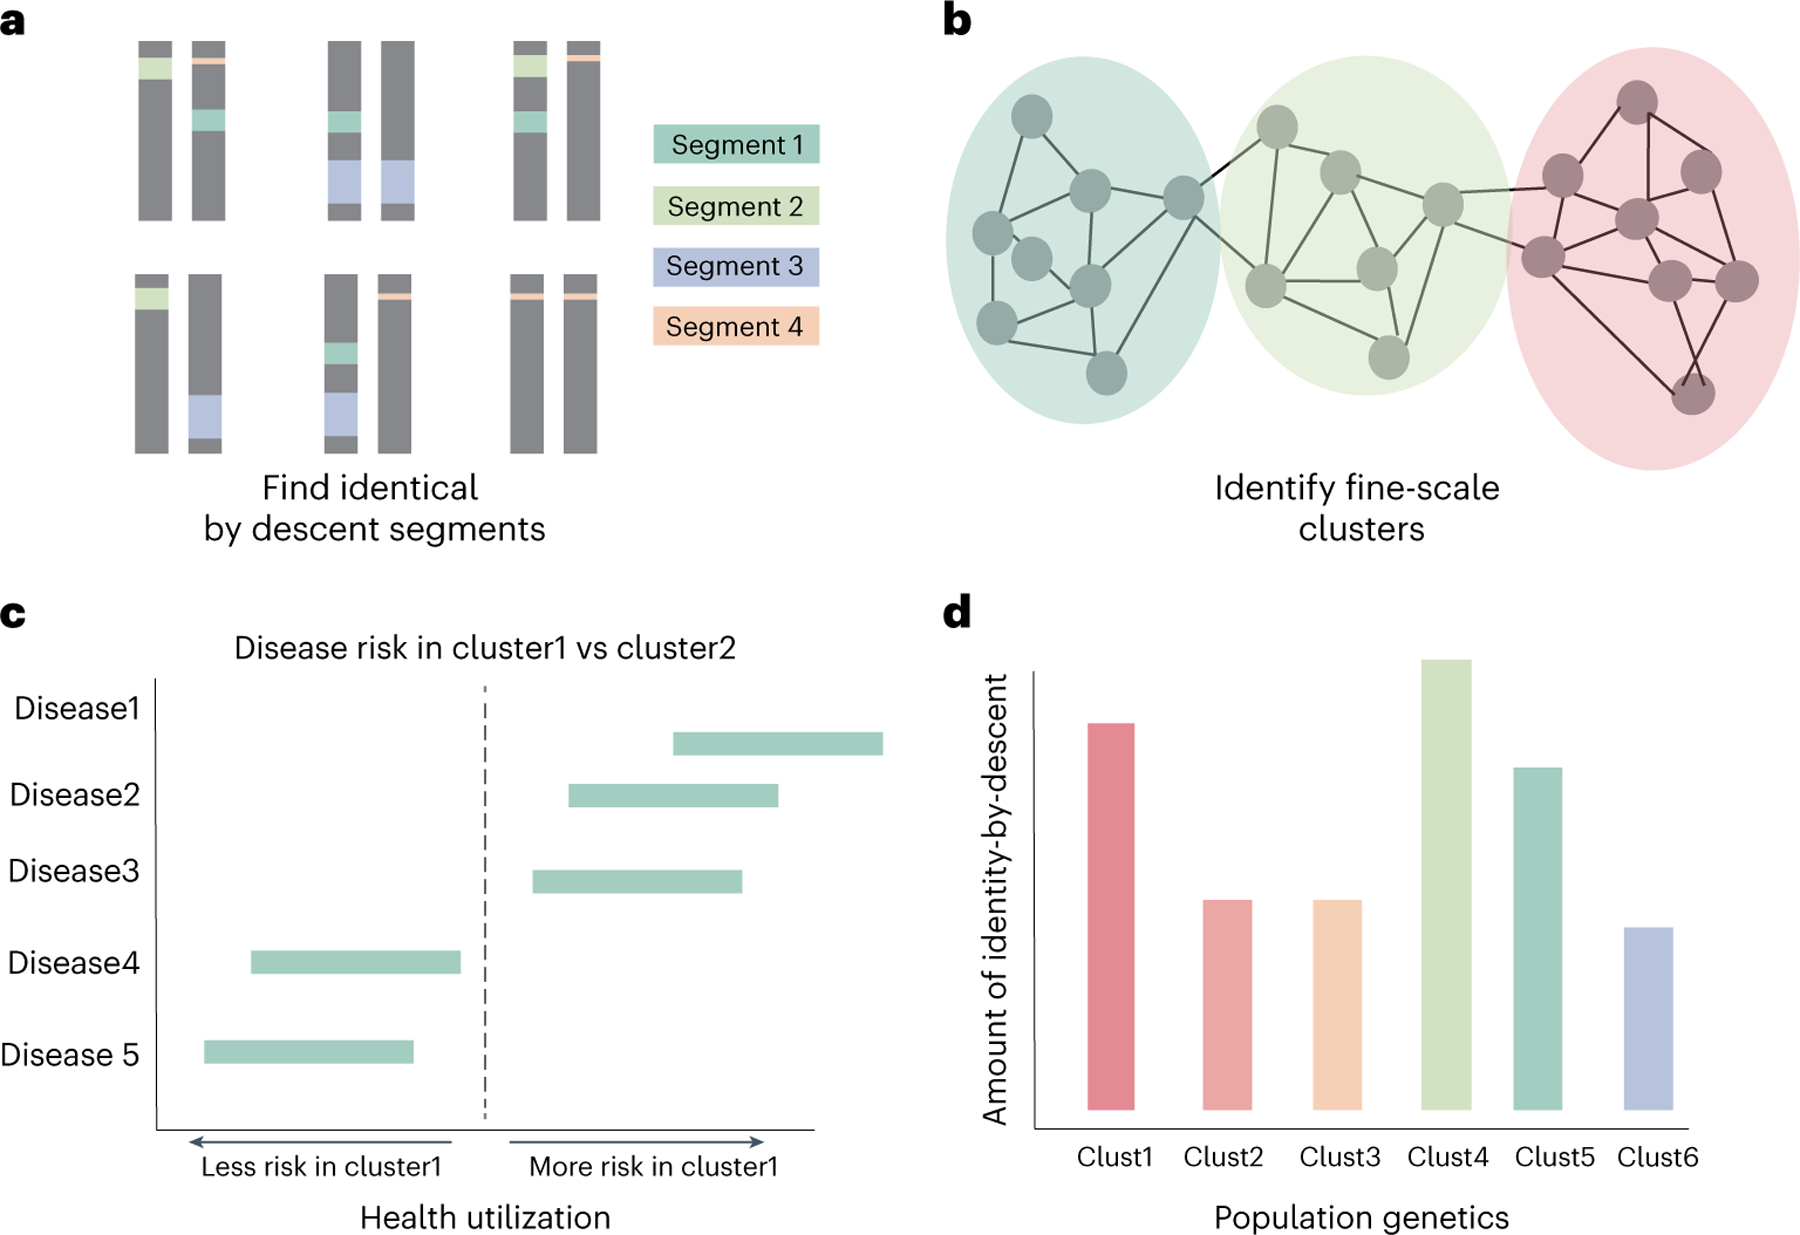
A schematic of identity-by-descent calling and cluster annotation. a, We first inferred identity-by-descent segments for all biobank participants and reference samples. We then identified fine-scale clusters using Louvain clustering (b), and we explored patterns of enrichment for cluster-specific health utilization (c). d, Finally, we measured patterns of genetic relatedness both within and between clusters.
To define the identity-by-descent clusters, we called pairwise identity by descent between all ATLAS participants and reference individuals from the 1000 Genomes Project23, the Simons Genome Diversity Project24 and the Human Genome Diversity Project25. Identity-by-descent segments were estimated using iLASH26, and clusters were identified with the Louvain community detection algorithm27. Sensitivity analyses were performed with additional phasing and identity-by-descent calling algorithms; pairwise identity-by-descent segments were highly concordant between the methods (Pearson’s R2 = 0.91), and alternative clustering algorithms over the alternatively phased data produced similar clusters (Extended Data Fig. 3a–c).
We detected 367 identity-by-descent clusters, each of which was given an identifier determined by three iterations of Louvain clustering (for example, ‘cluster_1_0_2’). There was substantial variation in cluster size, ranging from two to 2,030 individuals. Differences in cluster size, historic population size and complex patterns of genetic relatedness resulted in differential cluster densities. In some clusters, such as cluster 3_8_2, nearly every pair of individuals shared identity-by-descent segments (Extended Data Fig. 3d), whereas, in other clusters, such as cluster 1_6_10 or cluster 5_7_0, individuals shared fewer connections (Extended Data Fig. 3e,f). Admixture analysis28 revealed substantial genetic diversity between the clusters, with continental ancestry sources from the Americas, West Asia, Europe, Africa, East Asia and South Asia (Fig. 3a).
Fig. 3 |. Genetic and demographic properties of clusters.
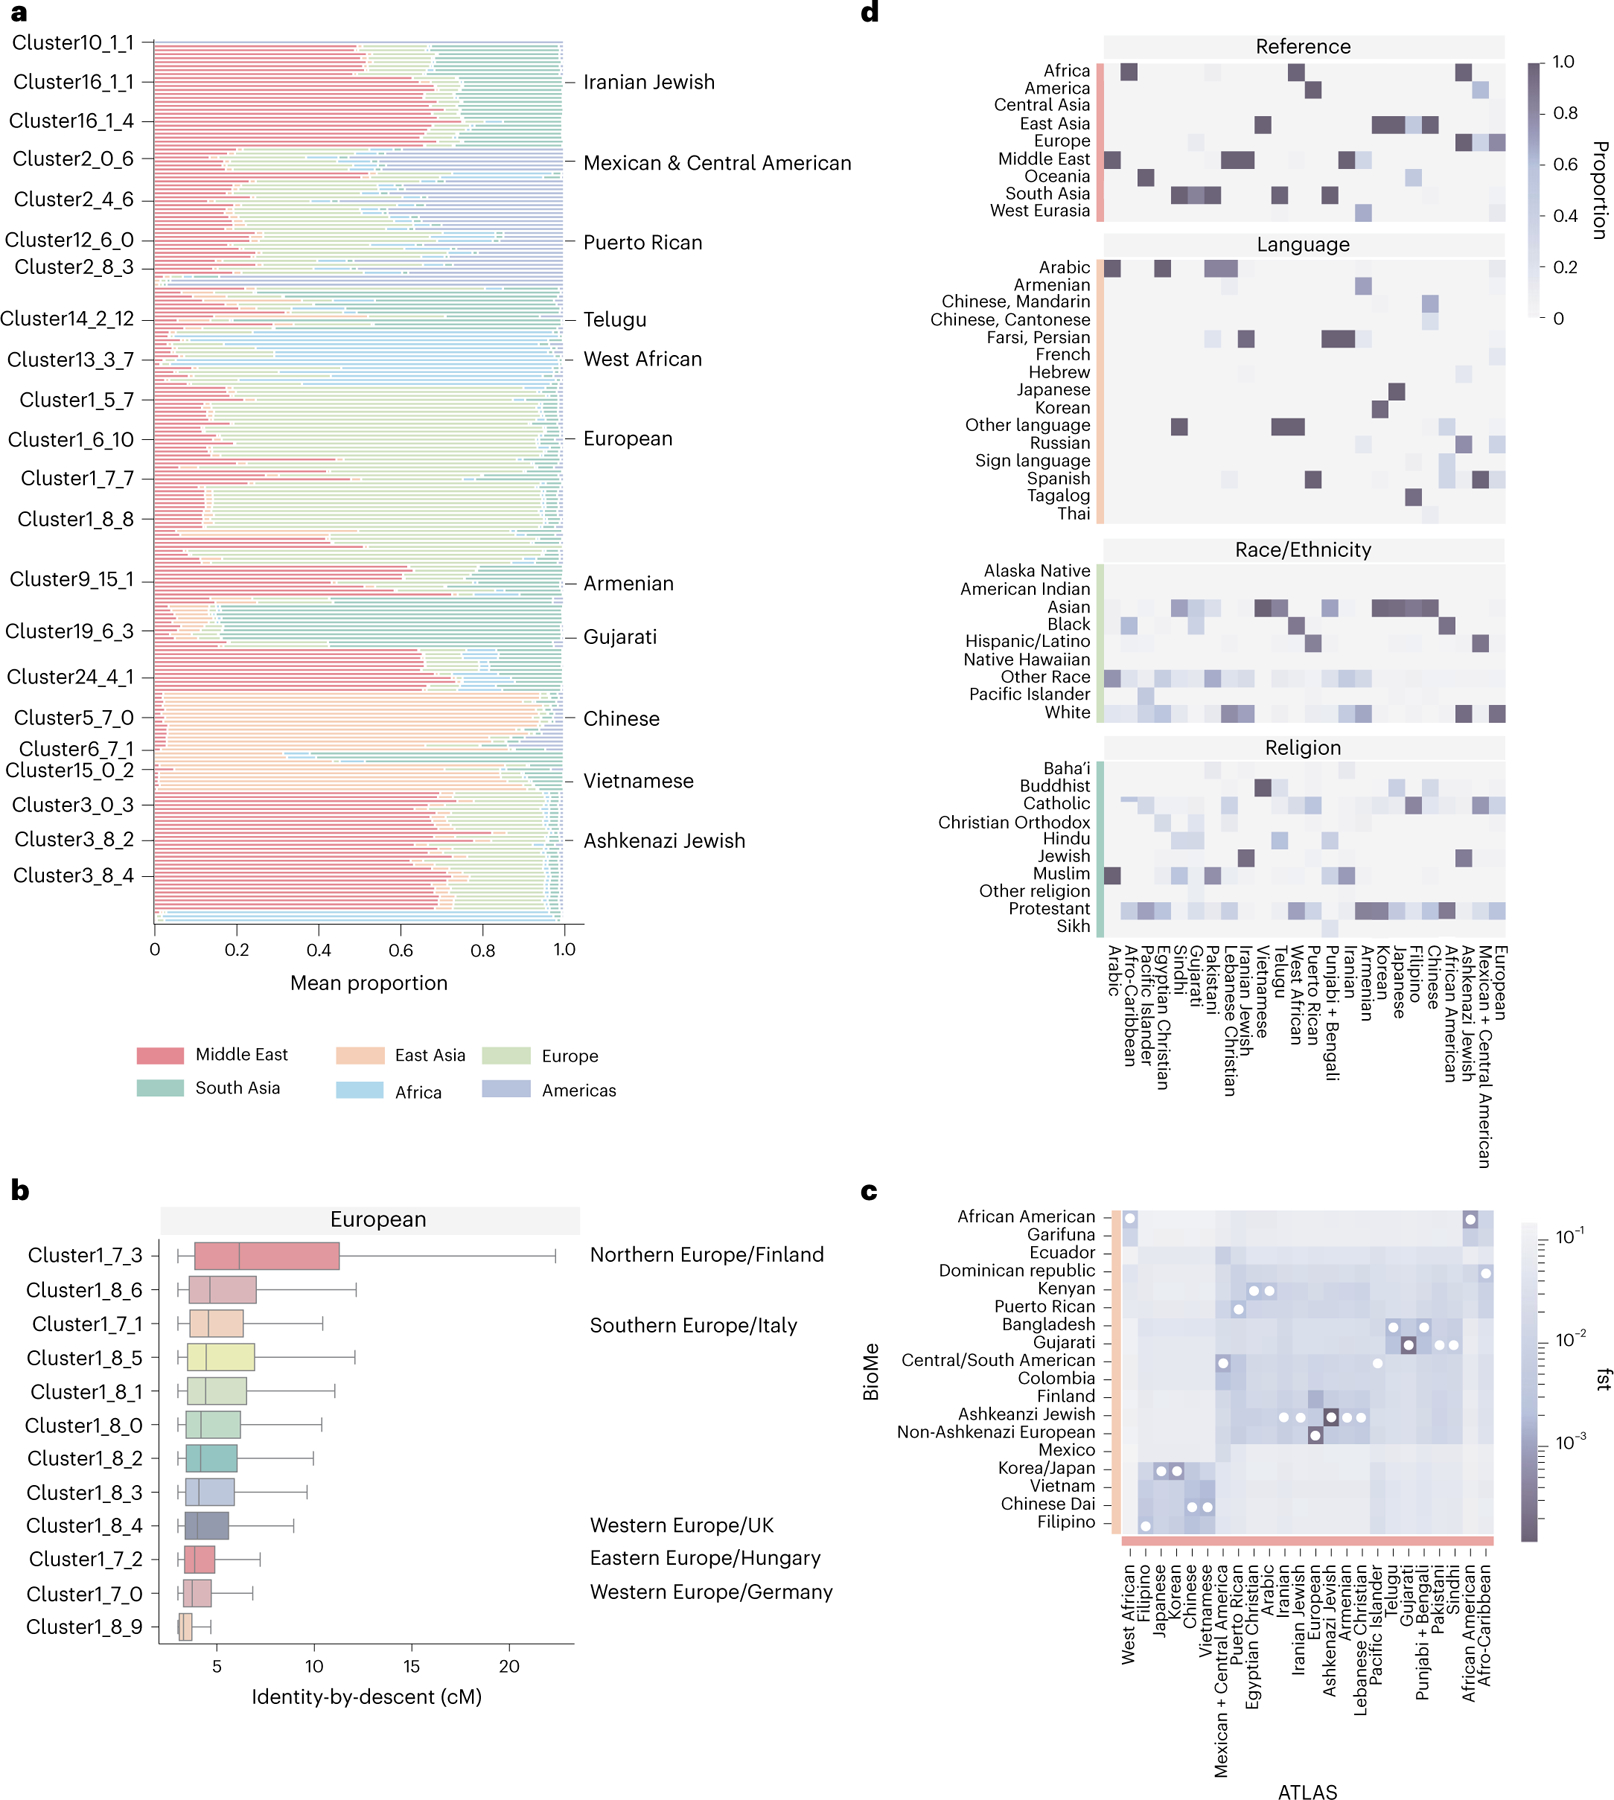
a, The mean admixture fractions for each of the identity-by-descent clusters. Each line corresponds to one ATLAS cluster. The components refer to genetic ancestry from the Middle East, East Asia, Europe, South or Central Asia, Africa and the Americas. The left column indicates the identity-by-decent cluster number, and the right column gives examples of names given to the largest clusters. b, The distribution of identity by descent within subclusters that were merged to make one European cluster (n = 17,017). The names on the left indicates the identity-by-descent cluster number, and the name on the right indicates relatedness from comparison with the UK BioBank. The center line of the box indicates the mean; the outer edges of the box indicate the upper and lower quartiles; and the whiskers indicate the maxima and minima of the distribution. c, The Hudson’s fixation index () value between identity-by-descent clusters identified in BioMe at Mount Sinai and ATLAS identity-by-descent clusters demonstrates the relationship between ATLAS and populations outside of UCLA Health. The darker the color, the smaller the value. The smallest value for each of the ATLAS clusters is indicated by a white dot. d, For each of the largest clusters (from top to bottom), the proportion of reference data by continent in each cluster, the proportion that indicated they prefer a specific religion, the proportion of EHR race/ethnicity category and the proportion of language preferred.
To further refine the clusters, we used the approach of Dai et al.12 and merged subclusters with low genetic differentiation, measured as Hudson’s fixation index () (). This produced clusters differentiated enough to represent the diversity of ATLAS while still powered for statistical analyses. Finer-scale clusters might be relevant for specific medical or population genetics questions. For example, the subclusters that were merged together to make the predominantly European ancestry cluster each had a different distribution of identity-by-descent sharing. Computing to UK BioBank29 participants born outside the UK suggested that these subclusters represent individuals with Northern, Southern and Eastern European ancestry (Fig. 3b).
After merging, 24 clusters with at least 30 ATLAS participants representing 97.8% of ATLAS remained for downstream analysis. These 24 clusters were assigned a name. The ATLAS biobank does not contain the country of origin of participants, which was used in our previous studies to annotate cluster identity10. Instead, we annotated clusters by using reference data in the clustering algorithm. For clusters without reference data, de-identified EHR demographic information, such as EHR-reported race and ethnicity, preferred language and religion, were used to refine and determine cluster annotations (Supplementary Data 1). Notably, the label given to a cluster serves as a broad interpretation of the cluster’s demographic and ancestral ties and does not necessarily reflect the self-identity of members (Discussion). Furthermore, the clusters discussed here are specific to Los Angeles, especially those who visit UCLA Health, and may not be representative of the global population (Supplementary Table 1).
Using external reference data (Fig. 3d and Extended Data Fig. 4), global genetic ancestry, principal component analysis (PCA) (Extended Data Fig. 5) and EHR-reported demographics, we identified identity-by-descent clusters reflecting the demography of Los Angeles. There was a large cluster of Mexican and Central American patients. Further Louvain clustering of this cluster with additional indigenous reference samples from Mexico30 revealed subclusters with ancestry from northern Mexico and Baja California, central Mexico and Oaxaca and Guatemala (Supplementary Table 2 and Extended Data Fig. 6a–h). We also identified three distinct Black and African American identity-by-descent clusters, containing patients with African American, Afro-Caribbean and West African ancestries, respectively (Fig. 3c and Extended Data Fig. 4f). Several clusters had MENA global genetic ancestry (Fig. 3a), consistent with Los Angeles County having the largest population of people from the Greater Middle East in the United States31. Two distinct clusters contained patients of Iranian descent—one with patients with EHR-reported Jewish religion, and the other contained patients who reported other religions. One cluster was enriched for patients of Armenian descent, consistent with Los Angeles having the largest population of diaspora Armenians in the United States32. Lastly, we identified several Asian identity-by-descent clusters. These included clusters with patients who have predominantly East Asian global genetic ancestry (Fig. 3a) and also clusters with South Asian ancestry.
In our previous work10, we found that clustering using identity by descent offered enhanced resolution relative to PCA. Similarly, we found that many of the clusters overlapped in principal component (PC) space. This was especially true for the Middle Eastern and South Asian identity-by-descent clusters, which were tightly clustered with the European cluster (Extended Data Fig. 5b).
Health system utilization of identity-by-descent clusters
We next sought to understand how individuals in the identity-by-descent clusters accessed the hospital system using EHR data. Patients in clusters varied substantially by age, sex and body mass index (BMI) as well as the fraction carrying private health insurance (Extended Data Fig. 7). However, the proportion of patients with private insurance coverage was high for all clusters, likely driven by the fact that not having quality insurance coverage is a primary obstacle to obtaining healthcare in the United States33.
We used logistic regression to test for associations between EHR phecode-based34 diagnoses and cluster membership. To account for differences in diagnosis frequencies between medical contexts, we separately assessed the code assignments both for outpatient encounters and emergency room (ER) visits and controlled for age, sex and BMI. More complex combinations of International Classification of Diseases, 10th revision (ICD-10) codes are often used in place of phecodes for improving phenotypic specificity. To explore this, we used additional phenotype definitions for Alzheimer’s disease and related dementias35 (Extended Data Fig. 8a,b).
We began by comparing outpatient phecode assignments in the Ashkenazi Jewish identity-by-descent cluster (n = 5,309) to all other participants. We tested n = 1,131 phecodes assigned to at least 30 patients in outpatient encounters. In total, 236 phecodes were significantly associated with cluster membership at Benjamini–Hochberg false discovery rate (FDR) of 5% (Fig. 4a). Consistent with previous studies of Ashkenazi Jewish individuals10,36,37, patients in the cluster were more likely diagnosed with ulcerative colitis (odds ratio (OR) = 2.24, 95% confidence interval (CI): (1.83, 2.75), q value = 5.34 × 10⁻¹³) and regional enteritis (OR = 2.93, 95% CI: (2.41, 3.56), q value = 2.39 × 10⁻²⁴). We further identified less well-characterized associations, particularly for several mental health disorders, including eating disorders (OR = 3.37, 95% CI: (2.45, 4.64), q value = 6.79 × 10⁻¹²), anxiety disorder (OR = 1.7, 95% CI: (1.59, 1.82), q value = 9.90 × 10−52) and major depressive disorder (OR = 1.62, 95% CI: (1.47, 1.78), q value = 2.55 × 10⁻²⁰). All these associations remained significant at FDR 5% when restricting the analysis to only compare the Ashkenazi Jewish cluster with the European cluster.
Fig. 4 |. Phecode associations for selected clusters.
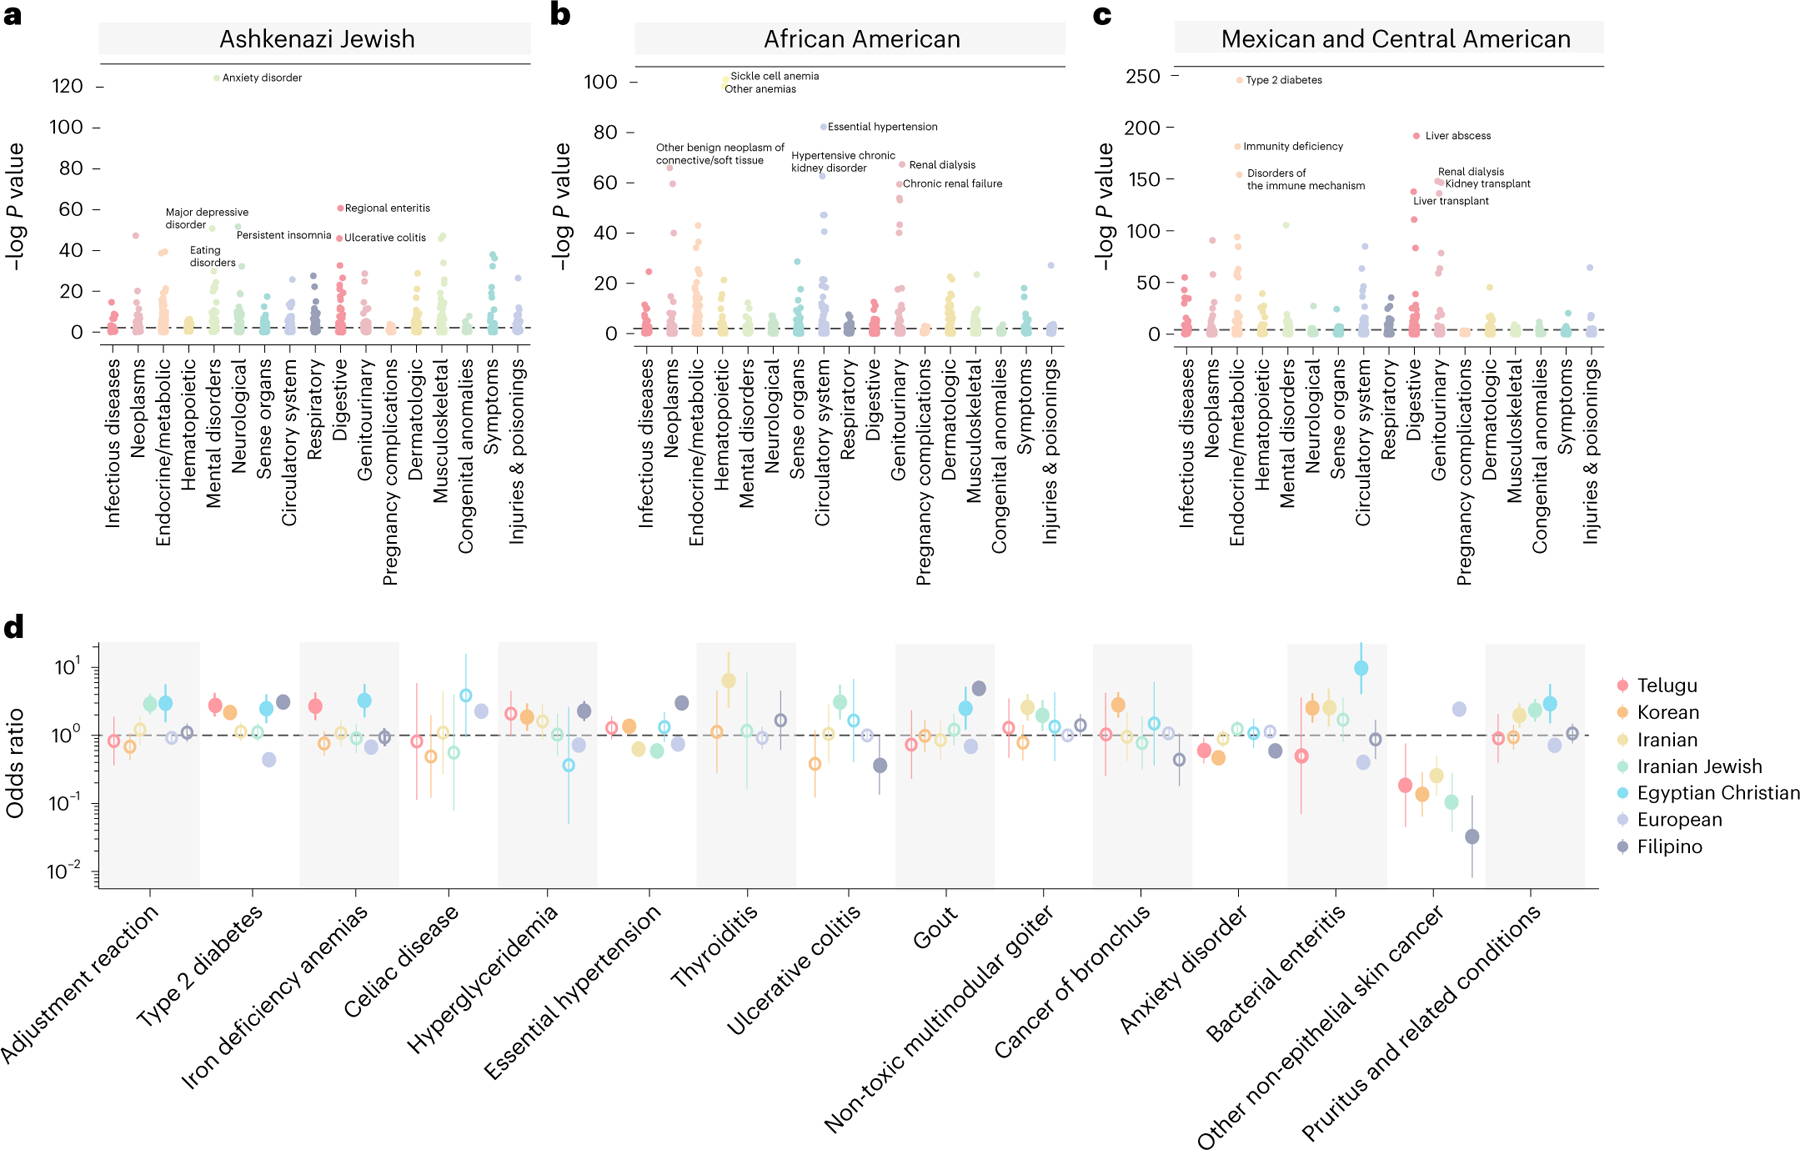
Phecodes associations for n = 1,131 identity-by-descent clusters relative to the remaining biobank participants. Results are shown for the Ashkenazi Jewish (n = 5,309) (a), African American (n = 1,877) (b) and Mexican and Central American (n = 6,075) (c) identity-by-descent clusters. Phecodes are grouped by phenotypic category. Top significant (Benjamini–Hochberg FDR at 5%) associations for each cluster are labeled. Bonferroni significance is indicated by a gray dotted line. d, ORs of association between identity-by-descent clusters and phecodes for the Telugu (n = 276), Korean (n = 546), Iranian (n = 350), Iranian Jewish (n = 264), Egyptian Christian (n = 92), European (n = 17,017) and Filipino (n = 796) clusters. Vertical bars indicate the standard error. Dots represent the OR, and a solid line indicates significance at FDR 5%. Open dots indicate a non-significant association.
In ER visits, membership in the Ashkenazi Jewish identity-by-descent cluster was significantly associated with major depression as the primary diagnosis (OR = 2.29, 95% CI: (1.32, 3.98), q value = 4.86 × 10⁻²) (Extended Data Fig. 8c). Although these results were consistent with previous reports of mental health conditions in European Jewish communities38–40, we emphasize that this association does not indicate a causal relationship between identity-by-descent cluster membership and these disorders.
We next examined associations in the African American and Mexican and Central American identity-by-descent clusters. This analysis revealed several associations in both outpatient (Fig. 4) and ER contexts (Extended Data Fig. 8d,e). Consistent with previous literature41, patients in the African American cluster were more likely diagnosed with sickle cell anemia (OR = 50.29, 95% CI: (29.08, 86.97), q value = 1.33 × 10−42) (Fig. 4b). We also identified a significant increase in uterine leiomyomas in the African American identity-by-descent cluster (OR = 2.92, 95% CI: (2.4, 3.55), q value = 2.16 × 10⁻²⁴), consistent with the increased burden of uterine fibroids in African American women and representing a substantial health disparity42. In the Mexican and Central American cluster, there was a strong enrichment of type 2 diabetes (OR = 2.37, 95% CI: (2.2, 2.56), q value = 3.27 × 10−104) and chronic liver disease (OR = 5.52, 95% CI: (4.65, 6.56), q value = 3.47 × 10−81) (Fig. 4c).
To further characterize the disease risk of Latino patients, we examined how phecode associations differ among the three Mexican and Central American subclusters, the Afro-Caribbean cluster and the Puerto Rican identity-by-descent cluster. In total, 106 phecodes showed effect size heterogeneity43 across these five clusters (Extended Data Fig. 6). For example, although phecodes relating to lung disease (that is, pulmonary fibrosis and lung transplants) were associated with identifying as Latino in the EHR, the association was most primarily driven by patients in the the Afro-Caribbean cluster. Even within the three Mexican and Central American subclusters, there was heterogeneity. The Guatemalan and Central American subcluster was the only subcluster associated with several pregnancy phecodes, including anemia during pregnancy (OR = 2.57, 95% CI: (0.94, 1.48), q value = 4.84 × 10⁻⁵) and short gestation period (OR = 5.04, 95% CI: (2.73, 5.95), q value = 4.86 × 10⁻⁵). The Central Mexican subcluster was the only subcluster associated with the coccidioidomycosis fungal infection (OR = 3.98, 95% CI: (1.92, 3.71), q value = 3.86 × 10⁻⁵). Overall, these differences offer further evidence that grouping patients only by Hispanic and Latino ethnicity is too coarse.
We further examined disease associations in MENA and Asian clusters (Fig. 4d). We began with the Iranian (n = 315) and Iranian Jewish (n = 264) identity-by-descent clusters. These two clusters shared several associations in outpatient diagnoses. Individuals from both clusters were less likely to be diagnosed with skin cancer (Iranian Jewish: OR = 0.1, 95% CI: (0.03, 0.28), q value = 3.09 × 10⁻³; Iranian: OR = 0.26, 95% CI: (0.13, 0.51), q value = 4.07 × 10⁻²). However, the phecodes with the smallest P value for each cluster—non-toxic multi-nodular goiter in the Iranian cluster (OR = 2.58, 95% CI: (1.63, 4.08), q value = 4.07 × 10⁻²) and adjustment disorder in the Iranian Jewish cluster (OR = 2.89, 95% CI: (2.04, 4.09), q value = 2.31 × 10⁻⁶)—were not the same. Other associations included an enrichment of phecodes relating to bacterial enteritis in the Egyptian Christian identity-by-descent cluster (n = 92) (OR = 7.42, 95% CI: (3.56, 15.47), q value = 1.04 × 10⁻⁴) and phecodes relating to bronchus cancer in the Korean identity-by-descent cluster (n = 546) (OR = 2.82, 95% CI: (1.84, 4.32), q value = 2.56 × 10⁻⁴).
We also observed an increased number of diagnoses relating to viral hepatitis B in identity-by-descent clusters with Asian ancestry patients. Asian ancestry as a risk factor for viral hepatitis B is widely documented44. However, we noted that there were differences between the fine-scale Asian ancestry clusters. For example, individuals in the Chinese identity-by-descent cluster (n = 1,547) (OR = 19.12, 95% CI: (14.92, 24.5), q value = 1.88 × 10−117) were more likely to receive a diagnosis of hepatitis B, whereas diagnoses of hepatitis B were not elevated in the Japanese cluster (n = 596) (OR = 1.15, 95% CI: (0.47, 2.8), q value = 1.00 × 10⁻¹). We performed a mixed-effects meta-regression using the ORs estimated for each Asian ancestry cluster43. The effect sizes significantly differed between the clusters for this phecode and others (Extended Data Fig. 9) (meta-regression P = 2.23 × 10⁻¹⁵), showing the value of fine-scale information.
To explore whether the associations reported here were specific to UCLA or could be generalizable to other settings, we used BioMe summary statistic data published in Belbin et al.10. For six BioMe identity-by-descent clusters found in ATLAS (Supplementary Table 3), the correlation of effect sizes was high: R2 = 0.69 (interquartile range (IQR) = (0.63, 0.84)) (Extended Data Fig. 10). Many associations in BioMe were found in ATLAS, including elevated rates of gout in the Filipino cluster (OR = 4.91, 95% CI: (3.77, 6.4), q value = 2.24 × 10⁻²⁹), chronic lymphocytic thyroiditis in the Ashkenazi Jewish cluster (OR = 1.51, 95% CI: (1.3, 1.76), q value = 3.07 × 10⁻⁶) and peripheral vascular disease in the African American cluster (OR = 2.0, 95% CI: (1.58, 2.53), q value = 3.21 × 10⁻⁷) (Supplementary Table 4). Unlike BioMe, the ATLAS European cluster did not have an elevated rate of multiple sclerosis (OR = 1.2, 95% CI: (0.93, 1.54), q value = 3.55 × 10⁻¹). Associations were calculated relative to a background population, and differences between ATLAS and BioMe might be driven by differences in comparator clusters, environment or the underlying fine-scale populations.
Although phecodes assigned to an identity-by-descent cluster can be relative to the entire biobank, we also explored enrichments between closely related clusters. Phecode association tests for the Armenian cluster were performed against four comparator clusters: against the entire biobank, against the European cluster, against the two Iranian clusters and against all MENA ancestry identity-by-descent clusters. We restricted to phecodes with more than 30 patients in all four groups and examined phecodes significant in all four comparisons (Fig. 5a). Phecodes relating to heart disease were more likely to be associated with the Armenian cluster relative to all comparison groups. This result is consistent with previous reports of Armenian ancestry as a risk factor for cardiovascular disease45. Next, we examined whether there were phecodes associated with the Armenian identity-by-descent cluster that had significantly different effect sizes across the comparison groups (Fig. 5b). Seven phecodes had a nominally significant meta-regression P value (P < 0.05)—for example, non-toxic uninodular goiters. The Armenian cluster was more likely than the biobank and the European cluster to be associated with this phecode but less likely to be diagnosed with this phecode relative to the Iranian and MENA clusters. This example illustrates the importance of holistically evaluating cluster–disease associations, as they are likely determined by context and environment.
Fig. 5 |. Phecodes associated with the Armenian identity-by-descent cluster.
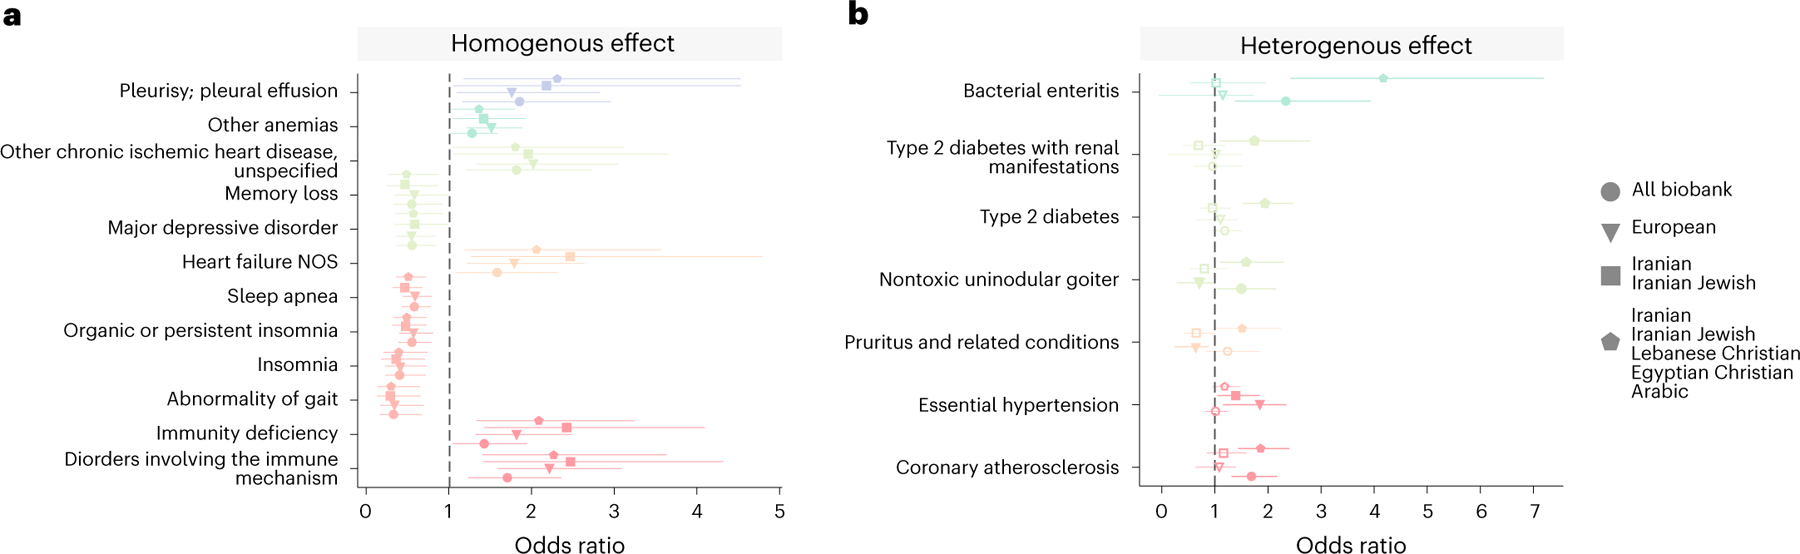
For each phecode, the OR that membership in the Armenian cluster (n = 491) was associated with that phecode compared to the rest of the biobank, the European cluster (n = 17,017), the Iranian and Iranian Jewish clusters (n = 614) and MENA ancestry clusters (n = 960). In a, phecodes that are FDR significant at 5% (where logistic regression q < 0.05) in all comparison groups and had the same direction of effect (‘homogenous effect’) are shown. In b, phecodes that have a ‘heterogeneous effect’ (mixed-effects meta-regression test where P < 0.05) are shown. Phecodes of the same color are from the same phecode category. In each plot, the dot represents the OR, and the lines represent the standard error. NOS, nitric oxide synthases.
We next sought to evaluate how individuals in identity by descent interface with the health system. We found that many clusters were significantly less likely to visit a routine care provider than the European cluster. For example, individuals who belonged to the European cluster were significantly more likely to visit a primary care physician (OR = 1.33, 95% CI: (1.27, 1.4), q value = 7.19 × 10⁻²⁹) than other biobank participants (Extended Data Fig. 9b). We observed differential utilization of the ER by clusters. Patients in the African American and the Mexican and Central American identity-by-descent clusters were more likely to visit the ER, which is a well-documented health inequity that is associated with worse outcomes46–48. However, we also identified other clusters that were more likely to visit the ER, including the Iranian Jewish (OR = 1.78, 95% CI: (1.41, 2.25), q value = 7.64 × 10⁻⁶) and Armenian (OR = 2.34, 95% CI: (1.53, 3.57), q value = 3.98 × 10⁻²), which are identity-by-descent clusters both of primarily MENA ancestry. ER use for these populations is not widely documented.
We next examined how individuals from different identity-by-descent clusters interact with the health system over time, which can give insights into the dynamic nature of disease. We plotted two typical phecodes (Methods)—kidney transplants and major depressive disorder (Extended Data Fig. 9c,d)—for the six largest clusters. The proportion of patients assigned a phecode relating to kidney transplants significantly increased between 2016 and 2019 for the Filipino (P = 4.42 × 10⁻⁵), Mexican and Central American (P = 1.77 × 10⁻³¹) and African American (P = 5.30 × 10⁻⁷) identity-by-descent clusters but not in the Ashkenazi Jewish, European or Chinese clusters. Diagnoses generally increased but dropped sharply in 2020, which might be attributed to the decrease in procedures performed during Coronavirus Disease 2019 (COVID-19) shelter-in-place orders.
Phecodes relating to mental health conditions (Extended Data Fig. 9d) were heterogeneous between clusters. The Ashkenazi Jewish identity-by-descent cluster had the highest proportion of patients diagnosed with major depressive disorder. By 2020, this cluster had five times as many diagnoses as the Chinese identity-by-descent cluster. This cluster had a consistently low proportion receiving the phecode, and, whereas most other clusters had an increasing number of diagnoses with time, the Chinese cluster had a slow or even decreasing proportion. For any of these diagnoses, it is not necessarily true that the rates of diagnosis indicate the actual prevalence of the health conditions in the cluster. Instead, these results indicate the complex dynamics between how clusters interact with the health system, which could be a function of doctor choice, insurance coverage, practitioner perceptions or other forces.
Identity-by-descent clusters can facilitate the study of pathogenic alleles in diverse groups, which are often underrepresented in genetic screening efforts49. To do this, we examined the minor allele frequency (MAF) of pathogenic mutations that have been previously reported to be enriched within particular groups. One example is familial Mediterranean fever (FMF), which is caused by mutations in the MEFV gene50. We restricted to pathogenic MEFV single-nucleotide polymorphisms (SNPs) and performed a Fisher’s exact test comparing cluster allele frequencies to the rest of ATLAS. One pathogenic SNP genotyped in MEFV (rs28940579) was significant at FDR 5% in several MENA ancestry clusters. These included the Ashkenazi Jewish (MAF: 2.9 × 10⁻², P = 2.6 × 10−159), Armenian (MAF: 4.2 × 10⁻², P = 1.7 × 10⁻²¹) and Lebanese Christian (MAF: 3.7 × 10⁻², P = 1 × 10⁻⁸) identity-by-descent clusters, which all had elevated frequencies compared to the remaining biobank excluding these clusters (biobank MAF: 9.55 × 10⁻⁴). Of all ATLAS clusters, diagnosis with FMF was strongly associated with membership in the Armenian cluster (OR = 17.36, 95% CI: (6.99, 46.95), P = 1.0 × 10⁻⁸), consistent with literature finding of high FMF burden in individuals of Armenian descent51. However, the high carrier rate in other clusters motivates disease screening in other populations.
We also analyzed pathogenic variants in the HBB gene, which is implicated in thalassemia and sickle cell disease52. Sickle cell disease is known to be associated with African ancestry41, and, in the phecode analysis, it was significantly associated with membership in the African American identity-by-descent cluster. Consistent with that observation, we found a pathogenic HBB allele, rs34598529, that was significantly more common in this cluster (biobank MAF: 3.02 × 10⁻⁵ cluster MAF: 2.20 × 10⁻³, P = 1.52 × 10⁻⁹). Furthermore, we found two pathogenic alleles in HBB associated with membership in the Chinese identity-by-descent cluster. Both alleles, rs34451549 (biobank MAF: 0.00, cluster MAF: 3.54 × 10⁻³, P = 1.12 × 10⁻¹³) and rs33931746 (biobank MAF: 1.15 × 10⁻⁵, cluster MAF: 1.18 × 10⁻³, P = 1.89 × 10⁻⁴), are documented to be associated with beta-thalassemia in East Asian populations53,54 and are at elevated frequencies in these populations in gnomAD, a large database of allele frequency data55. Furthermore, patients in this cluster were also more likely to receive diagnoses of hemoglobinopathies (OR = 2.81, 95% CI: (1.87, 4.21), P = 3.93 × 10⁻⁵) than the remaining biobank participants. This result illustrates that patients of many different ancestry backgrounds could experience elevated genetic risk in the HBB gene.
Lastly, we broadly studied genetic risk variants associated with each identity-by-descent cluster and found over 100 loci that were at elevated frequencies in a specific cluster (Supplementary Data 1). Examples included elevated MAF of a pathogenic allele associated with transthyretin cardiac amyloidosis in the African American cluster (biobank MAF: 2.14 × 10⁻⁴, cluster MAF: 1.78 × 10⁻², P = 4.76 × 10−66) and an allele associated with Lynch syndrome in the Mexican and Central American cluster (biobank MAF: 0.0, cluster MAF: 6.95 × 10⁻⁴, P = 5.59 × 10⁻⁷)56,57. We further identified several lesser-known associations. One finding was rs28937594, which was significantly higher in the Iranian Jewish identity-by-descent cluster (biobank MAF: 5.80 × 10⁻⁵ cluster MAF: 0.024, P = 5.58 × 10⁻²⁸). rs28937594 is in the GNE gene and is implicated in hereditary inclusion body myopathy, an ultra-rare recessive disease58. Although no ATLAS participants were homogenous for the SNP or diagnosed with the disease, this SNP has been reported to be a founder mutation in Iranian Jewish populations59. Interestingly, in the Iranian identity-by-descent cluster, the MAF for this SNP was also high but not significant (cluster MAF: 0.0017, P = 0.1512). Overall, this supports the idea that identity-by-descent clusters can confirm and refine variants included in genetic screening programs60.
Genetics of identity-by-descent clusters
Identity-by-descent clusters also present opportunities for learning about historical or demographic factors, which can have implications for personalizing care or developing precision treatments61,62. First, we analyzed the distribution of total identity by descent shared between pairs of individuals in a cluster (Fig. 6a and Supplementary Table 5). The Iranian Jewish cluster had the highest level of total identity-by-descent sharing (mean = 57.43 cM, 95% CI: (56.80–58.06)). This is higher than other clusters that contained populations expected to have founder effects. The Iranian cluster also had relatively high identity-by-descent sharing (total pairwise identity-by-descent mean = 15.70 cM, 95% CI: (14.54–16.86)) but not as high as the Iranian Jewish cluster, highlighting the role of cultural factors.
Fig. 6 |. The genetic properties of the largest identity-by-descent clusters.
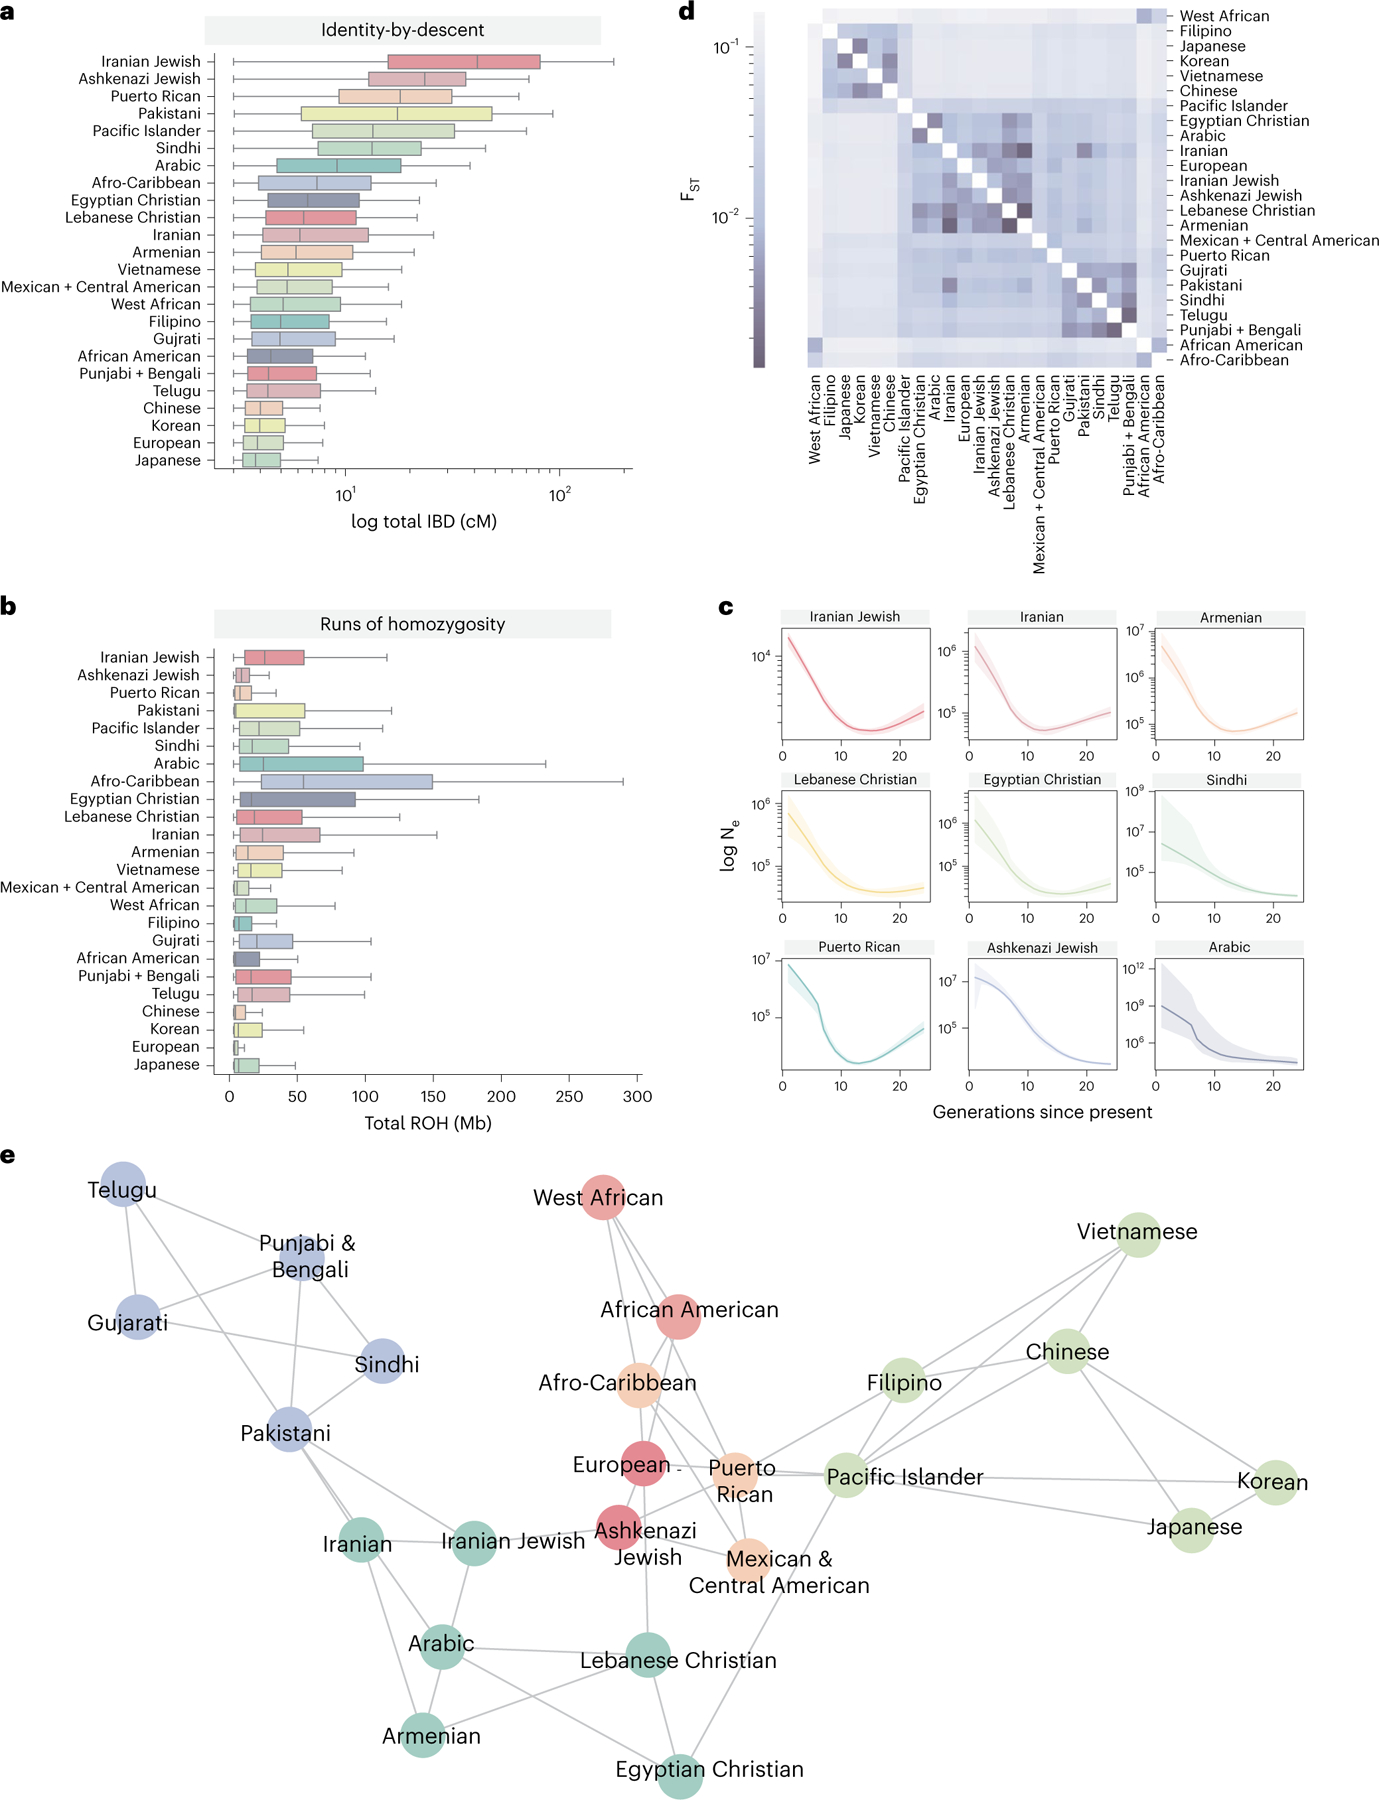
The distribution of total pairwise identity by descent (cM) (a) and total amount of ROH detected shared among individuals of a given cluster (b). The center line of the box indicates the mean; the outer edges of the box indicate the upper and lower quartiles; and the whiskers indicate the maxima and minima of the distribution. c, IBDNe estimates of historic population size (Ne) for nine selected clusters, where the line is the mean estimate of the population size for each generation from present, and the shaded region indicates the 95% CI of the estimate. Dips in the population size can suggest founder effects. d, Pairwise Hudson’s estimates between UCLA ATLAS identity-by-descent clusters, where the darker color indicates lower , suggesting less differentiation between the pair of clusters. e, A network diagram of identity-by-descent sharing between clusters, where each node is a cluster and each edge is weighted by the amount of identity by descent shared between the clusters. The graph was visualized using 1,000 iterations of the Fruchterman–Reingold algorithm. For clarity, the three edges with the largest amount of identity by descent shared per cluster are displayed.
Additionally, we examined cluster runs of homozygosity (ROH) (Fig. 6b), which occur when an individual inherits identical copies of a haplotype from each parent63. ROH can reflect the demographic processes, such as consanguinity, and are implicated in risk for complex diseases64,65 We found elevated amounts of ROH in several MENA clusters and South Asian ancestry clusters. The amount of within-cluster identity-by-descent sharing did not always correlate with the rate of ROH. This observation may be attributed to differences in the historical and modern demographic processes, such as the practice of endogamy or historical population bottlenecks.
We used the IBDNe program66 to estimate cluster-specific historical effective population size (Fig. 6c). Consistent with previous reports67, we observed a large bottleneck in the Puerto Rican cluster, with a minimum population size occurring around 15 generations ago. We also observed historic population size reduction in several other clusters, especially in MENA ancestry clusters. The bottleneck timing in these clusters is similar, approximately 13–15 generations ago. Despite the similarity in the timing of the bottleneck, the estimates of the maximum population size differed. For example, the population size of the Iranian Jewish cluster was estimated to be less than 10,000 for the last 30 generations, which is very small, and could be relevant for understanding the genetic disease burden in this group.
Patterns of identity-by-descent sharing between clusters can further reveal modern and historical relationships. We first computed pairwise Hudson’s in the largest identity-by-descent clusters (Fig. 6d), which revealed complex within-continent sharing patterns. Although there was low differentiation between the Iranian and Iranian Jewish clusters (), the Iranian cluster exhibited a smaller with the Armenian, Egyptian Christian and Lebanese Christian clusters. It is important to note, however, that the estimates used here do not capture the effect of rare variants68.
Lastly, we created a network representation of identity-by-descent sharing, where the nodes of the network were a cluster and the edges were the median identity by descent shared between clusters (Fig. 6e). From this representation, we observed that geography affected cluster relationships. For example, clusters with MENA ancestry were close in network space, with the Pakistani cluster acting as a bridge between them and the South Asian identity-by-descent clusters. We also observed some unexpected relationships. The Mexican and Central American cluster shared more identity by descent on average with the Ashkenazi Jewish cluster (mean = 0.243 cM, 95% CI: (0.243, 0.244)) than the European cluster (mean = 0.0372 cM, 95% CI: (0.0371, 0.0373)). A similar trend was observed for the Puerto Rican identity-by-descent cluster. Other reports found a contribution of Jewish ancestry to Latin American populations69.
Discussion
To ensure that precision medicine initiatives are applicable to all people, it is important to understand the diverse determinants of health. In this study, we analyzed clusters of people who share genetic ancestry. Identifying these fine-scale ancestry clusters is useful in the study of health disparities, especially with respect to the coarse race and ethnicity information usually recorded in biobanks. Although people who share ancestry may share genetic risk for disease, they may also share an environment, which is particularly important for understanding disease risk. Race, ethnicity and religion are social constructs and are not determined by genetics, although they may be correlated70–74. It is simultaneously true, however, that identity by race, ethnicity and religion can affect access to and quality of healthcare in the United States75. Thus, this approach provides a complementary lens for identifying potential health differences among people living in Los Angeles.
These findings can inform provision of care at UCLA Health and similar health systems. We identified pathogenic loci that segregated at higher frequencies in the Chinese, Iranian Jewish, Armenian and African American clusters. Historically, in the United States, carrier screening guidelines are based on self-reported race and ethnicity76,77. Many of the associations that we identified would be missed by these guidelines. Furthermore, allele frequency data are often available only for limited ancestry groups55, and pathogenicity or penetrance may differ across ancestries78. This work supports calls to expand genetic screening efforts to more people49,60 regardless of race or ethnicity. We make allele frequencies available for all clusters to facilitate studies on genetic disease in diverse groups.
These results occur within, and support the existence of, an unequal healthcare system. For example, the African American and Mexican and Central American clusters were both associated with severe diseases, such as chronic renal failure and liver transplants. This could be a consequence of the burden of systematic racism, which adversely affects the health of minority groups in America79, and reduced access to quality insurance, which affects care and varies by race and ethnicity. These results may be further compounded by the fact that the main UCLA Health facilities are in West Los Angeles, which includes some of the wealthiest neighborhoods in Los Angeles County. Thus, clusters from economically disadvantaged households might be traveling further to access specialty care at UCLA and, thus, have greater health needs motivating the longer trip.
There are several limitations to this work. Although we used genetics to identify clusters, genetics is likely not the only causal factor for these results. The reported associations are strictly correlative and may be specific to UCLA Health. Additionally, defining a population or cluster is not straightforward22,80–85, and the definition of ancestry itself is subject to disagreement86. We followed previous studies and chose a genetic similarity criterion, but any number of criteria or algorithms could have been used. Additionally, the clusters are not necessarily equivalent. Some were tightly related in network space, whereas others had more diffuse patterns of connection. Although every participant in ATLAS is placed into a cluster, this approach may have limitations for individuals with multiple ancestries.
The individuals whose data comprise ATLAS are not representative of a random sample of the general Los Angeles population. The ATLAS biobank is opt-in, which means that an individual’s participation can be influenced by their level of comfort and trust with health research. Because medical research has a long history of unethical experimentation on people of color, these groups may be less willing to participate87. Another source of participation bias is that individuals who come to a hospital are usually unwell. The severity of ill health may vary with geographic distance from UCLA. Other socioeconomic factors, such as age, education and household income, are also associated with when and if patients receive diagnoses88–90. These differences may also be exacerbated by biases from health practitioners, which systematically affect care91.
Lastly, we focused on population-level analyses in this work. When translating results to individuals, the limitations of genetic ancestry must be considered. Genetic ancestry is continuous, and many individuals have multiple ancestries. Identity-by-descent clusters as a biomarker must be inclusive and tailored to individuals for clinical use92. Furthermore, access to genetic information will inevitably have intrinsic biases. Health systems will have to evaluate the impact of genomic medicine initiatives on the populations they serve60 as well as provide education to their patients and practitioners93. In particular, evidence-based recommendations on when to use ancestry, race and ethnicity tailored to specific diseases and treatment options are needed70.
Overall, we identified and characterized the health profiles of diverse Los Angeles identity-by-descent clusters. This represents an advance toward equitable health research and, along with our website, can empower future studies on health outcomes in Los Angeles.
Methods
Ethics
Patient Recruitment and Sample Collection for Precision Health Activities at UCLA is an approved study by the UCLA Institutional Review Board (IRB17-001013). All necessary patient/participant consent was obtained, and the appropriate institutional forms have been archived.
Patients and recruitment
The UCLA ATLAS Community Health Initiative aims to create a genomic resource to enable translational and precision medicine7. In ATLAS, genotyping data are tied to de-identified EHRs as part of the UCLA Health IT Discovery Data Repository & Dashboard (DDR)94. UCLA primarily serves patients on the west side of Los Angeles but also has more than 200 clinics throughout the area, making it one of the largest health systems in Los Angeles.
Enrollment in ATLAS is elective, and patients enroll in ATLAS when they visit a UCLA site for a blood draw. ATLAS has a 65% opt-in rate (see Lajonchere et al.95 for more details on participation). As of 2021, there were approximately 35,968 participants with full genotyping and DDR data available7. No statistical method was used to pre-determine sample size. The experiments were not randomized, and the investigators were not blinded to allocation during experiments and outcome assessment. A complete description of the ATLAS project and data is available in Johnson et al.7.
EHR data
Each patient’s genotype data were tied to EHRs collected during patient visits on EPIC systems using a de-identified ID. Patient EHRs were pulled for 2016–2020 and included visit information, diagnosis information and demographics. For the normal outpatient data, we restricted to visits that were labeled as scheduled appointments and that did not have a code associated with an inpatient, intensive care unit or trauma stay. ER data were any visit that happened within an ER department. Diagnoses assigned in ERs were restricted to the primary reason for the visit. Each visit contained information on patient weight, height and BMI measured at the visit. We calculated the median BMI for a patient across all encounters and used this as the BMI for that patient in our association testing. The EHR was queried using Microsoft SQL Server 2014.
Demographic information
Demographic information was restricted to race/ethnicity, preferred religion, preferred language, sex and birth date. Sex was indicated as binary. To calculate patient age, we calculated the patient age at the time of each visit and took the maximum age overall for each patient. For EHR-reported race/ethnicity, patients were designated (by themselves or a healthcare staff member) as ‘White,’ ‘Black’, ‘Asian’, ‘Native American’ or ‘Pacific Islander’. Asian patients could be further designated as Chinese, Japanese, Korean, Thai, Filipino, Vietnamese, Taiwanese, Pakistani, Indian or Indonesian, although not all Asian patients had one of these identifiers. Hispanic/Latino patients were designated as ‘Hispanic’, which was further subdivided into several other sub-identifiers, such as ‘Spanish origin’, ‘Chicano/a’ or ‘Cuban’. For visualization, we considered the main race/ethnic categories and not the sub-designations. There were numerous preferred languages and religions. For simplicity, we examined the languages that had more than five individuals who indicated that they preferred that language. Furthermore, the preferred religion was restricted to consider major religions: Christianity, Islam, Judaism, Hinduism, Sikhism and Buddhism. Christianity was further subdivided into Protestant and Catholic. Other religions were condensed into an ‘Other Religion’ category.
Diagnoses and phecodes
We used phecodes to study disease associations. Diagnoses are coded in the DDR as ICD-10 codes. For all encounters that occurred at UCLA between January 2016 (the start of the DDR) and January 2021, we found all unique diagnoses assigned to a patient in an outpatient setting, which included in-person doctor visits and video calls. In outpatient visits, we included all diagnoses given in a visit. For ER visits, we restricted to diagnoses given as the primary reason for the visit, which was coded by the diagnosing clinician (that is, if a person showed up to the ER for a heart attack who also had diabetes, the primary reason for the visit was the heart attack).
ICD-10 codes were then merged into phecodes using the mappings provided at Phecode Map 1.2 with the first five characters of an ICD-10 code (that is, if the ICD-10 code was V80.720S, only V80.720 would be used for mapping).
Alternative phenotype definitions were defined with ICD-10 codes or with using the procedure orders.
Specialties
Specialty utilization was determined by the specialty of the primary provider for a patient encounter. Providers with multiple specialties were counted only for their primary specialty. We grouped subspecialities into one specialty. For example, ‘Neurology, sleep medicine’ and ‘Neurology, movement disorders’ were both counted as a visit to a neurologist.
Changes in phecodes over time
We calculated the proportion of a cluster assigned a phecode in a given year. We then calculated the inter-year difference in the proportion of people diagnosed in 2020 and 2016. Because we were interested in phecodes that might have different trajectories between clusters, we identified the phecodes that had the greatest variance in the inter-year difference between the six largest clusters.
Other phenotype definitions
We focused on definitions of phenotypes defined by phecodes because they have been shown to work well in the context of EHRs34. However, phecodes tend to be broad and are optimized for generalizability across health systems and for genetic association studies. Depending on the application, other phenotype definitions might be more relevant.
To explore this, we utilized two different phenotype definitions. One phenotype definition was a curated list of ICD codes relevant to Alzheimer’s and related dementias (see below) and that is used by physicians for defining clinical cohorts. The other phenotype was brain magnetic resonance imaging (MRI) orders. We performed a logistic regression to assess the relationship between cluster membership and ever having the phenotype, controlling for age, sex and BMI.
| Condition | ICD-10 code |
|---|---|
| Alzheimer’s disease | G30.9, G30, G30.1, G30.0, G30.8 |
| Frontotemporal dementia | G31, G31.0, G31.09, G31.01 |
| Corticobasal degeneration | G31.85 |
| Lewy body dementia | G31.83 |
| Progressive supranuclear palsy | G23.1 |
| Mild cognitive impairment | G31.84 |
Genomics pre-processing and quality control
Data.
Genotyping for ATLAS was performed on a custom genotyping chip, with sites from the global screening array. Data were mapped to hg38, and all SNPs were mapped to the 147 build of dbSNP96. All pre-processing and quality control steps were performed using PLINK 1.9 (ref. 97) and bcftools version 1.9 (ref. 98).
For ATLAS samples, we removed any individuals whose genotyped sex mismatched their EHR-reported sex. We did this by using the PLINK -update-sex command to update the PLINK fam files to contain the EHR sex and the PLINK -check-sex to identify samples with discrepancies between the estimated genotype sex and EHR sex.
ATLAS data were merged with genotyping data from the 1000 Genomes Project23, the Simons Genome Diversity Project 24 and the Human Genome Diversity Project25. All reference data were converted to hg38 for merging using CrossMap99. Samples that overlapped between the different projects were removed using PLINK -keep. Rsids were harmonized across projects using bcftools annotate. Data were then standardized using bcftools norm and a hg38 genome reference. After merging, sites or individuals with more than 1% missing were removed using PLINK -mind and -geno. For identity-by-descent analysis, only SNPs with MAF > 5% were kept.
Phasing.
Before identity-by-descent calling, data were statistically phased using SHAPEIT4 (ref. 100) using default parameters and the hg38 map files distributed with the software. To speed up computation, one chromosome was phased at a time.
PCA.
To prevent the large sample size of ATLAS from distorting the relationship populations in PC space, PCA was performed first on only the reference samples. ATLAS samples were then projected onto the reference PCs. To enable visualization, the reference data and the ATLAS sample PCA results were plotted separately on adjoining axes.
Identity-by-descent calling and processing
iLASH.
For identity-by-descent calling, the genotype data were converted from PLINK bed files into PLINK ped/map files using a custom Python script that preserves phasing. Centimorgan information for the map files was pulled from the same genetic maps used in SHAPEIT4.
Identity-by-descent segments were called using iLASH26 with the following parameters: slice_size 350, step_size 350, perm_count 20, shingle_size 15, shingle_overlap 0, bucket_count 5, max_thread 20, match_threshold 0.99, interest_threshold 0.70, min_length 2.9, auto_slice 1, slice_length 2.9, cm_overlap 1 and minhash_threshold 55. Identity by descent was called for one chromosome at a time.
Identity-by-descent quality control.
After identity-by-descent segments were called, we removed outliers as in Belbin et al.10. First, any identity-by-descent segments overlapping centromeres or telomeres were removed. Identity-by-descent tracts intersecting the human leukocyte antigen (HLA) region were also removed. To find other regions of the genome that may have erroneously high identity by descent, we calculated the total amount of identity by descent contained at each SNP in our input file by summing all segments that overlapped that SNP. SNPs that had total identity by descent greater or less than 3 standard deviations from the genome-wide mean were removed. In total, 6,696 SNPs were removed.
For downstream analysis, identity-by-descent segment lengths were summed between individuals, meaning that, for a given pair of individuals, all the identity-by-descent segments that they shared across all chromosomes were added together to create one summary number.
We removed pairs of individuals who were immediate family members using two methods. First, we used the PLINK 2.0 implementation of KING101 to identify relatives of third degree or closer, using the parameter of –king-cutoff with a value of 0.0884. KING was run on all SNPs with MAF > 0.05 and after linkage pruning, using PLINK and –indep-pairwise 50 10 0.1. As KING may underestimate the relatedness of individuals, especially in the case of individuals with high levels of autozygosity26, we also filtered pairs based on the total amount of identity by descent shared. Using empirical data reported to DNA Painter102, we determined that a conservative threshold of second-degree relatedness was a threshold of 1,000 cM. We removed any pairs with identity by descent higher than this threshold.
Sensitivity analyses.
To characterize the robustness of our results to the choice of phasing and identity-by-descent calling algorithms, we performed additional sensitivity analyses with different algorithm choices. Statistical phasing was performed with Eagle version 2.4.1 (ref. 103), and identity-by-descent calling was performed using hap-ibd104. As with iLASH, identity by descent was called for segments more than 3.0 cM long and on individuals who were unrelated (more than third-degree relatives). After calling all identity-by-descent segments across ATLAS and the reference data, we summed the total amount of identity by descent shared between a pair of individuals. We then calculated the Pearson’s correlation between the total identity by descent shared between a pair detected with SHAPEIT4 + iLASH and the total amount detected with Eagle + hap-ibd.
We further characterized the robustness of the clusters initially identified with iLASH. We re-performed Louvain clustering as we did previously, using three iterations of clustering and merging any clusters with . To assess the consistency of the clustering, we randomly sampled 10,000 ATLAS pairs and asked if they were in the same cluster originally, if the pair was still in the same cluster with the new algorithm or vice versa.
Cluster identification
Louvain clustering algorithm.
To infer clusters, we followed the approach of Dai et al.12 and used the Louvain method for cluster detection27. This method finds structure in large networks and has been shown to work well on genetic data12. We applied this algorithm to an undirected network constructed from identity-by-descent sharing, where each node represented an individual, and edge weights were defined as the genome-wide sum of identity-by-descent sharing between the nodes. An advantage of the Louvain algorithm is that it can be run iteratively, meaning that an initial run over the entirety of the graph can be used to define broad substructure, which can be further resolved into more fine-scale clusters upon subsequent iterations.
For cluster detection, we used the Python package NetworkX105. We created an undirected graph representation of the identity-by-descent matches, where each node was an individual, and an edge between individuals was weighted by the total amount of identity-by-descent matches shared between the two people.
Louvain clustering implemented in NetworkX was used iteratively to detect fine-scale populations. It was first run to detect a primary set of clusters. Each cluster was then subject to Louvain clustering again, and these subclusters were clustered once more, for a total of three runs of Louvain clustering.
After generating clusters with the Louvain algorithms, the clusters were merged using , as in Dai et al.12. We used the implementation of Hudson’s from PLINK 2.0. It was run on all pairs of clusters from the third level of the Louvain clustering, and clusters that had were merged. Because may perform poorly in small populations, clusters with fewer than 10 people were removed68. This threshold was selected because it gave good separation of clusters on a subcontinental level.
Cluster identity and demographics.
We primarily used external reference data to characterize what populations may be contributing to a cluster. Some clusters did not contain any reference data, or the reference data did not capture important aspects of the cluster. For example, there was no Ashkenazi Jewish reference data, only reference data labeled by European countries. To address this problem, we used the de-identified EHR demographic table as an additional source of information. This included EHR-reported race and ethnicity, preferred language and religion (Fig. 3d). We emphasize that race, ethnicity and religion are not determined by identity-by-descent segments but represent sociocultural characteristics that may be related to characterizing the cluster. We chose to use religion when it was relevant to identifying a historically persecuted group (that is, ‘Lebanese Christian’ instead of just ‘Lebanese’). These groups often have distinct histories and cultural practices, which can affect demography, environment and disease risk. For example, it is well known that Ashkenazi Jews have distinct genetic risks relative to other Europeans106. Thus, including religion in this study may offer opportunities to improve the health of understudied ethnoreligious groups.
Most ATLAS patients are not Latino, have no religious preference and indicated that they prefer to speak English. We, therefore, explored cluster identity using individuals who preferred a different language or religion or were identified as Hispanic/Latino in the EHR (note that the actual number of English speakers may be lower, as some patients may not, for societal or practical reasons, have this information included in their medical records).
For downstream analysis, we focused on identity-by-descent clusters that had more than 40 members to ensure a large enough sample size for our EHR and genetic analyses.
Additional summary statistic reference data were used to compute Hudson’s between ATLAS identity-by-descent clusters and external populations, including identity-by-descent clusters identified in the BioMe biobank. This enabled additional refinement, along with the use of EHR demographic information and cluster-level admixture analyses.
Latino subclusters.
We obtained an additional reference dataset that focused on fine-scale indigenous populations of Mexico30. Notably, some of these indigenous groups also live in neighboring Guatemala, Belize, Honduras and El Salvador, which were all part of the historic Mesoamerica region that was broken up by Spanish colonization107. We created one combined dataset containing the indigenous population genomes and those of patients from the Mexican and Central American identity-by-descent cluster and performed an additional level of Louvain clustering. As above, we merged clusters with low differentiation (). One set of four subclusters was merged for subsequent analyses and was referred to the Central American identity-by-descent cluster.
EHR demographic characteristics were explored for each subcluster. Phecode associations for each subcluster were also compared using the logistic regression model and heterogeneity in effect size was analyzed for the three largest subclusters along with the Puerto Rican and Afro-Caribbean clusters.
Genetic analyses
Identity-by-descent distribution.
To find the distribution of identity-by-descent in a cluster, we considered segments of individuals assigned to the same cluster. We summed the identity-by-descent segments to get the total identity by descent shared between the pair and calculated the distribution of total identity by descent between members of the cluster.
ROH distribution.
For ROH, we first performed linkage pruning and MAF filtering using PLINK and the parameters –maf 0.01–indep-pairwise 50 10 0.1. ROH calling was also performed using PLINK and the parameters -homozyg–homozyg-density 200–homozyg-gap 500–homozyg-kb 3000–homozyg-snp 65–homozyg-window-het 0–homozyg-window-missing 3–homozyg-window-snp 65. Detected ROH were summed within an individual. We then calculated the distribution of detected ROH of all individuals within a cluster.
IBDNe.
IBDNe was run using the identity-by-descent haplotypes estimated using iLASH. We filtered the iLASH output for each chromosome to individuals from a single cluster. The haplotypes were combined into one file for IBDNe input. IBDNe was run with default parameters and the hg38 genetic map provided on the IBDNe website.
.
For the heat map of , we calculated the pairwise Hudson’s , as described in the ‘Louvain clustering algorithm’ subsection.
We calculated between the largest final clusters (after Louvain clustering and merging). Data were visualized using Python Seaborn cluster map with default parameters.
Genetic relatedness network.
The network visualization between clusters was developed using NetworkX. The input was a matrix where each row and columns represented one of the largest clusters, and each entry was the mean identity by descent shared between the two clusters. To find this mean, we found all possible pairs of individuals between the two clusters. If the pair did not have any identity by descent detected, we set their sharing to 0 and then calculated the mean over all possible pairs. This was to prevent biasing the mean identity by descent by limiting it to only pairs that had identity by descent detected. This square matrix was then used to create a weighted undirected graph, where the nodes were the clusters and the edges were the mean identity by descent between the clusters. We visualized the graph using 1,000 iterations of the Fruchterman–Reingold force-directed algorithm108.
Statistical analysis and reproducibility
Association testing.
Statistical testing was done using the Python StatsModel109 package. For each phecode, we determined whether an individual had ever been assigned that phecode in an outpatient context, making the outcome binary. Cluster status was binary and could be either a particular cluster versus all other biobank participants or a particular cluster compared against another cluster. We tested whether binary cluster status was associated with phecode assignment using the StatsModel GLM command with the family set to binomial. We corrected for sex, age and BMI in these analyses. Specifically, the command we used was:
The same statistical framework was used to test for ER diagnoses and specialty visits, where, instead of phecode assignment, the outcome was whether an individual had visited a doctor with a given specialty reported in the EHR. In all cases, we restricted to specialties, diagnoses or zip codes with at least 30 visits.
An association was considered significant after controlling for FDR at 5% using the Benjamini–Hochberg procedure. Multiple test correction was performed across phecodes each time a regression analysis was performed—that is, for each cluster–background comparison.
Heterogeneity test.
To calculate whether there was a significant difference in the effect sizes between clusters for a given phecode, we performed a mixed-effects meta-regression test for heterogeneity, implemented in the R package metafor43. Specifically, we used the function rma.uni. If we have an effect size estimate, , and its associated standard error, , for cluster , the function would be:
Reproducibility.
To assess the reproducibility of the results presented in this work, we obtained published association statistics taken from the BioMe biobank at Mount Sinai10. For six related identity-by-descent clusters comprising similar populations in ATLAS and biobank (Supplementary Table 3), we computed ORs for phecodes tested in both biobanks. We compared the effect size of the estimates using a Pearson’s correlation.
Website.
The website hosting the data visualization is implemented as a single-page application110. The application was developed in the JavaScript framework React, where each graph page is implemented as a separate component. The map plot is powered by the deck.gl library developed by Mapbox, which provides maps for data overlays. The other graphs are powered by the react-plotly.js library developed by Plotly, which provides a React interface to create interactive plots. The application has no backend, as the data are relatively small, require no modification or manipulation per request and are not subject to any privacy concerns due to their approval for release. All the data are stored in static JSON files that the application directly references to generate data visualizations. The website code and underlying data are publicly available on GitHub with an MIT license, which will allow others to contribute to the application as well as use the code to build visualizations for their own organizations.
Data visualization.
Data analysis was done in Python 3.7 using Jupyter Notebooks. Visualization was done using Seaborn and Matplotlib.
Reporting summary
Further information on research design is available in the Nature Portfolio Reporting Summary linked to this article.
Extended Data
Extended Data Fig. 1 |. Principal component analysis of ATLAS and reference data.
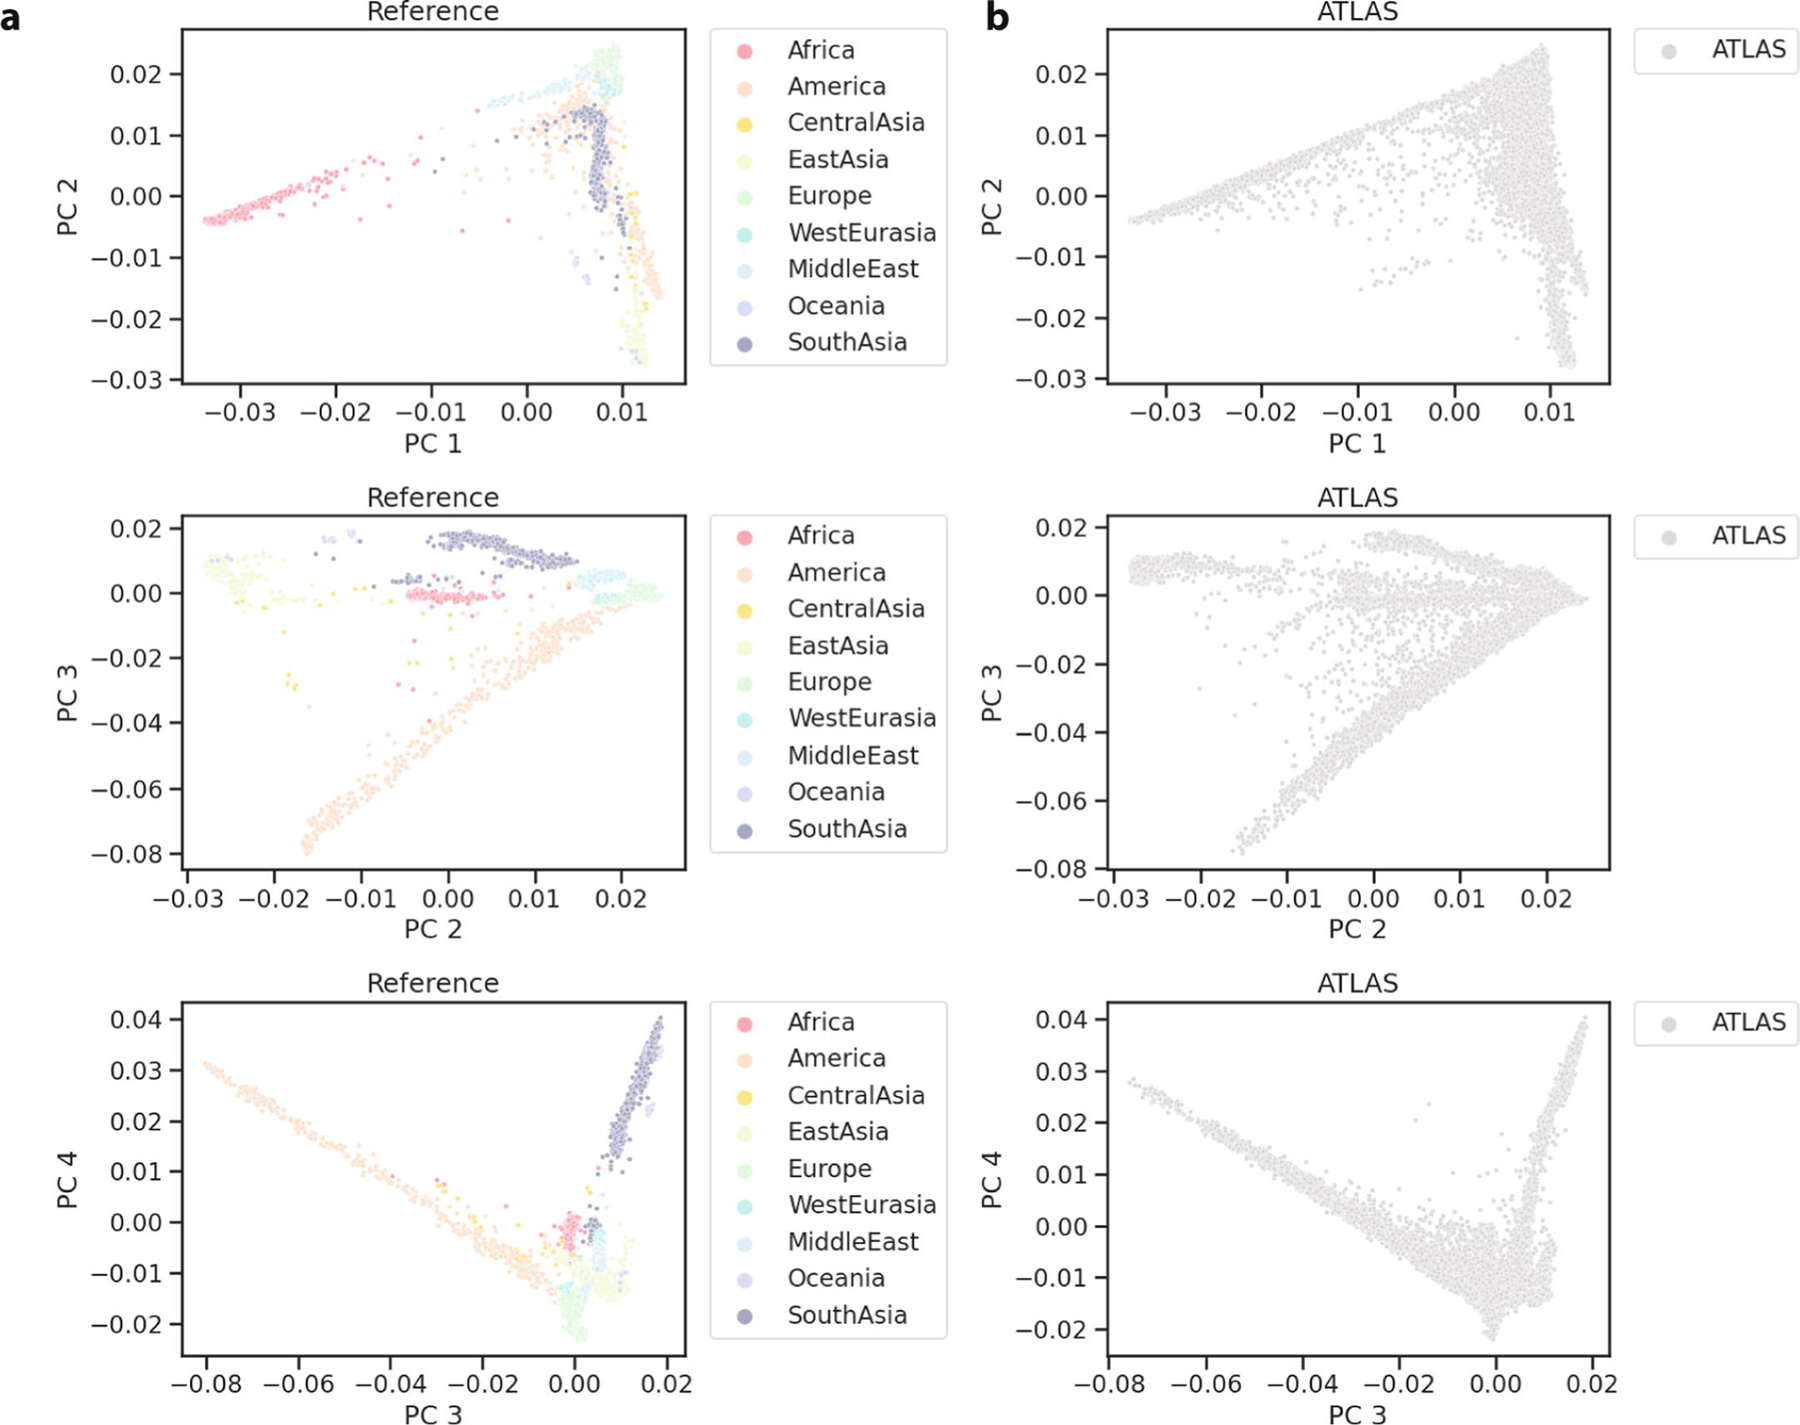
(a) PC1-PC4 of reference data and (b) ATLAS projected onto the reference data PC’s.
Extended Data Fig. 2 |. ATLAS and Los Angeles demographics.
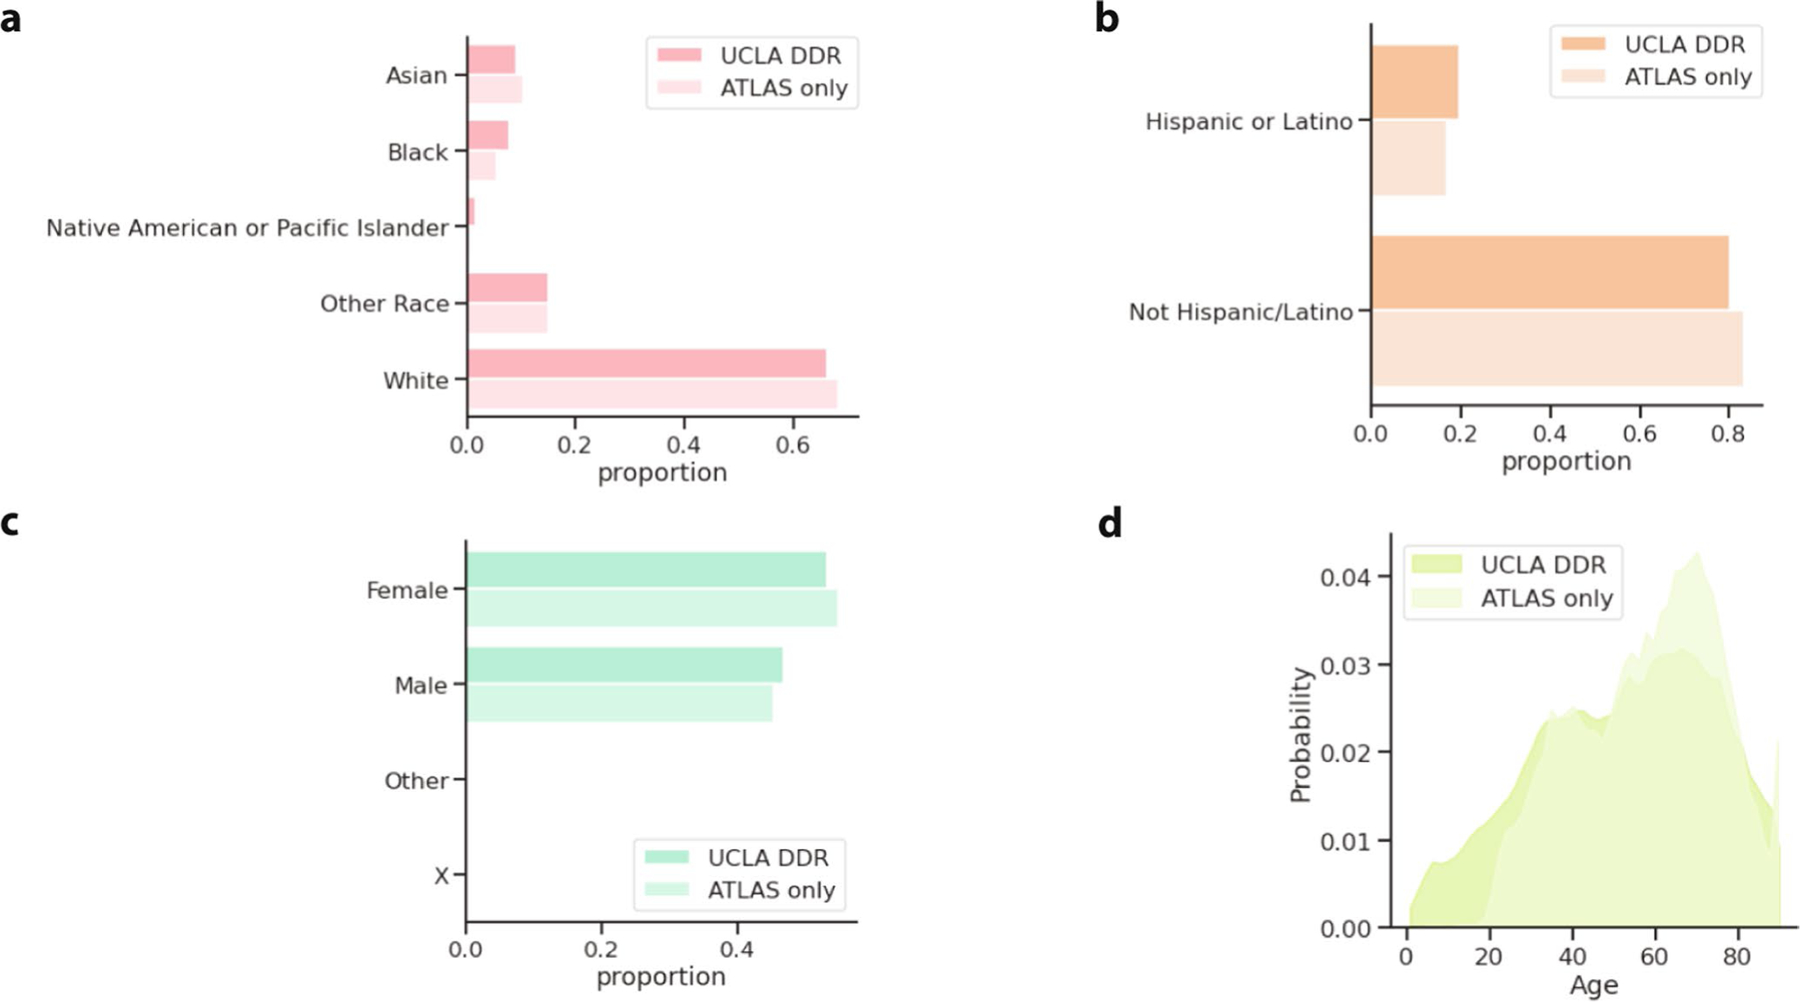
For patients who had recorded EHR demographic information, the proportion of ATLAS or the overall UCLA DDR patient population (a) recorded as each race, (b) recorded as Hispanic or Latino ethnicity, (c) and recorded as Male/Female or Other. (d) The distribution of patient age in ATLAS and the general UCLA patient population (where patients over 90 years old are censored to 90 for privacy reasons).
Extended Data Fig. 3 |. Sensitivity and degree centrality of clusters.
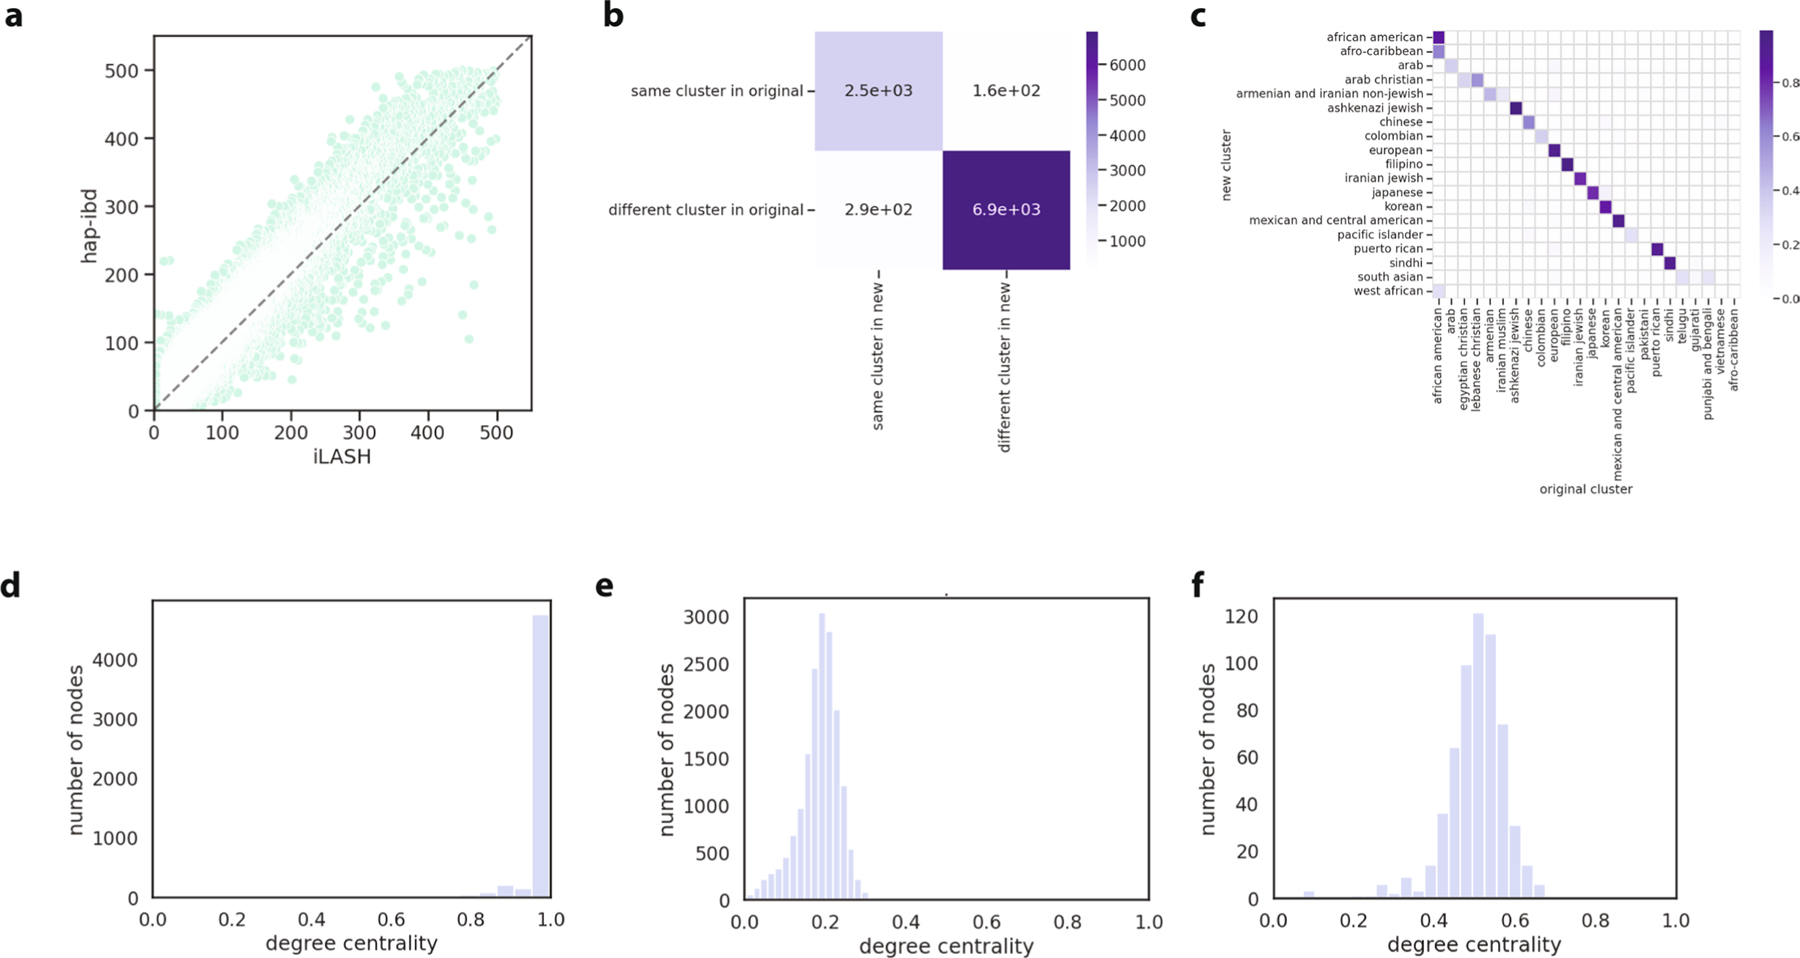
(a) The relationship between identity-by-descent called with Shapeit4 + iLASH (x-axis) and Eagle + hap-ibd (y-axis). Each dot represents the total identity-by-descent sharing between one pair of individuals. (b) The consistency between the Louvain clusters that were identified with the Shapeit4 + iLASH approach (‘original’) and Eagle + hap-ibd (‘new’) approaches. For 10,000 random pairs of individuals, we assessed whether the pair remained in the same cluster in the new approach, or vice-versa. (c) The proportion of participants in the ‘new’ clusters in each of the original clusters. (d) The degree centrality distribution (node degree divided by the max possible degree in the cluster) of selected clusters from the final round of Louvain clustering for a cluster where nearly every individual in the cluster is connected to every other member of the cluster. (e) is an example of a cluster where individuals share some connections, but on average are less connected to each other, and (f ) is an example where individuals are moderately connected to each other.
Extended Data Fig. 4 |. FST between clusters and external reference data.
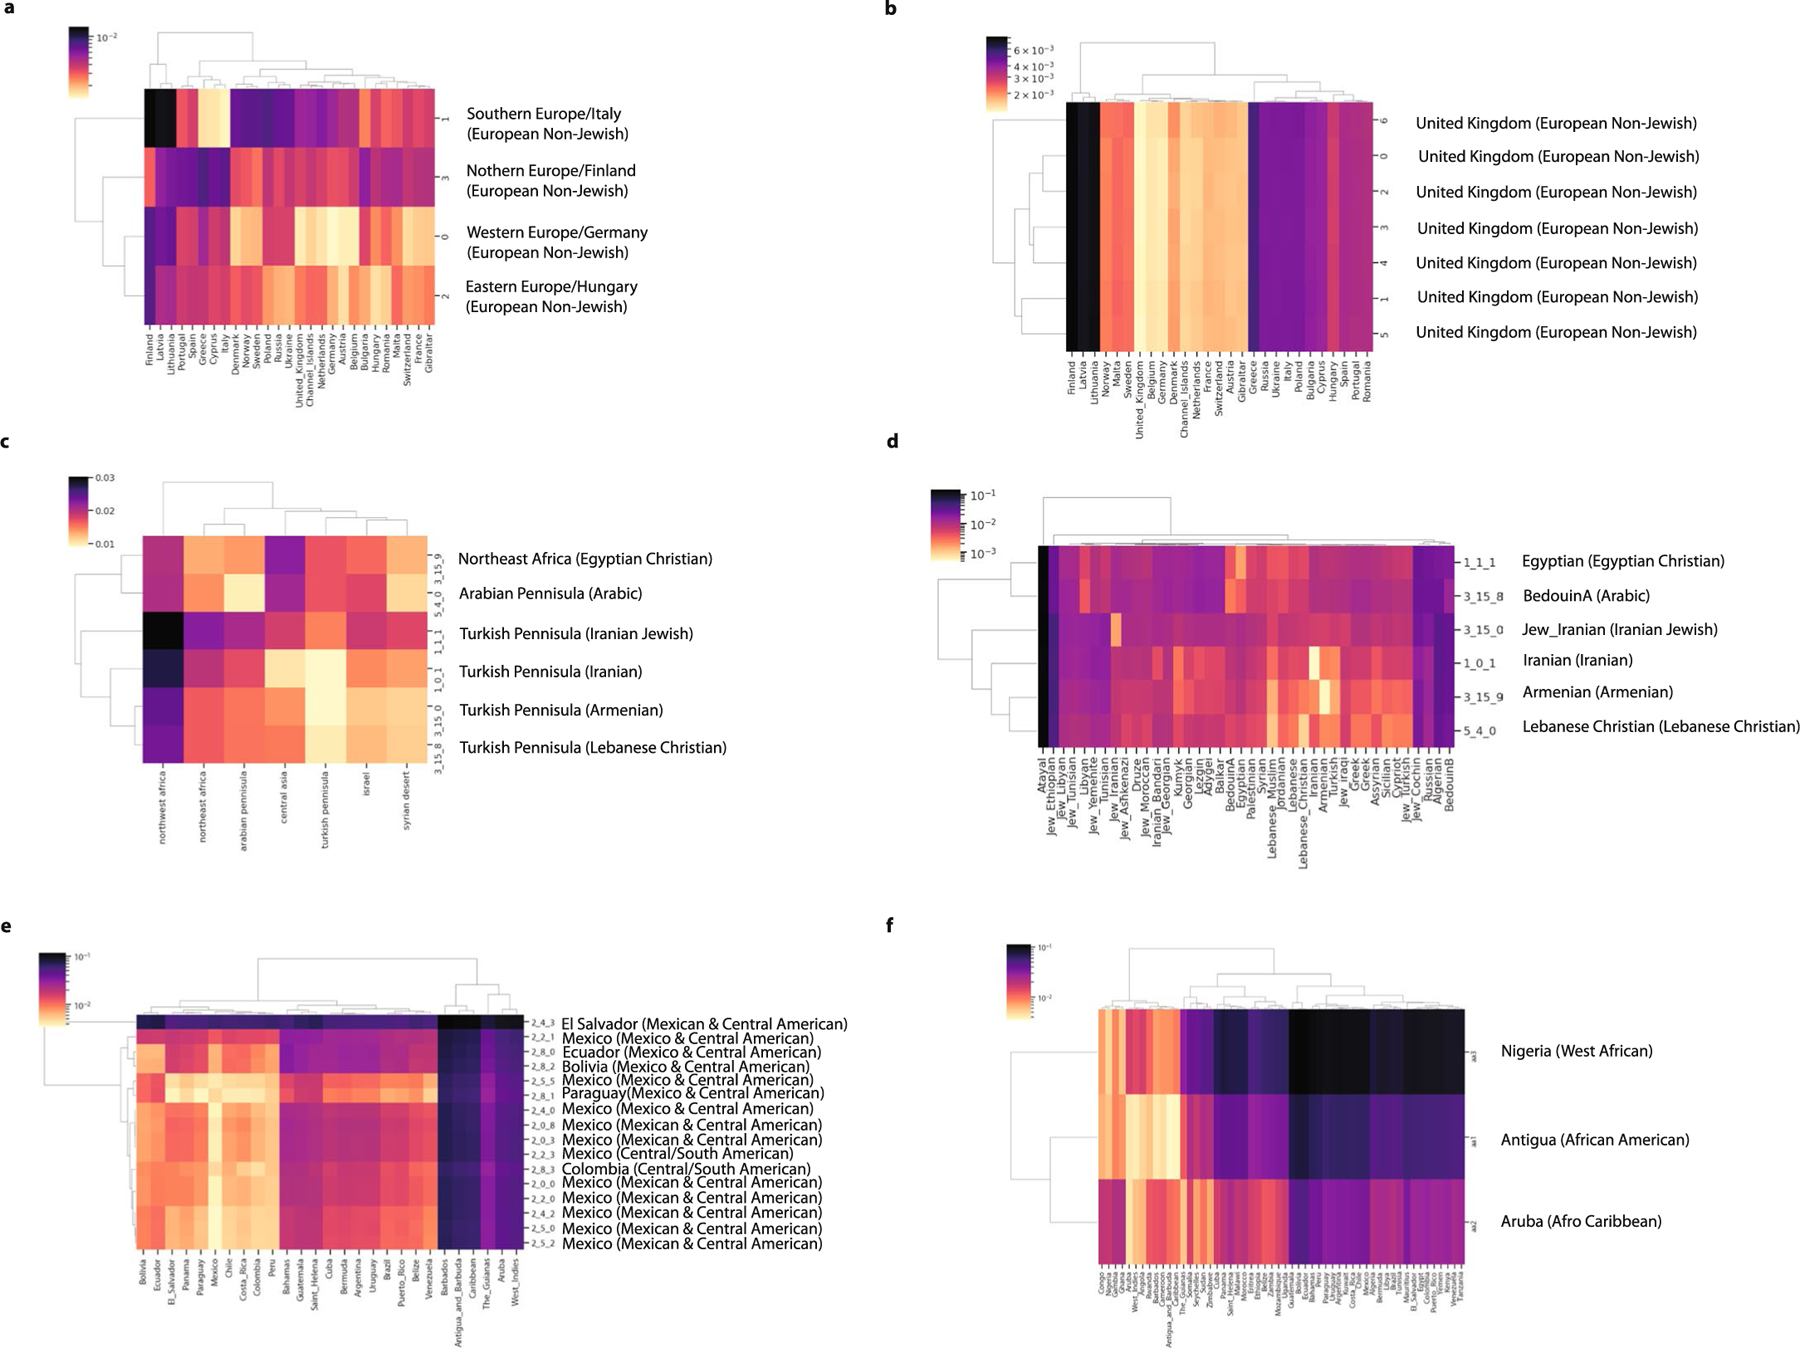
(a) between one set of subclusters (subclusters UCLA_3_7_*) that made up the European cluster and samples from the UKBioBank who were born outside the United Kingdom, combined with a random sample of 100 individuals born in the United Kingdom. The second set of European subclusters (subclusters UCLA_3_8_*) are shown in (b). (c) between the Greater Middle East Variome111 populations and UCLA clusters with Middle Eastern or Central Asian ancestry and (d) between modern day Middle Eastern populations112 and UCLA clusters with Middle Eastern/Central Asian ancestry. (e) between UKBB participants born in the Americas and subclusters that made up the Central/South American cluster. (f ) between UKBioBank participants born in Africa or the Americas and the three Black/African American clusters. For all plots, the country with the smallest to the ATLAS cluster is labeled. The ATLAS cluster name the subcluster belongs to is indicated in parentheses. The brighter the color, the smaller the value, suggesting less differentiation between the two groups.
Extended Data Fig. 5 |. Cluster admixture and principal component analysis.
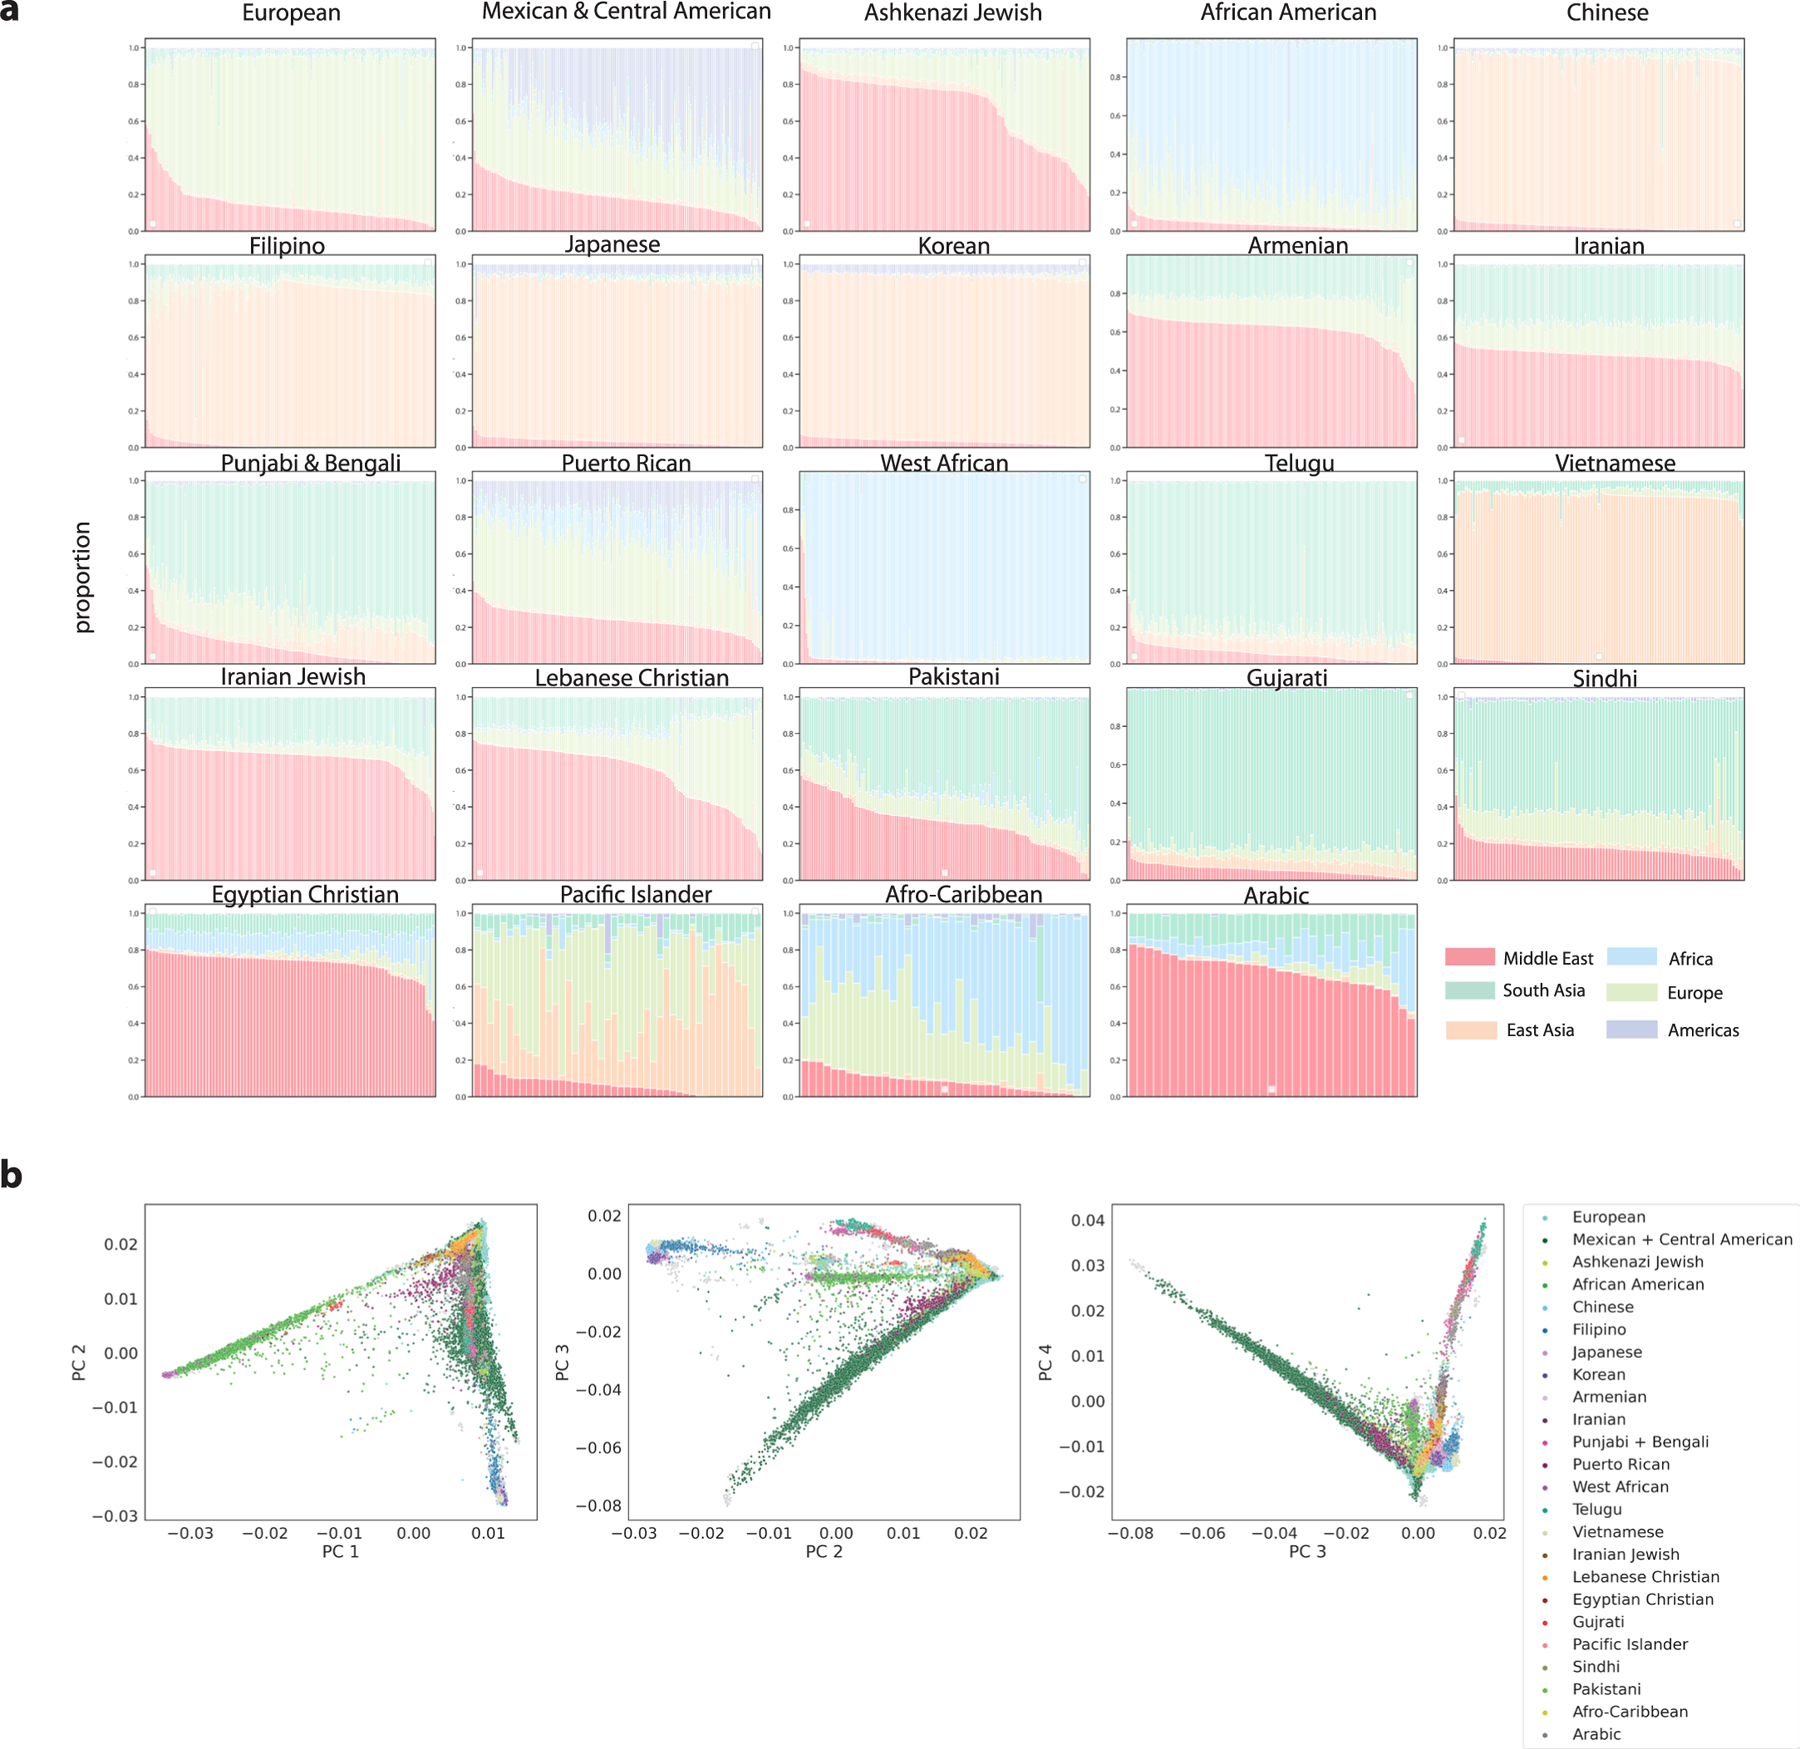
(a) For the 24 largest clusters, the admixture proportions inferred with SCOPE with K = 6 for 100 randomly selected individuals. If the cluster has less than 100 individuals, all individuals are shown. (b) The twenty-four largest clusters were colored on a PCA analysis where ATLAS biobank participants were projected onto principal components calculated over the reference individuals.
Extended Data Fig. 6 |. Mexican/Central American Subclusters.
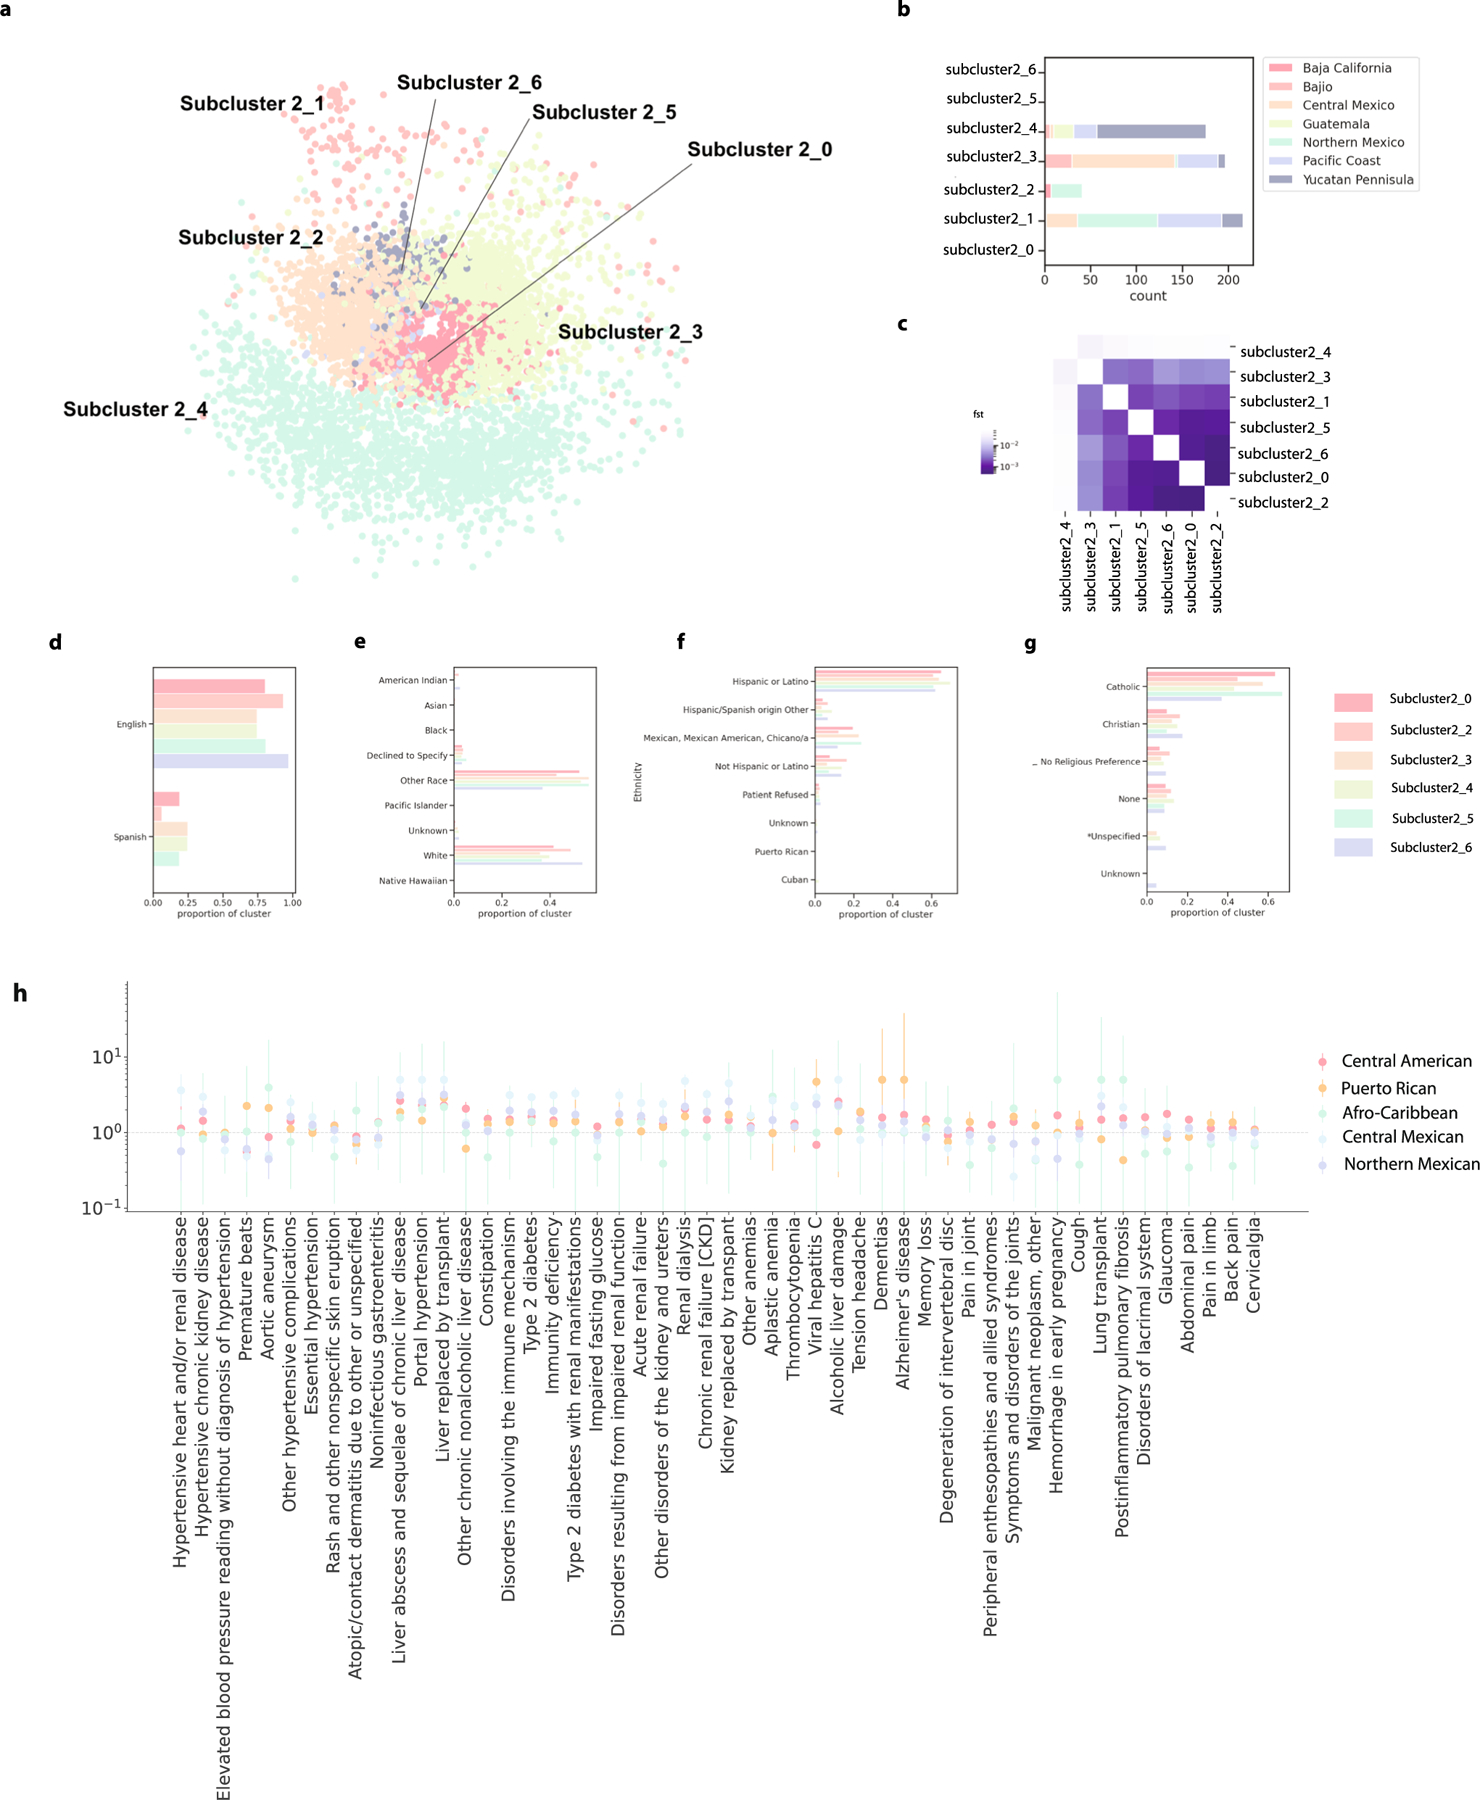
(a) The seven subclusters were visualized using a force-directed graph, where each dot represents one individual and the color of the dot indicates which cluster that individual belongs. (b) The number of Mexican indigenous reference samples in each subcluster, colored by primary geographic region. (c) Hudson’s FST between the clusters. (d) The proportion of each subcluster preferring to speak English or Spanish. (e) The proportion of each subcluster preferring a religion in the EHR, if any. (f ) The proportion of each subcluster identifying as each race in the EHR. (g) The proportion of each subcluster identifying as each ethnicity subcategory in the EHR. (h) The odds ratio of phecodes associated with membership in the Central American (n = 1998), Puerto Rican (n = 288), Afro-Caribbean (n = 39), Central Mexican (n = 2094) and Northern Mexican (n = 1115) identity-by-descent clusters. The dot represents the odds ratio and the error bar represents the standard error.
Extended Data Fig. 7 |. Demographics of clusters.
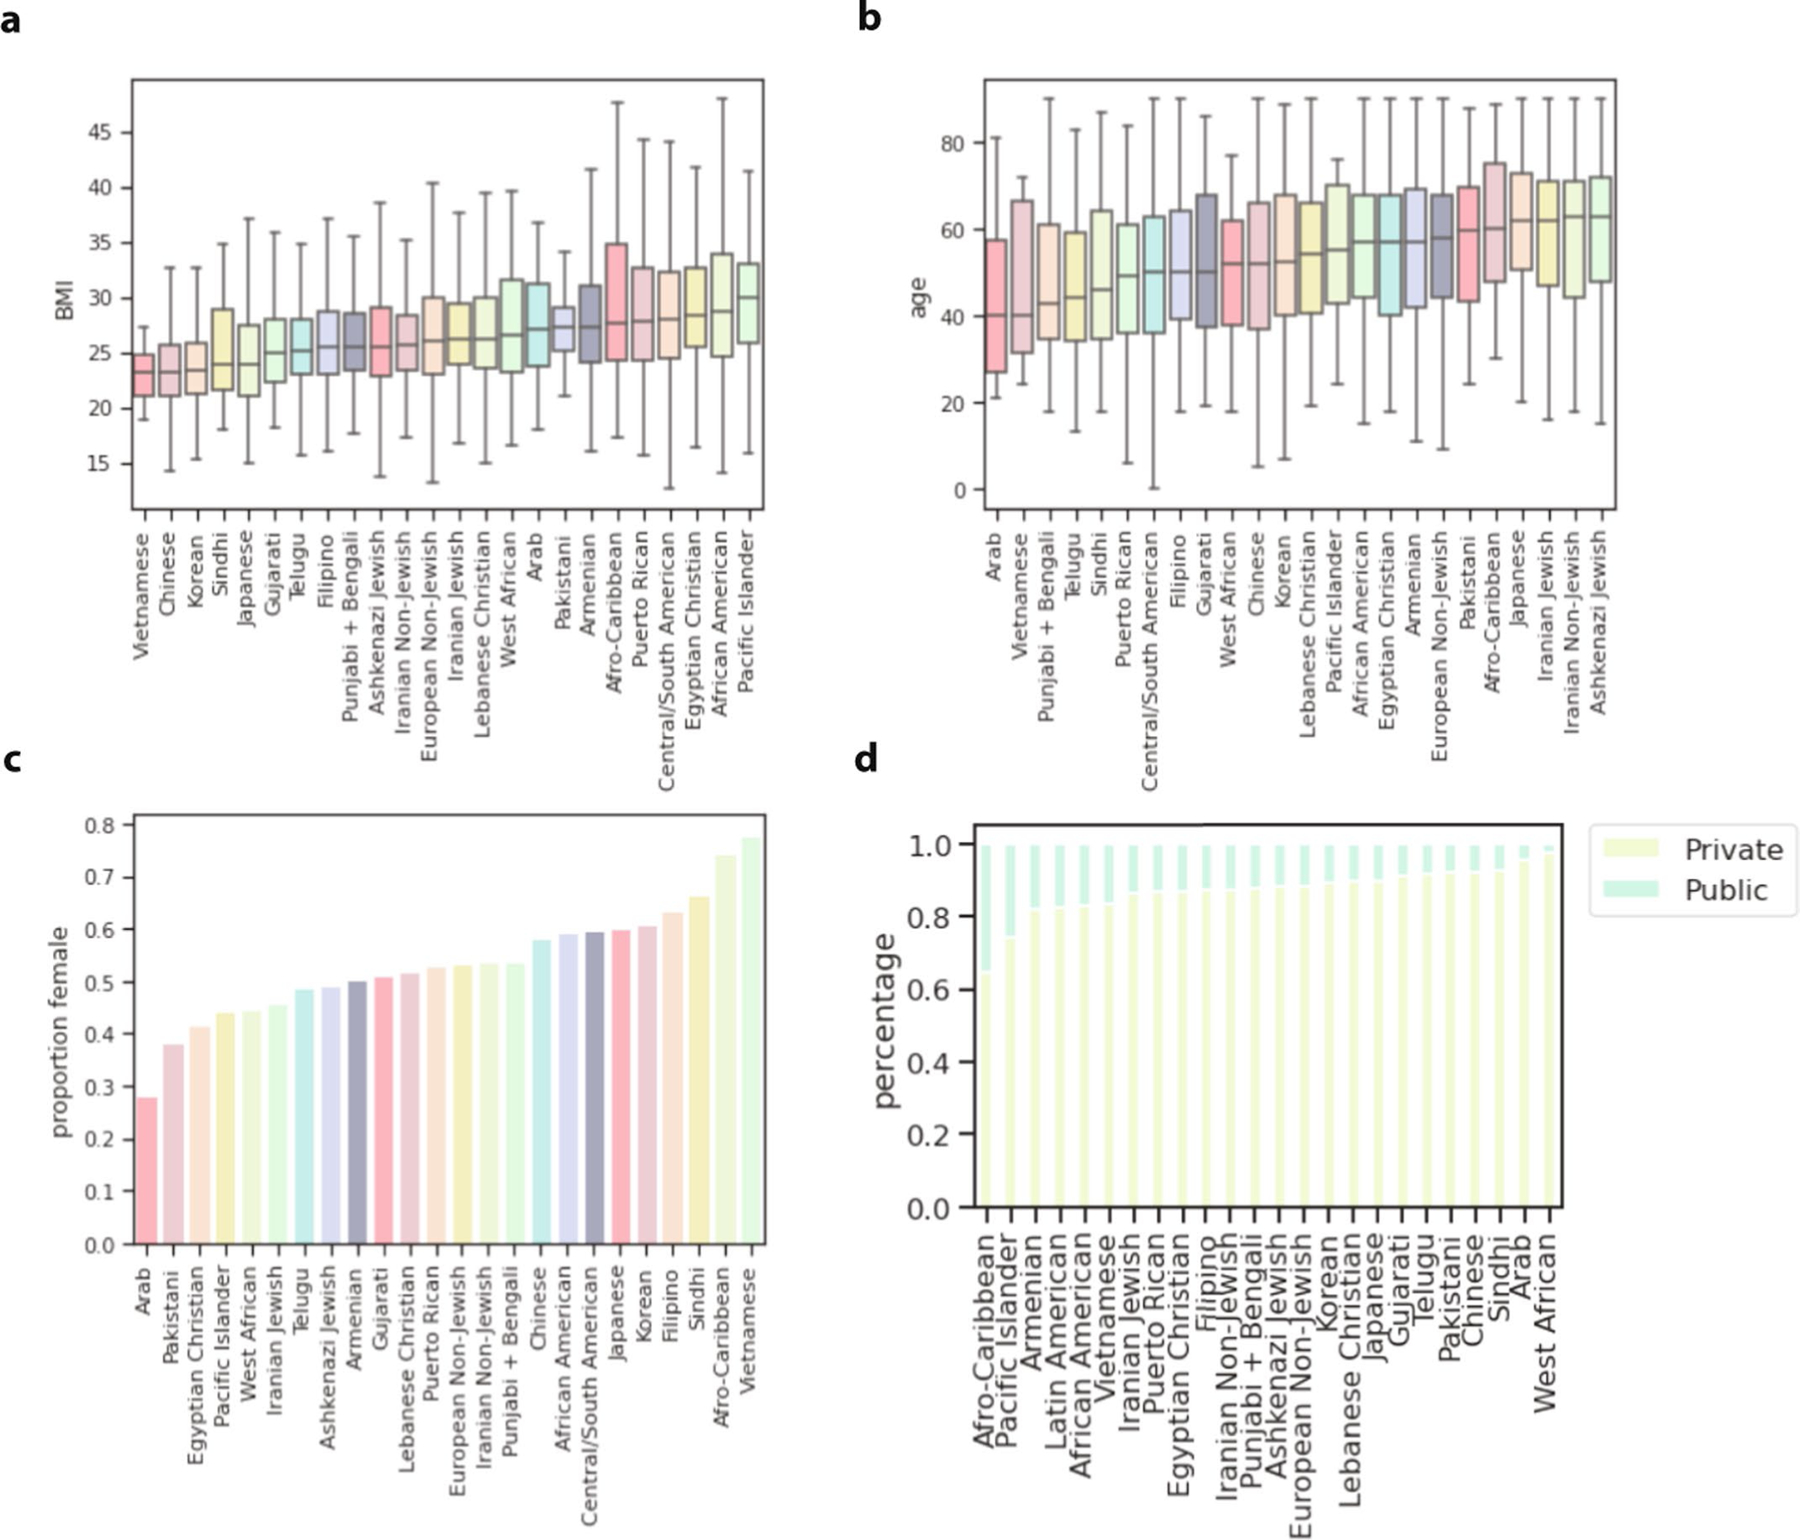
For each of the largest identity-by-descent clusters, the (a) distribution of median patient BMI of participants in the cluster, (b) the distribution of max patient age of participants in the cluster, (c) the proportion of the cluster that is female based on EHR demographic records, and (d) the proportion of the cluster reported to be on private or public insurance. In the box plots, the center line of the box indicates the mean, the outer edges of the box indicate the upper and lower quartiles, and the whiskers indicate the maxima and minima of the distribution.
Extended Data Fig. 8 |. Healthcare utilization in alternative contexts.
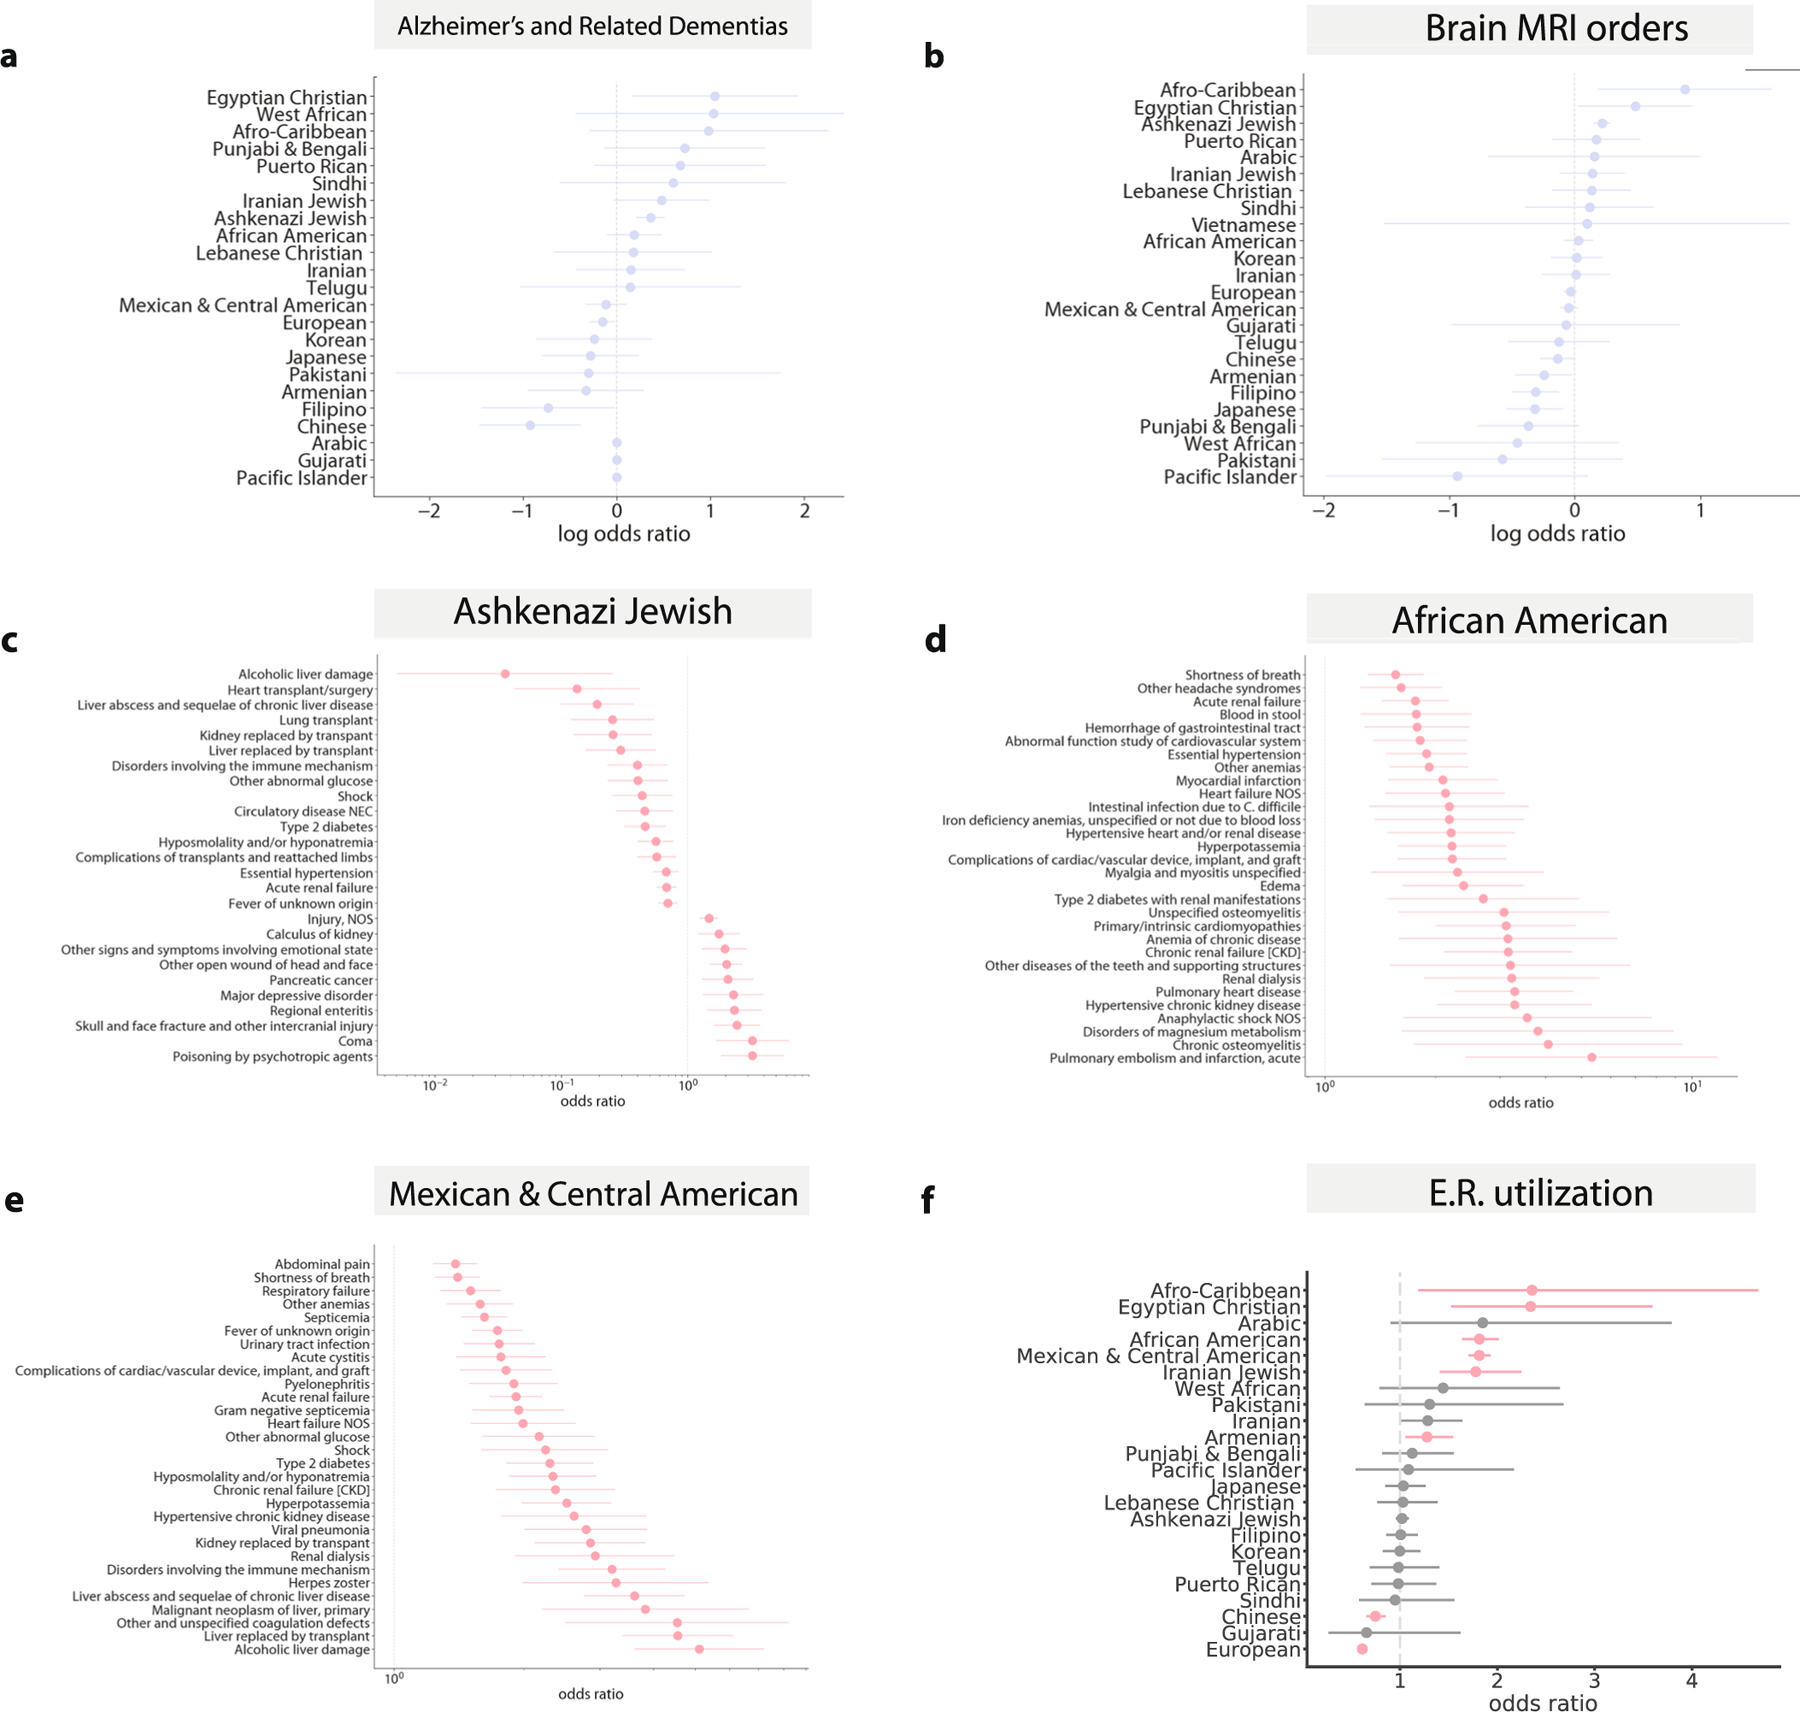
(a) The association between identity-by-descent cluster membership and a manually curated list of Alzheimer’s and dementia ICD codes and (b) the association between identity-by-descent cluster membership and brain MRI imaging orders. The odds ratio of whether a given phecode assignment is associated with membership in the (c) Ashkenazi Jewish (n = 5309) (d) African American (n = 1877) and (e) Mexican and Central American (n = 6075) identity-by-descent clusters versus the remaining biobank participants, in emergency room settings. Phecodes significant at FDR 5% are shown and if there are more than 30 significant associations, we plot only the top 40 with the largest absolute log odds ratio. (f ) The odds ratio of patients in a given identity-by-descent cluster visiting the emergency room relative to the remaining biobank participants, after controlling for age, sex, and BMI. In each plot, the dot represents the odds ratio and the bar represents the standard error.
Extended Data Fig. 9 |. Fine-scale health utilization in ATLAS.
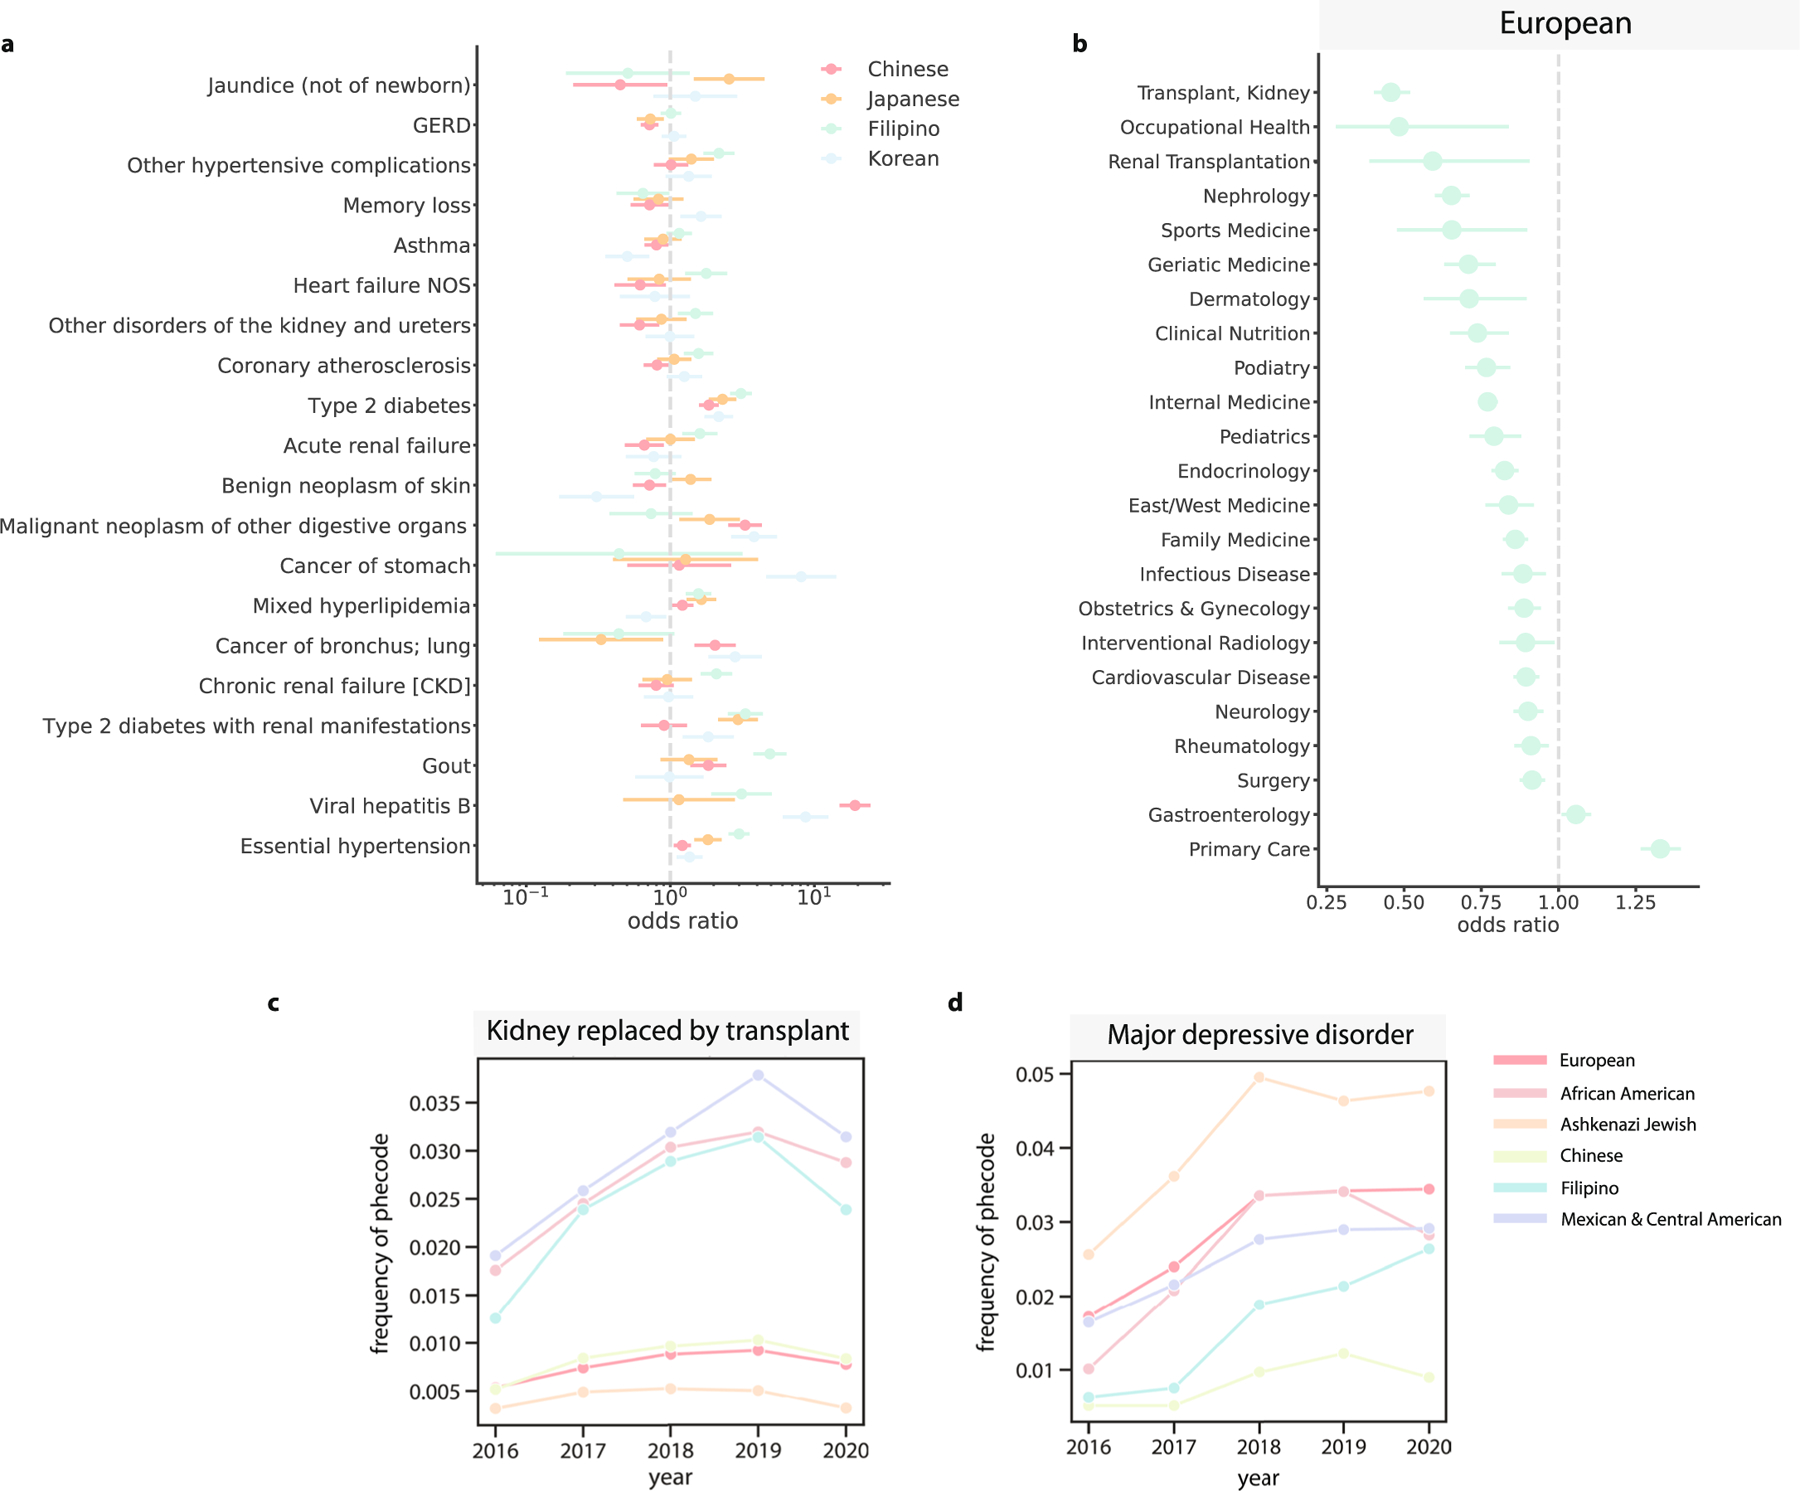
(a) For the Chinese (n = 1547), Japanese (n = 596), Filipino (n = 796), and Korean (n = 546) identity-by-descent clusters, phecodes that have significantly different odds ratios between the clusters. Error bars indicate the standard errors. (b) The odds ratio of the European identity-by-descent cluster visiting a particular specialty, assessed against all other biobank participants. Error bars represent the standard error. For 6 clusters, the proportion of that identity-by-descent cluster that visited the UCLA Health system each year in an outpatient setting receiving (c) kidney replaced by transplant, and (d) major depressive disorder.
Extended Data Fig. 10 |. Replication of effect sizes.
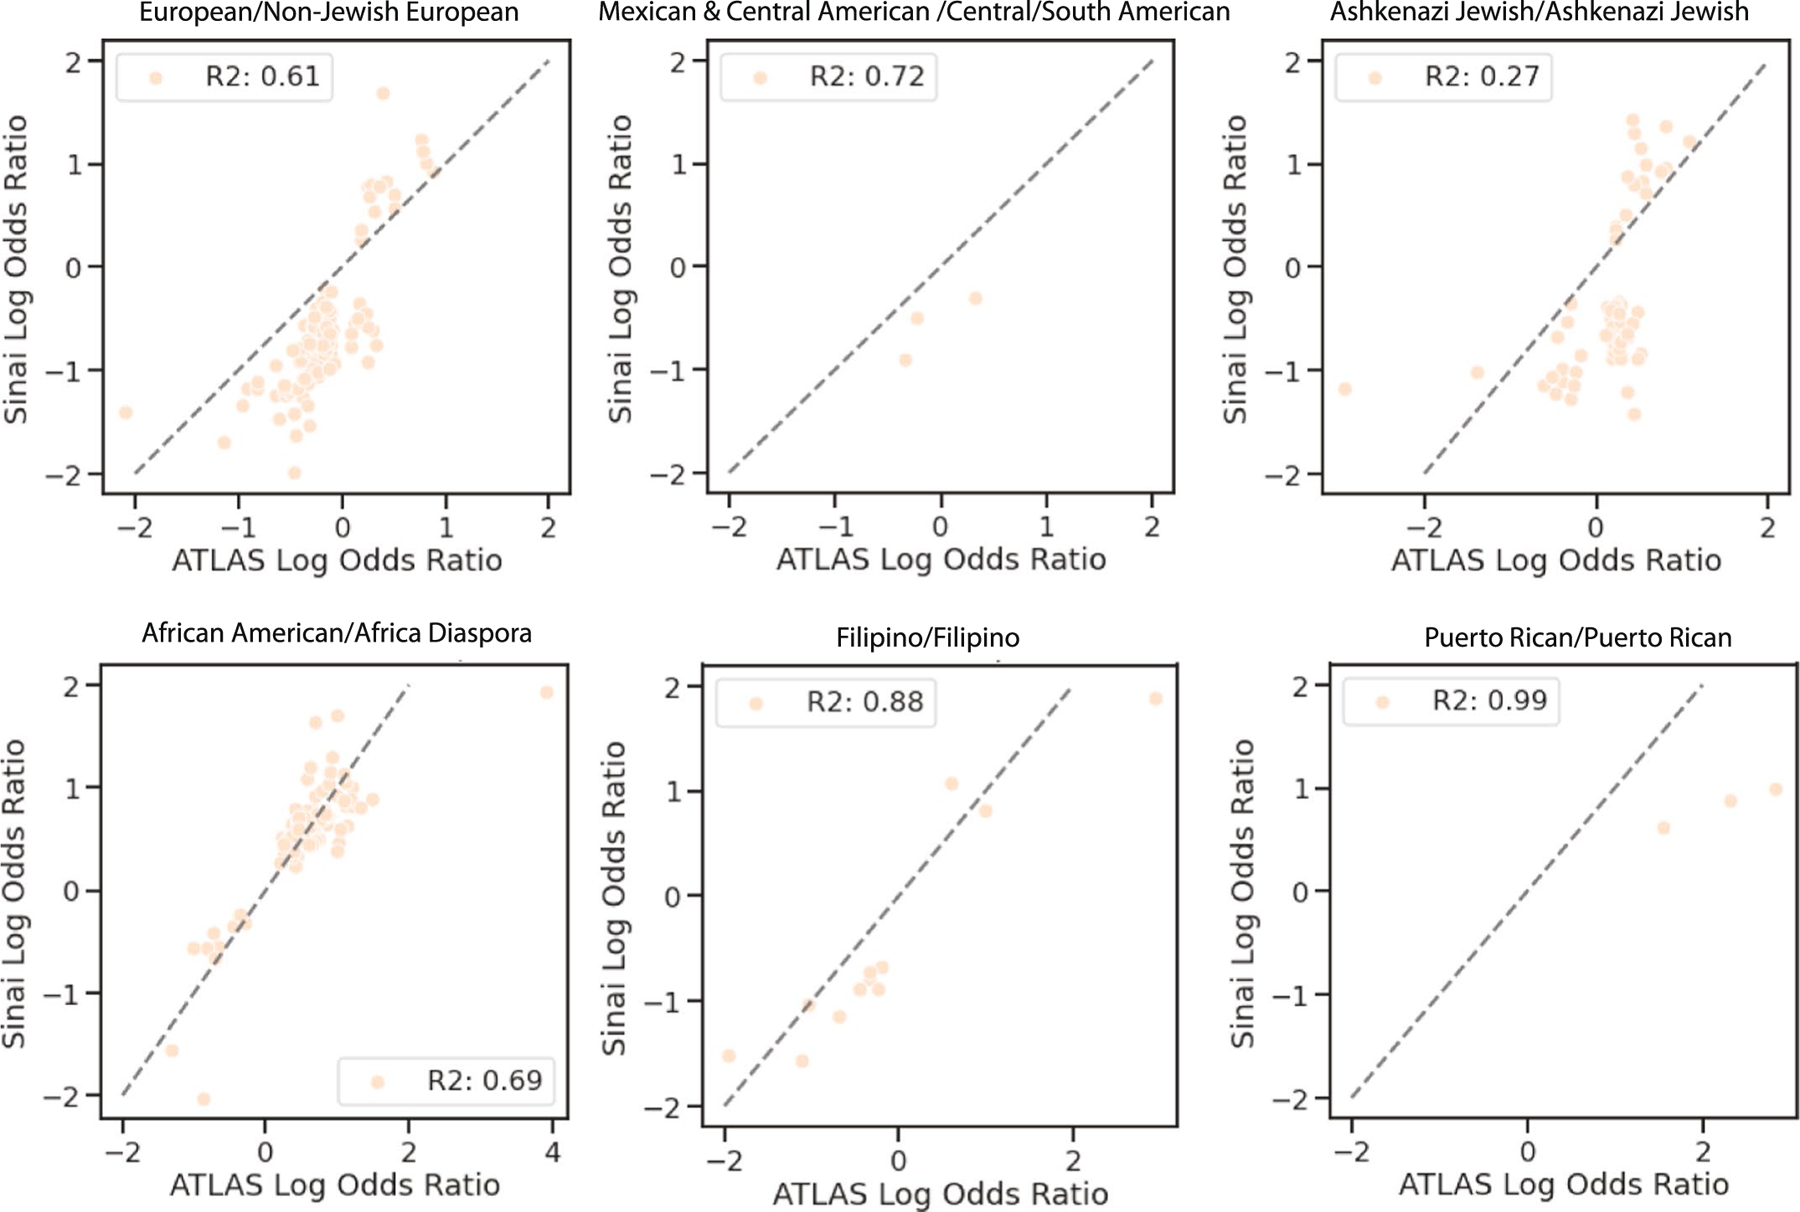
For phecodes significant in ATLAS, the log odds ratio of ATLAS (x-axis) versus the log odds ratio of BioMe (y-axis) for six ATLAS clusters (European: n = 17017, Mexican & Central American: n = 6075, Ashkenazi Jewish: n = 5039, African American: n = 1877, Filipino: n = 796, and Puerto Rican: n = 288) that were enriched for similar populations in the two biobanks (indicated by title).
Supplementary Material
Acknowledgements
We thank V. Kumar and M. Broudy for their expertise with the DDR. We thank A. Panofsky and A. Lewis for their helpful comments and discussions on this manuscript. We gratefully acknowledge the Institute for Precision Health, participating patients from the UCLA ATLAS Precision Health Biobank, the UCLA David Geffen School of Medicine, the UCLA Clinical and Translational Science Institute and UCLA Health. C.C. was supported by National Institutes of Health (NIH) grant F31NS122538. C.C., N.Z., D.E. and E.P. were supported by the following grants from the NIH: R01CA227237, R01ES029929, R01MH122688, U01HG009080, R01HL155024, R01HL151152, R01GM142112 and R01HG006399. C.R.G. is supported by NIH grants R01HL151152 and R01HG010297. J.A.S. and C.R.G. are supported by NIH grant U01HG011715. N.Z., E.K., C.G., V.A. and G.B. were supported by NIH grant R01HG011345. A.C. was supported by NIH grant T32HG002536 and National Science Foundation grant DGE-1829071. V.A. was supported by NIH grant DP5OD024579. The funders had no role in study design, data collection and analysis, decision to publish or preparation of the manuscript.
Footnotes
Online content
Any methods, additional references, Nature Portfolio reporting summaries, source data, extended data, supplementary information, acknowledgements, peer review information; details of author contributions and competing interests; and statements of data and code availability are available at https://doi.org/10.1038/s41591-023-02425-1.
Code availability
Code for identity-by-descent calling and clustering is available at https://github.com/christacaggiano/IBD. Code for the website is available at https://github.com/misingnoglic/atlas-app.
Competing interests
C.R.G. owns stock in 23andMe, Inc. E.E.K. has received personal fees from Regeneron Pharmaceuticals, 23andMe, Allelica and Illumina; has received research funding from Allelica; and serves on the advisory boards for Encompass Biosciences, Overtone and Galateo Bio. All other authors declare no competing interests.
Additional information
Extended data is available for this paper at https://doi.org/10.1038/s41591-023-02425-1.
Supplementary information The online version contains supplementary material available at https://doi.org/10.1038/s41591-023-02425-1.
Peer review information Nature Medicine thanks Han Chen, Erik Rodriquez and the other, anonymous, reviewer(s) for their contribution to the peer review of this work. Primary handling editors: Ming Yang and Jennifer Sargent, in collaboration with the Nature Medicine team.
Data availability
Patient-level EHR and genotyping data are protected due to patient privacy and can be accessed by collaboration with a UCLA researcher. All summary statistic data discussed in this paper are freely available on https://www.ibd.la/. 1000 Genomes Project data can be accessed at https://www.internationalgenome.org/data. Human Genome Diversity Project data can be accessed at the following FTP server: ftp://ngs.sanger.ac.uk/production/hgdp. Simons Genome Diversity Project data can be accessed at https://sharehost.hms.harvard.edu/genetics/reich_lab/sgdp/vcf_variants/. The human reference genome version hg38 was downloaded from the UCSC Genome Browser: https://hgdownload.soe.ucsc.edu/downloads.html. DbSNP version 147 was used in this study and was obtained from https://ftp.ncbi.nlm.nih.gov/snp/.
References
- 1.Williams DR, Mohammed SA, Leavell J & Collins C Race, socioeconomic status, and health: complexities, ongoing challenges, and research opportunities. Ann. N. Y. Acad. Sci. 1186, 69–101 (2010). [DOI] [PMC free article] [PubMed] [Google Scholar]
- 2.Fiscella K & Williams DR Health disparities based on socioeconomic inequities: implications for urban health care. Acad. Med. 79, 1139–1147 (2004). [DOI] [PubMed] [Google Scholar]
- 3.Geneviève LD, Martani A, Shaw D, Elger BS & Wangmo T Structural racism in precision medicine: leaving no one behind. BMC Med. Ethics 21, 17 (2020). [DOI] [PMC free article] [PubMed] [Google Scholar]
- 4.Martin AR et al. Clinical use of current polygenic risk scores may exacerbate health disparities. Nat. Genet. 51, 584 (2019). [DOI] [PMC free article] [PubMed] [Google Scholar]
- 5.Majara L et al. Low and differential polygenic score generalizability among African populations due largely to genetic diversity. HGG Adv. 4, 100184 (2023). [DOI] [PMC free article] [PubMed] [Google Scholar]
- 6.All of Us Research Program Investigators. The ‘All of Us’ Research Program. N. Engl. J. Med. 381, 668–676 (2019). [DOI] [PMC free article] [PubMed] [Google Scholar]
- 7.Johnson R et al. Leveraging genomic diversity for discovery in an EHR-linked biobank: the UCLA ATLAS Community Health Initiative. Genome Med. 14, 104 (2021). [DOI] [PMC free article] [PubMed] [Google Scholar]
- 8.Hateley S et al. The history and geographic distribution of a KCNQ1 atrial fibrillation risk allele. Nat. Commun. 12, 6442 (2021). [DOI] [PMC free article] [PubMed] [Google Scholar]
- 9.Sakaue S et al. A cross-population atlas of genetic associations for 220 human phenotypes. Nat Genet. 53, 1415–1424 (2021). [DOI] [PubMed] [Google Scholar]
- 10.Belbin GM et al. Toward a fine-scale population health monitoring system. Cell 184, 2068–2083 (2021). [DOI] [PubMed] [Google Scholar]
- 11.Saada JN et al. Identity-by-descent detection across 487,409 British samples reveals fine scale population structure and ultra-rare variant associations. Nat. Commun. 11, 6130 (2020). [DOI] [PMC free article] [PubMed] [Google Scholar]
- 12.Dai CL et al. Population histories of the United States revealed through fine-scale migration and haplotype analysis. Am. J. Hum. Genet. 106, 371–388 (2020). [DOI] [PMC free article] [PubMed] [Google Scholar]
- 13.Naseri A et al. Personalized genealogical history of UK individuals inferred from biobank-scale IBD segments. BMC Biol. 19, 32 (2021). [DOI] [PMC free article] [PubMed] [Google Scholar]
- 14.Gilbert E, Shanmugam A & Cavalleri GL Revealing the recent demographic history of Europe via haplotype sharing in the UK Biobank. Proc. Natl Acad. Sci. USA 119, e2119281119 (2022). [DOI] [PMC free article] [PubMed] [Google Scholar]
- 15.Henn BM et al. Cryptic distant relatives are common in both isolated and cosmopolitan genetic samples. PLoS ONE 7, e34267 (2012). [DOI] [PMC free article] [PubMed] [Google Scholar]
- 16.Johnson R et al. The UCLA ATLAS Community Health Initiative: promoting precision health research in a diverse biobank. Cell Genome 3, 100243 (2022). [DOI] [PMC free article] [PubMed] [Google Scholar]
- 17.U.S. Census Bureau (2015–2019). Place of birth for the foreign-born population in the United States American community survey 5-year estimates. https://censusreporter.org/data/table/?table=B05006&geo_ids=05000US06037,31000US31080,04000US06,01000US,86000US91030
- 18.Krieger N Who and what is a ‘population’? Historical debates, current controversies, and implications for understanding ‘population health’ and rectifying health inequities. Milbank Q. 90, 634–681 (2012). [DOI] [PMC free article] [PubMed] [Google Scholar]
- 19.Internal Revenue Service. SOI Tax Stats - Individual Income Tax Statistics - ZIP Code Data (SOI). https://www.irs.gov/statistics/soi-tax-stats-individual-income-tax-statistics-zip-code-data-soi
- 20.U.S. Census Bureau. U.S. Census Bureau QuickFacts: Los Angeles city, California. https://www.census.gov/quickfacts/losangelescitycalifornia [Google Scholar]
- 21.Carress H, Lawson DJ & Elhaik E Population genetic considerations for using biobanks as international resources in the pandemic era and beyond. BMC Genomics 22, 351 (2021). [DOI] [PMC free article] [PubMed] [Google Scholar]
- 22.Lewis ACF et al. Getting genetic ancestry right for science and society. Science 376, 250–252 (2022). [DOI] [PMC free article] [PubMed] [Google Scholar]
- 23.Auton A et al. A global reference for human genetic variation. Nature 526, 68–74 (2015). [DOI] [PMC free article] [PubMed] [Google Scholar]
- 24.Mallick S et al. The Simons Genome Diversity Project: 300 genomes from 142 diverse populations. Nature 538, 201–206 (2016). [DOI] [PMC free article] [PubMed] [Google Scholar]
- 25.Bergström A et al. Insights into human genetic variation and population history from 929 diverse genomes. Science 367, eaay5012 (2020). [DOI] [PMC free article] [PubMed] [Google Scholar]
- 26.Shemirani R et al. Rapid detection of identity-by-descent tracts for mega-scale datasets. Nat. Commun. 12, 3546 (2021). [DOI] [PMC free article] [PubMed] [Google Scholar]
- 27.Blondel VD, Guillaume J-L, Lambiotte R & Lefebvre E Fast unfolding of communities in large networks. J. Stat. Mech. 2008, P10008 (2008). [Google Scholar]
- 28.Chiu AM, Molloy EK, Tan Z, Talwalkar A & Sankararaman S Inferring population structure in biobank-scale genomic data. Am. J. Hum. Genet. 109, 727–737 (2022). [DOI] [PMC free article] [PubMed] [Google Scholar]
- 29.Bycroft C et al. The UK Biobank resource with deep phenotyping and genomic data. Nature 562, 203–209 (2018). [DOI] [PMC free article] [PubMed] [Google Scholar]
- 30.García-Ortiz H et al. The genomic landscape of Mexican Indigenous populations brings insights into the peopling of the Americas. Nat. Commun. 12, 5942 (2021). [DOI] [PMC free article] [PubMed] [Google Scholar]
- 31.Parvini S & Simani E Are Arabs and Iranians white? Census says yes, but many disagree. Los Angeles Times. https://www.latimes.com/projects/la-me-census-middle-east-north-africa-race/ [Google Scholar]
- 32.Naccashian Z, Hattar-Pollara M, Ho C (Alex) & Ayvazian SP Prevalence and predictors of diabetes mellitus and hypertension in Armenian Americans in Los Angeles. Diabetes Educ. 44, 130–143 (2018). [DOI] [PubMed] [Google Scholar]
- 33.Freeman JD, Kadiyala S, Bell JF & Martin DP The causal effect of health insurance on utilization and outcomes in adults: a systematic review of US studies. Med. Care 46, 1023–1032 (2008). [DOI] [PubMed] [Google Scholar]
- 34.Wei W-Q et al. Evaluating phecodes, clinical classification software, and ICD-9-CM codes for phenome-wide association studies in the electronic health record. PLoS ONE 12, e0175508 (2017). [DOI] [PMC free article] [PubMed] [Google Scholar]
- 35.Corriveau RA et al. Alzheimer’s Disease-Related Dementias Summit 2016: national research priorities. Neurology 89, 2381–2391 (2017). [DOI] [PMC free article] [PubMed] [Google Scholar]
- 36.Schiff ER et al. A new look at familial risk of inflammatory bowel disease in the Ashkenazi Jewish population. Dig. Dis. Sci. 63, 3049–3057 (2018). [DOI] [PMC free article] [PubMed] [Google Scholar]
- 37.Roth MP, Petersen GM, McElree C, Feldman E & Rotter JI Geographic origins of Jewish patients with inflammatory bowel disease. Gastroenterology 97, 900–904 (1989). [DOI] [PubMed] [Google Scholar]
- 38.Levav I, Kohn R, Golding JM & Weissman MM Vulnerability of Jews to affective disorders. Am. J. Psychiatry 154, 941–947 (1997). [DOI] [PubMed] [Google Scholar]
- 39.Pinhas L, Heinmaa M, Bryden P, Bradley S & Toner B Disordered eating in Jewish adolescent girls. Can. J. Psychiatry 53, 601–608 (2008). [DOI] [PubMed] [Google Scholar]
- 40.Yeung PP & Greenwald S Jewish Americans and mental health: results of the NIMH Epidemiologic Catchment Area Study. Soc. Psychiatry Psychiatr. Epidemiol. 27, 292–297 (1992). [DOI] [PubMed] [Google Scholar]
- 41.Solovieff N et al. Ancestry of African Americans with sickle cell disease. Blood Cells Mol. Dis. 47, 41–45 (2011). [DOI] [PMC free article] [PubMed] [Google Scholar]
- 42.Eltoukhi HM, Modi MN, Weston M, Armstrong AY & Stewart EA The health disparities of uterine fibroid tumors for African American women: a public health issue. Am. J. Obstet. Gynecol. 210, 194–199 (2014). [DOI] [PMC free article] [PubMed] [Google Scholar]
- 43.Viechtbauer W Conducting meta-analyses in R with the metafor package. J. Stat. Softw. 36, 1–48 (2010). [Google Scholar]
- 44.Centers for Disease Control and Prevention. People born outside of the United States and viral hepatitis. https://www.cdc.gov/hepatitis/populations/Born-Outside-United-States.htm (2020).
- 45.Rostomian AH, Soverow J & Sanchez DR Exploring Armenian ethnicity as an independent risk factor for cardiovascular disease: findings from a prospective cohort of patients in a county hospital. JRSM Cardiovasc. Dis. 9, 2048004020956853 (2020). [DOI] [PMC free article] [PubMed] [Google Scholar]
- 46.Cobb S, Bazargan M, Assari S, Barkley L & Bazargan-Hejazi S Emergency department utilization, hospital admissions, and office-based physician visits among under-resourced African American and Latino older adults. J. Racial Ethn. Health Disparities 10, 205–218 (2022). [DOI] [PMC free article] [PubMed] [Google Scholar]
- 47.Self TH, Chrisman CR, Mason DL & Rumbak MJ Reducing emergency department visits and hospitalizations in African American and Hispanic patients with asthma: a 15-year review. J. Asthma 42, 807–812 (2005). [DOI] [PubMed] [Google Scholar]
- 48.Bazargan M et al. Emergency department utilization among underserved African American older adults in South Los Angeles. Int. J. Environ. Res. Public Health 16, 1175 (2019). [DOI] [PMC free article] [PubMed] [Google Scholar]
- 49.Abul-Husn NS et al. Exome sequencing reveals a high prevalence of BRCA1 and BRCA2 founder variants in a diverse population-based biobank. Genome Med. 12, 2 (2019). [DOI] [PMC free article] [PubMed] [Google Scholar]
- 50.Sohar E, Prass M, Heller J & Heller H Genetics of familial mediterranean fever (FMF): a disorder with recessive inheritance in non-Ashkenazi Jews and Armenians. Arch. Intern. Med. 107, 529–538 (1961). [Google Scholar]
- 51.Moradian MM, Sarkisian T, Ajrapetyan H & Avanesian N Genotype–phenotype studies in a large cohort of Armenian patients with familial Mediterranean fever suggest clinical disease with heterozygous MEFV mutations. J. Hum. Genet 55, 389–393 (2010). [DOI] [PubMed] [Google Scholar]
- 52.Carlice-dos-Reis T et al. Investigation of mutations in the HBB gene using the 1,000 genomes database. PLoS ONE 12, e0174637 (2017). [DOI] [PMC free article] [PubMed] [Google Scholar]
- 53.Kazazian HH, Dowling CE, Waber PG, Huang S & Lo WH The spectrum of β-thalassemia genes in China and Southeast Asia. Blood 68, 964–966 (1986). [PubMed] [Google Scholar]
- 54.Xiong F et al. Molecular epidemiological survey of haemoglobinopathies in the Guangxi Zhuang Autonomous Region of southern China. Clin. Genet. 78, 139–148 (2010). [DOI] [PubMed] [Google Scholar]
- 55.Karczewski KJ et al. The mutational constraint spectrum quantified from variation in 141,456 humans. Nature 581, 434–443 (2020). [DOI] [PMC free article] [PubMed] [Google Scholar]
- 56.Grzymski JJ et al. Population genetic screening efficiently identifies carriers of autosomal dominant diseases. Nat. Med. 26, 1235–1239 (2020). [DOI] [PubMed] [Google Scholar]
- 57.Damrauer SM et al. Association of the V122I hereditary transthyretin amyloidosis genetic variant with heart failure among individuals of African or Hispanic/Latino ancestry. JAMA 322, 2191–2202 (2019). [DOI] [PMC free article] [PubMed] [Google Scholar]
- 58.Pogoryelova O, González Coraspe JA, Nikolenko N, Lochmüller H & Roos A GNE myopathy: from clinics and genetics to pathology and research strategies. Orphanet J. Rare Dis. 13, 70 (2018). [DOI] [PMC free article] [PubMed] [Google Scholar]
- 59.Eisenberg I et al. The UDP-N-acetylglucosamine 2-epimerase/N-acetylmannosamine kinase gene is mutated in recessive hereditary inclusion body myopathy. Nat. Genet. 29, 83–87 (2001). [DOI] [PubMed] [Google Scholar]
- 60.Abul-Husn NS et al. Implementing genomic screening in diverse populations. Genome Med. 13, 17 (2021). [DOI] [PMC free article] [PubMed] [Google Scholar]
- 61.Tadmouri GO et al. Consanguinity and reproductive health among Arabs. Reprod. Health 6, 17 (2009). [DOI] [PMC free article] [PubMed] [Google Scholar]
- 62.Fallahi J et al. Founder effect of KHDC3L, p.M1V mutation, on Iranian patients with recurrent hydatidiform moles. Iran. J. Med. Sci. 45, 118–124 (2020). [DOI] [PMC free article] [PubMed] [Google Scholar]
- 63.Ceballos FC, Joshi PK, Clark DW, Ramsay M & Wilson JF Runs of homozygosity: windows into population history and trait architecture. Nat. Rev. Genet. 19, 220–234 (2018). [DOI] [PubMed] [Google Scholar]
- 64.Lencz T et al. Runs of homozygosity reveal highly penetrant recessive loci in schizophrenia. Proc. Natl Acad. Sci. USA 104, 19942–19947 (2007). [DOI] [PMC free article] [PubMed] [Google Scholar]
- 65.Moreno-Grau S et al. Long runs of homozygosity are associated with Alzheimer’s disease. Transl. Psychiatry 11, 142 (2021). [DOI] [PMC free article] [PubMed] [Google Scholar]
- 66.Browning SR & Browning BL Accurate non-parametric estimation of recent effective population size from segments of identity by descent. Am. J. Hum. Genet. 97, 404–418 (2015). [DOI] [PMC free article] [PubMed] [Google Scholar]
- 67.Belbin GM et al. Genetic identification of a common collagen disease in Puerto Ricans via identity-by-descent mapping in a health system. eLife 6, e25060 (2017). [DOI] [PMC free article] [PubMed] [Google Scholar]
- 68.Bhatia G, Patterson NJ, Sankararaman S & Price AL Estimating and interpreting FST: the impact of rare variants. Genome Res. 23, 1514–1521 (2013). [DOI] [PMC free article] [PubMed] [Google Scholar]
- 69.Chacón-Duque J-C et al. Latin Americans show wide-spread Converso ancestry and imprint of local Native ancestry on physical appearance. Nat. Commun. 9, 5388 (2018). [DOI] [PMC free article] [PubMed] [Google Scholar]
- 70.Borrell LN et al. Race and genetic ancestry in medicine—a time for reckoning with racism. N. Engl. J. Med. 384, 474–480 (2021). [DOI] [PMC free article] [PubMed] [Google Scholar]
- 71.Neblett EW et al. Racism, racial resilience, and African American youth development: person-centered analysis as a tool to promote equity and justice. In Advances in Child Development and Behavior (eds Horn SS, Ruck MD & Liben LS) Vol. 51, 43–79 (JAI, 2016). [DOI] [PubMed] [Google Scholar]
- 72.Browning BL & Browning SR A fast, powerful method for detecting identity by descent. Am. J. Hum. Genet. 88, 173–182 (2011). [DOI] [PMC free article] [PubMed] [Google Scholar]
- 73.Arciero E et al. Fine-scale population structure and demographic history of British Pakistanis. Nat. Commun. 12, 7189 (2021). [DOI] [PMC free article] [PubMed] [Google Scholar]
- 74.Szpiech ZA et al. Ancestry-dependent enrichment of deleterious homozygotes in runs of homozygosity. Am. J. Hum. Genet. 105, 747–762 (2019). [DOI] [PMC free article] [PubMed] [Google Scholar]
- 75.Yearby R Racial disparities in health status and access to healthcare: the continuation of inequality in the United States due to structural racism. Am. J. Econ. Sociol. 77, 1113–1152 (2018). [Google Scholar]
- 76.Clarke JL Impact of pan-ethnic expanded carrier screening in improving population health outcomes: proceedings from a multi-stakeholder virtual roundtable summit, June 25, 2020. Popul. Health Manag. 24, 622–630 (2021). [DOI] [PubMed] [Google Scholar]
- 77.Arjunan A, Darnes DR, Sagaser KG & Svenson AB Addressing reproductive healthcare disparities through equitable carrier screening: medical racism and genetic discrimination in United States’ history highlights the needs for change in obstetrical genetics care. Societies 12, 33 (2022). [Google Scholar]
- 78.Manrai AK et al. Genetic misdiagnoses and the potential for health disparities. N. Engl. J. Med. 375, 655–665 (2016). [DOI] [PMC free article] [PubMed] [Google Scholar]
- 79.Bailey ZD, Feldman JM & Bassett MT How structural racism works—racist policies as a root cause of U.S. racial health inequities. N. Engl. J. Med. 384, 768–773 (2021). [DOI] [PMC free article] [PubMed] [Google Scholar]
- 80.Panofsky A & Bliss C Ambiguity and scientific authority: population classification in genomic science. Am. Socio. Rev. 82, 59–87 (2017). [Google Scholar]
- 81.Coates RD, Ferber AL & Brunsma DL The Matrix of Race: Social Construction, Intersectionality, and Inequality. (SAGE Publications, 2021). [Google Scholar]
- 82.Bonham VR RACE. National Human Genome Research Institute. https://www.genome.gov/genetics-glossary/Race [Google Scholar]
- 83.Barkan S Sociology: Understanding and Changing the Social World (Univ. of North Carolina Press, 2019). [Google Scholar]
- 84.Birney E, Inouye M, Raff J, Rutherford A & Scally A The language of race, ethnicity, and ancestry in human genetic research. Preprint at arXiv 10.48550/arXiv.2106.10041 (2021). [DOI] [Google Scholar]
- 85.Mathieson I & Scally A What is ancestry? PLoS Genet. 16, e1008624 (2020). [DOI] [PMC free article] [PubMed] [Google Scholar]
- 86.Mauro M et al. A scoping review of guidelines for the use of race, ethnicity, and ancestry reveals widespread consensus but also points of ongoing disagreement. Am. J. Hum. Genet. 109, 2110–2125 (2022). [DOI] [PMC free article] [PubMed] [Google Scholar]
- 87.Nuriddin A, Mooney G & White AIR Reckoning with histories of medical racism and violence in the USA. Lancet 396, 949–951 (2020). [DOI] [PMC free article] [PubMed] [Google Scholar]
- 88.Bax AC, Bard DE, Cuffe SP, McKeown RE & Wolraich ML The association between race/ethnicity and socioeconomic factors and the diagnosis and treatment of children with attention-deficit hyperactivity disorder. J. Dev. Behav. Pediatr. 40, 81–91 (2019). [DOI] [PubMed] [Google Scholar]
- 89.Thomas P et al. The association of autism diagnosis with socioeconomic status. Autism 16, 201–213 (2012). [DOI] [PubMed] [Google Scholar]
- 90.Wise SK, Ghegan MD, Gorham E & Schlosser RJ Socioeconomic factors in the diagnosis of allergic fungal rhinosinusitis. Otolaryngol. Head Neck Surg. 138, 38–42 (2008). [DOI] [PubMed] [Google Scholar]
- 91.Deyrup A & Graves JL Racial biology and medical misconceptions. N. Engl. J. Med. 386, 501–503 (2022). [DOI] [PubMed] [Google Scholar]
- 92.Martschenko DO & Young JL Precision medicine needs to think outside the box. Front. Genet. 13, 795992 (2022). [DOI] [PMC free article] [PubMed] [Google Scholar]
- 93.Suckiel SA et al. GUÍA: a digital platform to facilitate result disclosure in genetic counseling. Genet. Med. 23, 942–949 (2021). [DOI] [PMC free article] [PubMed] [Google Scholar]
- 94.Chang TS et al. Pre-existing conditions in Hispanics/Latinxs that are COVID-19 risk factors. iScience 24, 102188 (2021). [DOI] [PMC free article] [PubMed] [Google Scholar]
- 95.Lajonchere C et al. An integrated, scalable, electronic video consent process to power precision health research: large, population-based, cohort implementation and scalability study. J. Med. Internet Res. 23, e31121 (2021). [DOI] [PMC free article] [PubMed] [Google Scholar]
- 96.Sherry ST, Ward M & Sirotkin K dbSNP—database for single nucleotide polymorphisms and other classes of minor genetic variation. Genome Res. 9, 677–679 (1999). [PubMed] [Google Scholar]
- 97.Chang CC et al. Second-generation PLINK: rising to the challenge of larger and richer datasets. Gigascience 4, s13742-015-0047-8 (2015). [DOI] [PMC free article] [PubMed] [Google Scholar]
- 98.Danecek P et al. Twelve years of SAMtools and BCFtools. Gigascience 10, giab008 (2021). [DOI] [PMC free article] [PubMed] [Google Scholar]
- 99.Zhao H et al. CrossMap: a versatile tool for coordinate conversion between genome assemblies. Bioinformatics 30, 1006–1007 (2014). [DOI] [PMC free article] [PubMed] [Google Scholar]
- 100.Delaneau O, Zagury J-F, Robinson MR, Marchini JL & Dermitzakis ET Accurate, scalable and integrative haplotype estimation. Nat. Commun. 10, 5436 (2019). [DOI] [PMC free article] [PubMed] [Google Scholar]
- 101.Manichaikul A et al. Robust relationship inference in genome-wide association studies. Bioinformatics 26, 2867–2873 (2010). [DOI] [PMC free article] [PubMed] [Google Scholar]
- 102.Bettinger B The Shared cM Project 4.0 tool v4. https://dnapainter.com/tools/sharedcmv4 (2020). [Google Scholar]
- 103.Loh P-R et al. Reference-based phasing using the Haplotype Reference Consortium panel. Nat. Genet. 48, 1443–1448 (2016). [DOI] [PMC free article] [PubMed] [Google Scholar]
- 104.Zhou Y, Browning SR & Browning BL A fast and simple method for detecting identity-by-descent segments in large-scale data. Am. J. Hum. Genet. 106, 426–437 (2020). [DOI] [PMC free article] [PubMed] [Google Scholar]
- 105.Hagberg A, Swart P & Chult DS Exploring network structure, dynamics, and function using NetworkX. U.S. Department of Energy Office of Scientific and Technical Information. https://www.osti.gov/biblio/960616 (2008). [Google Scholar]
- 106.Slatkin M A population-genetic test of founder effects and implications for Ashkenazi Jewish diseases. Am. J. Hum. Genet. 75, 282–293 (2004). [DOI] [PMC free article] [PubMed] [Google Scholar]
- 107.Ongaro L et al. The genomic impact of European colonization of the Americas. Curr. Biol. 29, 3974–3986 (2019). [DOI] [PubMed] [Google Scholar]
- 108.Fruchterman TMJ & Reingold EM Graph drawing by force-directed placement. Softw. Pract. Exp. 21, 1129–1164 (1991). [Google Scholar]
- 109.Seabold S & Perktold J Statsmodels: econometric and statistical modeling with Python. Proc. of the 9th Python in Science Conference. 10.25080/Majora-92bf1922-011 (2010). [DOI] [Google Scholar]
- 110.SPA (single-page application). MDN Web Docs Glossary: definitions of web-related terms. https://developer.mozilla.org/en-US/docs/Glossary/SPA
- 111.Scott EM et al. Characterization of Greater Middle Eastern genetic variation for enhanced disease gene discovery. Nat. Genet. 48, 1071–1076 (2016). [DOI] [PMC free article] [PubMed] [Google Scholar]
- 112.Lazaridis I et al. Genomic insights into the origin of farming in the ancient Near East. Nature 536, 419–424 (2016). [DOI] [PMC free article] [PubMed] [Google Scholar]
Associated Data
This section collects any data citations, data availability statements, or supplementary materials included in this article.
Supplementary Materials
Data Availability Statement
Patient-level EHR and genotyping data are protected due to patient privacy and can be accessed by collaboration with a UCLA researcher. All summary statistic data discussed in this paper are freely available on https://www.ibd.la/. 1000 Genomes Project data can be accessed at https://www.internationalgenome.org/data. Human Genome Diversity Project data can be accessed at the following FTP server: ftp://ngs.sanger.ac.uk/production/hgdp. Simons Genome Diversity Project data can be accessed at https://sharehost.hms.harvard.edu/genetics/reich_lab/sgdp/vcf_variants/. The human reference genome version hg38 was downloaded from the UCSC Genome Browser: https://hgdownload.soe.ucsc.edu/downloads.html. DbSNP version 147 was used in this study and was obtained from https://ftp.ncbi.nlm.nih.gov/snp/.