Abstract
Losartan, an angiotensin II receptor antagonist frequently detected in wastewater effluents, poses considerable risks to both aquatic ecosystems and human health. Seeking to address this challenge, advanced oxidation processes (AOPs) emerge as robust methodologies for the efficient elimination of such contaminants. In this study, the degradation of Losartan was investigated in the presence of activated peroxymonosulfate (PMS), leveraging ferrous iron as a catalyst to enhance the oxidation process. Utilizing advanced analytical techniques such as NMR and mass spectrometry, nine distinct byproducts were characterized. Notably, seven of these byproducts were identified for the first time, providing novel insights into the degradation pathway of Losartan. The study delved into the kinetics of the degradation process, assessing the degradation efficiency attained when employing the catalyst alone versus when using it in combination with PMS. The results revealed that Losartan degradation reached a significant level of 64%, underscoring the efficacy of PMS/Fe(II) AOP techniques as promising strategies for the removal of Losartan from water systems. This research not only enriches our understanding of pollutant degradation mechanisms, but also paves the way for the development of sustainable water treatment technologies, specifically targeting the removal of pharmaceutical contaminants from aquatic environments.
Keywords: losartan, peroxymonosulfate, advanced oxidation processes, degradation byproducts, water treatment
1. Introduction
The utilization and mismanagement of substances that are not regulated by any environmental standards, whether at the state or community level, has resulted in the irreversible contamination of water bodies, soils, and air by a myriad of substances, such as personal care products [1,2], pharmaceuticals [3,4], microplastics [5,6], plant protection products [7,8], plastic additives [9,10], and even rare earth elements [11,12].
Losartan (LOS) is a medication belonging to the family of sartans, which are angiotensin II receptor antagonists [13]. Losartan treatment is primarily indicated for individuals suffering from high blood pressure and in order to protect the kidneys in hypertensive patients with type 2 diabetes who have laboratory tests showing an alteration in kidney function. Despite being one of the first of these products to be synthesized, Losartan continues to be one of the most widely used. According to a study published in 2023, there are 17 million users of angiotensin receptor blockers in the USA, UK, Canada, and Denmark, of which approximately 60% use Losartan, totalling more than 10 million users [14]. The presence of this pollutant in the environment is mainly due to direct consumption by patients. After its effects wear off, Losartan is excreted via urine and feces, reaching wastewater treatment plants. However, these facilities do not effectively reduce its presence in effluents, leading to high levels of contamination of surface waters. This occurs to the extent that that Losartan is becoming an emerging pollutant, potentially entering the food chain, and being reabsorbed via the diet. In 2007, Larsson et al. found Losartan concentrations in real plant samples from wastewater treatment that ranged from 2400 to 2500 μg/L in Patancheru, near Hyderabad, India [15]. Losartan was found in the waters of the Llobregat River (Spain), reaching a maximum concentration of 620 ng/L [16]. In 2018, Cortez et al. found Losartan in all analyzed samples, with maximum concentrations of up to 8.7 ng/L in marine samples taken from Santos Bay, Sao Paulo, Brazil. They demonstrated that even concentrations that were equivalent to environmental levels led to cyto-genotoxic effects in the gills and hemolymphs of the Perna perna species, showing that Losartan pollution, even at low concentrations, poses increasingly significant issues [17]. Sartans such as Irbesartan and Losartan tend to decrease in concentration following water disinfection treatments, resulting in a decrease of up to 75% for Irbesartan and 62% for Losartan [18]. This often leads to the production of more toxic degradation byproducts (DP) than the parent molecule [19]. These byproducts have been the subject of study in recent years, with some studies considering valsartan acid, produced by the oxidation of different sartans, as an indicator of sartan pollution [20].
To address this type of water pollution from emerging substances, advanced oxidation processes have been studied in recent years. These processes can effectively remove pollutants. They also achieve high mineralization values, allowing for the almost-complete degradation of pharmaceuticals [21,22]. Most of these methods are based on the use of less conventional oxidants like hydrogen peroxide, peroxymonosulfate, and persulfate, activating them using different conditions like temperature [23,24], microwave [25], light [26], pH [27], transition metals [28], ultrasound [29,30], and even plasma [31], to highly generate oxidant species.
In this study, we focused on isolating and characterizing the nine degradation byproducts obtained from the oxidation of Losartan using a Fenton-like process, employing peroxymonosulfate activated by Fe(II). We evaluated the kinetics of the process at different temperatures and the synergistic degradation effect in the presence of Fe(II) and PMS. Seven of the degradation products were isolated for the first time, and we hypothesized regarding the mechanisms behind their formation, with proposed for all products. We also indicated the exact structure of other potential byproducts which have not yet been isolated.
2. Results and Discussion
2.1. Degradation Experiments
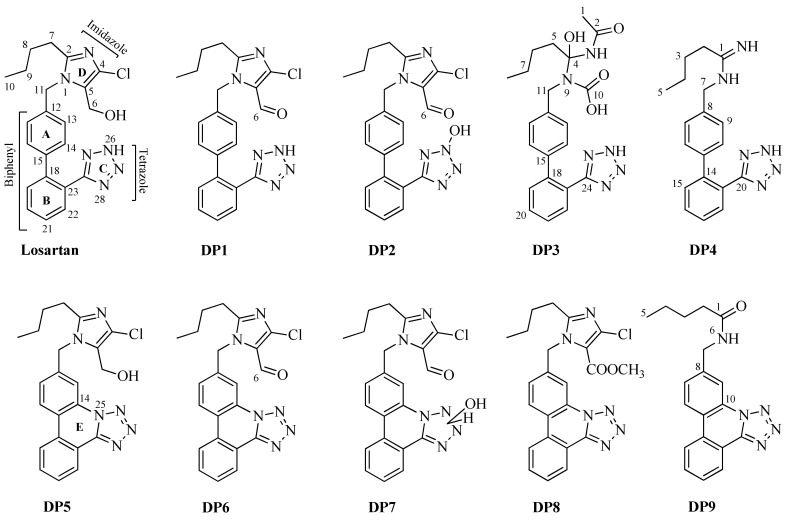
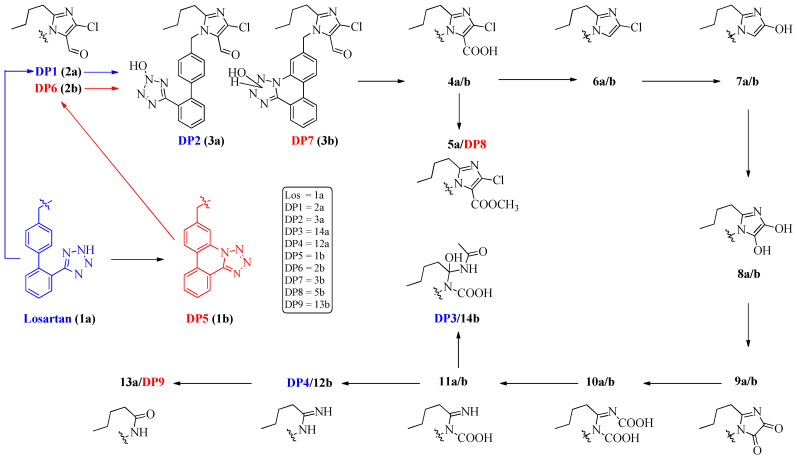
The experimental procedures for the oxidation of LOS were conducted by using conditions that ensured the complete degradation of LOS in both analytical and preparative settings. A solution of the drug at a concentration of 10−5 M was subjected to treatment for 30 min (LOS:PMS:Fe(II) molar ratio of 1:1:1) at room temperature. Subsequently, experiments were repeated using contaminant concentrations exceeding 10−3 M. We employed a significantly higher ratio of LOS:PMS:Fe(II) (1:24:24) to ensure the effective degradation of the target contaminant and to yield adequate quantities of degradation products (DPs) for subsequent structural elucidation. The resulting DPs (depicted in Figure 1) were purified through column chromatography and HPLC, followed by comprehensive characterization via NMR and MS analyses (see Supplementary Materials).
Figure 1.
Chemical structures of Losartan and its degradation byproducts.
2.2. Structure Elucidation of Degradation Byproducts DP1–DP9
In LOS treatment at fixed pH values, the changes in the drug were monitored via HPLC. The concentration of DP1–DP9 (Figure 1) was at a maximum value after 90 min and ranged from 0.2 to 9.29%.
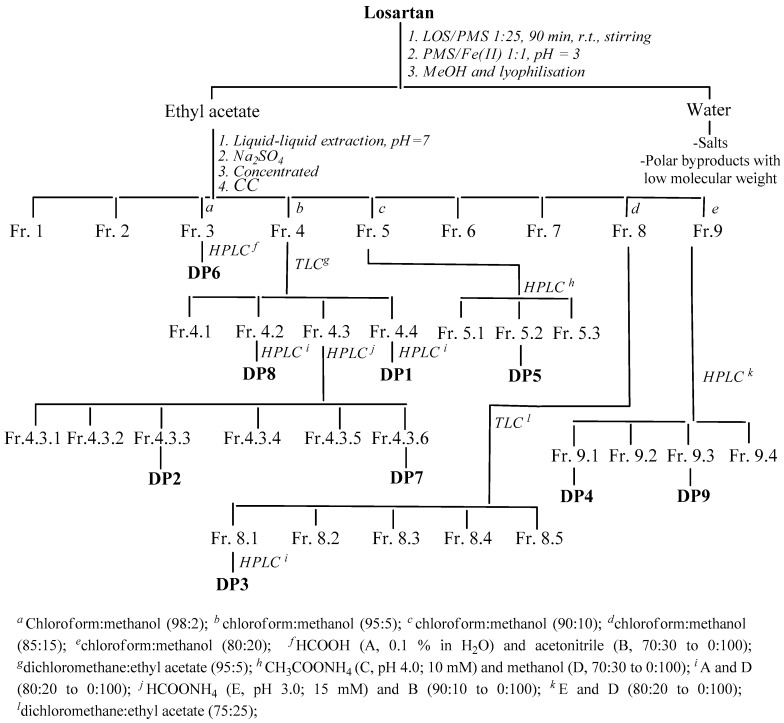
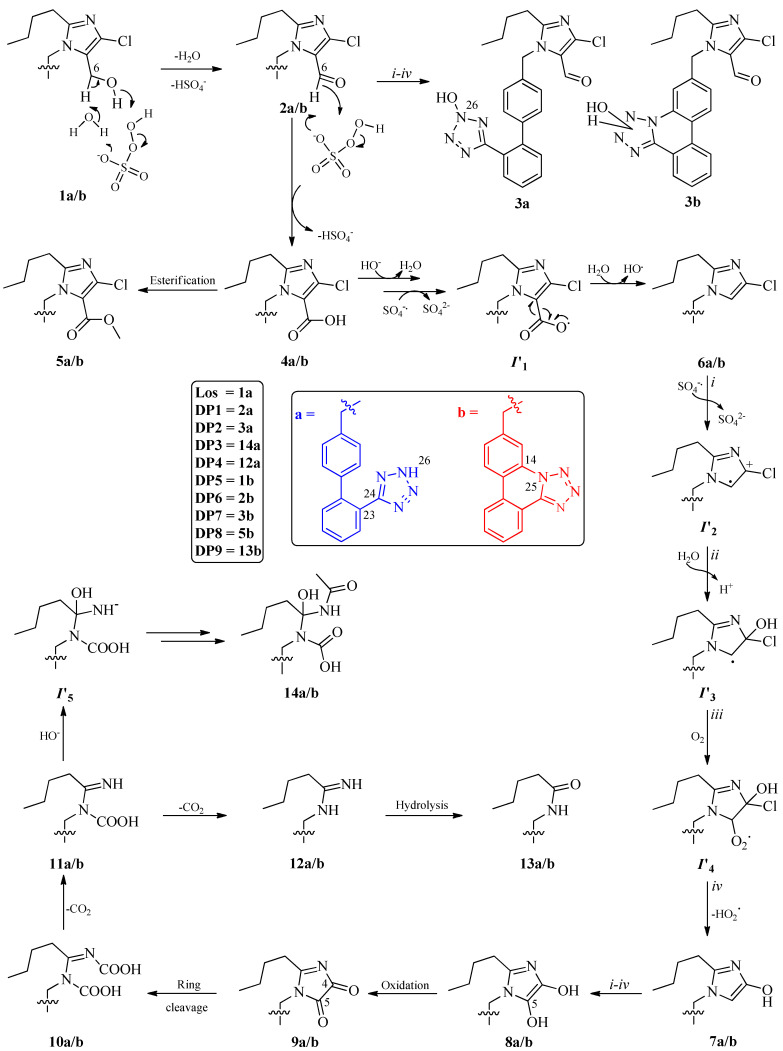
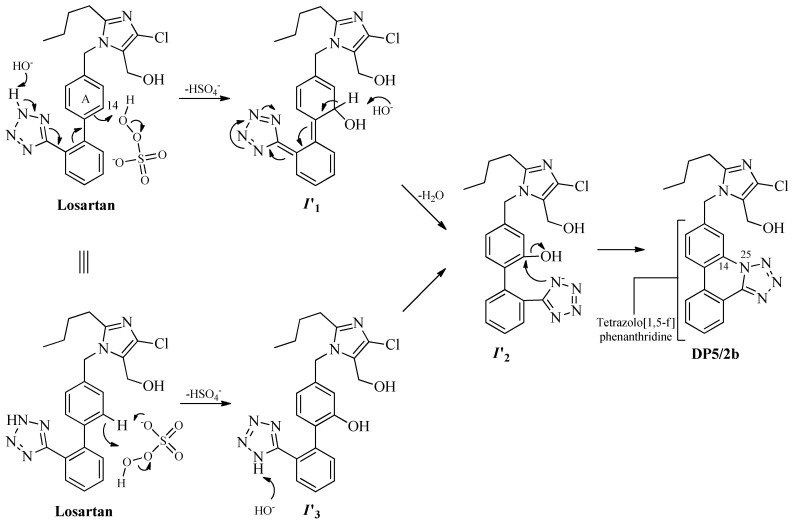
DPs were isolated using chromatographic processes (Scheme 1) and identified by employing NMR and MS analyses. The plausible mechanism of the DPs formation is shown in Figure 2 and Figure 3.
Scheme 1.
Isolation of the byproducts DP1–DP7.
Figure 2.
Plausible mechanism of oxidation with peroxymonosulfate.
Figure 3.
Plausible mechanisms of formation of tetrazolo [1,5-f]phenanthridine.
As suggested by previous studies on sartans that are analogous to the compound investigated in this research, the potential degradation byproducts formed using PMS/Fe(II) show no substantial detrimental effects on algae [28]. This observation may also hold true for the byproducts identified in this study, considering their structural similarity, especially given that both belong to the sartan class.
Following the oxidation of Losartan, nine degradation products were isolated. These all retained the basic diphenyl skeleton (rings A and B) and the tetrazole cycle (ring C). Four of the nine DPs (DP1–DP4) showed tetrazoles that were only attached to ring B, connected through a bond between carbon C-24 of the tetrazole itself and carbon C-23 of the phenyl ring. The last 5 DPs (DP5–DP9) had tetrazoles that were attached to both phenyl rings A and B, forming a new six-membered cycle (ring E) due to the formation of a new bond between nitrogen N-25 of the tetrazole and carbon C-14 of aromatic ring A. The oxidative processes affected the imidazole ring D, whether partially oxidized (in DP1, DP6, and DP8) or opened (in DP3, DP4, and DP9), and the tetrazole ring C (cyclized to aromatic ring A in DP5, or cyclized and oxidized at one of the two positions of N-26 or N-27 in the two DP2 and DP7). DP1 (product 2a, Figure 2) originated from the oxidation of the side chain of the imidazole ring of Losartan (product 1a), specifically carbon C-6, with the hydroxymethyl function giving rise to the corresponding aldehyde function.
DP2 (product 3a) can be obtained from the previous one by the oxidation of the tetrazole ring, which is oxidized to nitrogen N-26. It should be noted that ring C can exhibit a particular type of tautomerism—reported in the scientific literature as desmotropy—which involves the possible presence of a hydrogen on each of the four different nitrogen atoms of the ring. However, considering the equivalence of the two nitrogen atoms bonded to the carbon C-24 and the free rotation of the tetrazole ring around the bond C-23–C-24, the tautomers in the liquid state are reduced to two, with the possibility that the hydrogen (and therefore the hydroxyl group in the corresponding oxidation product) is bonded to nitrogen N-25/N-28 or N-26/N-27. Generally, hydrogen is reported to be bonded to nitrogen N-26. This is because, in the solid state, this tautomer, indicated as form B, is the main one.
DP1 (product 2a) could then undergo oxidation at the aldehydic function (C-6) to obtain the corresponding carboxylic acid, product 4a (Figure 2). The latter could undergo a reductive decarboxylation, known as the Kolbe reaction, to obtain product 6a, which could then yield product 7a, where oxidative dechlorination of the imidazole ring occurs. The latter could undergo hydroxylation at the carbon C-5 to yield product 8a. The oxidation could then proceed at positions C-4 and C-5 (product 9a) and further to lead to ring opening (product 10a). An initial reductive decarboxylation would yield product 11a, which could then form degradation DP3 (product 14a) or undergo a second decarboxylation to give rise to DP4 (product 12a).
The DP5 (product 1b) is the first product to exhibit the closure of a six-membered ring between the two aromatic rings and the tetrazole. We hypothesized (Figure 3) that this product could be obtained by the addition of a hydroxyl group to the carbon C-14 of ring A—forming intermediate I’1—followed by the abstraction of a proton from the same position to re-aromatize ring A and obtain a nucleophilic nitrogen on the adjacent tetrazole (intermediate I’2). The final step would involve the closure of the cycle via the nucleophilic attack of the nitrogen N-25 of the tetrazole on the carbon C-14 of the adjacent aromatic ring.
Alternatively, one could hypothesize the oxidation of ring A at carbon C-14, followed by the abstraction of a proton from the nitrogen N-25 of the tetrazole. The intramolecular nucleophilic substitution would then explain the formation of the degradation product, DP5.
The degradation product known as DP5 (product 1b) can be considered the precursor to the last four degradation products obtained (DP6–DP9). Specifically, DP6 (product 2b) is the corresponding aldehyde of DP5, obtained by oxidizing the hydroxymethyl group at C-6. In turn, the oxidation of DP6 on the tetrazole ring, with hydroxyl group oxidation at nitrogen N-26 (or N-27), would explain the formation of DP7 (product 3b), while the oxidation of carbon C-6 in DP6 to the corresponding carboxylic acid 4b and its subsequent methylation would yield the corresponding ester, DP8 (product 5b).
Finally, the reductive decarboxylation of product 4b and the subsequent oxidation and opening of the imidazole ring would account for the formation of product DP9 (product 13b), corresponding to the hydrolysis product of DP4 (product 12a) released with the additional formation of cycle E.
Observing the nine identified DPs resulting from the oxidation reaction with peroxymonosulfate, two main structural modifications are noticeable: (a) the oxidation of the hydroxymethyl side chain of the imidazole ring (DP1 and DP6); (b) the formation of an intramolecular bond and the closure of ring E (DP5–DP9). Thus, degradation DP1 can be considered the precursor to obtaining DP2–DP4, while DP5 can be considered to correspond to DP1 and to be the precursor for obtaining DP6–DP9. Similarly, it is straightforward to consider DP2 and DP7 as corresponding, differing only in the absence or presence of the hydroxylated ring E. Likewise, products DP4 and DP9 can be considered to correspond, with the latter featuring the ring E and a carbonyl function instead of an iminium one. In general, starting from DP1 and DP5, the generation of other degradation products can be hypothesized based on the oxidation of carbon C-6 and the subsequent degradation of ring D, as summarized in Figure 4. It is conceivable that other products may have formed, albeit in lesser quantities, that have not yet been identified or degraded more rapidly than others, which could confirm the proposed mechanism.
Figure 4.
Degradation products isolated and those that could form but have not yet been isolated.
2.3. Spectral Data
Losartan: (1-((2′-(2H-Tetrazol-5-yl)-[1,1′-biphenyl]-4-yl)methyl)-2-butyl-4-chloro-1H -imi dazol-5-yl)methanol. White powder. NMR data see Table S1. MS-TOF (positive ions): m/z calculated for C22H23ClN6O 422.16 [M]+; found 423.17 [M + H]+ (84%), 425.17 (26%), 424.18 (21%), 426.17 (7%).
DP1: 1-((2′-(2H-Tetrazol-5-yl)-[1,1′-biphenyl]-4-yl)methyl)-2-butyl-4-chloro-1H-imidazole-5-carbaldehyde. Gray powder. NMR data see Table S2. MS-TOF (negative ions): m/z calculated for C22H21ClN6O 420.15 [M]+; found 419.15 [M − H]− (90%), 420.16 (20%), 421.15 (30%), 422.15 (7%).
DP2: 2-butyl-4-chloro-1-((2′-(2-hydroxy-2H-tetrazol-5-yl)-[1,1′-biphenyl]-4-yl)methyl)-1H-imidazole-5-carbaldehyde. Gray powder. NMR data see Table S3. MS-TOF (positive ions): m/z calculated for C22H21ClN6O2 436.14 [M]+; found 437.15 [M + H]+ (88%), 439.14 (28%), 438.15 (24%), 440.17 (6%).
DP3: ((2′-(2H-Tetrazol-5-yl)-[1,1′-biphenyl]-4-yl)methyl)(1-acetamido-1-hydroxypentyl) carbamic acid. Gray powder. NMR data see Table S4. MS-TOF (positive ions): m/z calculated for C22H26N6O4 438.20 [M]+; found 461.21 [M + Na]+ (48%), 462.21 (10%).
DP4: N-((2′-(2H-Tetrazol-5-yl)-[1,1′-biphenyl]-4-yl)methyl)pentanimidamide. White powder. NMR data see Table S5. MS-TOF (positive ions): m/z calculated for C19H22N6 334.19 [M]+; found 335.20 [M + H]+ (90%), 336.20 (22%).
DP5: (2-Butyl-4-chloro-1-(tetrazolo [1,5-f]phenanthridin-6-ylmethyl)-1H-imidazol-5-yl) methanol. Gray powder. NMR data see Table S6. MS-TOF (positive ions): m/z calculated for C22H21ClN6O 420.15 [M]+; found 421.16 [M + H]+ (85%), 423.16 (24.0%), 422.16 (18%).
DP6: 2-Butyl-4-chloro-1-(tetrazolo [1,5-f]phenanthridin-6-ylmethyl)-1H-imidazole-5-carbaldehyde. Gray powder. NMR data see Table S7. MS-TOF (positive ions): m/z calculated for C22H19ClN6O 418.13 [M]+; found 419.13 [M + H]+ (100%), 421.14 (30%), 420.14 (24%).
DP7: 2-Butyl-4-chloro-1-((2-hydroxy-2,3-dihydrotetrazolo [1,5-f]phenanthridin-6-yl)meth yl)-1H-imidazole-5-carbaldehyde. Gray powder. NMR data see Table S8. MS-TOF (positive ions): m/z calculated for C22H21ClN6O2 436.14 [M]+; found 437.15 [M + H]+ (95%), 439.16 (31%), 438.17 (22%), 440.15 (5%).
DP8: Methyl 2-butyl-4-chloro-1-(tetrazolo [1,5-f]phenanthridin-6-ylmethyl)-1H-imidazole -5-carboxylate. Gray powder. NMR data see Table S9. MS-TOF (positive ions): m/z calculated for C23H21ClN6O2 448.14 [M]+; found 449.15 [M + H]+ (100%), 451.15 (32%), 450.16 (25%), 452.16 (7%).
DP9: N-(Tetrazolo [1,5-f]phenanthridin-6-ylmethyl)pentanamide. Gray powder. NMR data see Table S10. MS-TOF (positive ions): m/z calculated for C19H19N5O 333.16 [M]+; found 334.16 [M + H]+ (87%), 335.17 (21%).
2.4. Kinetics of Losartan Degradation in PMS/Fe(II) System
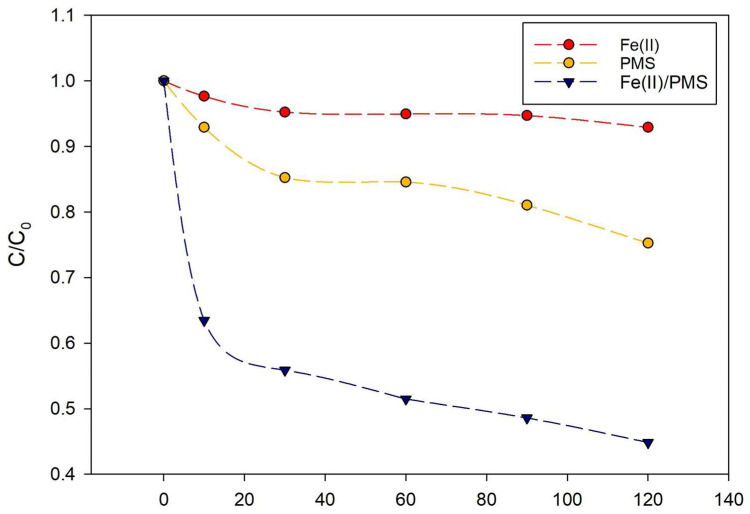
To comprehensively investigate the oxidation process of LOS in the presence of the PMS/Fe(II) system, we initially examined the stability of the pollutant at pH 3 in the presence of Fe(II) sulfate heptahydrate, which resulted in the removal of only 5% of the pollutant (Figure 5). Subsequently, another experiment was conducted to assess the degradation directly attributable to the oxidant PMS, which was compared with the degradation observed in the presence of only Fe(II). In this experiment, the degradation halted at 20%. This highlights the difference between the degradation in the presence of iron and that when the system is solely in the presence of PMS.
Figure 5.
Different [LOS] = 2.14 mM removal in presence of [Fe(II)] = 52 mM and/or [PMS] = 52 mM.
As shown in Figure 5, a synergistic effect arises from oxidation in the presence of the Fe(II) catalyst, which is likely due to the rapid reaction between Fe(II) and PMS, yielding highly reactive radical species such as SO4−. These radical species consume Fe(II) to form Fe(III) (Equation (1)), while the reaction between Fe(III) and PMS is a slower process, leading to the formation of less reactive radicals (Equation (2)) [32]. Nonetheless, the generation of Fe(II) allows for the continuation of the reaction (Equation (1)).
| (1) |
| (2) |
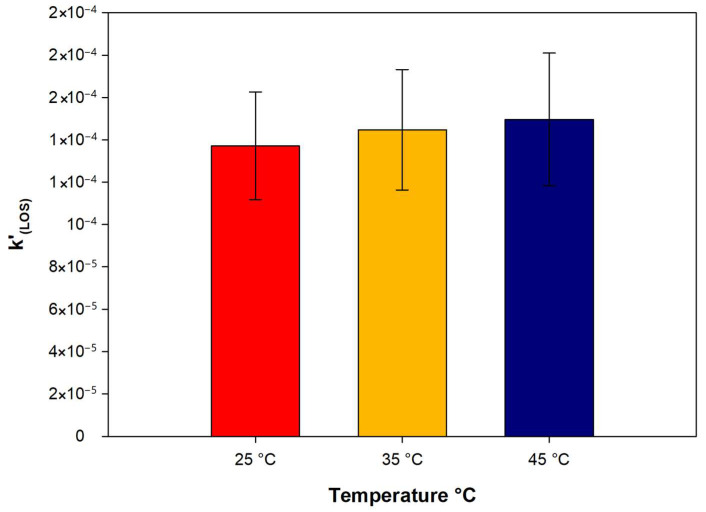
Further studies were conducted to evaluate the degradation of Losartan as a function of temperature, conducting trials at 25 °C, 35 °C, and 45 °C (Figure 6). As anticipated, increasing the temperature resulted in a higher rate constant for , calculated as pseudo-first-order decay using Equation (3):
| (3) |
where [LOS]0 and [LOS] represent the initial and residual concentrations of LOS at time t, respectively, and is the pseudo-first-order apparent rate constant in s−1.
Figure 6.
Pseudo-first-order rate constant for , at different temperature.
3. Materials and Methods
3.1. Drug and Reagents
Losartan potassium (98%), OXONE® (triple-salt KHSO5 * 0.5KHSO4 * 0.5K2SO4, of which the oxidizing species is KHSO5, called potassium monopersulfate or potassium peroxymonosulfate/PMS) and iron (II) sulfate heptahydrate (FeSO4 * 7H2O) were purchased from Merck (Darmstadt, Germany). Solvents were purchased from Merck (Darmstadt, Germany), were of an HPLC grade, and were used as received. All other chemicals were of an analytical grade and were supplied by Merck, Darmstadt, Germany.
3.2. Peroxymonosulfate Reaction
3.2.1. Apparatus and Equipment
Kieselgel 60 (230–400 mesh, Merck, Darmstadt, Germany) was used for column chromatography (CC). HPLC analysis utilized a Shimadzu LC-8A system, equipped with a Shimadzu SPD-10A VP UV-vis detector (Shimadzu, Milan, Italy). NMR spectra (1H and 13C) were recorded at 400 MHz and 25 °C (Bruker DRX, Bruker Avance), and results were referenced to residual solvent signals (CDCl3, δH 7.27 and δC 77.0; CD3OD, δH 3.30 and δC 49.0). Proton-detected heteronuclear correlations were measured using gradient heteronuclear single-quantum coherence (HSQC), optimized for 1JHC = 155 Hz, and gradient heteronuclear multiple-bond correlation (HMBC), optimized for nJHC = 8 Hz. MALDI-TOF mass spectrometric analyses were conducted on a Voyager-De Pro MALDI mass-spectrometer (PerSeptive Biosystems, Framingham, MA, USA). UV-vis analysis was performed on a Lambda 12 UV-vis spectrophotometer (Perkin Elmer, Waltham, MA, USA). The lyophilization of samples was performed using a LyovaporTM-200 (Buchi, Cornaredo, Italy), with a compressor featuring a cooling capacity of 1.97 kW for 50 Hz and a minimum condenser temperature of −55 °C.
3.2.2. Peroxymonosulfate-Based Advanced Oxidation Reaction
A solution of LOS at a concentration of 10−5 M was treated with Fe(II)/OXONE® (molar ratio of LOS/Fe(II)/OXONE® 1:1:1) for 30 min at room temperature at pH 3.0, as pH plays a crucial role in the presence of Fe(II) metal ions in homogeneous phases during reactions [33]. The presence of LOS was determined spectrophotometrically, with absorbance peaks measured at 254 nm. The absorbance values were then converted into concentrations using a calibration curve prepared from standard solutions with known LOS concentrations. Although DP1–DP14 (Figure 1) were formed under these conditions, their abundance was too low for isolation. However, their retention times were compared with those of the byproducts obtained from the degradation of LOS in the preparative experiments described subsequently. DPs that are common to both the analytical and preparative experiments were then isolated from the ethyl acetate extract of the aqueous solution.
Preparative experiments were conducted using a solution of LOS at a concentration higher than 10−3 M. Specifically, 495 mg (1.07 mmol) of LOS dissolved in water was added to a final volume of 0.5 L. OXONE® (8.20 g, 26 mmol, molar ratio LOS/OXONE® 1:24) under magnetic stirring at room temperature, followed by the addition of iron (II) sulfate heptahydrate (7.50 g, 26 mmol, molar ratio Fe(II)/OXONE® 1:1). The pH of the solution was adjusted to 3.0 with H2SO4 1 M. The reaction progress was monitored by sampling the solution every 15 min, quenching with excess methanol, and drying under vacuum conditions. The resulting residue was dissolved in a saturated sodium bicarbonate solution, extracted with ethyl acetate, and analyzed via HPLC. The reaction was terminated after 2 h to ensure the maximal degradation of LOS and the formation of its DPs. This was performed by quenching with excess methanol and concentrating via lyophilization. The residue was dissolved in water and pH-adjusted to 7.0 before extraction with ethyl acetate. The extraction yielded an organic fraction of 467 mg, which was chromatographed to obtain the DPs.
3.2.3. Product Isolation Procedure
The organic fraction obtained from the preparative experiment (467 mg) was chromatographed with a gradient of chloroform/methanol (100:0 to 80:20) on silica gel to yield 9 fractions. Fraction 3 (Fr. 3), obtained from elution with chloroform/methanol 98:2, contained DP6 (19 mg). This was further purified using HPLC under gradient condition f of HCOOH (0.1% in H2O) and acetonitrile (70:30 to 0:100) on a Phenomenex Luna 5 μm C18 100 Å (250 × 10.00 mm) HPLC column at a solvent flow rate of 5 mL/min. Fraction 4 (Fr. 4), obtained from elution with chloroform/methanol 95:5, was subsequently purified via preparative thin-layer chromatography (TLC) and eluted with dichloromethane–ethyl acetate 95:5, resulting in 4 subfractions. The DP8 (2 mg) and DP1 (10 mg) were obtained from subfractions Fr. 4.2 and Fr. 4.4, respectively, and these were purified using the same gradient i in HPLC, namely HCOOH (0.1% in H2O) and methanol (80:20 to 0:100). Fraction 4.3 (Fr. 4.3) was purified via HPLC using gradient j, involving HCOONH4 (pH 3.0; 15 mM) and acetonitrile (90:10 to 0:100). This was performed on a Phenomenex Kromasil 10 μm 100 Å C18 (250 × 10.00 mm) HPLC column at a solvent flow rate of 5 mL/min, resulting in DP2 (25 mg) and DP7 (12 mg). Fraction 5 (Fr. 5), obtained from elution with chloroform/methanol 90:10, was purified via HPLC under gradient conditions h, entailing CH3COONH4 (pH 4.0; 10 mM) and methanol (70:30 to 0:100). This was performed using a Phenomenex Prodigy 10 μm ODS (250 × 10.00 mm) HPLC column at a solvent flow rate of 5 mL/min, yielding DP5 (18 mg). Fraction 8 (Fr. 8), obtained from elution with chloroform/methanol 85:15, was purified via preparative TLC under condition l, entailing dichloromethane–ethyl acetate (80:20), which resulted in 5 subfractions. Subsequently, subfraction 8.1 (Fr. 8.1) was further purified via HPLC under gradient condition i, entailing HCOOH (0.1% in H2O) and methanol (80:20 to 0:100). We used a Phenomenex Synergi 10 μm 110 Å C18 (250 × 10.00 mm) column at a solvent flow rate of 5 mL/min, yielding DP3 (46 mg). Finally, fraction 9 (Fr. 9), obtained from elution with chloroform/methanol 80:20, was purified via HPLC under the following gradient conditions k: HCOONH4, (pH 3.0; 15 mM) and methanol (80:20 to 0:100). We used the same column as that used for Fr. 5, yielding DP4 (1 mg) and DP9 (1 mg).
4. Conclusions
In conclusion, our study sheds light on the concerning presence and potential risks associated with Losartan contamination in aquatic environments. The widespread occurrence of Losartan in surface waters highlights the urgent need to develop effective water treatment strategies to mitigate its impact on ecosystems and human health. Our findings demonstrate the capability of advanced oxidation processes, such as Fe(II)-activated peroxymonosulfate, to degrade Losartan and potentially other emerging contaminants, offering a promising solution for water treatment. Nine degradation products were thus isolated and structurally determined via NMR and mass studies. These degradation byproducts, obtained in percentages between 0.20 and 9.29% and for a total yield of 27%, compared to a complete mineralization of the starting product equal to 64%, provide valuable insights into the transformation pathways and environmental fate of Losartan and structurally similar micropollutants. These insights contribute to our understanding of the effectiveness of oxidation processes in terms of removing pharmaceutical contaminants from water sources.
Acknowledgments
This research was supported by AIPRAS-Onlus (Associazione Italiana per la Promozione delle Ricerche sull’Ambiente e la Salute umana) for the grants in support of this investigation.
Supplementary Materials
The following supporting information can be downloaded at: https://www.mdpi.com/article/10.3390/molecules29102237/s1.
Author Contributions
A.M. and G.L. performed the oxidation experiments; S.P., L.P. and G.D.F. performed supervision and writing-review and editing; A.M. and A.Z. designed the research study, performed supervision and writing-original draft preparation, and wrote the last version of the manuscript. All authors have read and agreed to the published version of the manuscript.
Institutional Review Board Statement
Not applicable.
Informed Consent Statement
Not applicable.
Data Availability Statement
Data are contained within the article and Supplementary Materials.
Conflicts of Interest
The authors declare no conflicts of financial interests.
Funding Statement
This research received no external funding.
Footnotes
Disclaimer/Publisher’s Note: The statements, opinions and data contained in all publications are solely those of the individual author(s) and contributor(s) and not of MDPI and/or the editor(s). MDPI and/or the editor(s) disclaim responsibility for any injury to people or property resulting from any ideas, methods, instructions or products referred to in the content.
References
- 1.Osuoha J.O., Anyanwu B.O., Ejileugha C. Pharmaceuticals and Personal Care Products as Emerging Contaminants: Need for Combined Treatment Strategy. J. Hazard. Mater. Adv. 2023;9:100206. doi: 10.1016/j.hazadv.2022.100206. [DOI] [Google Scholar]
- 2.Khalid M., Abdollahi M. Environmental Distribution of Personal Care Products and Their Effects on Human Health. Iran J. Pharm. Res. 2021;20:216–253. doi: 10.22037/ijpr.2021.114891.15088. [DOI] [PMC free article] [PubMed] [Google Scholar]
- 3.Pot E.J., Milakovic M., Chaumot A., Seidensticker S., Melling M., Supriatin A., Sherif S. Pharmaceutical Pollution of the World’s Rivers. Proc. Natl. Acad. Sci. USA. 2022;119:e2113947119. doi: 10.1073/pnas.2113947119. [DOI] [PMC free article] [PubMed] [Google Scholar]
- 4.Larsson D.G.J. Pollution from Drug Manufacturing: Review and Perspectives. Philos. Trans. R. Soc. Lond. B Biol. Sci. 2014;369:20130571. doi: 10.1098/rstb.2013.0571. [DOI] [PMC free article] [PubMed] [Google Scholar]
- 5.Wu W.M., Yang J., Criddle C.S. Microplastics Pollution and Reduction Strategies. Front. Environ. Sci. Eng. 2017;11:6. doi: 10.1007/s11783-017-0897-7. [DOI] [Google Scholar]
- 6.Rezania S., Park J., Md Din M.F., Mat Taib S., Talaiekhozani A., Kumar Yadav K., Kamyab H. Microplastics Pollution in Different Aquatic Environments and Biota: A Review of Recent Studies. Mar. Pollut. Bull. 2018;133:191–208. doi: 10.1016/j.marpolbul.2018.05.022. [DOI] [PubMed] [Google Scholar]
- 7.Hassaan M.A., El Nemr A. Pesticides Pollution: Classifications, Human Health Impact, Extraction and Treatment Techniques. Egypt. Aquat. Res. 2020;46:207–220. doi: 10.1016/j.ejar.2020.08.007. [DOI] [Google Scholar]
- 8.Mali H., Shah C., Raghunandan B.H., Prajapati A.S., Patel D.H., Trivedi U., Subramanian R.B. Organophosphate Pesticides an Emerging Environmental Contaminant: Pollution, Toxicity, Bioremediation Progress, and Remaining Challenges. J. Environ. Sci. 2023;127:234–250. doi: 10.1016/j.jes.2022.04.023. [DOI] [PubMed] [Google Scholar]
- 9.Lin Z., Wang L., Jia Y., Zhang Y., Dong Q., Huang C. A Study on Environmental Bisphenol A Pollution in Plastics Industry Areas. Water Air Soil Pollut. 2017;228:98. doi: 10.1007/s11270-017-3277-9. [DOI] [Google Scholar]
- 10.Fu P., Kawamura K. Ubiquity of Bisphenol A in the Atmosphere. Environ. Pollut. 2010;158:3138–3143. doi: 10.1016/j.envpol.2010.06.040. [DOI] [PubMed] [Google Scholar]
- 11.Trifuoggi M., Donadio C., Ferrara L., Stanislao C., Toscanesi M., Arienzo M. Levels of Pollution of Rare Earth Elements in the Surface Sediments from the Gulf of Pozzuoli (Campania, Italy) Mar. Pollut. Bull. 2018;136:374–384. doi: 10.1016/j.marpolbul.2018.09.034. [DOI] [PubMed] [Google Scholar]
- 12.Ramos S.J., Dinali G.S., Oliveira C., Martins G.C., Moreira C.G., Siqueira J.O., Guilherme L.R.G. Rare Earth Elements in the Soil Environment. Curr. Pollut. Rep. 2016;2:28–50. doi: 10.1007/s40726-016-0026-4. [DOI] [Google Scholar]
- 13.Timmermans P.B., Wong P.C., Chiu A.T., Herblin W.F., Benfield P., Carini D.J., Lee R.J., Wexler R.R., Anne Saye J.M., Smith R.D. Angiotensin II Receptors and Angiotensin II Receptor Antagonists. Pharmacol. Rev. 1993;45:205–251. [PubMed] [Google Scholar]
- 14.Eworuke E., Shinde M., Hou L., Paterson M.J., Jensen P.B., Maro J.C., Rai A., Scarnecchia D., Pennap D., Woronow D., et al. Valsartan, Losartan and Irbesartan Use in the USA, UK, Canada and Denmark after the Nitrosamine Recalls: A Descriptive Cohort Study. BMJ Open. 2023;13:e070985. doi: 10.1136/bmjopen-2022-070985. [DOI] [PMC free article] [PubMed] [Google Scholar]
- 15.Larsson D.G.J., de Pedro C., Paxeus N. Effluent from Drug Manufactures Contains Extremely High Levels of Pharmaceuticals. J. Hazard. Mater. 2007;148:751–755. doi: 10.1016/j.jhazmat.2007.07.008. [DOI] [PubMed] [Google Scholar]
- 16.Huerta-Fontela M., Galceran M.T., Ventura F. Occurrence and Removal of Pharmaceuticals and Hormones through Drinking Water Treatment. Water Res. 2011;45:1432–1442. doi: 10.1016/j.watres.2010.10.036. [DOI] [PubMed] [Google Scholar]
- 17.Cortez F.S., da Silva Souza L., Guimarães L.L., Almeida J.E., Pusceddu F.H., Maranho L.A., Mota L.G., Nobre C.R., Moreno B.B., Abessa D.M.d.S., et al. Ecotoxicological Effects of Losartan on the Brown Mussel Perna Perna and Its Occurrence in Seawater from Santos Bay (Brazil) Sci. Total Environ. 2018;637–638:1363–1371. doi: 10.1016/j.scitotenv.2018.05.069. [DOI] [PubMed] [Google Scholar]
- 18.Ladhari A., La Mura G., Di Marino C., Di Fabio G., Zarrelli A. Sartans: What They Are for, How They Degrade, Where They Are Found and How They Transform. Sustain. Chem. Pharm. 2021;20:100409. doi: 10.1016/j.scp.2021.100409. [DOI] [Google Scholar]
- 19.Siciliano A., Medici A., Guida M., Libralato G., Saviano L., Previtera L., Di Fabio G., Zarrelli A. Newly Discovered Irbesartan Disinfection Byproducts via Chlorination: Investigating Potential Environmental Toxicity. Appl. Sci. 2023;13:8170. doi: 10.3390/app13148170. [DOI] [Google Scholar]
- 20.Nödler K., Hillebrand O., Idzik K., Strathmann M., Schiperski F., Zirlewagen J., Licha T. Occurrence and Fate of the Angiotensin II Receptor Antagonist Transformation Product Valsartan Acid in the Water Cycle—A Comparative Study with Selected β-Blockers and the Persistent Anthropogenic Wastewater Indicators Carbamazepine and Acesulfame. Water Res. 2013;47:6650–6659. doi: 10.1016/j.watres.2013.08.034. [DOI] [PubMed] [Google Scholar]
- 21.Kanakaraju D., Glass B.D., Oelgemöller M. Advanced Oxidation Process-Mediated Removal of Pharmaceuticals from Water: A Review. J. Environ. Manag. 2018;219:189–207. doi: 10.1016/j.jenvman.2018.04.103. [DOI] [PubMed] [Google Scholar]
- 22.Deng Y., Zhao R. Advanced Oxidation Processes (AOPs) in Wastewater Treatment. Curr. Pollut. Rep. 2015;1:167–176. doi: 10.1007/s40726-015-0015-z. [DOI] [Google Scholar]
- 23.Zrinyi N., Pham A.L.T. Oxidation of Benzoic Acid by Heat-Activated Persulfate: Effect of Temperature on Transformation Pathway and Product Distribution. Water Res. 2017;120:43–51. doi: 10.1016/j.watres.2017.04.066. [DOI] [PubMed] [Google Scholar]
- 24.Ma J., Li H., Chi L., Chen H., Chen C. Changes in Activation Energy and Kinetics of Heat-Activated Persulfate Oxidation of Phenol in Response to Changes in PH and Temperature. Chemosphere. 2017;189:86–93. doi: 10.1016/j.chemosphere.2017.09.051. [DOI] [PubMed] [Google Scholar]
- 25.Yang S., Wang P., Yang X., Wei G., Zhang W., Shan L. A Novel Advanced Oxidation Process to Degrade Organic Pollutants in Wastewater: Microwave-Activated Persulfate Oxidation. J. Environ. Sci. 2009;21:1175–1180. doi: 10.1016/S1001-0742(08)62399-2. [DOI] [PubMed] [Google Scholar]
- 26.Gabet A., Métivier H., de Brauer C., Mailhot G., Brigante M. Hydrogen Peroxide and Persulfate Activation Using UVA-UVB Radiation: Degradation of Estrogenic Compounds and Application in Sewage Treatment Plant Waters. J. Hazard. Mater. 2021;405:124693. doi: 10.1016/j.jhazmat.2020.124693. [DOI] [PubMed] [Google Scholar]
- 27.Wacławek S., Lutze H.V., Sharma V.K., Xiao R., Dionysiou D.D. Revisit the Alkaline Activation of Peroxydisulfate and Peroxymonosulfate. Curr. Opin. Chem. Eng. 2022;37:100854. doi: 10.1016/j.coche.2022.100854. [DOI] [Google Scholar]
- 28.Medici A., Lavorgna M., Isidori M., Russo C., Orlo E., Luongo G., Di Fabio G., Zarrelli A. Advanced Oxidation Process of Valsartan by Activated Peroxymonosulfate: Chemical Characterization and Ecotoxicological Effects of Its Byproducts. Sci. Total Environ. 2024;908:168337. doi: 10.1016/j.scitotenv.2023.168337. [DOI] [PubMed] [Google Scholar]
- 29.Rayaroth M.P., Aravind U.K., Aravindakumar C.T. Ultrasound Based AOP for Emerging Pollutants: From Degradation to Mechanism. Environ. Sci. Pollut. Res. 2017;24:6261–6269. doi: 10.1007/s11356-016-6606-4. [DOI] [PubMed] [Google Scholar]
- 30.Joseph C.G., Li Puma G., Bono A., Krishnaiah D. Sonophotocatalysis in Advanced Oxidation Process: A Short Review. Ultrason. Sonochem. 2009;16:583–589. doi: 10.1016/j.ultsonch.2009.02.002. [DOI] [PubMed] [Google Scholar]
- 31.Verdini F., Calcio Gaudino E., Canova E., Colia M.C., Cravotto G. Highly Efficient Tetracycline Degradation under Simultaneous Hydrodynamic Cavitation and Electrical Discharge Plasma in Flow. Ind. Eng. Chem. Res. 2023;62:19311–19322. doi: 10.1021/acs.iecr.3c00266. [DOI] [Google Scholar]
- 32.Xiao S., Cheng M., Zhong H., Liu Z., Liu Y., Yang X., Liang Q. Iron-mediated activation of persulfate and peroxymonosulfate in both homogeneous and heterogeneous ways: A review. Chem. Eng. J. 2020;384:123265. doi: 10.1016/j.cej.2019.123265. [DOI] [Google Scholar]
- 33.Ji Y., Wang L., Jiang M., Yang Y., Yang P., Lu J., Ferronato C.C., Chovelon J.M. Ferrous-activated peroxymonosulfate oxidation of antimicrobial agent sulfaquinoxaline and structurally related compounds in aqueous solution: Kinetics, products, and transformation pathways. Environ. Sci. Pollut. Res. 2017;24:19535–19545. doi: 10.1007/s11356-017-9569-1. [DOI] [PubMed] [Google Scholar]
Associated Data
This section collects any data citations, data availability statements, or supplementary materials included in this article.
Supplementary Materials
Data Availability Statement
Data are contained within the article and Supplementary Materials.


