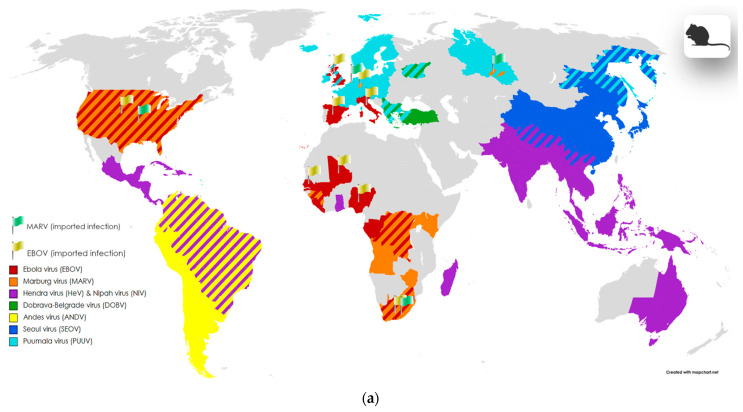
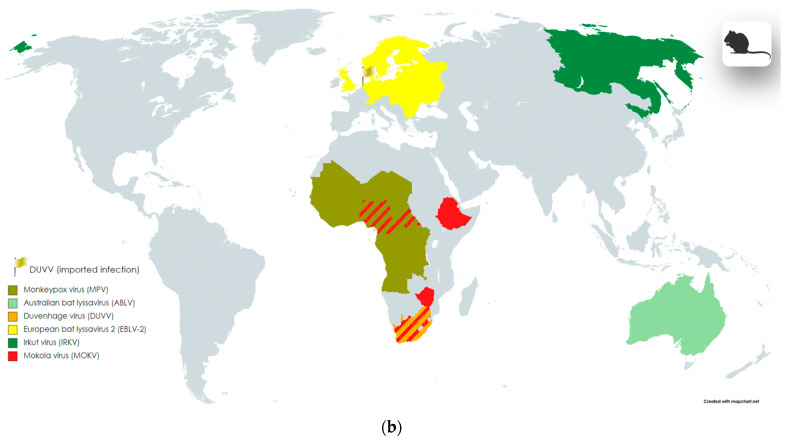
Figure 3.
Geographic distribution of zoonotic (vertebrate) infections, including areas of endemic and imported cases involving nervous system symptoms. The division into blocks (a,b) was implemented to enhance the visualization of data on the maps; information about the taxonomic groups located on each block is provided in the legend within the pictures, as well as in the main text alongside the first mention of the corresponding virus; imported cases are marked with flags. Maps were created with the Map Chart online map-making tool (https://www.mapchart.net/index.html, accessed on 7 May 2024); graphic objects were created with the BioRender online science illustration making tool (https://www.biorender.com/, accessed on 7 May 2024). The images may contain slight inaccuracies in depicting the boundaries of virus distribution areas due to the limitation of the map scale and the choice of scientific sources utilized to create these illustrations.


