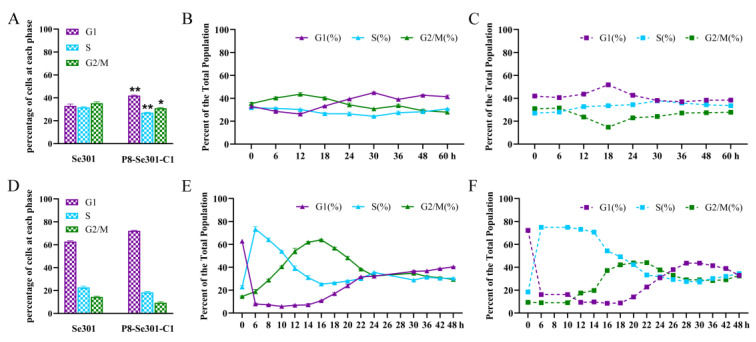
Figure 1.
Cell cycle distribution and differences between Se301 and P8-Se301-C1 cells. Se301 and P8-Se 301-C1 cells (1 × 10⁶) were seeded in 60 mm diameter dishes, and then cells were harvested at indicated time points. After being stained with PI, the cell cycle distribution in the G1, S, and G2/M phases was determined by flow cytometry. (A) Cell cycle distribution of Se301 and P8-Se301-C1 cells at 0 h after subculture. Cell cycle distribution of Se301 cells (B) and P8-Se301-C1 cells (C) at indicated time points after subculture. The cells (1 × 10⁶) were treated with 80 μg/mL hydroxyurea for 20 h to synchronize in the G1 phase, and the cell cycle distribution of Se301 and P8-Se301-C1 cells was determined (D). Then, the G1 phase synchronized cells were released into culture with fresh medium, and the cell cycle progress of Se301 cells (E) and P8-Se301-C1 cells (F) at the indicated time points after release culture were determined. Data are presented as mean ± standard deviation from triplicate biological experiments. * p <0.05, ** p < 0.01.

