

Summary
Here, we show that a NOT gated cell therapy (Tmod) can exploit antigens such as epidermal growth factor receptor (EGFR) and human leukocyte antigen-E (HLA-E) which are widely expressed on cancer cells. Noncancerous cells—despite high expression of these antigens—are protected from cytotoxicity by the action of an inhibitory receptor (“blocker”) via a mechanism that involves blocker modulation of CAR surface expression. The blocker is triggered by the product of a polymorphic HLA allele (e.g., HLA-A∗02) deleted in a significant subset of solid tumors via loss of heterozygosity. Moreover, Tmod constructs that target mouse homologs of EGFR or HLA-E for activation, and a mouse-equivalent of HLA-A∗02 for inhibition, protect mice from toxicity caused by the CAR alone. The blocker also controls graft vs. host response in allogeneic T cells in vitro, consistent with the use of Tmod cells for off-the-shelf therapy without additional gene-editing.
Subject areas: Natural sciences, Biological sciences, Immunology, Systems biology, Cancer systems biology
Graphical abstract
Highlights
-
•
The Tmod NOT gate can target widely expressed antigens such as EGFR and HLA-E
-
•
Tmod works in mice, targeting mouse homologs of EGFR and HLA to kill tumors
-
•
Ligand-dependent CAR removal may facilitate Tmod localization to the tumor site
-
•
Tmod inherently resists GvHD without gene edits, a benefit for allogeneic products
Natural sciences; Biological sciences; Immunology; Systems biology; Cancer systems biology
Introduction
Discrimination between tumor and normal tissue is the fundamental challenge in cancer drug discovery. Tumor-associated antigens (TAA) were postulated over a century ago by Paul Ehrlich,1 and the first such molecule (CEA) was identified in 1965.2 However, tumor-specific molecules are rare and the TAAs that have been described exhibit varying degrees of normal tissue expression, a feature that limits their utility. EGFR and its close relative human epidermal growth factor receptor 2 (HER2) are good examples. Both are oncogenes that play significant roles in development of many cancers. Trastuzumab, a monoclonal antibody (mAb) that targets HER2, is very effective against a genetically defined subpopulation of breast cancers, while EGFR mAbs (e.g., panitumumab, cetuximab, necitumumab, nimotuzumab, matuzumab) are used in a subset of colorectal and other solid malignancies. Both HER2 and EGFR mAbs are constrained by their effects on normal tissues. In the case of HER2, trastuzumab is largely ineffective against the large majority of solid tumors without genetically amplified HER2 and sensitizes the heart to chemotherapeutics.3 For EGFR mAbs, expression on normal tissues causes toxicity that limits their dose and efficacy (see for review4).
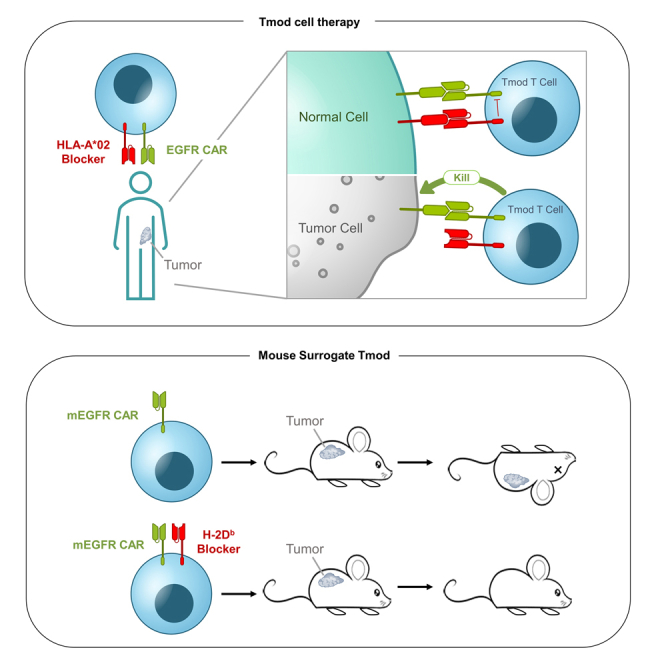
Cell therapy offers certain advantages for solid-tumor treatment over agents like mAbs that depend on passive processes to access tissues outside the blood. Nonetheless, the normal adult tissue expression of TAAs including EGFR and HER2 pose the same challenges. For example, a HER2 CAR-T investigational medicine triggered fatal, presumptive on-target toxicity in the single cancer patient who received it.5 But cell therapy also provides the opportunity to improve selectivity by integrating additional signals that may help focus the cytotoxicity of effector cells on tumor tissue (see for review6,7). One example of a signal integration mechanism is Tmod, a system that utilizes an inhibitory receptor gated by specific HLA alleles to control a CAR or TCR activator (Figure 1A;7,8). The blocker component of Tmod converts activators that react to TAA-positive normal cells into tumor-selective agents that discriminate between normal tissues and tumors that have lost common HLA alleles via loss of heterozygosity (LOH), a common event in tumorigenesis.
Figure 1.

EGFR Tmod cells discriminate between genetically selected tumor and normal cells
(A) A schematic representation of the Tmod system. The normal cells are heterozygous for HLA-A in this case and contain one HLA-A∗02 allele. The tumor cells have undergone clonal LOH and have lost HLA-A∗02 (depicted here as the bright red allele on one homolog of human chromosome 6).
(B) A schematic of molecular composition of Tmod constructs used in these studies. EGFR scFvs were derived from clinical mAbs. EGFR- or HLA-E-targeting activator and HLA-A∗02-targeting blocker receptors were co-expressed on a single transcript using the EF1α promoter with a T2A site in-between. The blocker receptor is composed of a LILRB1 (LIR-1) hinge, transmembrane (TM), and intracellular domain (ICD). The activator receptor is a generation 3 (Gen3) CAR composed of a CD8α hinge, CD28 TM, and fused CD28, 4-1BB, and CD3z ICDs. Some constructs included an shRNA (in dashed box) targeting β2 microglobulin (B2M).
(C) Acute cytotoxicity and blocking were measured in T cells using HeLa Target A (EGFR+HLA-A∗02-) or Target AB (EGFR+HLA-A∗02+) cells which model tumor or normal cells, respectively, at an E:T ratio of 1:1. Data are represented as mean ± SD (n = 3). Similar results with another donor are shown in Figure S1E.
(D) Activator and blocker sensitives were measured in T cells using (i) EGFR-HLA-A∗02- HeLa cells transfected with various amounts of EGFR mRNA (left); or (ii) EGFR+HLA-A∗02- HeLa cells transfected with HLA-A∗02 mRNA (right). Specific killing at the 24 h timepoint is plotted. See Table S1 for EC50 and IC50 values. Data are represented as mean ± SD (n = 2).
(E) Maximum specific killing of indicated target cells at 48 h of co-culture with transduced T cells at various E:T ratios is plotted. Blue arrows indicate selectivity window between Target A and Target AB for EGFR Tmod cells. Data are represented as mean ± SD (n = 4). See Figure S1F for antigen expression on isogenic target cell lines and Methods for selectivity window calculation. Target A = EGFR+HLA-A∗02-; Target AB = EGFR+HLA-A∗02+; Target B = EGFR−HLA-A∗02+. For the HER2 CAR, the Target A and AB lines are HER2+.
(F) EC50 and IC50 values determined as described in Table S1 were converted to TPM using the standard curves described in Figure S1H and plotted in relation to EGFR and HLA-A expression. To plot the gene expression levels here, we have assumed loss of HLA-A∗02 (thus, zero HLA-A in the context of HLA-A∗02-specific Tmod cells) because the patients intended for treatment are selected for LOH. The gray bars represent the 95% confidence interval for EC50 and IC50 values in Jurkat cells of EGFR Tmod constructs derived from cetuximab, matuzumab, panitumumab, and necitumumab. EGFR and HLA-A∗02 RNA levels in normal tissue and selected cancer cell lines are plotted with dots and stars, respectively. Purple points represent solid tumor types with HLA-A expression set at 0 TPM to account for selection of HLA-A∗02- tumors with LOH. Tumor data are from the The Cancer Genome Atlas database (TCGA) and normal tissue data from GTEx. NHEK, normal human epidermal keratinocyte.
We demonstrate that EGFR can be used as the target for a potent Tmod cell therapy that spares normal tissues across a broad range of antigen expression. An even more widely expressed antigen, HLA-E, can also be used in Tmod constructs for tumor-selective targeting. Part of the mechanism for blocker control involves ligand-dependent down-modulation of the activator on the cell surface, a process that is rapidly reversible upon exposure to tumor cells. Mouse models that approximate the complex environment of the human body with respect to expression of mouse homologs of EGFR, HLA-E and HLA-A∗02 support the premise of a therapeutic window for Tmod cells that is substantially larger than CAR-T cells. Using EGFR Tmod as an example, we also show that the blocker component of Tmod controls the allogeneic T cell response without gene-editing, a potential benefit in the context of off-the-shelf T cell products.
Results
EGFR Tmod cells discriminate between genetically selected EGFR+HLA-A∗02- tumor and EGFR+HLA-A∗02+ normal cells
To create the activator portion of an EGFR Tmod construct, we converted 4 clinical EGFR mAbs into scFvs and linked them to a Gen3 CAR backbone (Figure 1B). Engineered Jurkat cells transfected with these CARs displayed good antigen-dependent activation (Figure S1A). We paired these EGFR activators with either of two LIR-1-based HLA-A∗02 blockers, one with an scFv derived from the PA2.1 antibody and the other with a humanized version of this scFv (huPA2.1), which all expressed well in Jurkat cells (Figure S1B). Activation and blocking sensitivities were also measured in Jurkat cells by co-culture with varying amounts of antigens on HeLa target cells. For activation, EGFR mRNA was titrated in EGFR−HLA-A∗02- HeLa cells and for blocking, HLA-A∗02 mRNA was titrated in EGFR+HLA-A∗02- HeLa cells (Figure S1C). Cell surface expression of EGFR and HLA-A∗02 were determined using QIFIKIT.
Results of these experiments allowed estimation of the EC50 and IC50 for each construct in absolute molecules/cell (Table S1). The EGFR activators were all highly sensitive, with EC50s ranging from 2,700 to 5,800 EGFR molecules/cell. The IC50s for the Tmod constructs ranged from 23,000 to 84,000 HLA-A∗02 molecules/cell. Cells with high activator antigen density were blocked well if they expressed a sufficient number of HLA-A∗02. Importantly, blocking was completely ligand-dependent and did not involve substantial reduction in the sensitivity of the EGFR activators.
We next tested the potency and selectivity of EGFR Tmod constructs in primary T cell cytotoxicity assays where the receptors also expressed well (Figure S1D). Isogenic HeLa variants that model “tumor” (Target A; EGFR+HLA-A∗02-) and “normal” (Target AB; EGFR+HLA-A∗02+) cells depending on the absence or presence of HLA-A∗02, respectively, were used as targets. CAR T cells killed both Target A and Target AB cells equivalently while Tmod cells selectively killed Target A cells and spared Target AB cells (Figures 1C and S1E). The EGFR Tmod construct incorporating the necitumumab scFv paired with the humanized blocker based on huPA2.1 was selected for proof-of-concept and called EGFR Tmod. Selectivity and potency of this construct was further verified by primary T cell cytotoxicity assays with mRNA titration in HeLa target cells (Figure 1D). We next used 4 cell lines, including HeLa, to further characterize the selectivity window of EGFR Tmod cells. These experiments utilized isogenic trios of variants of each cell line that expressed different combinations of the two relevant target antigens: (1) Target A = EGFR+HLA-A∗02-; (2) Target AB = EGFR+HLA-A∗02+; and (3) Target B = EGFR−HLA-A∗02+. The target cell variants were assessed by flow cytometry and confirmed to have the proper protein-expression phenotypes (Figure S1F). Systematic increase of E:T cell ratio allowed comparison of the ligand-dependent cytotoxicity of EGFR Tmod compared to control CARs. The HER2 CAR that caused severe on-target toxicity in the clinic5 was used as a benchmark, and HER2 densities on these target cells are summarized in Figure S1F. The selectivity window measured by the ratio of the E:T value at 50% maximal activation (ET50) on A vs. AB target cells ranged from 16x to over 65x in the 4 cell lines (Figure 1E). Selectivity data for EGFR Tmod were extended beyond EGFR+HLA-A∗02+ cells to bona fide wild-type cells using normal human epidermal keratinocytes (NHEKs). NHEKs from an HLA-A∗02- donor were killed, but HLA-A∗02+ cells were protected by the blocker module of EGFR Tmod (Figure S1G).
To help interpret the on-target selectivity profile of EGFR Tmod constructs, we combined the quantitative datasets for dose-response of the activator and blocker with high-quality, publicly available expression data for tumors (TCGA) and normal tissues (GTEx). First, we created standard curves to relate mRNA levels determined by RNA-Seq to absolute surface protein levels measured by QIFIKIT (Figure S1H). This common metric allowed us to visualize the EC50s and IC50s of the EGFR Tmod constructs in both Jurkat and primary T cells compared to target-antigen levels in tumor and normal tissues (Figure 1F). The combined plot illustrates the importance of the blocking mechanism for a therapeutic that targets the EGFR antigen in tumors. All tissues except blood express sufficient levels of EGFR to activate the CARs used in EGFR Tmod constructs based on antigen levels that fall above the EC50 values of the constructs (horizontal gray shadow). Critically, however, HLA-A levels in these normal tissues are also near or above the IC50 measured for the EGFR Tmod construct in Jurkat cells (vertical gray shadow). Also noteworthy are the EGFR mRNA levels of tumor tissues selected for LOH. The large majority of solid tumors express sufficient EGFR to activate the Tmod constructs, with the medians for all solid tumors above the EGFR Tmod construct EC50. This result reflects the broad expression of EGFR in solid tumors and the high sensitivity of the activator component of the EGFR Tmod construct.
The mechanism of EGFR Tmod selectivity involves reversible, down-modulation of EGFR CAR on the cell surface
For effective therapy, EGFR Tmod cells must possess additional functional characteristics. Perhaps foremost among these is the capacity to differentiate between tumor and normal cells in mixed populations. We know from previous work that the Tmod mechanism has such properties.8,9,10,11 However, we sought to demonstrate this property in the specific case of EGFR Tmod cells. Thus, HeLa Target A tumor cells that expressed red fluorescent protein (RFP) were mixed with HeLa Target AB cells that expressed green fluorescent protein (GFP), modeling normal tissues, and cultured with primary T cells. Whereas the EGFR CAR did not discriminate between the two isogenic cell types, EGFR Tmod cells were highly selective in killing tumor cells (Figures 2A, 2B, and S2A). Indeed, target specificity of EGFR Tmod cells was comparable to EGFR CAR-Ts and CEA TCR-Ts with regard to bystander killing (Figures 2A, 2B, and S2B). Moreover, the process was reversible. EGFR Tmod cells cultured with Target A cells could switch from cytotoxic to quiescent state after transfer to Target AB cells. Likewise, EGFR Tmod cells cultured with Target AB in the first round and transferred to Target A in the second round switched from blocking to active cytotoxicity (Figure 2C).
Figure 2.

The mechanism of EGFR Tmod selectivity involves reversible, down-modulation of EGFR CAR on the cell surface
(A) Fluorescence images of indicated T cells cocultured with 1:1 mix of RFP+ Target A (EGFR+HLA-A∗02-) and GFP+ Target AB (EGFR+HLA-A∗02+) HeLa cells at an E:T ratio of 1:1 at 48 h timepoint. Highly selective HLA-A∗02-restricted CEA TCR was used as a standard to compare selectivity. For CEA TCR, CEA+HLA-A∗02+RFP+ HeLa cells were used as on-target controls and CEA−HLA-A∗02−GFP+ HeLa cells were used for off-target controls. The scale bars are 500 μm.
(B) Kinetic cytotoxicity traces are plotted for the Figure 2A over the course of 48 h. Data are represented as mean ± SD (n = 3).
(C) After 48 h of co-culture with either Target A or Target AB HeLa cells, T cells were moved to fresh cell-culture wells for a second round of co-culture with A or AB target cells at E:T ratio of 1:1. The bar graphs show that EGFR Tmod cells switch from the ON to OFF cytotoxic state based on the target-cell population to which they are exposed. Blocker used here is PA2.1 blocker. Data are represented as mean ± SD (n = 2).
(D) Tmod cells were stained for activator and blocker expression after 48 h of co-culture with either HeLa Target A or Target AB cells at 1:1 E:T ratio. The Tmod cells were sequentially transferred to wells with the other target cell type at 1:1 E:T ratio, co-cultured for 48 h, and stained again for activator and blocker receptors. Dot density inside magenta box reveals that the activator was down-regulated when Tmod cells were exposed to Target AB cells and reappeared when exposed to Target A cells.
(E) Serial co-culture schema used to demonstrate Tmod cell reversible activation. Tmod cells were co-cultured with HeLa Target AB cells for 24 h in the first round and were sequentially transferred to second round with indicated target cell types. A fraction of the T cells were stained for activator receptor at 2 h, 24 h, and 48 h in the co-culture. All co-cultures were at E:T ratio of 1:1. Letters A, B and AB represent target cell phenotype; Target A = EGFR+HLA-A∗02-; Target AB = EGFR+HLA-A∗02+; Target B = EGFR−HLA-A∗02+.
(F) Expression of EGFR CAR on T cells from experiment described in (E) are represented as histogram plots. Recombinant EGFR-Fc and anti-Fc antibody were used to stain EGFR CAR.
Interestingly, reversible, selective activity correlated with the surface levels of activator molecules on EGFR Tmod cells. Tmod cells co-cultured with Target A cells maintained activator expression while Tmod cells co-cultured with Target AB cells down-regulated activator expression (Figure S2C). Moving these cells to Target A cells in the next round restored activator expression (Figure 2D). To further characterize this phenomenon, Tmod cells co-cultured with Target AB cells for the first round were sequentially transferred for a second round with different target cell types and activator expression was monitored over time (Figure 2E). Removal of Target AB cells quickly restored activator expression, even in the absence of EGFR antigen, as Tmod cells moved to Target A cells, Target B cells, and empty wells all recovered activator expression. In mixed-target cultures, even a small proportion of tumor cells promoted activator reappearance. Restoration of the activator happened within hours (Figure 2F). The activator(+) fraction of EGFR Tmod cells tracked with the target cell type and cytotoxicity; high activator levels corresponded to killing of tumor cells, while low levels corresponded to a state of blockade created by pure cultures of Target AB cells (Figure S2D).
Antigen-coated beads allowed us to test if reappearance of the CAR is caused by loss of target cells via cytotoxicity. Beads were replenished every 24 h, thus maintaining antigen in the cultures. Under these conditions the CAR and Tmod activator were down-regulated after 1 h in contact with beads. However, the CAR and Tmod activator returned to their initial levels by 96 h in the presence of Target A beads, while Target AB beads prevented reappearance of the activator on Tmod cells (Figures S2E and S2F). The data suggest that the mechanism for blocker action involves not only the interplay between ITAM and ITIM phosphorylation, a well-studied aspect of inhibitory receptor function that we have observed to influence function in the case of our LIR-1 backbone,8 but also the previously unknown capacity of the blocker to modulate surface levels of activator in a ligand-dependent fashion; specifically, to prevent reemergence of the activator once down-regulated by ligand. This behavior suggests a requirement for blocker function of physical proximity to the activator, as blocking required co-display of HLA-A∗02 antigen on the same surface as the EGFR activator antigen, consistent with previous experiments with beads (Figure S2G;8).
EGFR Tmod with an shRNA module mitigates allogeneic responses in vitro
One of the goals of cell therapy is off-the-shelf products to provide more convenient and potentially cost-effective treatments for cancer patients. Therefore, we sought to incorporate the Tmod system into an allogeneic T cell platform. We had two objectives: (i) control the graft vs. host (GvH) response; and, (ii) reduce or eliminate the host vs. graft (HvG) allogeneic reaction while balancing the risk of natural killer (NK) cell activation. Both these issues involve the endogenous TCR repertoire, and potential solutions are currently under investigation by the field (see review12). With respect to Tmod therapy, we took advantage of the blocker’s capacity to inhibit TCR activation to address the GvH response. We first tested the ability of the blocker to inhibit individual TCRs expressed in T cells. Cytotoxicity of an extremely potent HLA-A∗02-restricted TCR targeting NY-ESO-1 clone 1G413 was completely inhibited by the blocker when exposed to HLA-A∗02 antigen (Figures 3A and S3A). This behavior was not limited to HLA-A∗02-restricted TCRs as an A∗11-restricted KRAS TCR clone TRAV4-4∗01/BV12-2∗0114 was also inhibited by the blocker (Figures 3A and S3A). We next explored the allogeneic response in a classic mixed-lymphocyte reaction.15 Again, the blocker reduced GvH measured by proliferation, CD25 upregulation and IFNγ release to levels observed in TRAC-knockout T cells (Figures 3B and S3B). Together these data suggest that the EGFR Tmod system may control GvH comparable to elimination of TCRs by gene-editing.
Figure 3.

EGFR Tmod with an shRNA module mitigates allogeneic responses in vitro
(A) Cytotoxicity of T cells transduced with known HLA-A∗02/NY-ESO-1 TCR with or without the blocker receptor were measured against A375 cells (Target AB), which endogenously express HLA-A∗02 and NY-ESO-1 (left panel). Cytotoxicity of T cells transduced with known A∗11/KRAS-G12D TCR with and without the blocker were were measured against Target A HUCCT1 cells, which endogenously express HLA-A∗11 and KRAS-G12D, or Target AB HUCCT1 cells transduced with HLA-A∗02 (right). Data are represented as mean ± SD (n = 3–6). The expression of the TCR and blocker is shown in Figure S3A.
(B) Top panel shows a schematic of a mixed-lymphocyte reaction where responder T cells from an HLA-A∗02- donor, modeling “graft,” and stimulator antigen-presenting cells (APCs) from an HLA-A∗02+ donor, modeling “host,” were co-cultured for 5 days. T cells obtained from the same donor as the stimulator APCs were used as an autologous control. Responder cells were stained with CMFDA to track cell division and stimulator cells were treated with mitomycin-C to inhibit proliferation. Proliferation, upregulation of activation markers, and INFγ secretion from the responder were measured as readouts for allogeneic response. INFγ data are represented as mean ± SD (n = 3). See Figure S3B for comparison to TCR KO T cells.
(C) Tmod receptors and HLA class I expression were measured by staining with protein L (which binds to the activator and blocker scFv via its κ light chain sequence) and anti-HLA class I (W6/32), respectively. See Figure S3E for details on B2M knock-out (KO) and knock-down in Tmod cells and HLA class I quantification.
(D) Indicated variants of Tmod cells were subjected as target cells to allogeneic CD8+ T cells in a mixed-lymphocyte reaction (see Figure S3F for experimental setup). Three “graft” donors were tested with one “host” donor. B2M KO, B2M gene disrupted by CRISPR/Cas9.
(E) Indicated variants of Tmod cells were subjected as target cells to allogeneic NK cells in a mixed-lymphocyte reaction (see Figure S3F for experimental setup). Plots represent data from six “graft” donors with one “host” NK cell donor. Data are represented as mean ± SD (n = 6). ∗p ≤ 0.05, ∗∗p ≤ 0.01, ∗∗∗≤0.001; ns, not significant, by paired t test.
We next addressed the obstacle of HvG response to an allogeneic EGFR Tmod product. To do this, we explored two options to reduce expression of the HLA class I protein, a major stimulus for HvG response in allogeneic transplants: (1) knockout of the β2 microglobulin (B2M) locus and (2) reduction of B2M mRNA levels via an shRNA expression module linked to the Tmod construct. In previous studies, we used B2M shRNA to mitigate binding in cis by endogenous HLA-A∗02 protein of A∗02-directed blockers (Sandberg et al., 2022; Tokatlian et al., 2022; Figures S3C and S3D). Disruption of the B2M gene in Tmod cells by CRISPR/Cas9 or B2M shRNA under two different promoters, a stronger promoter (U6) and a weaker promoter (H1), reduced HLA class I expression to varying degrees as detected by the pan-class-I antibody W6/32 and quantified by QIFIKIT (Figures 3C and S3E). Tmod cells with wild-type levels of HLA class I were most vulnerable to killing by allogeneic CD8+ T cells and reduction of HLA-I mitigated this cytotoxicity (Figures 3D and S3F). We next tested if these engineered T cells were susceptible to killing by human NK cells, which are known to recognize “missing self” under certain conditions; i.e., low MHC class I (see for review16). The shRNA+ Tmod cells displayed a level of sensitivity to killing by purified NK cells which was intermediate between Tmod cells and B2M− Tmod cells (Figures 3E, S3F, and S3G). To balance the two sources of HvG reactivity, cytolytic T cells that respond to high levels of mismatched MHC, and NK cells that respond to low levels of MHC class I, we selected the U6 promotor to drive shRNA expression with our allogeneic EGFR Tmod construct. This construct is subsequently referred to as EGFR Tmod(sh).
EGFR Tmod cells selectively kill EGFR+HLA-A∗02- tumor cells in vivo
The EGFR Tmod(sh) construct and other control constructs were tested in HLA-A∗02- donor T cells in vivo using NSG mice (which lack NK and T cells) harboring various xenografts. To model tumor vs. normal selectivity, a setup similar to the in vitro selectivity experiments was employed. The mice carried two grafts: one graft on the right flank comprised unmodified EGFR+HER2+HLA-A∗02+ cells to model normal cells from an HLA-A∗02 heterozygous patient; and another graft on the left flank comprised EGFR+HER2+HLA-A∗02−cells to model tumors with HLA LOH (Figure S4A). In the first experiments, grafts derived from the H508 cell line grew to a volume of ∼100 mm3 and T cells were injected at a dose of 2E7 cells/mouse. Caliper measurement was used to monitor tumor growth over time (Figure 4A). The HER2 CAR-Ts cleared the tumor effectively, but surprisingly, EGFR Tmod cells killed the mice within 3 days (Figure 4B). The EGFR Tmod(sh) cells did not affect the mice; however, they did not clear the tumor graft.
Figure 4.

EGFR Tmod eliminates HLA-A∗02- tumor while sparing HLA-A∗02+ cells in vivo
(A) HER2+EGFR+HLA-A∗02- H508 (“tumor”) xenograft volume on the left flank plotted over time from the dual-flank in vivo xenograft experiment described in Figure S4A. Dotted line indicates day of T cell injection. Data are represented as mean ± SEM (n = 4 mice/cohort).
(B) Heatmap plots the severity of clinical observations of indicated cohort from in vivo study described in Figure 4A. Clinical observations included lethargy, weight loss, rough coat, and hunched posture.
(C) In vitro cytotoxicity of T cells injected in vivo for study described in Figures 4A and 4B was measured with titration of E:T ratios on HER2+EGFR+HLA-A∗02- H508 (“tumor”) target cells. Maximum specific killing of target cells at 48 h of co-culture is plotted. Data are represented as mean ± SD (n = 4). See Table S3 for ET50 summary and Figure S4B for transgene(+) flow plots.
(D) Jurkat cells transfected with necitumumab-derived CAR (hEGFR CAR) were stained with either recombinant mEGFR-Fc or hEGFR-Fc followed by anti-Fc antibody. The binder directed at mEGFR was generated by display methodology (see STAR Methods) and was used as a comparator.
(E) NFAT activation of hEGFR CAR Jurkat cells and mEGFR CAR Jurkat cells was measured after 6 h of coculture with EGFR− HeLa cells transfected with various amounts of mEGFR mRNA. Data are represented as mean ± SD (n = 2). The histogram on the right shows the surface expression of mEGFR protein measured by anti-mEGFR polyclonal antibody.
(F) Presence of untransduced (UTD) and EGFR Tmod(sh) cells in indicated tissues was measured 3 days post injection by qPCR on purified genomic DNA with mouse-specific probe and human-specific probe (see STAR Methods). Data are represented as mean ± SEM (n = 3 mice/cohort for UTD and EGFR Tmod(sh); n = 1 mouse for saline); 3 technical replicates/mouse. See Figure S4C for other tissues tested.
(G) Biodistribution data scaled by organ weight and blood volume is plotted. Data are represented as mean ± SEM (n = 3 mice/cohort for UTD and EGFR Tmod(sh); n = 1 mouse for saline); 3 techical replicates/mouse.
(H) The intensity of bioluminescent imaging from firefly luciferase-expressing MS751 “tumor” (MSLN+EGFR+HLA-A∗02-) and “normal” (MSLN+EGFR+HLA-A∗02+) xenografts established in intraperitoneal cavity. T cells were infused i.p. 11 days post xenograft injection with indicated doses. Each line represents one mouse; n = 3–4 mice/cohort.
The behavior of the EGFR Tmod constructs compared to the HER2 CAR benchmark alerted us to the possibility that weak cross-reactivity of the scFv derived from necitumumab with mouse EGFR (mEGFR) might be problematic in vivo. A compilation of experiments using different target cell lines and donors was consistent with variable level of activity of the EGFR Tmod constructs in vivo that was not observed with HER2 and with other activators used previously (see Table S2). For example, EGFR CAR-Ts killed mice within 3 days, although in this experiment EGFR Tmod cells were not toxic to the mice. Together, these in vivo results suggested that cross-reactivity with mEGFR may enhance other experimental differences (e.g., target cell line, donors, T cell preparation, and dose), complicating interpretation of these in vivo models.
In vitro studies indicated that, other than slightly lower potency (4x), no meaningful differences between HER2 and EGFR constructs were detected (Figures 4C and S4B; Table S3). Thus, the hypothesis of cross-reactivity with mEGFR appeared to be the most plausible explanation for the variable toxicity and efficacy observed in the xenograft models. Indeed, further investigation showed that, despite the low biochemical cross-reactivity of necitumumab with mEGFR, the scFv derived from necitumumab displayed low to moderate functional cross-reactivity when analyzed in the CAR format (Figures 4D and 4E). Thus, the body of evidence supported a hypothesis that: (1) mEGFR distracts the necitumumab-based constructs (CAR, Tmod, and Tmod(sh)) from getting to the tumor site and (2) EGFR Tmod(sh) is slightly less potent than EGFR Tmod.
To test the hypothesis of cross-reactivity in vivo prospectively, a biodistribution study of EGFR Tmod(sh) was conducted. Three days post T cell injection into tumor-bearing animals, the animals were terminated and perfused. Organs and tissues were collected and used to purify genomic DNA. These samples were analyzed by qPCR. This analysis revealed striking differences between trafficking of untransduced and EGFR Tmod(sh) cells in vivo. EGFR Tmod(sh) cells were dramatically lower in the blood compared to untransduced cells, and enriched in other compartments (liver, kidney and colon; Figures 4F and S4C). The biodistribution was even more dramatic when scaled by organ weight (Figure 4G). The liver and blood accounted for the biggest difference between EGFR Tmod(sh) and untransduced cells. Notably, not only is the liver highly perfused by the circulation but it also expresses EGFR at high levels, especially in the mouse (Figures S4D and S4E).
With a clearer understanding of the issues caused by systemic exposure of the necitumumab-derived receptors to mEGFR, we conducted a series of experiments that tested potency and selectivity of EGFR Tmod(sh) cells using methods other than i.v. infusion. First, T cells were injected directly into MS751 grafts growing on the flank. This pilot experiment demonstrated that EGFR Tmod(sh) cells were fully capable of killing the tumor graft, while sparing the normal graft—even with a dose of 2E6 T cells directly inserted into the graft itself (Figure S4F). A similar pilot experiment in which the MS751 grafts were first established via intraperitoneal (i.p.) injection, followed 11 days later by i.p. injection of 2E6 T cells, confirmed that bypassing the systemic circulation enabled efficacy and selectivity of EGFR Tmod(sh) cells (Figure S4G). This experiment was repeated at a larger scale with a range of doses, and with a clinically validated CAR construct (M5) as comparator. M5 is activated by mesothelin, which is also expressed by MS751, the cell line used in these experiments. Potency/selectivity assays pre-infusion demonstrated robust and selective killing of EGFR Tmod(sh) cells, with potency (ET50) calculated as 2x lower than the benchmark HER2 and M5 CARs (Figures S4H and S4I; Table S4). The in vivo experiment showed a clear dose-response, with potency of the EGFR Tmod(sh) cells estimated to be roughly 10x less than the highly potent and clinically toxic M5 construct (Figure 4H).
Mice are protected from CARs directed at murine EGFR by an H-2Db blocker
To test the safety of the EGFR Tmod approach, we performed a study using mouse surrogate Tmod constructs directed at murine equivalents of the human EGFR Tmod target antigens: mouse EGFR (mEGFR) and H-2D (Figure 5A). Tissue expression of both mEGFR and H-2 class I correlate with their human orthologs (Figures 5B and S4D), suggesting relevance of this system to model the risk of EGFR Tmod to healthy organs. By testing various monoclonals directed at H-2 class I antigens, we identified an H-2Db scFv that functioned effectively as a blocker in the context of the LIR-1 backbone (see STAR Methods). We then created a mEGFR mAb by display methodology (see STAR Methods). The mEGFR/H-2Db activator/blocker pair expressed well and displayed potency and selectivity that were somewhat reduced compared to the human EGFR Tmod construct in both primary T and Jurkat cells with selectivity of ∼10x for tumor vs. normal target cells (Figures 5C, S5A, and S5B).
Figure 5.

mEGFR/H-2Db Tmod mitigates cytotoxicity from mEGFR CAR and clears tumor in vivo
(A) Schematic representation of surrogate mEGFR Tmod system which targets mouse orthologs, enabling readout of whole-body responses to CAR and Tmod cells. In the EGFR surrogate Tmod system, the activator targets murine EGFR and the blocker targets H-2Db, one of the mouse MHC class I alleles present in NSG mice.
(B) Correlation of mRNA expression of human HLA-A and mouse H-2K1 is plotted. H-2K1 is an MHC class I locus in the mouse, equivalent to HLA-A. Human mRNA values are from GTEx and mouse mRNA values from the FANTOM5 project.
(C) Plot shows the maximum specific killing of target cells 48 h after co-culture with transduced T cells in a titration of the E:T ratio on MS751 target cells. Blue arrow indicates selectivity window between Target A and Target AB for mEGFR/H-2Db Tmod. Target A = mEGFR+H-2Db-; Target AB = mEGFR+H-2Db+. Data are represented as mean ± SD (n = 4).
(D) Survival of mice infused with indicated T cells at indicated doses are plotted. n = 5 mice/cohort. See Figure S5C for clinical observation plot, Table S5 for clinical observations, Figure S5D for body weights, Figure S5E for T cell count in blood, and Figure S5F for cytokine in serum.
(E) Bioluminescence imaging quantification from firefly luciferase-expressing MS751 tumor graft (mEGFR+H-2Db-) is plotted vs. time. Dotted line indicates T cell infusion via i.v. injection. Data are represented as mean ± SEM (n = 4 mice/cohort).
NSG mice, which endogenously express H-2Db because they carry the g7 haplotype,17 were infused via tail vein with human T cells engineered with the mEGFR/H-2Db Tmod construct or the mEGFR CAR alone, and survival and other clinically relevant parameters were recorded. At the top doses, the CAR-Ts killed all mice in the cohort (n = 5), while all Tmod-cell-treated mice survived (Figure 5D). At the low dose, 4x below the top dose, none of the CAR-T-treated mice died over the 7-week course of the experiment. At the intermediate dose, 2x below the top dose, half of the CAR-T cohort died, while all mice in the Tmod cell cohort survived. CAR-T-treated mice exhibited lethargy and severe weight loss before succumbing (Table S5; Figures S5C and S5D). Whereas mEGFR CAR-Ts were not detectable in the blood 3 days post T cell injection, Tmod cells were present at a level similar to untransduced T cells (Figure S5E). Human IFNγ, TNFα, and IL-2 levels were high in serum collected from mEGFR CAR-infused mice while Tmod and untransduced T cells did not induce high cytokine release (Figure S5F). This experiment was repeated using mice with a xenograft on the flank composed of MS751 cells that over-expressed mEGFR. The H-2Db blocker protected the mice from the EGFR CAR, without compromising efficacy (Figure 5E). Together, these results with a surrogate Tmod construct provide strong support for Tmod as a means to achieve much higher selectivity in the body for malignancies with HLA LOH vs. normal tissues.
HLA-E Tmod cells also exhibit potent, selective cytotoxicity in vitro and in vivo
To explore the generality of the Tmod approach to exploit antigens that are widely expressed on both tumor and normal tissues, we developed a Tmod construct directed at HLA-E as the activator antigen. HLA-E is a relatively non-polymorphic MHC antigen that has the same expression pattern as other HLA-I loci, including HLA-A (Figures S6A–S6C). It is expressed in nearly all tumors and normal tissues. We paired an HLA-E-binding scFv with the HLA-A∗02 blocker (Figure 1B). An approach similar to the EGFR Tmod studies was taken to characterize the properties of HLA-E Tmod cells. Briefly, the construct expressed well and displayed excellent potency and selectivity in both Jurkat and primary T cell functional assays (Figures 6A and S6D–S6F; Tables S6 and S7). HLA-E Tmod also demonstrated reversible activation in serial co-cultures and maintained high tumor-selectivity in mixed HLA-E+HLA-A∗02-/HLA-E+HLA-A∗02+ target-cell cultures (Figures 6B, 6C, and S6G). Finally, selective cytotoxicity was observed in vivo in two-flank xenograft experiments described above (Figure 6D).
Figure 6.

HLA-E Tmod and a murine surrogate Tmod constructs demonstrate selectivity
(A) HLA-E Tmod cells display >10x Target A (HLA-E+HLA-A∗02-) vs. Target AB (HLA-E+HLA-A∗02+) selectivity (blue arrow) in primary T cell cytotoxicity assays. Constructs were delivered via a single lentiviral vector shown in Figure 1B (without the shRNA module) into HLA-A∗02- donor T cells. Additional donor and target cells are in Figure S6F. Target cells are A375 variants. Data are represented as mean ± SD (n = 3).
(B) HLA-E Tmod cells are selective for tumor cells in HLA-A∗02+ and HLA-A∗02- target-cell mixed cultures. E:T ratio was 1:1 for Donors 1, 2, and 3, and 3:1 for Donor 4. Donors 1, 3, and 4 were HLA-A∗02+, and Donor 2 was HLA-A∗02-. B2M was knocked out by CRISPR in Donors 1 and 2. B2M was knocked down by shRNA as shown in Figure 1B in Donors 3 and 4. Data are represented as mean ± SD (n = 3).
(C) HLA-E Tmod demonstrates reversible cytotoxicity. All A375 target-cell variants expressed HLA-E and expressed either HLA-A∗02 or not, as shown. Constructs were HLA-E CAR and Tmod with the B2M shRNA module as in Figure 1B. E:T = 1:1. See Figure S6G for additional donor experiment. Target A = HLA-E+HLA-A∗02-; Target AB = HLA-E+HLA-A∗02+. Data are represented as mean ± SD (n = 3).
(D) HLA-E Tmod cells selectively kill HLA-A∗02- and spare HLA-A∗02+ xenografts. Xenograft volumes are plotted over time post implantation. Dotted line indicates day of T cell injection. NSG mice bearing two A375 xenografts (similar configuration as in Figure S4A), Target AB graft (HLA-E+HLA-A∗02+) on the right flank and Target A graft (HLA-E+HLA-A∗02-) on the left flank, were infused with T cells (dose = 2E7 cells/mouse) when the tumors were ∼100 mm3 in volume. Data are represented as mean ± SEM (n = 4 mice/cohort).
(E) Tmod protects against auto-reactivity of an H-2Kd CAR in mice. Percent survival vs. time after infusion via tail vein at the indicated doses is plotted. (n = 4 mice/cohort).
(F) Expansion of H-2Kd/Db Tmod cells was delayed compared to H-2Kd CAR-T cells in mice. T cell counts are human T cells detected in the blood of mice. Different T cell doses are shown. Data are represented as mean ± SEM (n = 4 mice/cohort).
The broad normal expression of HLA-E recommends an experiment analogous to the mEGFR Tmod in vivo analysis. To this end, we characterized an H-2Kd activator and paired it with the same H-2Db blocker used for mEGFR Tmod. H-2Kd, a mouse H-2 class I antigen, can be viewed in this context as a mouse ortholog of HLA-E. Using Jurkat and primary T cell assays in vitro, the H-2Kd/Db Tmod system displayed decent potency and a marginal selectivity window of ∼4x compared to the H-2Kd CAR alone (Figure S6H). But despite this limited selectivity in vitro, the addition of the H-2Db blocker protected NSG mice significantly from toxicity caused by the H-2Kd CAR (Figure 6E). At the maximum dose of 20E6 T cells and a dose 2x lower, H-2Kd CAR-Ts killed all mice in the cohort (n = 4), whereas mice injected with H-2Kd/Db Tmod cells survived 3–4 weeks longer (Table S8). Using human T cell expansion in mouse blood as an indicator of response, Tmod significantly protected the mice over the 20x dose-range tested (Figure 6F). Thus, the H-2Db blocker substantially protected mice from toxicity caused by the H-2Kd CAR, but not as effectively as in the mEGFR Tmod construct, suggesting that the selectivity window of the H-2Kd/Db Tmod cells may not be adequate for long-term suppression of auto-reactivity. Together, the work on the mouse homologs targeted by Tmod receptors supports the notion that the Tmod system provides a general solution to the problem of tumor selectivity—even with tumor antigens that are broadly expressed on normal tissues.
Discussion
Most active cell therapies that target TAAs have been toxic. These include a CEA TCR-T;18 two MSLN CAR-Ts; a MSLN hybrid CAR-TCR;19 a PSMA CAR-T;20 and a HER2 CAR-T.5 In these cases, the toxicity is consistent with on-target, off-tumor activity. In most instances, toxicity has compelled termination of the investigative study. Though no active EGFR CAR-T has been reported, by analogy with the HER2 CAR-T a small or nonexistent therapeutic window is anticipated. This extrapolation follows from the similar expression profiles of the two paralogous genes, strongly correlated in adult human tissues (Figure S7).
Both EGFR and HLA-E are very widely expressed in adult organs. EGFR is largely absent from blood tissues, but present in most if not all epithelial tissues, and highest in skin. This pattern explains the dose-limiting toxicity of skin rash observed for all EGFR therapeutic antibodies. HLA-E expression is ubiquitous with the exception of red blood cells. Both EGFR and HLA-E are also expressed in the large majority of tumors, making them attractive if risky targets from the vantage point of broad application across cancer indications.
LOH offers the means by which an engineered cell can discriminate between tumor and normal tissue in selected patients. High-sensitivity detection methods show that subclonal somatic variation can be distinguished from clonal variation: This is seen most clearly by analysis of somatic SNPs. Deep sequencing coupled with evolutionary modeling has confirmed that somatic variation occurs in the trunk, branches and leaves of the phylogenetic tree of tumors.21 In general, the frequency distribution of variants contains 2 modes22: (1) a high-frequency mode centered at a cellular multiplicity of 1.0 (i.e., present in all tumor cells) and (2) a lower-frequency mode visible at higher sequencing depths. As a specific example, subclonal LOH at the HLA locus is detectable in NSCLC with high-sensitivity methods, and can be distinguished from clonal LOH by comparison of metastatic lesions vs. primary tumor sites.23 This approach reveals cases with subclonal LOH detected by discordant results between metastatic and primary sites (n = 11/37 = 0.3), but also cases with concordance, suggestive of clonal LOH (6/37 = 0.16; n = 516). Of note, only one case was identified with LOH at a primary site but absent in a brain metastatic site, suggestive of subclonal outgrowth of an early truncal event that lacked LOH. Also, note that this clonal LOH frequency is similar to the value in the TCGA GISTIC database for lung adenocarcinoma (0.12) that we use for our estimates. Thus, preferential analysis of primary sites may be beneficial (if not required) for clinical detection of LOH, and a limitation of Tmod therapy may arise through the rare escape of non-LOH truncal tumor cells in the setting of subclonal LOH. However, such truncal cells may be subject to surgical resection (if they are present in a heterogeneous primary site) or immune surveillance during checkpoint therapy (due to retained presentation of neo-antigens), enabling broader opportunities for Tmod approaches through careful clinical analysis of patient-specific LOH subclonal architecture and the integration of multiple treatment modalities.
Tmod has properties that suggest activity against tumors while sparing normal tissues. The pharmacology of EGFR and HLA-E Tmod cells, combined with the known expression patterns of EGFR, HLA-E and HLA-A, support the view that the blocker provides the necessary inhibitory stimulus to overcome activation in normal tissues. The properties of the murine-homolog-directed Tmod system in mice provide additional supporting evidence and suggest that the selectivity window is an important factor. Though NSG mice lack functional lymphocytes, the H-2Kd/Db Tmod cells were apparently activated at a low but increasing level over time, perhaps by myeloid cells present in large numbers in NSG mouse blood. Such activation was not detected with the mEGFR/H-2Db Tmod cells.
How does Tmod achieve selectivity? Inhibitory receptors like LIR-1 contain ITIM/ITSM motifs that are key functional elements,24 though with LIR-1 specifically there is some controversy about the role of these domains in certain inhibitory functions.25,26 PD-1, perhaps the most widely studied receptor of this type, may exert all its checkpoint activity though its ITIM/ITSM by affecting disposition of phosphatases and other signaling molecules (see for review27). We have shown that the LIR-1 blocker described here requires at least a subset of its 4 ITIMs to function.8 Others have shown that the LIR-1 ITIMs are phosphorylated and bind SHP1.28 However, the mechanism of LIR-1 expressed exogenously in Tmod cells appears to involve an additional layer of control: ligand-dependent modulation of the activator level on the cell surface. This feature may provide further robustness to the blocking mechanism, buffering the system against different levels of activator and blocker input. For example, while the Tmod cells roam through the body awash in normal cells, they may be especially resistant to on-target, off-tumor activation in part because the activator levels are low. When the Tmod cells encounter a tumor cell that is EGFR+A∗02-, the system turns on, rebalances its activator expression, and kills the tumor cell.
As this comparatively new therapeutic modality evolves, it may become more broadly useful and cost effective. We have shown that the Tmod system is modular and can be readily extended to other TAA activator and HLA class I blocker antigens.10,11 A further opportunity to broaden the utility is to combine the Tmod construct with an allogeneic off-the-shelf cell platform. PD-1 and CTLA-4 checkpoint inhibitory receptors can control TCR signaling in normal and artificial settings.29,30 Our results show that the EGFR Tmod construct controls allogeneic TCR activation as effectively as a TRAC gene knockout. This property of the blocker provides an opportunity to engineer Tmod off-the-shelf products without the need for further gene editing. In addition, shRNA-mediated reduction of HLA class I expression should ameliorate HvG reactions because HvG response is highly sensitive to MHC class I level and to numbers of allo-reactive T cells.31,32 Our data suggest that the reduction in HLA class I achieved by inclusion of a B2M-targeted shRNA module in the Tmod construct is sufficient to eliminate detectable allogeneic response in vitro, a major determinant of T cell persistence. Whether such measures will provide sufficient mitigation in patients is currently unclear. Several efforts to test persistence and durability of gene-edited T cells that lack B2M are currently under way in the clinic (NCT05643742, NCT04649112). Current data suggest a few weeks of persistence, not substantially beyond the duration achieved by lymphodepletion regimens alone. As these and other translational studies play out, the extent of measures needed for sufficient T cell survival will be determined.
Limitations of the study
The Tmod approach has certain limitations. For example, the system is not fail-safe with respect to blocking; high ratios of activator:blocker antigen can override the blocker.33 In addition, the blocker quiets tonic signaling in a ligand-dependent manner which may partly explain its slight anti-inflammatory effect on T cells. Finally, protection from alloreactivity comes with a potential cost of stimulation of host NK-cell cytotoxicity. Previous studies on human graft rejection and NK-cell mechanism have pointed to HLA class I antigens as important negative regulators of NK cell cytotoxicity. This body of work has led to fears that reduction of HLA class I in grafted T cells may stimulate rejection by host NK cells. However, recent work suggests this risk may have been overestimated. First, rigorous mouse studies using inducible B2M knockout strains demonstrate that the NK cell response to class-I-negative cells arises only when the grafted cells comprise <10% of the total lymphocyte population.34 For the large majority of cell therapies currently approved or under investigation, the number of infused T cells far exceeds 10% of the total blood lymphocyte percentage, especially when conditioning regimens are employed to reduce host lymphocyte numbers. Second, a recent clinical study of B2M− CD19 CAR-Ts in cancer patients is consistent with persistence of the grafted cells for at least one month, a time period sufficient to mediate complete responses in the patients.35 Thus, we believe we have struck the balance between risks of allo-reaction and NK-cell activation. Together, these results suggest that the Tmod system may provide opportunities for a platform to safely utilize cancer targets.
STAR★Methods
Key resources table
| REAGENT or RESOURCE | SOURCE | IDENTIFIER |
|---|---|---|
| Antibodies | ||
| PE anti-human IgG Fc antibody | BioLegend | Cat# 410708 |
| APC anti-human IgG Fc Antibody | BioLegend | Cat# 410712 |
| APC anti-human HLA-A,B,C Antibody | BioLegend | Cat# 311410 |
| PE anti-human HLA-A,B,C Antibody | BioLegend | Cat# 311406 |
| PE anti-human EGFR Antibody | BioLegend | Cat# 352904 |
| APC anti-human EGFR Antibody | BioLegend | Cat# 352906 |
| EGFR Antibody (R-1) | Santa Cruz Biotechnology | Cat# sc-101 |
| Purified anti-human HLA-A2 Antibody | BioLegend | Cat# 343302 |
| APC anti-human CD340 (erbB2/HER-2) Antibody | BioLegend | Cat# 324408 |
| MHC Class I (H-2Kd) Monoclonal Antibody (SF1-1.1.1), PE | eBioscience | Cat# 12-5957-82 |
| MHC Class I (H-2Db) Monoclonal Antibody (28-14-8), PE | eBioscience | Cat# 12-5999-82 |
| Mouse EGFR Antibody | R&D Systems | Cat# AF1280 |
| Purified anti-human CD340 (erbB2/HER-2) Antibody | BioLegend | Cat# 399402 |
| H-2Db Monoclonal Antibody | Invitrogen | Cat# MA5-17992 |
| PE anti-mouse TCR β chain Antibody | BioLegend | Cat# 109208 |
| PE anti-human TCR Vβ13.1 Antibody | BioLegend | Cat# 362410 |
| APC anti-mouse H-2D b Antibody | BioLegend | Cat# 111514 |
| PE anti-human β2-microglobulin Antibody | BioLegend | Cat# 316306 |
| Purified anti-human HLA-E Antibody | BioLegend | Cat# 342602 |
| APC anti-human CD25 Antibody | BioLegend | Cat# 302610 |
| PE anti-human CD56 | BioLegend | Cat# 981202 |
| FITC anti-mouse CD45 Antibody | BioLegend | Cat# 103108 |
| Brilliant Violet 421™ anti-human CD3 Antibody | BioLegend | Cat# 344834 |
| PerCP/Cyanine5.5 anti-human CD4 Antibody | BioLegend | Cat# 317428 |
| Brilliant Violet 510™ anti-human CD8a Antibody | BioLegend | Cat# 301048 |
| Bacterial and virus strains | ||
| TOP10 chemically competent E.coli | Invitrogen | Cat# C409605 |
| Biological samples | ||
| Human AB serum | Gemini Bio-Products | Cat# 100-512 |
| Human Peripheral Blood Leukopak, Fresh | AllCells | LP, FR, 10B |
| Fresh HemaPrime Leukopak | HemaCare | PB001F-1 |
| Normal Human Epidermal Keratinocytes | PromoCell | C-12003 |
| Chemicals, peptides, and recombinant proteins | ||
| X-VIVO15 | Lonza | Cat# 04-0418Q |
| Recombinant Human EGFR Fc Chimera Protein | R&D Systems | Cat# 344-ER-050 |
| Biotinylated recombinant HLA-A∗02 | In house | N/A |
| iotinylated Human Her2 / ErbB2 Protein | Acro Biosystems | Cat# HE2-H82E2-200ug |
| Recombinant Mouse EGFR Fc Chimera Protein | R&D Systems | Cat# 1280-ER |
| H-2Kd Tetramer-PE | MBL International Corporation | Cat# TB-M553-1 |
| H-2Db Tetramer-PE | MBL International Corporation | Cat# TS-M546-1 |
| Biotinylated Human HLA-E | Acro Biosystems | Cat# HL0-H82E7-25ug |
| Recombinant Protein L, Biotinylated | Thermo Scientific | Cat# 29997 |
| APC Streptavidin | BioLegend | Cat# 405207 |
| PE Streptavidin | BioLegend | Cat# 405204 |
| Brilliant Violet 421™ Streptavidin | BioLegend | Cat# 405225 |
| Mouse EGF R Protein, His Tag | Acro Biosystems | Cat# EGR-M5224-50ug |
| Human recombinant IL-2 | StemCell Technologies | Cat# 78036 |
| Mitomycin C | Thermo scientific chemicals | Cat# AAJ67460XF |
| Human recombinant IL-15 | StemCell Technologies | Cat# 78031 |
| Cas9 2NLS Nuclease | Synthego | N/A |
| poly-adenylation reaction buffer | NEB | Cat# M0276S |
| poly-adenylation enzyme | NEB | Cat# M0276S |
| Critical commercial assays | ||
| Amaxa 4D nucleofection system | Lonza | Cat# AAF-1003X |
| QIFIKIT | Agilent | Cat# K007811-8 |
| T7 ARCA mRNA kit | New England Biolabs | Cat# E2060S |
| TransAct kit | Miltenyi Biotec | Cat# 130-111-160 |
| CellTracker™ Green CMFDA Dye | Invitrogen | Cat# C7025 |
| Cytometric Bead Array (CBA) Human IFN-γ Flex Se | BD Biosciences | Cat# 558269 |
| CD3 microbeads, human | Miltenyi Biotec | Cat# 130-097-043 |
| PE microbeads | Miltenyi Biotec | Cat# 130-048-801 |
| CD4 microbeads, human | Miltenyi Biotec | Cat# 130-097-048 |
| NK Cell Isolation Kit, human | Miltenyi Biotec | Cat# 130-092-657 |
| Apotracker™ Green | BioLegend | Cat# 427403 |
| LIVE/DEAD™ Fixable Near-IR Dead Cell Stain Kit | Thermo Fisher | Cat# L34975 |
| Monarch RNA cleanup kit | NEB | Cat# T2040L |
| DNeasy Blood & Tissue Kit | Qiagen | Cat# 69582 |
| Mouse ACTB (Actin, Beta) Endogenous Control | Applied Biosystems | Cat# 4352933E |
| Human RPS18 TaqMan assay | Applied Biosystems | Cat# 4331182 |
| Cytometric Bead Array (CBA) Human Th1/Th2/Th17 CBA Kit | BD Biosciences | Cat# 560484 |
| Experimental models: Cell lines | ||
| HeLa | ATCC | CCL-2 |
| A375 | ATCC | CRL-1619 |
| NCI-H508 | ATCC | CCL-253 |
| MS751 | ATCC | HTB-34 |
| HuCCT1 | Riken BRC | RCB1960 |
| NFAT Luciferase Reporter Jurkat Cell Line | BPS Bioscience | Cat#60621 |
| Experimental models: Organisms/strains | ||
| NOD.Cg-PrkdcscidIl2rgtm1Wjl/SzJ | The Jackson Laboratory | Strain#005557 |
| Oligonucleotides | ||
| sgRNA targeting sequence: HLA-A #1 CCUUCACAUUCCGUGUCUCC |
Synthego | HLA-A_1 |
| sgRNA targeting sequence: HLA-A #2 ACAGCGACGCCGCGAGCCAG |
Synthego | HLA-A_2 |
| sgRNA targeting sequence: HLA-A#3 UUCACAUCCGUGUCCCGGCC |
Synthego | HLA-A_3 |
| sgRNA targeting sequence: EGFR#1 CUCUUCUUAGACCAUCCAGG |
Synthego | EGFR_1 |
| sgRNA targeting sequence: EGFR#2 CACAGUGGAGCGAAUUCCUU |
Synthego | EGFR_2 |
| sgRNA targeting sequence: EGFR#3 AUAGUUAGAUAAGACUGCUA |
Synthego | EGFR_3 |
| sgRNA targeting sequence: B2M AGGGUAGGAGAGACUCACGC |
IDT | B2M_1 |
| sgRNA targeting sequence: HLA-E GAGAUAAUCCUUGCCGUCGUAGG |
IDT | HLA-E_1 |
| sgRNA targeting sequence: HLA-E CGGCACCAUCCUCGGACUCGCGG |
IDT | HLA-E_2 |
| Recombinant DNA | ||
| CAR and Tmod constructs | This study | N/A |
| Software and algorithms | ||
| FlowJo software | FlowJo | https://www.flowjo.com/ |
| GraphPad Prsim | GraphPad | https://www.graphpad.com |
| IncuCyte S3 Live-Cell Analysis System | Sartorius | https://www.sartorius.com |
| MetaXpress Analysis software | Molecular Devices Corporation | https://moleculardevices.com/ |
| Living Image Software | PerkinElmer | https://www.perkinelmer.com/ |
| Other | ||
| G-Rex plate | Wilson Wolf | Cat# 80192M |
| LS column | Miltenyi Biotec | Cat# 130-122-729 |
Resource availability
Lead contact
Further information and request for resources and reagents should be directed to and will be fulfilled by the lead contact, Dr. Alexander Kamb (akamb@a2biotherapeutics.com).
Materials availability
Plasmids and cell lines generated in this study are available to non-commercial entities upon request.
Data and code availability
-
•
All data reported in this paper will be shared by the lead contact upon request.
-
•
This paper does not report original code.
-
•
Any additional information required to reanalyze the data reported in this paper is available from the lead contact upon request.
Experimental model and study participant details
Animals
All animal studies were conducted by Charles River Laboratories in accordance with animal procedures approved by the Institutional Animal Care and Use Committee. Female NSG (NOD.Cg-PrkdcscidIl2rgtm1Wjl/SzJ) mice that are six weeks old were purchased from The Jackson Labs (JAX stock No. 005557). Animals were acclimated to the housing environment (the animal holding room) for at least 3 days prior to the initiation of the study. During the acclimation period, the general health of the animals was monitored. Animals that appeared normal and did not exhibit signs of poor health were be enrolled in the study and randomized prior to dosing. Animals were group-housed at a maximum of five per cage under 12/12 h normal light-dark cycle with ad libitum access to food and water.
Human PBMCs
Peripheral blood mononuclear cells (PBMCs) were purified from Leukopaks purchased from AllCells or HemaCare. Donor gender, age, and HLA-A∗02 status can be found on Table S9.
Method details
Cell line generation and culturing
Unmodified HeLa, A375, H508, and MS751 cells were purchased from ATCC and cultured per vendor instructions. HuCCT1 cell was purchased from Riken BRC and cultured per vendor instructions. To generate HLA-A∗02+ variants, lentivirus encoding HLA-A∗02 was transduced and sorted for HLA-A∗02-expressing cells on FACS using HLA-A∗02 antibody (clone BB7.2; BioLegend). To generate EGFR-, HLA-E-, or HLA-A∗02- variants, genetic modification using CRISPR-Cas9 was performed. A mix of three guide RNAs targeting EGFR or HLA-A were purchased from Synthego. A mix of two guide RNAs targeting HLA-E were purchased from IDT. Guide RNAs and Streptococcus pyogenes HiFi Cas9 protein (IDT) were mixed at 1:3 molar ratio to form ribonucleoprotein complex then transfected into desired cell lines using 4D-Nucleofector (Lonza). Knockout cells were enriched by FACS using EGFR antibody (clone AY13; BioLegend) or HLA-A∗02 antibody (clone BB7.2; BioLegend). To generate mEGFR(+) or H-2Db+ variant MS751 cells, endogenous hEGFR was first knocked out to eliminate any cross reactivity with mEGFR activator. Then, a lentivirus encoding a single transcript with the mEGFR and H-2Db genes was transduced and enriched using mEGFR antibody (polyclonal; R&D Systems) and H-2Db antibody (cloneKH95; eBioscience). To generate H-2Kd+ or H-2Db+ variant MS751 cells, lentiviruses encoding H-2Kd and H-2Db genes were transduced and enriched using H-2Kd (Clones SF1-1.1.1, 28-14-8, BioLegend) and H-2Db antibodies (cloneKH95; eBioscience). To generate GFP+, RFP+, or luciferase+ variants, cells were transduced with lentivirus encoding GFP, RFP, firefly-luciferase, or renilla-luciferase (Biosettia). Jurkat cells with the NFAT-luciferase reporter system were purchased from BPS Bioscience and maintained in RPMI supplemented with 10% heat-inactivated (HIA) FBS. Normal human epidermal keratinocytes (NHEK) were purchased from PromoCell and cultured in keratinocyte growth medium 3 (PromoCell) according to vendor instructions.
Molecular cloning
All CAR and Tmod constructs were cloned by combining gene segments using Golden Gate cloning and inserted downstream of a human EF1α promoter contained in a lentiviral expression plasmid. Activators were created by fusing scFv ligand binding domains (LBDs) to the CD8α hinge, CD28 transmembrane (TM), and CD28, 4-1BB, and CD3ζ intracellular domains (ICDs). Blockers were generated by fusing scFv LBDs to the hinge, TM, and ICD domains of LIR-1.
Flow cytometry
Staining for analysis by flow cytometry was done in phosphate-buffered saline with 1% bovine serum albumin at room temperature for 30 minutes and read on a FACS Canto II flow cytometer (BD Biosciences). All antibodies were purchased from BioLegend unless otherwise stated. EGFR activators were stained with recombinant hEGFR-Fc chimera protein (R&D Systems) followed by an anti-human IgG Fc antibody (clone M1310G05). HLA-A∗02 blockers were stained with biotinylated recombinant HLA-A∗02 tetramerized with streptavidin. HER2 CAR was stained with biotinylated recombinant HER2 (Acro Biosystems) followed by streptavidin. mEGFR CAR was stained with recombinant mEGFR-Fc chimera protein (R&D Systems) followed by an anti-human IgG Fc antibody (clone M1310G05). H-2Kd activator and H-2Db blocker were stained with recombinant H-2Kd and H-2Db tetramers, respectively (MBL International Corporation). HLA-E activator was stained with biotinylated recombinant HLA-E (Acro Biosystems) tetramerized with streptavidin. HLA class I was stained with anti-HLA-A,B,C antibody (clone W6/32). B2M was stained with anti-B2M antibody (clone 2M2). Biotinylated protein L (Thermo Scientific) followed by streptavidin staining was used in some instances to stain for CAR or Tmod receptors. NY-ESO-1 TCR was stained with anti-TCR-Vβ13.1-chain antibody (clone H131) and KRAS G12D TCR was stained with anti-mouse-TCRβ antibody (clone H57-597). On the target side, anti-hEGFR (clone AY13), anti-HLA-A∗02 (clone BB7.2), anti-human HER2 (clone 24D2), anti-H-2Kd (clone SF1-1.1.1, Invitrogen), anti-H-2Db (clone 28-14-8, Invitrogen), and anti-mEGFR (polyclonal; R&D Systems) antibodies were used for flow cytometry analysis. For analysis of blood samples from in vivo studies, see details in the mouse in vivo study section.
Surface quantification of antigens
Antigen quantification on cell surfaces was done using QIFIKIT (K007811-8; Agilent) following the manufacturer’s protocol. Anti-hEGFR (clone R-1; Santa Cruz Biotechnology), anti-HLA-A∗02 (clone BB7.2), anti-HER2 (clone 24D2), anti-mEGFR (polyclonal; R&D Systems), and anti-H-2Db (clone B22-249.R1; Invitrogen) antibodies were used.
mRNA in vitro transcription
For messenger RNA (mRNA) preparation, PCR was used to generate the DNA template for in vitro synthesis mRNA. Briefly, T7 promoter was introduced via N-terminal primer and common overhang regions were used for both N-terminal and C-terminal primers. The PCR product was used as a template for in vitro transcription (IVT) using the T7 ARCA mRNA kit (New England Biolabs, E2060S). The IVT reaction comprised 1× ARCA/NTP mix, 1.25 mM Ψ-UTP (TriLink), 25 μg PCR product template, and 1× T7 RNA polymerase. The IVT reaction was incubated at 37°C for 2 hours, then 2 μL of DNase I (New England Biolabs, M0303S) was added to each reaction and incubated at 37°C for 15 min. To the IVT reaction, 65 μL water, 10 μL 10× poly-adenylation reaction buffer (NEB M0276S), and 5 μL of poly-adenylation enzyme (NEB M0276S) were added to a total volume of ∼100 μL. The reaction was incubated at 37°C for 30 min. The resulting product was cleaned using the Monarch RNA cleanup kit (NEB T2040L) according to the manufacturer’s protocol.
mEGFR binder generation using mammalian display
HuTARG™ primary libraries were obtained from Innovative Targeting Solutions Inc. An in vitro V(D)J repertoire with >1 billion diversity was generated by the expression of RAG-1 and TdT in the host cells as described in Patent No: US 8,012,714 B2.36 For mouse EGFR binder generation, human IgG Fc-tagged mEGFR protein (R&D Systems) and His-tagged mEGFR protein (Acro Biosystems) were used in several alternating rounds for on-target enrichment of the HuTARG library on FACS. For off-target control, unrelated recombinant RANK protein tagged with Fc (R&D Systems) was used. In the final round of FACS, on-target and off-target binding cells were collected, and RNA was reverse transcribed into cDNA. Fragments containing the CDRs were amplified using PCR and sequenced by next-generation sequencing (NGS). Binders of interest were selected by comparing the input and output NGS counts. Selected binders cloned into a CAR construct and function were screened in Jurkat cells with mEGFR mRNA titrated into target cells. Target-specific binders from the primary libraries were used to generate optimization libraries to further improve on-target selectivity.
Antibody and hybridoma sequencing for the HLA-E and H-2Db binders
Anti-HLA-E (clone 3D12) was sequenced using Rapid Novor’s antibody sequencing service which utilizes a Thermo-Fisher Orbitrap Fusion mass spectrometer. The binders for H-2Kd and H-2Db was identified by sequencing the SF1-1.1.10 (HB-159) and 28-14-8S (HB-27) hybridomas purchased from ATCC. A hybridoma antibody sequencing service (GenScript) was used.
Activator and blocker sensitivity determination
To generate target cells with varying amounts of antigen expression, antigen mRNA was titrated into antigen(-) HeLa using the Amaxa 4D nucleofection system (Lonza). Flow cytometry and QIFIKIT were used to quantify antigen density on the surface of the cell, as described above. For Jurkat assays, Jurkat cells with NFAT-luciferase reporter were transfected with CAR or Tmod constructs using the Amaxa 4D nucleofection system. Transfected Jurkat cells were then co-cultured with target cells for 6 hrs at 37°C, 5% CO2 and luminescence read on a plate reader (Tecan). For primary T assays, CAR- or Tmod-expressing T cells were co-cultured with target cells and monitored on the IncuCyte S3 (Sartorious) with 10x objective for up to 48 hrs. Specific killing (%) was determined as described below in primary T cell in vitro cytotoxicity assays. EC50 and IC50 values in Jurkat and primary T cells were determined by curve-fitting using GraphPad Prism.
Primary T cell generation and characterization
Peripheral blood mononuclear cells (PBMCs) were purified from Leukopaks purchased from AllCells or HemaCare. PMBCs were then activated with TransAct (Miltenyi) following the manufacturer’s instructions and transduced with CAR- or Tmod-encoding lentivirus the next day at a multiplicity (MOI) of 10-20. Transduced cells were cultured in G-Rex plate (Wilson Wolf) with X-vivo media (Lonza) supplemented with 1% human serum (GeminiBio). Fresh IL-2 (300 IU/ml) was added every 2 days with media change during culturing. CAR and Tmod expression of transduced T cells was measured by flow cytometry as described above. Enrichment of the transduced population was performed by staining CAR or Tmod receptors with biotinylated protein L (Thermo Fisher) followed by PE-conjugated streptavidin. Anti-PE microbeads (Miltenyi) and LS columns (Miltenyi) were used to collect the receptor(+) fraction, following manufacturer’s instructions. For in vivo studies, T cells were generated using G-Rex 10 (Wilson Wolf) to accommodate the larger quantity of cells.
CRISPR knockout of B2M in primary T cells
24-48 hours post-transduction primary T cells were transfected with CRISPR-Cas9:sgRNA complexes. Briefly, cells were collected and washes with PBS before resuspending in supplemented P3 nucleofection buffer (Lonza). A quantity of 20 pmol of Cas9 (Synthego) was combined with 130 pmol B2M-targeting sgRNA (IDT) and incubated in P3 nucleofection buffer before addition to cells. Twenty microliters of the cell and ribonucleoprotein (RNP) mixture was transferred to a 16-well Nucleocuvette Strip and electroporated with the 4D nucleofector using the stimulated T cell program (EO-115). The cells were recovered and expanded in X-vivo media (Lonza) supplemented with 1% human serum (GeminiBio) and IL-2 (300 IU/ml). B2M KO was checked by flow cytometry after staining with anti-HLA-I antibody (W6/32).
Primary T cell in vitro cytotoxicity assays
On day 1 of the T cell cytotoxicity assay, the target cells were seeded in quadruplicate wells of a 384-well imaging plate at a density of 2000 cells per well in 30 μL X-vivo media (Lonza) supplemented with 1% human serum (GeminiBio) using the Opentron OT-2 liquid handling robot. For mixed target culture assays, target cells were pre-mixed at the desired ratios prior to seeding. Plates were incubated at 37°C, 5% CO2 overnight to allow the cells to adhere. On day 2 of the assay, T cells were added to the target cells at desired E:T ratios. For E:T titration assays, T cells were serially diluted 3-fold and plated using the Opentron OT-2 in 30 μL X-vivo media supplemented with 1% human serum. Cells were cocultured at 37°C, 5% CO2 for 48 hours and images were taken every 4 hours either on IncuCyte S3 live-cell analysis system (Satorius) or ImageXpress Micro Confocal imager with a 4x objective (Molecular Devices Corporation). Quantification of target cell area (ie, GFP+ or RFP+ total area per image) was done using either IncuCyte S3 or MetaXpress analysis software. Plating variability was accounted for by normalizing to area at time=0 per well. Killing was then quantified as the difference in area between CAR or Tmod T cell wells vs. corresponding untransduced T cell wells, normalized to the untransduced T cell well (% Killing = (Auntransduced – ACAR or Tmod)/Auntransduced).
Mixed lymphocyte reaction (MLR)
The HLA-A∗02- responder T cells were labeled with CMFDA (Invitrogen) at 1μM for 30 minutes at 37°C, 5% CO2.. CD3- fractions of an unrelated HLA-A∗02+ PBMC were used as stimulator. Anti-CD3 microbeads (Miltenyi) and LS columns (Miltenyi) were used following manufacturer’s instructions to separate CD3- fractions, or the antigen-presenting cells (APCs). Stimulators were treated with mitomycin C (Thermo Scientific Chemicals) at 25μg/ml for 30 minutes at 37°C, 5% CO2. Responder and stimulator cells were then co-cultured in X-vivo with 1% human serum at a ratio of 1:1 in a 96-well U-bottom plate for 5 days in 37°C, 5% CO2. Thereafter, supernatant was collected for IFNγ analysis using the IFNγ flex set of the Cytokine Cytometric Bead Array Kit (CBA) from BD Biosciences, according to manufacturer’s instructions. Cells were collected and stained with CD25 antibody (clone BC96). CMFDA signal and CD25-stain were analyzed by flow cytometry.
HvG assays
For T cell HvG assays, CD8+ T cells from HLA-A∗02+ donors were used as effectors and Tmod T cells from HLA-A∗02- donors were used as targets. 10 days after activation of PBMCs by TransAct (Miltenyi), Anti-CD4 microbeads (Milteyi) and LS columns (Miltenyi) were used following manufacturer’s instructions to separate CD8+ cells (negative fraction) from an HLA-A∗02+ donor. The CD8+ T cells were then co-cultured for 5 days at a ratio of 5:1 with CD3- APCs collected from the HLA-A∗02- donor PBMCs to “prime” against allo-antigens. Then, the primed CD8+ T cells were co-cultured with Tmod cells generated from the same target donor at a 5:1 ratio in a 96-well U-bottom plate. Cells were removed 7 hrs, 24 hrs, and 48 hrs after the co-culture and stained with HLA-A∗02 antibody (clone BB7.2) to distinguish between effector and target cells. An apoptosis marker (phosphatidyl serine) on the target cells was measured by staining with ApoTracker (BioLegend).
For NK cell HvG assays, NK cells from an HLA-A∗02+ donor were used as effectors and Tmod T cells from HLA-A∗02- donor were used as targets. NK cells were purified from HLA-A∗02+ PBMCs using NK Cell Isolation Kit (Miltenyi) and LS columns (Miltenyi) per manufacturer’s instructions. NK cells were cultured and expanded in NK MACS media (Miltenyi) with fresh IL-2 and IL-15 every 2 days. After 2 weeks in culture, NK cells were co-cultured with Tmod cells at a ratio of 1:32 and 1:8 (NK:T) for 2 days. Cells were then collected and stained with CD56 antibody (clone 5.1H11) and Live/Dead™ Dead Cell Stain Kit (Thermo Fisher). Counting beads were added when reading by flow cytometry to calculate absolute numbers of dead target cells.
Mouse in vivo studies
In vivo experiments were conducted by Charles Rivers Laboratories under Institutional Animal Care and Use Committee- approved protocols. The identities of target cells and T cell groups were blinded to Charles Rivers Laboratories. For all in vivo studies, female NSG mice (Jackson Labs) 5-6 weeks old were acclimated to the housing environment prior to the initiation of the study.
For the dual-flank xenograft model, animals were implanted subcutaneously with EGFR+HER2+HLA-A∗02- luciferase+ “tumor” grafts on the left flank and EGFR+HER2+HLA-A∗02+ luciferase+ “normal” grafts on the right flank. When xenografts reached an average of 100-160 mm3 (V=L×W×W/2), animals were randomized into groups and T cells were administered via the tail vein (i.v.) or directly to the tumor graft (i.t.). Graft measurements by calipers were performed 3 times per week and bioluminescence imagining (BLI) 1-2 times per week for the duration of the study.
For the peritoneal cavity xenograft model, animals were implanted intraperitoneally (i.p.) with either the “tumor” or the “normal” MS751 cells. After 11 days, T cells were administered via i.p. Graft measurements by BLI were measured 2 times per week for the duration of the study.
For the biodistribution study, animals were implanted subcutaneously with MS751 “tumor” grafts on the right flank. After 11 days, T cells were administered i.v. 3 days after T cell injection, animals were sacrificed, and whole-body perfusion was performed before collecting tissue samples. Genomic DNA (gDNA) from each collected tissue was extracted using DNeasy Blood & Tissue Kit (Qiagen). Quantitative PCR (qPCR) was performed on extracted gDNA using mouse β-actin (Applied Biosystems) and human RPS18 (Thermo Fisher) probe sets. Known amounts of mouse and human gDNA was used to generate standard curves for each probe set and Cq values were converted to ng mouse or human gDNA using the standard curves.
For surrogate Tmod studies using mouse antigen target molecules, animals were randomized into groups based on body weight and T cells were injected via the tail vein. Body weight and clinical parameters were monitored every day for 10 days after T cell inoculation and then 3x per week thereafter until the duration of the study. Blood and serum were collected every 10 days starting at 3 days after the T cell injection. Cells were stained post RBC lysis with anti-mouse CD45 (clone 30-F11), anti-human CD3 (clone SK7), anti-human CD4 (clone OKT4), and anti-human CD8α (clone RPA-T8) antibodies. Human cytokines in serum samples were measured using the human Th1/Th2/Th17 CBA Kit (BD Biosciences). For the repeat of the EGFR surrogate Tmod study, luciferase+ MS751 cells with overexpressed mEGFR were inoculated on the right flank and T cells were administered i.v. 11 days afterward. BLI was measured 2 times per week.
Quantification and statistical analysis
All in vitro data are expressed as mean ± standard deviation (SD) and in vivo data are expressed as mean ± standard error of the mean (SEM). Comparison of 2 groups were analyzed by a paired, 2-tailed Student’s t-test using GraphPad Prism. P < 0.05 was used as a definition of statistical significance. For mRNA titration and E:T titration studies, curves were fit by a 4-parameter non-linear regression analysis. EC50 and IC50 values were calculated directly from the curves. ET50 values were interpolated from the curves.
Acknowledgments
We thank B. DiAndreth and M.E. Daris for identifying and providing shRNA and gRNA; X. Wang for designing shRNA promoters; M. Sandberg and M.L. Wu for help with cell sorting; J. Wang (Explora Biolabs) for supervising in vivo experiments; C. Li for key support with automation and imaging; M. Kreke and D. Nampe for helpful advice around T cell scale-up; and A. Hamburger, A. Mardiros, and J. Welch for comments on the manuscript.
Author contributions
Conceptualization, A.K., H.X., J.O., and J.H.; Methodology, J.O., J.H., C.K., K.C.R., D.M., and Y.A.; Investigation, J.O., C.K., J.H., K.C.R., D.M., Y.A., S.M., J.C., E.M., A.Z., and K.M.C.; Writing – original draft, A.K.; Writing – review and editing, J.O., H.X., and A.K; Visualization, J.O., D.M., J.H., Y.A., and H.X.; Supervision, J.O., L.M.W., H.X., and A.K.; Project administration, J.O., L.M.W., and H.X.; Funding acquisition, A.K.
Declaration of interests
All authors are/were employees and shareholders of A2 Biotherapeutics, Inc. A.K. is a board member of A2 Biotherapeutics.
J.O., H.X., and A.K. are inventors of PCT/US2021/046733 (published as WO 2022/040444); A.K. is an inventor of PCT/US2020/064607 (published as WO 2021/119489) and US Patent No. 11,254,726.
Published: May 7, 2024
Footnotes
Supplemental information can be found online at https://doi.org/10.1016/j.isci.2024.109913.
Contributor Information
Julyun Oh, Email: joh@a2biotherapeutics.com.
Alexander Kamb, Email: akamb@a2biotherapeutics.com.
Supplemental information
References
- 1.Ehrlich P., Apolant H. Referat über die Genese des Carcinoms. Verh. Dtsch. Pathol. Ges. 1908;12:13–32. [Google Scholar]
- 2.Gold P., Freedman S.O. Specific carcinoembryonic antigens of the human digestive system. J. Exp. Med. 1965;122:467–481. doi: 10.1084/jem.122.3.467. [DOI] [PMC free article] [PubMed] [Google Scholar]
- 3.Sparano J.A. Cardiac toxicity of trastuzumab (Herceptin): implications for the design of adjuvant trials. Semin. Oncol. 2001;28:20–27. doi: 10.1016/s0093-7754(01)90189-7. [DOI] [PubMed] [Google Scholar]
- 4.Macdonald J.B., Macdonald B., Golitz L.E., LoRusso P., Sekulic A. Cutaneous adverse effects of targeted therapies: Part I: Inhibitors of the cellular membrane. J. Am. Acad. Dermatol. 2015;72:203–220. doi: 10.1016/j.jaad.2014.07.032. [DOI] [PubMed] [Google Scholar]
- 5.Morgan R.A., Yang J.C., Kitano M., Dudley M.E., Laurencot C.M., Rosenberg S.A. Case report of a serious adverse event following the administration of T cells transduced with a chimeric antigen receptor recognizing ERBB2. Mol. Ther. 2010;18:843–851. doi: 10.1038/mt.2010.24. [DOI] [PMC free article] [PubMed] [Google Scholar]
- 6.Dannenfelser R., Allen G.M., VanderSluis B., Koegel A.K., Levinson S., Stark S.R., Yao V., Tadych A., Troyanskaya O.G., Lim W.A. Discriminatory Power of Combinatorial Antigen Recognition in Cancer T Cell Therapies. Cell Syst. 2020;11:215–228.e5. doi: 10.1016/j.cels.2020.08.002. [DOI] [PMC free article] [PubMed] [Google Scholar]
- 7.DiAndreth B., Hamburger A.E., Xu H., Kamb A. The Tmod cellular logic gate as a solution for tumor-selective immunotherapy. Clin. Immunol. 2022;241 doi: 10.1016/j.clim.2022.109030. [DOI] [PubMed] [Google Scholar]
- 8.Hamburger A.E., DiAndreth B., Cui J., Daris M.E., Munguia M.L., Deshmukh K., Mock J.Y., Asuelime G.E., Lim E.D., Kreke M.R., et al. Engineered T cells directed at tumors with defined allelic loss. Mol. Immunol. 2020;128:298–310. doi: 10.1016/j.molimm.2020.09.012. [DOI] [PubMed] [Google Scholar]
- 9.Bassan D., Weinberger L., Yi J., Kim T., Weist M.R., Adams G.B., Foord O., Chaim N., Tabak S., Bujanover N., et al. HER2 and HLA-A∗02 dual CAR-T cells utilize LOH in a NOT logic gate to address on-target off-tumor toxicity. J. Immunother. Cancer. 2023;11 doi: 10.1136/jitc-2023-007426. [DOI] [PMC free article] [PubMed] [Google Scholar]
- 10.Sandberg M.L., Wang X., Martin A.D., Nampe D.P., Gabrelow G.B., Li C.Z., McElvain M.E., Lee W.H., Shafaattalab S., Martire S., et al. A carcinoembryonic antigen-specific cell therapy selectively targets tumor cells with HLA loss of heterozygosity in vitro and in vivo. Sci. Transl. Med. 2022;14 doi: 10.1126/scitranslmed.abm0306. [DOI] [PubMed] [Google Scholar]
- 11.Tokatlian T., Asuelime G.E., Mock J.Y., DiAndreth B., Sharma S., Toledo Warshaviak D., Daris M.E., Bolanos K., Luna B.L., Naradikian M.S., et al. Mesothelin-specific CAR-T cell therapy that incorporates an HLA-gated safety mechanism selectively kills tumor cells. J. Immunother. Cancer. 2022;10 doi: 10.1136/jitc-2021-003826. [DOI] [PMC free article] [PubMed] [Google Scholar]
- 12.Watanabe N., Mamonkin M. Off-the-Shelf Chimeric Antigen Receptor T Cells: How Do We Get There? Cancer J. 2021;27:176–181. doi: 10.1097/PPO.0000000000000511. [DOI] [PMC free article] [PubMed] [Google Scholar]
- 13.Robbins P.F., Li Y.F., El-Gamil M., Zhao Y., Wargo J.A., Zheng Z., Xu H., Morgan R.A., Feldman S.A., Johnson L.A., et al. Single and dual amino acid substitutions in TCR CDRs can enhance antigen-specific T cell functions. J. Immunol. 2008;180:6116–6131. doi: 10.4049/jimmunol.180.9.6116. [DOI] [PMC free article] [PubMed] [Google Scholar]
- 14.Wang Q.J., Yu Z., Griffith K., Hanada K.i., Restifo N.P., Yang J.C. Identification of T-cell Receptors Targeting KRAS-Mutated Human Tumors. Cancer Immunol. Res. 2016;4:204–214. doi: 10.1158/2326-6066.CIR-15-0188. [DOI] [PMC free article] [PubMed] [Google Scholar]
- 15.Bach F., Hirschhorn K. Lymphocyte Interaction: A Potential Histocompatibility Test in Vitro. Science. 1964;143:813–814. doi: 10.1126/science.143.3608.813. [DOI] [PubMed] [Google Scholar]
- 16.Duygu B., Olieslagers T.I., Groeneweg M., Voorter C.E.M., Wieten L. HLA Class I Molecules as Immune Checkpoints for NK Cell Alloreactivity and Anti-Viral Immunity in Kidney Transplantation. Front. Immunol. 2021;12 doi: 10.3389/fimmu.2021.680480. [DOI] [PMC free article] [PubMed] [Google Scholar]
- 17.Shultz L.D., Schweitzer P.A., Christianson S.W., Gott B., Schweitzer I.B., Tennent B., McKenna S., Mobraaten L., Rajan T.V., Greiner D.L., et al. Multiple defects in innate and adaptive immunologic function in NOD/LtSz-scid mice. J. Immunol. 1995;154:180–191. [PubMed] [Google Scholar]
- 18.Parkhurst M.R., Yang J.C., Langan R.C., Dudley M.E., Nathan D.A.N., Feldman S.A., Davis J.L., Morgan R.A., Merino M.J., Sherry R.M., et al. T cells targeting carcinoembryonic antigen can mediate regression of metastatic colorectal cancer but induce severe transient colitis. Mol. Ther. 2011;19:620–626. doi: 10.1038/mt.2010.272. [DOI] [PMC free article] [PubMed] [Google Scholar]
- 19.Baeuerle P.A., Ding J., Patel E., Thorausch N., Horton H., Gierut J., Scarfo I., Choudhary R., Kiner O., Krishnamurthy J., et al. Synthetic TRuC receptors engaging the complete T cell receptor for potent anti-tumor response. Nat. Commun. 2019;10:2087. doi: 10.1038/s41467-019-10097-0. [DOI] [PMC free article] [PubMed] [Google Scholar]
- 20.Carabasi M.H., McKean M., Stein M.N., Schweizer M.T., Luke J.J., Narayan V., Pachynski R.K., Parikh R.A., Zhang J., Fountaine T.J., et al. PSMA targeted armored chimeric antigen receptor (CAR) T-cells in patients with advanced mCRPC: A phase I experience. J. Clin. Oncol. 2021;39:2534. doi: 10.1200/JCO.2021.39.15_suppl.2534. [DOI] [Google Scholar]
- 21.Murugaesu N., Chew S.K., Swanton C. Adapting clinical paradigms to the challenges of cancer clonal evolution. Am. J. Pathol. 2013;182:1962–1971. doi: 10.1016/j.ajpath.2013.02.026. [DOI] [PubMed] [Google Scholar]
- 22.Carter S.L., Cibulskis K., Helman E., McKenna A., Shen H., Zack T., Laird P.W., Onofrio R.C., Winckler W., Weir B.A., et al. Absolute quantification of somatic DNA alterations in human cancer. Nat. Biotechnol. 2012;30:413–421. doi: 10.1038/nbt.2203. [DOI] [PMC free article] [PubMed] [Google Scholar]
- 23.McGranahan N., Rosenthal R., Hiley C.T., Rowan A.J., Watkins T.B.K., Wilson G.A., Birkbak N.J., Veeriah S., Van Loo P., Herrero J., et al. Allele-Specific HLA Loss and Immune Escape in Lung Cancer Evolution. Cell. 2017;171:1259–1271.e11. doi: 10.1016/j.cell.2017.10.001. [DOI] [PMC free article] [PubMed] [Google Scholar]
- 24.Getahun A., Cambier J.C. Of ITIMs, ITAMs, and ITAMis: revisiting immunoglobulin Fc receptor signaling. Immunol. Rev. 2015;268:66–73. doi: 10.1111/imr.12336. [DOI] [PMC free article] [PubMed] [Google Scholar]
- 25.Kirwan S.E., Burshtyn D.N. Killer cell Ig-like receptor-dependent signaling by Ig-like transcript 2 (ILT2/CD85j/LILRB1/LIR-1) J. Immunol. 2005;175:5006–5015. doi: 10.4049/jimmunol.175.8.5006. [DOI] [PubMed] [Google Scholar]
- 26.Li Z., Deng M., Huang F., Jin C., Sun S., Chen H., Liu X., He L., Sadek A.H., Zhang C.C. LILRB4 ITIMs mediate the T cell suppression and infiltration of acute myeloid leukemia cells. Cell. Mol. Immunol. 2020;17:272–282. doi: 10.1038/s41423-019-0321-2. [DOI] [PMC free article] [PubMed] [Google Scholar]
- 27.Boussiotis V.A., Chatterjee P., Li L. Biochemical signaling of PD-1 on T cells and its functional implications. Cancer J. 2014;20:265–271. doi: 10.1097/PPO.0000000000000059. [DOI] [PMC free article] [PubMed] [Google Scholar]
- 28.Mori Y., Tsuji S., Inui M., Sakamoto Y., Endo S., Ito Y., Fujimura S., Koga T., Nakamura A., Takayanagi H., et al. Inhibitory immunoglobulin-like receptors LILRB and PIR-B negatively regulate osteoclast development. J. Immunol. 2008;181:4742–4751. doi: 10.4049/jimmunol.181.7.4742. [DOI] [PubMed] [Google Scholar]
- 29.Krummel M.F., Allison J.P. CD28 and CTLA-4 have opposing effects on the response of T cells to stimulation. J. Exp. Med. 1995;182:459–465. doi: 10.1084/jem.182.2.459. [DOI] [PMC free article] [PubMed] [Google Scholar]
- 30.Latchman Y., Wood C.R., Chernova T., Chaudhary D., Borde M., Chernova I., Iwai Y., Long A.J., Brown J.A., Nunes R., et al. PD-L2 is a second ligand for PD-1 and inhibits T cell activation. Nat. Immunol. 2001;2:261–268. doi: 10.1038/85330. [DOI] [PubMed] [Google Scholar]
- 31.Vadakekolathu J., Rutella S. T-Cell Manipulation Strategies to Prevent Graft-Versus-Host Disease in Haploidentical Stem Cell Transplantation. Biomedicines. 2017;5 doi: 10.3390/biomedicines5020033. [DOI] [PMC free article] [PubMed] [Google Scholar]
- 32.Wang X., Cabrera F.G., Sharp K.L., Spencer D.M., Foster A.E., Bayle J.H. Engineering Tolerance toward Allogeneic CAR-T Cells by Regulation of MHC Surface Expression with Human Herpes Virus-8 Proteins. Mol. Ther. 2021;29:718–733. doi: 10.1016/j.ymthe.2020.10.019. [DOI] [PMC free article] [PubMed] [Google Scholar]
- 33.Manry D., Bolanos K., DiAndreth B., Mock J.Y., Kamb A. Robust In Vitro Pharmacology of Tmod, a Synthetic Dual-Signal Integrator for Cancer Cell Therapy. Front. Immunol. 2022;13 doi: 10.3389/fimmu.2022.826747. [DOI] [PMC free article] [PubMed] [Google Scholar]
- 34.Bern M.D., Parikh B.A., Yang L., Beckman D.L., Poursine-Laurent J., Yokoyama W.M. Inducible down-regulation of MHC class I results in natural killer cell tolerance. J. Exp. Med. 2019;216:99–116. doi: 10.1084/jem.20181076. [DOI] [PMC free article] [PubMed] [Google Scholar]
- 35.McGuirk J.P., Kröger N., Riedell P., Murthy H.S., Joy Ho P., Maakaron J., Waller E.K., Awan F.T., Shaughnessy P.J., Ghobadi A., et al. CTX110 Allogeneic CRISPR-Cas9–Engineered CAR T Cells in Patients (Pts) with Relapsed or Refractory (R/R) Large B-Cell Lymphoma (LBCL): Results From the Phase 1 Dose Escalation CARBON Study. Blood. 2022;140:10303–10306. American Society of Hematology. [Google Scholar]
- 36.Wang X., Sandberg M.L., Martin A.D., Negri K.R., Gabrelow G.B., Nampe D.P., Wu M.L., McElvain M.E., Toledo Warshaviak D., Lee W.H., et al. Potent, Selective CARs as Potential T-Cell Therapeutics for HPV-positive Cancers. J. Immunother. 2021;44:292–306. doi: 10.1097/CJI.0000000000000386. [DOI] [PMC free article] [PubMed] [Google Scholar]
Associated Data
This section collects any data citations, data availability statements, or supplementary materials included in this article.
Supplementary Materials
Data Availability Statement
-
•
All data reported in this paper will be shared by the lead contact upon request.
-
•
This paper does not report original code.
-
•
Any additional information required to reanalyze the data reported in this paper is available from the lead contact upon request.