

Abstract
A sensitive, reproducible, robust, high-throughput ultra-performance liquid chromatography-tandem mass spectrometry (UPLC-MS/MS) method was developed and validated for the simultaneous quantification of fexofenadine and olmesartan in human serum. Samples (50 μL) undergo protein precipitation prior to UPLC-MS/MS analysis. The analytes were separated using an Acquity BEH C18 column (2.1 mm × 50 mm, 1.7 μm) at a flow rate of 0.5 mL/min using a gradient elution with a total run time of 4 min. The analytes were detected in positive ion mode and selected reaction monitoring (SRM) was used for quantitation. The standard curve concentration range was 1.0–500.0 ng/mL for both analytes and each analyte showed excellent linearity with correlation coefficients (R2 > 0.99). The intra- and inter-day accuracy and precision were ±15% for each analyte, and excellent recovery was demonstrated (93% to 98%) for both analytes. The method is well suited for high-throughput quantitative determination of fexofenadine and olmesartan simultaneously and was successfully applied to an in vivo pharmacokinetic and transporter phenotyping study in humans.
Keywords: olmesartan, fexofenadine, mass spectrometry, pharmacokinetics, LC-MS/MS
1. Introduction
Fexofenadine, a histamine H1-receptor antagonist, and olmesartan, an angiotensin II AT1-receptor antagonist (Fig. 1), are well known substrates of multiple transporters, including those in two major superfamilies: ATP-binding cassette (ABC) and solute carrier (SLC) transporters [1,2]. Both fexofenadine and olmesartan are negligibly metabolized by cytochrome P450 enzymes; they are eliminated predominantly unchanged via biliary excretion. Fexofenadine transport is mediated mainly by P-glycoprotein (P-gp), organic anion transporting polypeptides (OATPs) 1B1, 1B3, and 2B1, bile salt export pump (BSEP), multidrug and toxin extrusion protein (MATE), multidrug resistance protein (MRP), and organic anion transporter (OAT) [2]. Similarly, olmesartan is transported mainly by OATPs 1B1 and 1B3, MRP, and OAT [1]. Transport pathways may be implicated in pharmacokinetic alterations observed in kidney disease and in drug-drug interactions seen during concomitant use of multiple medications [2]. As such, fexofenadine and olmesartan are used as phenotyping probes; that is, to assess the function or ‘phenotype’ of transporters in humans.
Fig. 1.
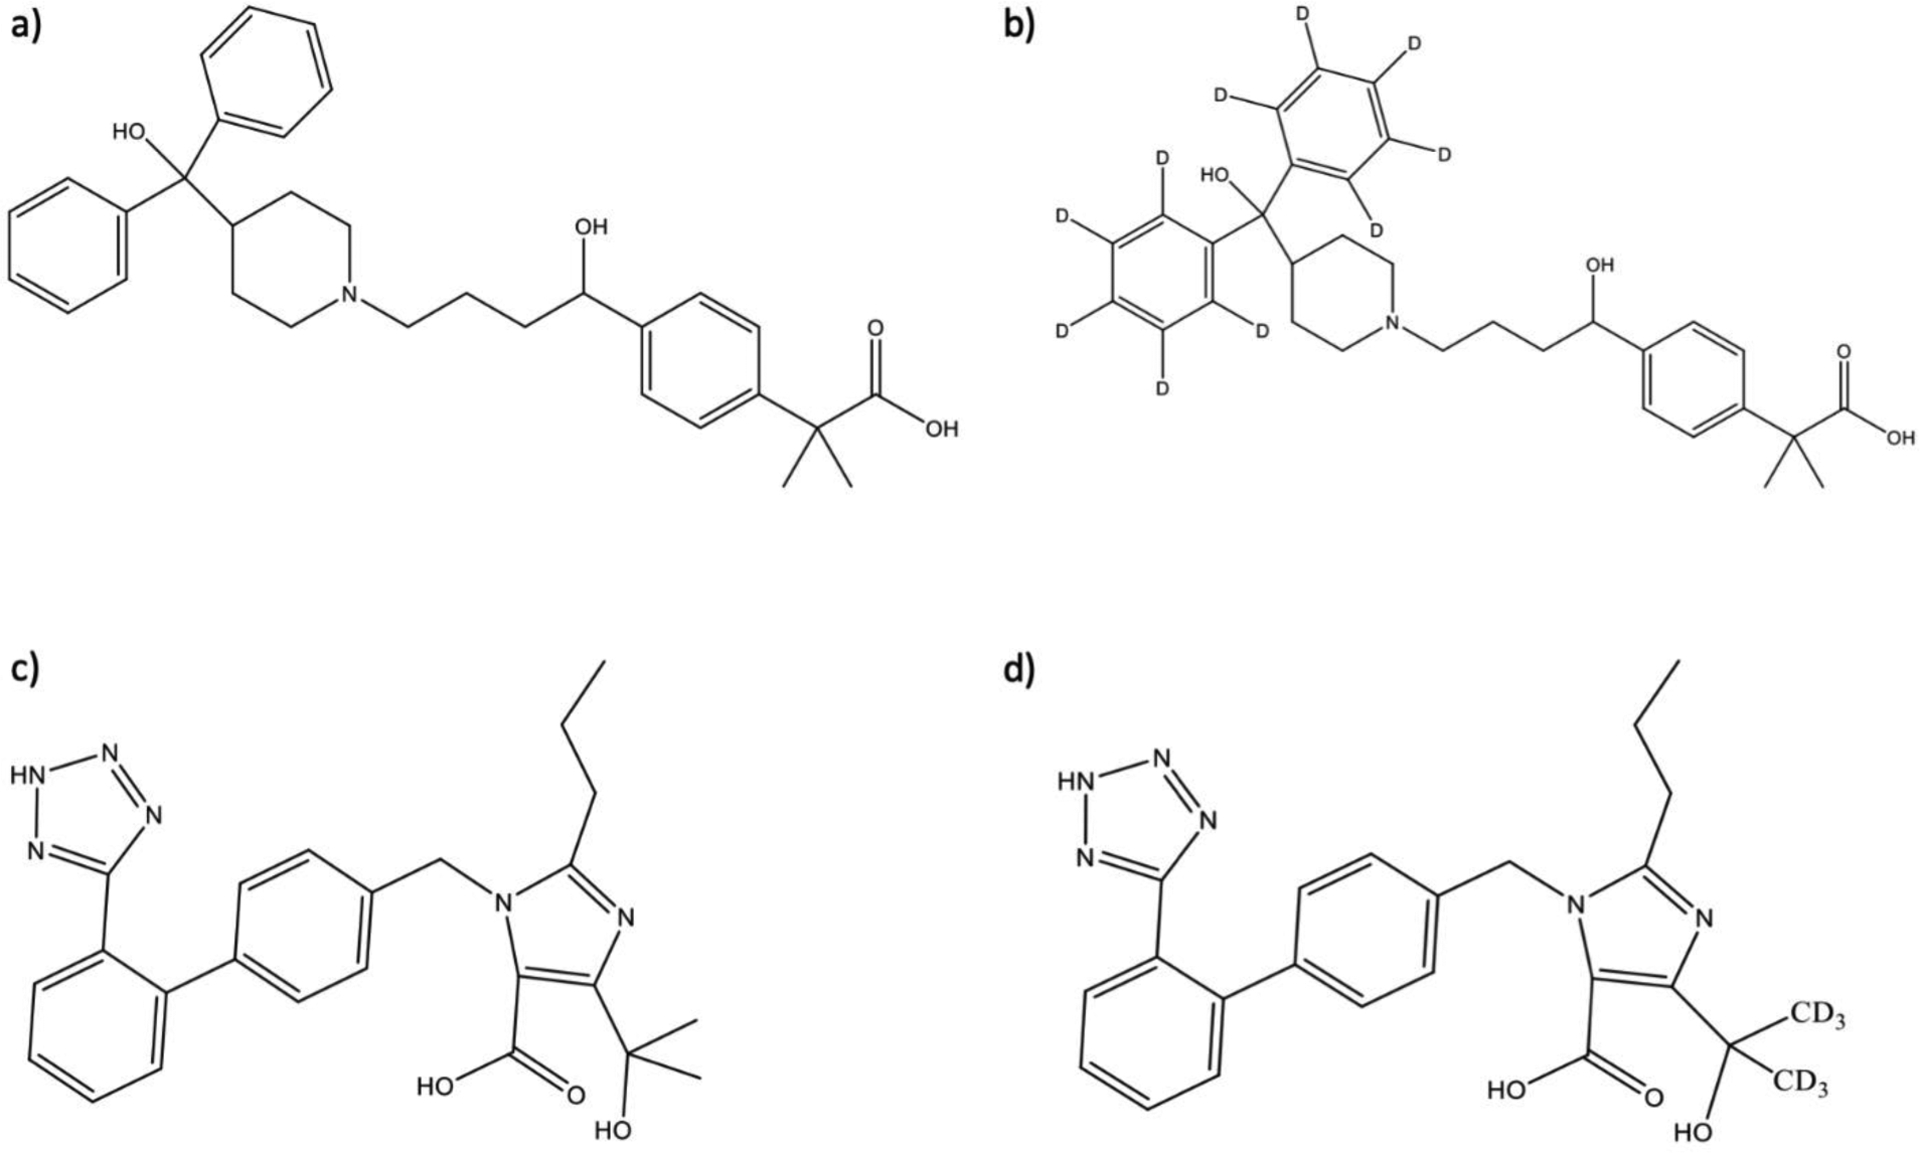
Chemical structures of a) fexofenadine, b) fexofenadine-d10, c) olmesartan, and d) olmesartan-d6.
Several LC-MS and LC-MS/MS methods have been developed for quantifying fexofenadine [3–14] and olmesartan [15–27] in a variety of matrices, including urine [8,15,19,20,25], serum [3–12,14–20,22–24,28], and cell lysates [13]. However, the majority of the methods require large sample volumes for analysis. For example, while one previously reported fexofenadine method requires only 20 μL of serum for analysis [28], most fexofenadine and olmesartan assays require volumes of 100–500 μL [3–27]. In addition, most of the previously published methods utilize time-consuming, expensive and/or cumbersome sample preparation steps including solid-phase extraction [3,5,6,8,10,11,15,17–19] or liquid-liquid extraction [4,9,16,22,23,27] with few using more simple protein precipitation for fexofenadine [7,14,24,28] and olmesartan [20,26]. In addition, the lower limit of quantitation (LLOQ) for methods varied from 1–20 ng/mL for fexofenadine [3–14, 28] and from 0.1–50 ng/mL for olmesartan [15–27] with reported runtimes of 2–5 min for fexofenadine assays [3–14] and 2–12 minutes for olmesartan assays [15–27]. Furthermore, to our knowledge, all previously reported assays measure fexofenadine and olmesartan individually or with other analytes, but not together. It would be advantageous to develop a method that can measure both drugs in a single assay given that a study often assesses multiple transporter pathways simultaneously.
The goal of this work was to develop and comprehensively validate a novel UPLC-MS/MS method to simultaneously quantify both fexofenadine and olmesartan in human serum, which allows for faster assessment of multiple transporter pathways in preclinical and clinical drug development studies. Additional advantages of this assay include a simplified sample preparation procedure to enable high-throughput analyses, and reduced requirement for sample volumes. The application of the method to an in vivo pharmacokinetic and transporter phenotyping study in humans is described.
2. Material and Methods
2.1. Chemicals and reagents
Fexofenadine hydrochloride, olmesartan acid, and formic acid (LC-MS grade) were purchased from Sigma (St. Louis, MO, USA). Deuterated internal standards of fexofenadine-d10 HCl (isotopic purity 99.2%) and olmesartan-d6 acid (isotopic purity 99.9%) were purchased from Toronto Research Chemicals (Toronto, Ontario, Canada). Optima LC–MS grade 2-propanol, acetonitrile, methanol, and water were purchased from Fisher Scientific (Pittsburgh, PA, USA). Ultra-pure nitrogen gas (>99.9%) was produced by a Parker Balston nitrogen generator (Haverhill, MA, USA), and ultra-pure argon gas (>99.9%) was obtained from Matheson (Basking Ridge, NJ, USA). Blank human serum and plasma were received from the Central Blood Bank (Pittsburgh, PA, USA).
2.2. Equipment and UPLC–MS/MS conditions
Ultra-performance liquid chromatography (UPLC) was performed with a Waters Acquity UPLC I-class (Waters, Milford, MA, USA), which includes a sample manager and a binary solvent manager. Chromatographic separation of the analytes was achieved with a Waters Acquity BEH C18 (2.1 mm × 50 mm, 1.7 μm) column held at 50°C with a Vanguard BEH C18 (1.7 μm) pre-column. The sample manager was kept at 10°C during all analyses. The solvent flow rate was 0.5 mL/min, and the mobile phases were 0.1% formic acid in water (solvent A) and acetonitrile (solvent B). The gradient started with 95% A and 5% B from 0–0.5 min followed by a linear gradient to 65% B from 0.5– 2.0 min, then increased to 100% B from 2.0–2.1 min and held from 2.1–3.0 min before returning to the initial conditions from 3.01–4.0 min. The total run time was 4 min.
A TSQ Quantis Plus triple quadrupole mass spectrometer (Thermo Scientific, San Jose, CA, USA) equipped with a heated electrospray ionization probe was used to perform MS/MS analyses. The optimized spray voltage was determined to be 3.5 kV, and the vaporizer and ion transfer capillary temperatures were both set to 350°C. The optimized sheath and auxiliary gas settings were 60 and 15 (arbitrary units), respectively. The pressure of the collision gas was set to 1.5 mTorr. The full peak width at half maximum of 0.7 m/z for quadrupole one (Q1) and three (Q3) was used. Both analytes were detected in positive ionization mode with selected reaction monitoring (SRM). The ion transitions monitored were m/z 502.3→466.2 for fexofenadine (collision energy = 27 V), m/z 512.3→476.2 for fexofenadine-d10 (collision energy = 28 V), m/z 447.1→207.0 for olmesartan (collision energy = 23 V), and m/z 453.2→207.0 for olmesartan-d6 (collision energy = 25 V). The mass spectrometer signals were detected and processed with Xcalibur software 4.5.474.0 (Thermo Scientific, San Jose, CA, USA).
2.3. Preparation of the calibration standards and quality control (QC) samples
Fexofenadine and olmesartan were prepared in methanol to make 1.0 mg/mL stock solutions. Equal volumes of the 1 mg/mL stocks of fexofenadine and olmesartan were mixed together to obtain a 500 μg/mL stock solution. This stock solution was diluted with methanol to prepare two intermediate stock solutions (10 μg/mL and 100 ng/mL) from which the quality controls (QC) and the calibration standards were prepared. Two sets of intermediate stocks were prepared separately, one set was used for the calibration standards and the other for the QCs. The intermediate stock solutions were spiked into blank human serum to produce calibration standards at concentrations of 1.0, 2.5, 10, 50, 250, and 500 ng/mL for both fexofenadine and olmesartan. Lower limit of quantitation, low, medium, and high QCs (LLOQ, LQC, MQC, and HQC) were prepared by spiking the intermediate stocks into blank human serum to provide concentrations of 1.0, 3.0, 100, and 400 ng/mL for both analytes. All samples, stock solutions, intermediate stocks, calibration standards, and QCs were stored at −80°C until further testing.
2.4. Sample preparation
The internal standard solution was made in methanol and contained 200 ng/mL olmesartan-d6 and fexofenadine-d10. This solution was used to precipitate proteins in the samples. Internal standard solution (100 μL) was added to 50 μL of the calibration standards, QCs, or unknown serum or plasma samples. The samples were then vortexed for 10 sec and centrifuged at 10,000 × g for 10 min. A 50 μL aliquot of supernatant was placed into LC vial inserts and 7.5 μL of the sample was injected for UPLC–MS/MS analyses.
2.5. Assay validation
The fexofenadine and olmesartan assay was comprehensively validated in accordance with the U.S. Food and Drug Administration (FDA) guidance for bioanalytical method validation [29].
2.5.1. Calibration and linearity
Six different standard concentrations for fexofenadine and olmesartan were used to construct calibration curves. For three days, the LLOQ was run in triplicate while the other calibration standards were run in duplicate. The LLOQ was determined to have a signal-to-noise ratio (S:N) greater than 10:1, while the limit of detection (LOD) was defined as a S:N of at least 3:1. For each standard curve, the absolute peak-area ratios of the analyte to its corresponding stable isotope labeled internal standard were calculated and plotted against the nominal analyte concentration. Calibration curves were generated by weighted (1/x) linear regression analysis.
2.5.2. Accuracy and precision
Precision and accuracy were determined by the analysis of six replicate LLOQ, LQC, MQC, and HQC samples for two consecutive days followed by 12 replicate QC samples on a third day, for a total of n = 24 QC samples at each concentration. The 12 replicates on the third day were used to determine the intra-day accuracy and precision while all 24 replicate QC samples were used to calculate the inter-day precision and accuracy. Accuracy (reported as deviation; %) was determined by comparing the mean concentration relative to the nominal concentration. The coefficient of variation (CV; %) was determined from QC values to assess the precision of the assay. In addition, to assess the utility of the serum-based calibration curve and QCs for use in measuring the analytes in plasma samples, we determined the accuracy and precision with plasma QCs using the serum-based curves by running 6 replicates for LQC, MQC, and HQC.
2.5.3. Recovery and matrix effect
Recovery was calculated by comparing the responses (peak area) of the analytes spiked in serum before and after extraction. Recovery was defined as ‘excellent’ if the extent of recovery was greater than 90%. Matrix effect was determined by comparing the response of the analytes in serum after extraction to that of neat solutions spiked in water (defined as 100%). All studies were performed in triplicate at the LQC, MQC, and HQC levels. All the QC samples were analyzed using standard curves generated on the day of the analysis.
2.5.4. Carryover and Selectivity
Carryover was assessed by placing neat samples (n = 6) at various locations, including after the highest standard and QC, in the analysis set. Selectivity was assessed by running six different serum and plasma lots in triplicate to assess whether interfering species at the monitored SRM transitions for fexofenadine or olmesartan were present.
2.5.5. Sample stability
The stability of stored samples was tested with the analysis of three replicates of samples at two different QC levels (LQC and HQC). The samples were left at room temperature on the bench top under normal fluorescent light for 4 h before sample preparation, and the results were compared with the recovery of freshly prepared samples. The results from the freshly prepared samples were defined as 100%, and the results from the later time points were expressed in terms of percentage of the first measurement. Results within 15% of the first value were regarded as stable on the bench top for up to 4 h.
Stability of processed samples in the autosampler was also investigated. The samples were processed (LQC and HQC) in triplicate and left in the autosampler for a period of either 24 h or 72 h. Recovery at these times were compared with results from freshly processed samples, which were defined as 100%. The results from the later time points were expressed in terms of percentage of the first measurement. The analytes were considered to be stable under these conditions if the results differ ≤15% from the first value.
Freeze/thaw cycle stability was also assessed. Quality control samples at two concentration levels (LQC and HQC) were prepared in triplicate and stored at −80°C before being subjected to three consecutive freeze/thaw cycles and analyzed. The results of the later time points were expressed in terms of percentage of the first measurement (freshly prepared). The analytes were considered stable after undergoing up to three freeze/thaw cycles if the results differed by ≤15% from the freshly processed sample values.
Long-term stability of the samples was assessed by analyzing QC samples at two concentration levels (LQC and HQC) in triplicate that had been stored at −80°C for a period of one year. The results of the samples that were frozen for one year were compared with those of freshly prepared LQC and HQC samples and expressed in terms of the percentage of the fresh samples. The analytes were considered stable for up to one year if the results differed by ≤15% from the freshly processed sample values.
2.5.6. Dilution Analysis
Fexofenadine and olmesartan samples were prepared at a concentration that was two-fold greater than the highest calibration standard (1 μg/mL). The samples were then diluted 2-, 3- and 5-fold prior to analysis. The samples at each dilution level were processed in fives replicates with the results being back calculated using a standard curve to determine if the results were within 15% of the nominal concentration for both analytes.
2.6. Application of the method
The fully validated method was applied to a pharmacokinetic study of fexofenadine and olmesartan in patients with chronic kidney disease and healthy subjects to explore the effect of kidney disease on drug transporter function. The protocol was approved by the Institutional Review Boards at the University of Colorado and the University of Pittsburgh, and all subjects provided written informed consent. Serial blood samples were obtained at time 0, 0.5, 1, 2, 4, 8, 12, 24, and 48 h after administration of single oral doses of olmesartan 10 mg and fexofenadine 60 mg. Blood samples were collected, plasma was harvested, and all samples were stored at −80°C until analyzed. Plasma concentrations of fexofenadine and olmesartan at each timepoint were determined as described above. Area under the plasma concentration-time curves from 0–48 hours were calculated (GraphPad Prism v.10, Boston, MA, USA) for each drug as a measure systemic exposure and as a surrogate of transporter function, then compared between study subjects with and without kidney disease.
3. Results and Discussion
A simple and high-throughput UPLC-MS/MS method was developed and validated for the simultaneous quantification of probe drugs fexofenadine and olmesartan in human serum. This novel LC-MS/MS method can be utilized in preclinical and clinical studies to characterize the pharmacokinetics of fexofenadine and olmesartan and by extension to assess the function of drug transporters.
3.1. Mass Spectrometry Optimization, Chromatographic Separation, and Sample Preparation
The structures of fexofenadine, olmesartan, and corresponding internal standards are shown in Fig. 1. Both analytes and their internal standards can be protonated, therefore positive ionization mode was used for detection. The MS/MS spectra of the [M+H]+ ions for fexofenadine (m/z 502.3) and olmesartan (m/z 447.1) are shown in Fig. 2. The most intense fragment ion observed for each analyte was used for SRM.
Fig. 2.

The MS/MS spectra showing the most intense fragments for a) fexofenadine (m/z 502.3→466.2) and b) olmesartan (m/z 447.1→207.0).
A previous search of the literature showed that a C18 column had been used for the separation of fexofenadine [4,7,10–14,28] and olmesartan [15–23]. In the current study, a Waters Acquity BEH C18 (2.1 mm × 50 mm, 1.7 μm) column allowed for excellent separation of the analytes of interest with a short total run time of 4 min. The retention time of olmesartan and olmesartan-d6 was 1.66 min, while the retention time of fexofenadine and fexofenadine-d10 was 1.89 min. Extracted ion chromatograms of each analyte and the internal standards at LLOQ and in a representative study subject plasma sample are shown in Fig. 3.
Fig. 3.

Extracted ion chromatograms (EICs) of each analyte at LLOQ (left panel, a-d) in serum, and a representative study subject plasma sample (right panel, e-h) as follows: a and e) fexofenadine; b and f) fexofenadine-d10; c and g) olmesartan; d and h) olmesartan-d6.
In addition to a short run time, our sample preparation procedure with protein precipitation facilitates high throughput, cost-effective, and simple sample processing and offers advantages over previously published methods that utilized SPE or LLE [3–24]. Although some prior methods also incorporated protein precipitation, they involved evaporation and reconstitution steps or filtration of the samples before analysis, which can lower throughput [7,10,24]. Additionally, our novel assay is sample sparing, with only 50 μL necessary for analysis versus other methods that require much larger sample volumes [3–24].
3.2. Assay Validation
The current combined fexofenadine and olmesartan assay was successfully validated following the 2018 FDA guidelines for bioanalytical method validation [29].
3.2.1. Calibration and Linearity
The standard curves for fexofenadine and olmesartan were both analyzed over three separate runs with each standard curve analyzed in duplicate (lowest standard in triplicate) using serum-based standards. Linear calibration curves were observed for fexofenadine and olmesartan over the concentration range of 1.0–500 ng/mL with correlation coefficients (R2) ≥0.998 for all analytes (Table 1). The LLOQ was determined to be 1.0 ng/mL for both fexofenadine and olmesartan, while the LOD was 0.10 ng/mL for olmesartan and 0.25 ng/mL for fexofenadine. Precision and accuracy data obtained from back calculated calibration standards demonstrated the suitability of the calibration method since all values were within ±15% of the nominal concentration.
Table 1.
Assay validation results for human serum.
| Parameter | Fexofenadine | Olmesartan |
|---|---|---|
| LOD (ng/mL) | 0.25 | 0.10 |
| LLOQ (ng/mL) | 1.0 | 1.0 |
| Linear range (ng/mL) | 1.0–500 | 1.0–500 |
| Slope (n = 3) | 0.0019 ± 0.0001 | 0.0031 ± 0.00001 |
| Intercept (n = 3) | −0.0005 ± 0.00001 | −0.0011 ±0.0001 |
| Correlation coefficient (R2, n = 3) | 0.9984 ± 0.0003 | 0.9982 ±0.0005 |
| Sample preparation | Protein precipitation | Protein precipitation |
| Run time | 4 min | 4 min |
| Retention time | 1.89 min | 1.66 min |
The slope, intercept, and correlation coefficient are presented as mean ± standard deviation.
3.2.2. Accuracy and Precision
The accuracy and precision of the method were determined by the analysis of fexofenadine and olmesartan LLOQ and QC samples at three concentration levels over a three-day period. The mean inter- and intra-day precision and accuracy values were all within ±15% for QCs and ±20% for LLOQs (Table 2).
Table 2.
Intra- and inter-day accuracy (deviation) and precision (CV) of LLOQ and QCs in human serum.
| Analyte | Level | Nominal Concentration (ng/mL) | Intra-daya | Inter-dayb | ||
|---|---|---|---|---|---|---|
| Deviation (%) | CV (%) | Deviation (%) | CV (%) | |||
| Fexofenadine | LLOQ | 1.0 | 11.2 | 2.1 | 12.4 | 2.4 |
| LQC | 3.0 | −2.1 | 3.0 | −3.6 | 2.9 | |
| MQC | 100 | 0.2 | 2.6 | −1.1 | 3.1 | |
| HQC | 400 | 5.3 | 3.3 | 0.8 | 5.7 | |
| Olmesartan | LLOQ | 1.0 | 9.8 | 2.4 | 12.5 | 3.4 |
| LQC | 3.0 | −5.5 | 3.3 | −5.8 | 2.9 | |
| MQC | 100 | −3.3 | 2.4 | −3.9 | 2.6 | |
| HQC | 400 | 3.5 | 2.8 | −0.3 | 4.9 | |
Three replicates for LLOQ; 12 replicates for QCs.
Nine replicates for LLOQ; 24 replicates for QCs.
3.2.3. Recovery and matrix effect
The average recoveries of both fexofenadine and olmesartan at all three QC concentrations ranged from 92.86–98.03% (Table 3), demonstrating excellent recovery and minimal loss of the analytes. The measured serum concentrations varied by −6.11% to 2.27% from the aqueous samples, indicating that matrix effects were negligible.
Table 3.
Recovery of fexofenadine and olmesartan from human serum (n = 3).
| Analyte | Level | Nominal Concentration (ng/mL) | Recovery (%, mean) | Matrix Effect (%, mean) |
|---|---|---|---|---|
| Fexofenadine | LQC | 3.0 | 92.9 | 95.5 |
| MQC | 100 | 96.7 | 102.3 | |
| HQC | 400 | 94.8 | 93.9 | |
| Olmesartan | LQC | 3.0 | 93.6 | 96.6 |
| MQC | 100 | 98.0 | 101.3 | |
| HQC | 400 | 94.6 | 95.3 |
3.2.4. Carryover and Selectivity
Carryover was evaluated by placing six neat samples at various locations throughout a sequence. No significant carryover of fexofenadine or olmesartan was observed from previous runs for any of the neat samples. In addition, no endogenous analytes were observed in the blank serum or plasma that affected the signal for fexofenadine or olmesartan, indicating selectivity of the method.
3.2.5. Sample Stability
The stability of the serum samples was tested prior to processing at room temperature, post-processing with storage in the autosampler at 10°C, after three consecutive freeze/thaw cycles, and after 1 year of storage at −80°C. The mean concentrations for all stability samples were within ≤15% of the freshly prepared samples, demonstrating sample stability under all testing conditions.
3.2.6. Dilution Analysis
The mean accuracy and precision obtained for fexofenadine and olmesartan at all dilution levels were within ±15% (data not shown). These results further demonstrated the accuracy and precision for the assay. Additionally, dilution of the human serum samples before analysis did not affect accuracy and precision. Due to the expected concentrations of these drugs in human samples, no dilution greater than 5-fold was assessed.
3.2.7. Performance of Plasma QCs Using Serum-Based Calibration Curves
The accuracy and precision of the method in plasma were determined by the analysis of fexofenadine and olmesartan QC samples prepared in plasma at three concentration levels using the serum-based calibration curve. The mean intra-day accuracy and precision values were all within ±15% for QCs (Table 4), indicating that the assay is accurate and precise in both plasma and serum, and that serum-based calibration curves and QCs may be used for measuring the analytes in plasma samples.
Table 4.
Intra-day accuracy (deviation) and precision (CV) of plasma QCs on serum-based curve.
| Analyte | Level | Nominal Concentration (ng/mL) | Intra-daya | |
|---|---|---|---|---|
| Deviation (%) | CV (%) | |||
| Fexofenadine | LQC | 3.0 | 0.6 | 2.9 |
| MQC | 100 | 5.8 | 1.7 | |
| HQC | 400 | 5.5 | 1.2 | |
| Olmesartan | LQC | 3.0 | −3.0 | 2.1 |
| MQC | 100 | −6.6 | 1.5 | |
| HQC | 400 | −5.1 | 1.7 | |
Six replicates for QCs.
3.3. Assay Application
The method was successfully applied to a pharmacokinetic study of fexofenadine and olmesartan in humans to explore the effect of kidney disease on drug transporter function. Representative plasma concentration-time curves of each drug in a subject with kidney disease and a healthy subject are shown in Fig. 4. AUC values, which are a measure of systemic exposure and total clearance, were lower for both drugs in the patient with kidney disease than the healthy subject. The fexofenadine and olmesartan AUCs observed were 1,788 ng*h/mL and 2,221 ng*h/mL, respectively in the subject with kidney disease versus 965 ng*h/mL and 1,518 ng*h/mL, respectively in the healthy subject. Given that the drugs are substrates of transporters, this corroborates previous reports that transporter mediated clearance is decreased in kidney disease [30]. However, the interpretation of these preliminary findings require further exploration and validation.
Fig. 4.

Representative plasma concentration-time curves of a) fexofenadine and b) olmesartan in a subject with chronic kidney disease (CKD; circle, solid line) and a healthy subject (Healthy; diamond, dashed line). The fexofenadine and olmesartan area under the plasma-concentration time curves observed were 1,788 ng*h/mL and 2,221 ng*h/mL, respectively in the subject with kidney disease versus 965 ng*h/mL and 1,518 ng*h/mL, respectively in the healthy subject.
4. Conclusions
A simple, sensitive, and high throughput UPLC-MS/MS method was developed and validated for the simultaneous quantification of fexofenadine and olmesartan in human serum. This accurate and precise assay has several advantages over existing assays, including reduced sample volume requirements, minimal sample preparation, and improved throughput. The method is currently being used to support ongoing studies of pharmacokinetics in people with kidney disease, and may be applied to future clinical investigations of drug transporter function, personalized dosing strategies based on individual transporter phenotypes, and pharmacogenetic studies involving drug substrates of polymorphically expressed transporters.
Highlights.
An assay was validated for fexofenadine and olmesartan quantitation in human serum.
Excellent linearity was achieved for both drugs between 1.0–500.0 ng/mL.
A simplified sample preparation procedure allowed for high-throughput analysis.
The method was successfully applied to a pharmacokinetic study in humans.
Acknowledgement
This work was supported by the National Institutes of Health, National Institute of General Medical Sciences grant R01-GM107122 to TDN and MSJ. This project used the service of the University of Pittsburgh Small Molecule Biomarker Core facility, which was graciously supported, in part, by the University of Pittsburgh Office of the Senior Vice Chancellor, Health Sciences, and the National Institutes of Health S10RR023461 and S10OD028540. The authors gratefully acknowledge the technical assistance of Li Liu, MD, and Morgan Butrovich, PharmD. This work was presented in part at ASMS 2019, the 67th American Society for Mass Spectrometry Conference on Mass Spectrometry and Allied Topics, Atlanta, GA, June 2019, and has appeared in abstract form [J Am Soc Mass Spectrom 2019;30(Suppl 1):215].
Footnotes
Publisher's Disclaimer: This is a PDF file of an unedited manuscript that has been accepted for publication. As a service to our customers we are providing this early version of the manuscript. The manuscript will undergo copyediting, typesetting, and review of the resulting proof before it is published in its final form. Please note that during the production process errors may be discovered which could affect the content, and all legal disclaimers that apply to the journal pertain.
CRediT authorship contribution statement
Raymond West III: Methodology, Formal analysis, Investigation, Resources, Data curation, Writing – original draft, Writing – review & editing, Visualization, Validation. Junmei Zhang: Writing – original draft, Writing – review & editing, Visualization. Melanie Joy: Conceptualization, Writing – review & editing, Visualization, Funding acquisition. Thomas Nolin: Conceptualization, Formal analysis, Investigation, Resources, Data curation, Writing – Review & Editing, Visualization, Supervision, Project administration, Funding acquisition.
Declaration of interests
The authors declare that they have no known competing financial interests or personal relationships that could have appeared to influence the work reported in this paper.
Author Statements
The manuscript is not under consideration for publication elsewhere, and it has not appeared elsewhere in a manner that could be construed as a prior or duplicate publication. We declare that no financial conflicts of interest exist.
Conflicts of Interest
The authors have no conflicts of interest to disclose.
References
- [1].Yamada A, Maeda K, Kamiyama E, Sugiyama D, Kondo T, Shiroyanagi Y, Nakazawa H, Okano T, Adachi M, Schuetz JD, Adachi Y, Hu Z, Kusuhara H, Sugiyama Y, Multiple human isoforms of drug transporters contribute to the hepatic and renal transport of olmesartan, a selective antagonist of the angiotensin II AT1-receptor, Drug Metab Dispos, 35 (2007) 2166–2176. 10.1124/dmd.107.017459. [DOI] [PubMed] [Google Scholar]
- [2].Chu X, Liao M, Shen H, Yoshida K, Zur AA, Arya V, Galetin A, Giacomini KM, Hanna I, Kusuhara H, Lai Y, Rodrigues D, Sugiyama Y, Zamek-Gliszczynski MJ, Zhang L, International Transporter Consortium, Clinical probes and endogenous biomarkers as substrates for transporter drug-drug interaction evaluation: perspectives from the International Transporter Consortium, Clin Pharmacol Ther, 104 (2018) 836–864. 10.1002/cpt.1216. [DOI] [PubMed] [Google Scholar]
- [3].Fu I, Woolf EJ, Matuszewski BK, Determination of fexofenadine in human plasma using 96-well solid phase extraction and HPLC with tandem mass spectrometric detection, J Pharm Biomed Anal, 35 (2004) 837–846. 10.1016/j.jpba.2004.02.016. [DOI] [PubMed] [Google Scholar]
- [4].İşleyen EAÖ, Özden T, Özilhan S, Toptan S, Quantitative determination of fexofenadine in human plasma by HPLC-MS, Chromatographia, 66 (2007) 109–113. 10.1365/s10337-007-0267-x. [DOI] [Google Scholar]
- [5].Yamane N, Tozuka Z, Sugiyama Y, Tanimoto T, Yamazaki A, Kumagai Y, Microdose clinical trial: quantitative determination of fexofenadine in human plasma using liquid chromatography/electrospray ionization tandem mass spectrometry, J Chromatogr B Analyt Technol Biomed Life Sci, 858 (2007) 118–128. 10.1016/j.jchromb.2007.08.011. [DOI] [PubMed] [Google Scholar]
- [6].Bharathi VD, Radharani K, Jagadeesh B, Ramulu G, Bhushan I, Naidu A, Mullangi R, LC-MS-MS assay for simultaneous quantification of fexofenadine and pseudoephedrine in human plasma, Chromatographia, 67 (2008) 461–466. 10.1365/s10337-008-0526-5. [DOI] [Google Scholar]
- [7].Stanton ML, Joy MS, Frye RF, Validation and application of a liquid chromatography-tandem mass spectrometric method for quantification of the drug transport probe fexofenadine in human plasma using 96-well filter plates, J Chromatogr B Analyt Technol Biomed Life Sci, 878 (2010) 497–501. 10.1016/j.jchromb.2009.12.022. [DOI] [PMC free article] [PubMed] [Google Scholar]
- [8].Naidong W, Shou WZ, Addison T, Maleki S, Jiang X, Liquid chromatography/tandem mass spectrometric bioanalysis using normal-phase columns with aqueous/organic mobile phases - a novel approach of eliminating evaporation and reconstitution steps in 96-well SPE, Rapid Commun Mass Spectrom, 16 (2002) 1965–1975. 10.1002/rcm.817. [DOI] [PubMed] [Google Scholar]
- [9].Muppavarapu R, Guttikar S, Rajappan M, Kamarajan K, Mullangi R, Sensitive LCMS/MS-ESI method for simultaneous determination of montelukast and fexofenadine in human plasma: application to a bioequivalence study, Biomed Chromatogr, 28 (2014) 1048–1056. 10.1002/bmc.3114. [DOI] [PubMed] [Google Scholar]
- [10].Nirogi RV, Kandikere VN, Shukla M, Mudigonda K, Maurya S, Komarneni P, Simultaneous quantification of fexofenadine and pseudoephedrine in human plasma by liquid chromatography/tandem mass spectrometry with electrospray ionization: method development, validation and application to a clinical study, Rapid Commun Mass Spectrom, 20 (2006) 3030–3038. 10.1002/rcm.2701. [DOI] [PubMed] [Google Scholar]
- [11].Nirogi RV, Kandikere VN, Shukla M, Mudigonda K, Maurya S, Komarneni P, Quantification of fexofenadine in human plasma by liquid chromatography coupled to electrospray tandem mass spectrometry using mosapride as internal standard, Biomed Chromatogr, 21 (2007) 209–216. 10.1002/bmc.740. [DOI] [PubMed] [Google Scholar]
- [12].Yamazaki A, Kumagai Y, Yamane N, Tozuka Z, Sugiyama Y, Fujita T, Yokota S, Maeda M, Microdose study of a P-glycoprotein substrate, fexofenadine, using a non-radioisotope-labelled drug and LC/MS/MS, J Clin Pharm Ther, 35 (2010) 169–175. 10.1111/j.1365-2710.2009.01159.x. [DOI] [PubMed] [Google Scholar]
- [13].Flynn CA, Alnouti Y, Reed GA, Quantification of the transporter substrate fexofenadine in cell lysates by liquid chromatography/tandem mass spectrometry, Rapid Commun Mass Spectrom, 25 (2011) 2361–2366. 10.1002/rcm.5111. [DOI] [PMC free article] [PubMed] [Google Scholar]
- [14].Guo D, Zou J, Zhu Y, Lou S, Fan H, Qin Q, Measurement of fexofenadine concentration in micro-sample human plasma by a rapid and sensitive LC-MS/MS employing protein precipitation: application to a clinical pharmacokinetic study, Biomed Chromatogr, 24 (2010) 335–341. 10.1002/bmc.1296. [DOI] [PubMed] [Google Scholar]
- [15].Liu D, Jiang J, Wang P, Feng S, Hu P, Simultaneous quantitative determination of olmesartan and hydrochlorothiazide in human plasma and urine by liquid chromatography coupled to tandem mass spectrometry, J Chromatogr B Analyt Technol Biomed Life Sci, 878 (2010) 743–748. 10.1016/j.jchromb.2010.01.009. [DOI] [PubMed] [Google Scholar]
- [16].Das R, Pal TK, Method development & validation of LCMS/MS for atorvastatin and olmesartan in human plasma to trace drug interaction of formulation, Curr Pharm Anal, 11 (2015) 43–52. 10.2174/1573412910666141021002115. [DOI] [Google Scholar]
- [17].Kumar A, Verma PRP, Monif T, Khuroo AH, Iyer SS, Singh AK, Challenges in bioanalytical method development for simultaneous determination of olmesartan and hydrochlorothiazide in human plasma by liquid chromatography coupled to tandem mass spectrometry, J Liq Chromatogr R T, 35 (2012) 59–78. 10.1080/10826076.2011.597060. [DOI] [Google Scholar]
- [18].Vaidya VV, Roy SMN, Yetal SM, Joshi SS, Parekh SA, LC-MS-MS determination of olmesartan in human plasma, Chromatographia, 67 (2008) 147–150. 10.1365/s10337-007-0453-x. [DOI] [Google Scholar]
- [19].Liu D, Hu P, Matsushima N, Li X, Li L, Jiang J, Quantitative determination of olmesartan in human plasma and urine by liquid chromatography coupled to tandem mass spectrometry, J Chromatogr B Analyt Technol Biomed Life Sci, 856 (2007) 190–197. 10.1016/j.jchromb.2007.05.049. [DOI] [PubMed] [Google Scholar]
- [20].Qi W, Zhao Q, Jiang J, Hu P, Simultaneous determination of olmesartan and amlodipine in human plasma and urine by ultra performance liquid chromatography tandem mass spectrometry, J Chromatogr B Analyt Technol Biomed Life Sci, 938 (2013) 27–34. 10.1016/j.jchromb.2013.08.026. [DOI] [PubMed] [Google Scholar]
- [21].Trivedi P, Kartikeyan C, Kachave R, Bhadane R, Stability-indicating assay method for estimation of olmesartan medoxomil and its metabolite, J Liq Chromatogr R T, 32 (2009) 1516–1526. 10.1080/10826070902901606. [DOI] [Google Scholar]
- [22].Sengupta P, Sarkar AK, Bhaumik U, Chatterjee B, Roy B, Chakraborty US, Pal TK, Development and validation of an LC-ESI-MS/MS method for simultaneous quantitation of olmesartan and pioglitazone in rat plasma and its pharmacokinetic application, Biomed Chromatogr, 24 (2010) 1342–1349. 10.1002/bmc.1447. [DOI] [PubMed] [Google Scholar]
- [23].Piorkowska E, Musijowski J, Bus-Kwasnik K, Rudzki PJ, Is a deuterated internal standard appropriate for the reliable determination of olmesartan in human plasma?, J Chromatogr B Analyt Technol Biomed Life Sci, 1040 (2017) 53–59. 10.1016/j.jchromb.2016.11.021. [DOI] [PubMed] [Google Scholar]
- [24].De Nicolo A, Avataneo V, Rabbia F, Bonifacio G, Cusato J, Tomasello C, Perlo E, Mulatero P, Veglio F, Di Perri G, D’Avolio A, UHPLC-MS/MS method with protein precipitation extraction for the simultaneous quantification of ten antihypertensive drugs in human plasma from resistant hypertensive patients, J Pharm Biomed Anal, 129 (2016) 535–541. 10.1016/j.jpba.2016.07.049. [DOI] [PubMed] [Google Scholar]
- [25].De Nicolo A, Avataneo V, Rabbia F, Sciandra M, Tosello F, Cusato J, Perlo E, Mulatero P, Veglio F, Di Perri G, D’Avolio A, UHPLC-MS/MS method with sample dilution to test therapeutic adherence through quantification of ten antihypertensive drugs in urine samples, J Pharm Biomed Anal, 142 (2017) 279–285. 10.1016/j.jpba.2017.05.018. [DOI] [PubMed] [Google Scholar]
- [26].Jeong HC, Seo YH, Gu N, Rhee MY, Shin KH, Determination of candesartan or olmesartan in hypertensive patient plasma using UPLC-MS/MS, Transl Clin Pharmacol, 29 (2021) 226–238. 10.12793/tcp.2021.29.e21. [DOI] [PMC free article] [PubMed] [Google Scholar]
- [27].Kumar A, Dwivedi SP, Prasad T, Method validation for simultaneous quantification of olmesartan and hydrochlorothiazide in human plasma using LC-MS/MS and its application through bioequivalence study in healthy volunteers, Front Pharmacol, 10 (2019) 810. 10.3389/fphar.2019.00810. [DOI] [PMC free article] [PubMed] [Google Scholar]
- [28].Tanaka Y, Ohkawa T, Yasui H, Development of a novel high-throughput analytical methodology, multiple injection method, for quantitative analysis in drug metabolism and pharmacokinetic studies using liquid chromatography with tandem mass spectrometry, Biol Pharm Bull, 34 (2011) 1187–1193. 10.1248/bpb.34.1187. [DOI] [PubMed] [Google Scholar]
- [29].U.S. Food and Drug Administration. Guidance for Industry - Bioanalytical Method Validation, 2018. Available from: https://www.fda.gov/downloads/drugs/guidances/ucm070107.pdf. Accessed April 21, 2024.
- [30].Miners JO, Yang X, Knights KM, Zhang L, The Role of the Kidney in Drug Elimination: Transport, Metabolism, and the Impact of Kidney Disease on Drug Clearance, Clin Pharmacol Ther, 102 (2017) 436–449. 10.1002/cpt.757. [DOI] [PubMed] [Google Scholar]