

Abstract
Many organisms capture or sense sunlight using rhodopsin pigments1,2, which are integral membrane proteins that bind retinal chromophores. Rhodopsins comprise two distinct protein families1, type-1 (microbial rhodopsins) and type-2 (animal rhodopsins). The two families share similar topologies and contain seven transmembrane helices that form a pocket in which retinal is linked covalently as a protonated Schiff base to a lysine at the seventh transmembrane helix2,3. Type-1 and type-2 rhodopsins show little or no sequence similarity to each other, as a consequence of extensive divergence from a common ancestor or convergent evolution of similar structures1. Here we report a previously unknown and diverse family of rhodopsins—which we term the heliorhodopsins—that we identified using functional metagenomics and that are distantly related to type-1 rhodopsins. Heliorhodopsins are embedded in the membrane with their N termini facing the cell cytoplasm, an orientation that is opposite to that of type-1 or type-2 rhodopsins. Heliorhodopsins show photocycles that are longer than one second, which is suggestive of light-sensory activity. Heliorhodopsin photocycles accompany retinal isomerization and proton transfer, as in type-1 and type-2 rhodopsins, but protons are never released from the protein, even transiently. Heliorhodopsins are abundant and distributed globally; we detected them in Archaea, Bacteria, Eukarya and their viruses. Our findings reveal a previously unknown family of light-sensing rhodopsins that are widespread in the microbial world.
The light-driven functions of rhodopsins comprise four categories: (i) ion pumps; (ii) channels; (iii) enzymes; and (iv) photosensory receptors3. Type-1 rhodopsins are represented in diverse microorganisms, spanning the three domains of cellular life1–3, as well as in giant viruses4,5. Ion-pump type-1 rhodopsins are highly abundant; in particular, proteorhodopsins6,7 have been found in up to 70% of microorganisms in oceanic surface waters8. Efforts to identify novel type-1 rhodopsins usually involve sequence similarity searches by screening genomes from cultured organisms or metagenomic sequences from various environments6,9–11, or PCR performed on environmental DNA samples using degenerate primers designed for conserved regions in microbial rhodopsins12–14. So far, only two functional screens have been devised to search for new rhodopsins, one based on the appearance of coloured Escherichia coli colonies after plating marine fosmid libraries on retinal-containing plates15 and another based on pH changes in response to illumination in E. coli clones of marine fosmid libraries16. All rhodopsins identified to date using both these functional approaches belong to type-115,16.
To extend the search for uncharacterized distinct rhodopsins, we screened a fosmid library from a freshwater habitat (Lake Kinneret, Israel) in the presence of all-trans retinal using a pH microelectrode device adjusted to work in a high-throughput mode with a robotic system, combined with a search for coloured E. coli clones. One clone—fosmid KIN48C12—yielded reddish E. coli cells (Fig. 1a) and membranes (Fig. 1b) only when all-trans retinal was added, but with no apparent signal of light-dependent pH change. BLAST17 analysis of the complete 31-kb fosmid (of predicted actinobacterial origin; GenBank accession number MF737519) failed to identify any open reading frame with similarity to rhodopsins. Transposon Tn5 mutagenesis pinpointed an area suspected to contain an open reading frame that codes for a hypothetical protein with no detectable sequence similarity to known rhodopsins (see Methods), but which contains seven predicted transmembrane helices and a lysine in the seventh helix (Fig. 1c and Extended Data Fig. 1a). Searching the protein and nucleotide sequence databases of the NCBI (https://www.ncbi.nlm.nih.gov/) using this open reading frame sequence as the query identified numerous highly conserved but uncharacterized homologues in diverse bacteria and archaea (see below). Moreover, searches using sensitive, profile-based or structure-based methods (see Methods) revealed considerable similarities with diverse type-1 rhodopsins (Extended Data Fig. 1b and Supplementary Data 1). Thus, we conjectured that these predicted seven transmembrane proteins might represent a previously uncharacterized family of rhodopsin homologues. Consistent with this, these proteins formed a distinct clade in the phylogenetic tree of rhodopsins that could be separated confidently from type-1 rhodopsins (Fig. 2a), as was also observed using clustering by protein sequence similarity (Extended Data Fig. 2a).
Fig. 1 |. Heliorhodopsin 48C12.
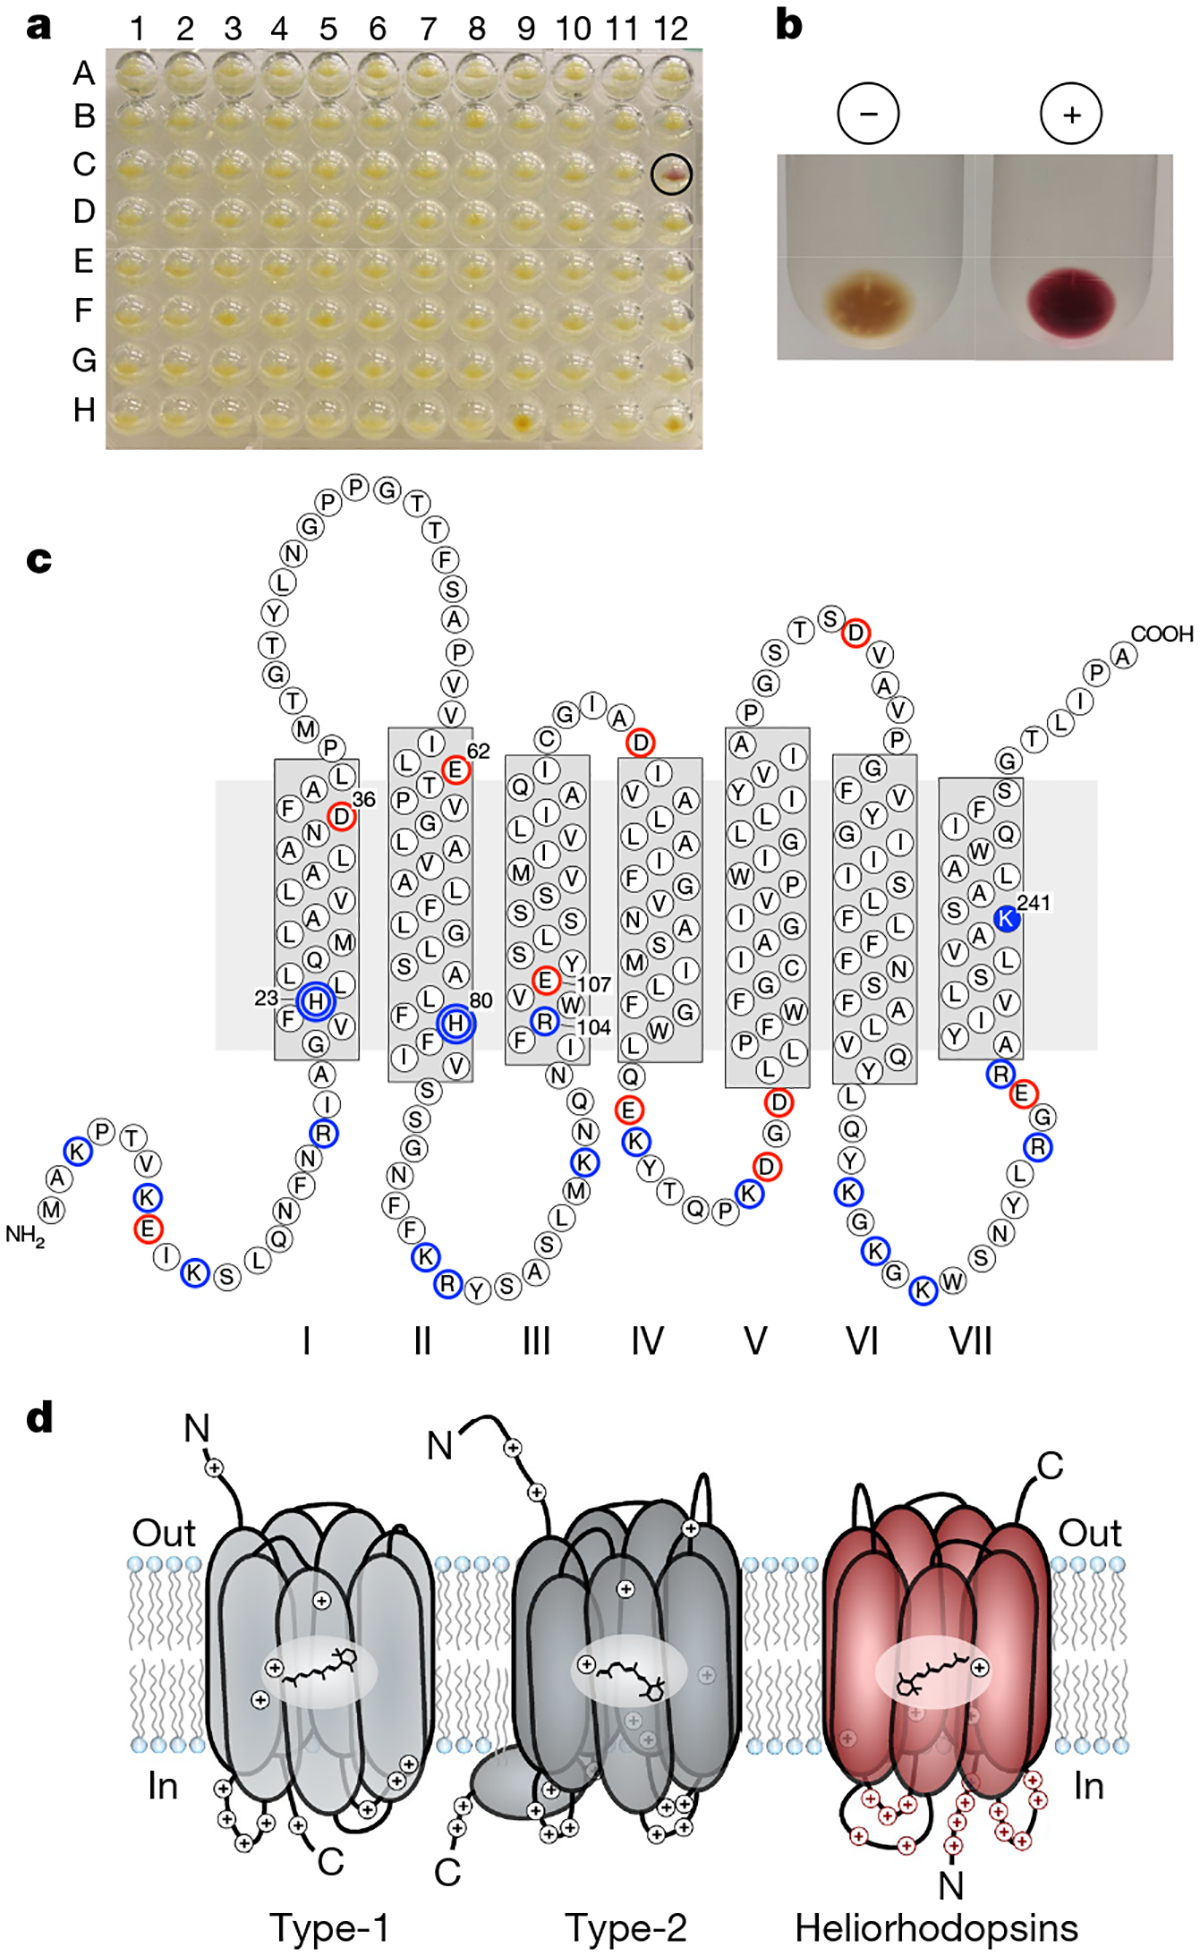
a, Fosmid clones from Lake Kinneret from 96-well plate number 48 in the presence of all-trans retinal. Clone KIN48C12 is circled. b, Membranes from E. coli containing fosmid KIN48C12 with (+) and without (−) 10 μM all-trans retinal. c, Predicted secondary structure of heliorhodopsin. The transmembrane helices in heliorhodopsin are marked I to VII to distinguish them from the seven transmembrane helices of type-1 and type-2 rhodopsins (which are routinely referred to as helices A-F and helices 1−7, respectively). Negatively charged residues are circled in red and positively charged residues are circled in blue (the proton-accepting groups H23 and H80 are marked with double blue circles), and the conserved lysine in TMVII is marked in solid blue. d, Schematic of membrane topologies of type-1 rhodopsin, type-2 rhodopsin and heliorhodopsins. The presentation of type-1 rhodopsin is based on proteorhodopsin6, and the type-2 rhodopsin is based on bovine rhodopsin23. N, amino-terminal tail, C, carboxy-terminal tail. Retinal shown for type-1 and heliorhodopsins is all-trans retinal, and for type-2 it is 11-cis retinal. Positively charged amino acids are marked.
Fig. 2 |. Microbial rhodopsins.
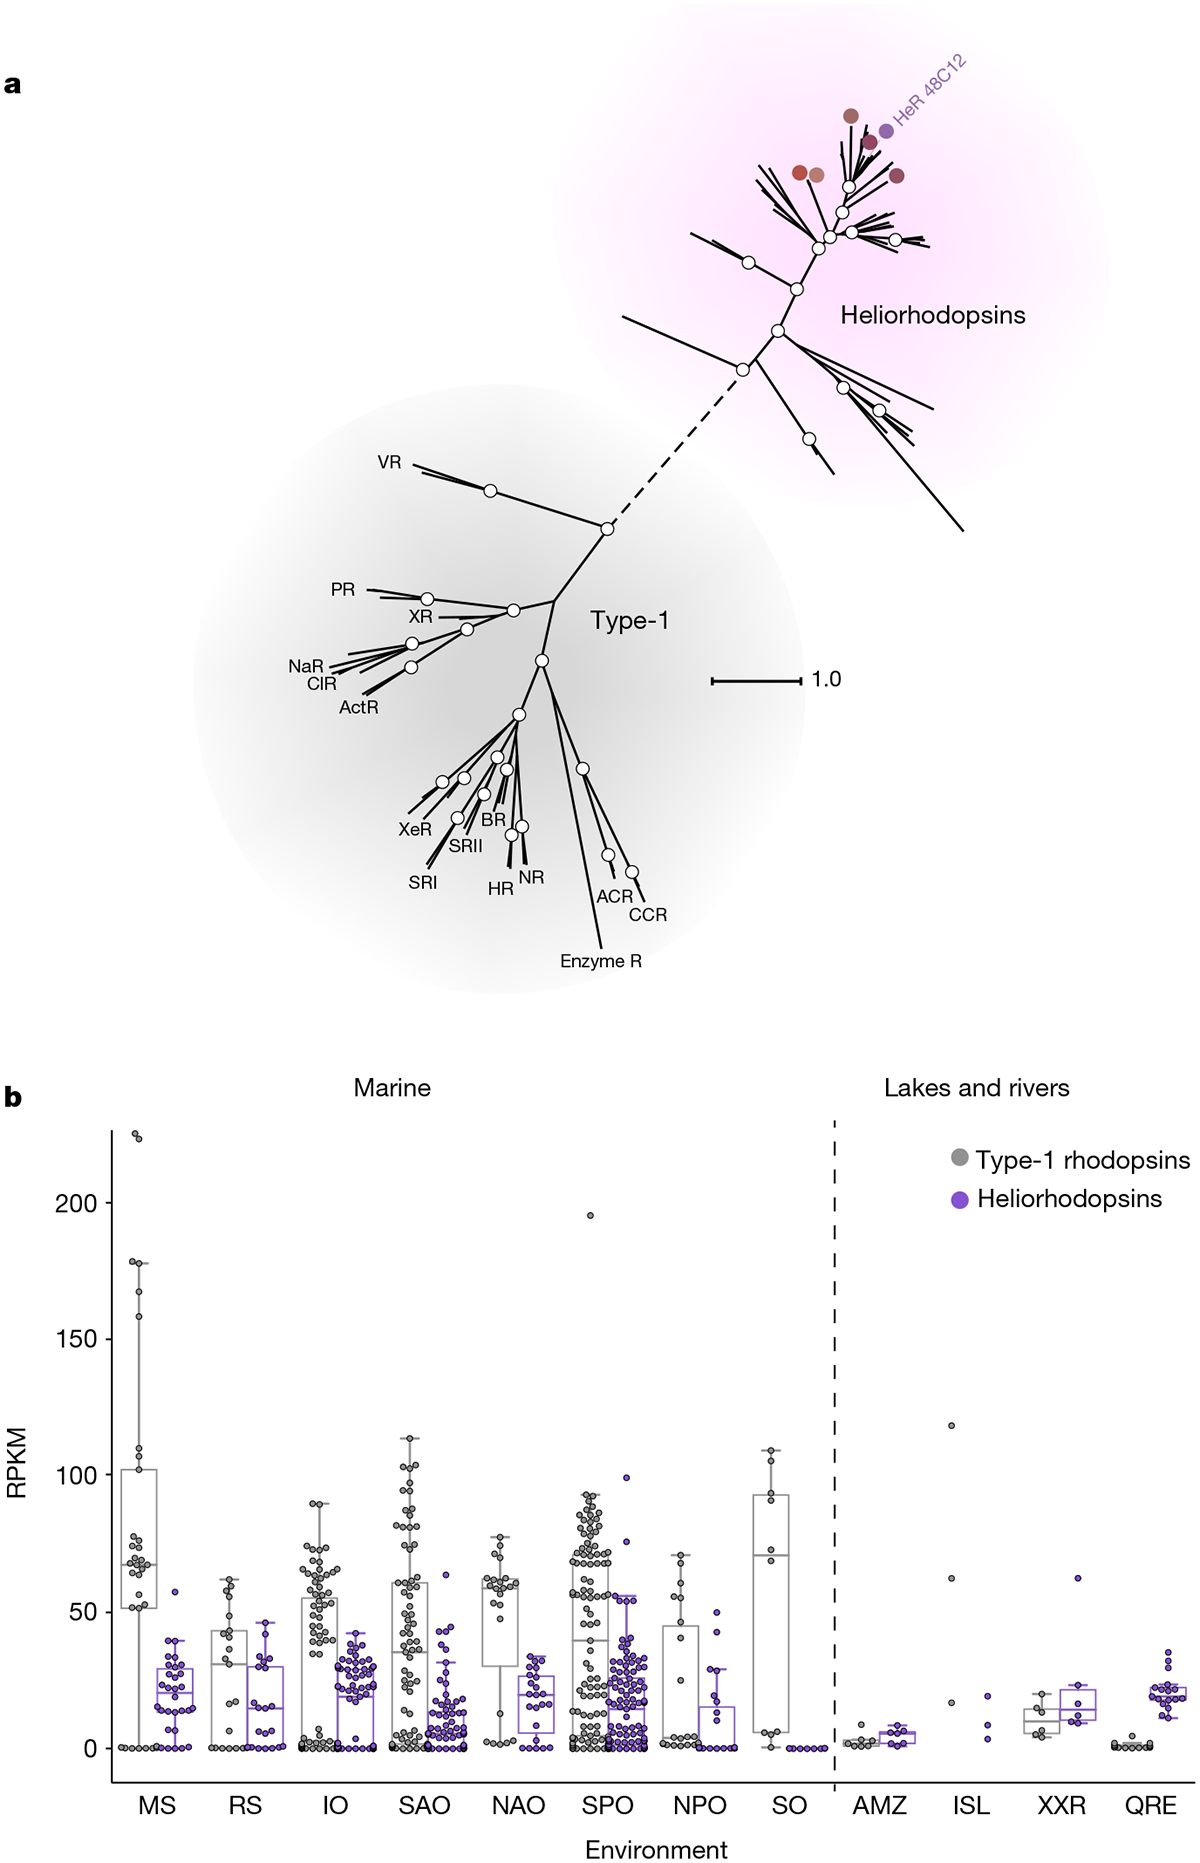
a, Unrooted phylogenetic tree for representative proteins from heliorhodopsins and type-1 rhodopsins. Heliorhodopsin 48C12 (HeR 48C12) is indicated in purple. BR, bacteriorhodopsin; PR, proteorhodopsin; SRI, sensory rhodopsin I; SRII, sensory rhodopsin II; NaR, sodium-transporting rhodopsin; NR, Neorospora rhodopsin; ClR, chloride-transporting rhodopsin; HR, halorhodopsin; ActR, actinobacteria rhodopsin; XeR, xenorhodopsin; XR, xanthorhodopsin; VR, viral rhodopsin; CCR, cation channelrhodopsin; enzyme R, enzyme rhodopsin; ACR, anion channelrhodopsin. Coloured circles indicate heliorhodopsins expressed in this study. White circles represent bootstrap values of >80%. The scale bar indicates the average number of amino acid substitutions per site. See Supplementary Data 2 for alignment and Supplementary Data 3 for the tree. b, The relative abundance of type-1 rhodopsins and heliorhodopsins (depicted in grey and purple, respectively), presented in reads per kilobase per million (RPKM), was measured in marine metagenomes that correspond to bacterial, giant virus and viral fractions collected during the Tara Oceans expedition (n = 382 metagenomes in total) and selected non-marine metagenomes (n = 33). Distribution of the abundances are shown as box plots, whiskers include observations within 1.5× interquartile range of the upper and lower quartiles. If the number of samples was less than five per group, individual dots are presented. MS, Mediterranean Sea; RS, Red Sea; IO, Indian Ocean; SAO, South Atlantic Ocean; NAO, North Atlantic Ocean; SPO, South Pacific Ocean; NPO, North Pacific Ocean; SO, Southern Ocean; AMZ, Amazon lakes24; ISL, Iranian Saline Lakes; XXR, Xiangxi River25; QRE, Queensland river estuaries.
Most of the automatically generated alignments between type-1 rhodopsins and the group of proteins identified here included only the region that encompasses transmembrane helix 2 (TM2) to TM7, whereas the upstream sequences—which include TM1 and the N-terminal region—failed to align. This appears to be caused by the presence of a long loop that is inserted between TM1 and TM2 in the proteins of the family reported here, as well as by possible structural differences in the N-terminal region (Extended Data Fig. 1b). Indeed, the membrane orientation of these proteins was predicted to be opposite to that of type-1 and type-2 rhodopsins—that is, with the N terminus in the cytoplasm (Fig. 1d and Extended Data Fig. 3a). The inverted membrane topology was confidently predicted for all members of this family and was validated experimentally using a series of β-lactamase gene fusions18,19 (Extended Data Fig. 3b and Methods). These findings indicate that the identified family of predicted seven transmembrane proteins represents a distinct major group of rhodopsins, which we denote the heliorhodopsins (helios, ‘sun’, plus ‘rhodopsin’, abbreviated as HeR).
Heliorhodopsins are present in bacteria, archaea, algae and algal viruses (Extended Data Fig. 2b). These microorganisms include psychrophiles, mesophiles and even hyperthermophiles, originating from soil, freshwater, marine and hypersaline environments. Heliorhodopsins are highly abundant and globally distributed in aquatic environments, and were readily detected in samples from the Mediterranean Sea and Red Sea, and the Indian Ocean, Atlantic Ocean and Pacific Ocean, as well as freshwater environments (Fig. 2b). Depth profiles of heliorhodopsin abundance in different marine stations from the Tara Oceans expedition20,21 (Extended Data Fig. 2c) show that—as with type-1 rhodopsins—heliorhodopsins are largely constrained to the photic zone, which suggests that they are involved in light-capture activity.
Illumination of a cell suspension of E. coli expressing heliorhodopsin from fosmid KIN48C12 did not show a detectable pH change of external solvent (Fig. 3a), which was also the case for other heliorhodopsins (Extended Data Fig. 4a). Electrophysiological measurements on mammalian cultured ND7/23 cells expressing heliorhodopsin 48C12 also showed no ion transport under any membrane potentials (Fig. 3b and Extended Data Fig. 4b). These results suggest that heliorhodopsins do not function as ion transporters or channels.
Fig. 3 |. Molecular properties of heliorhodopsin 48C12.
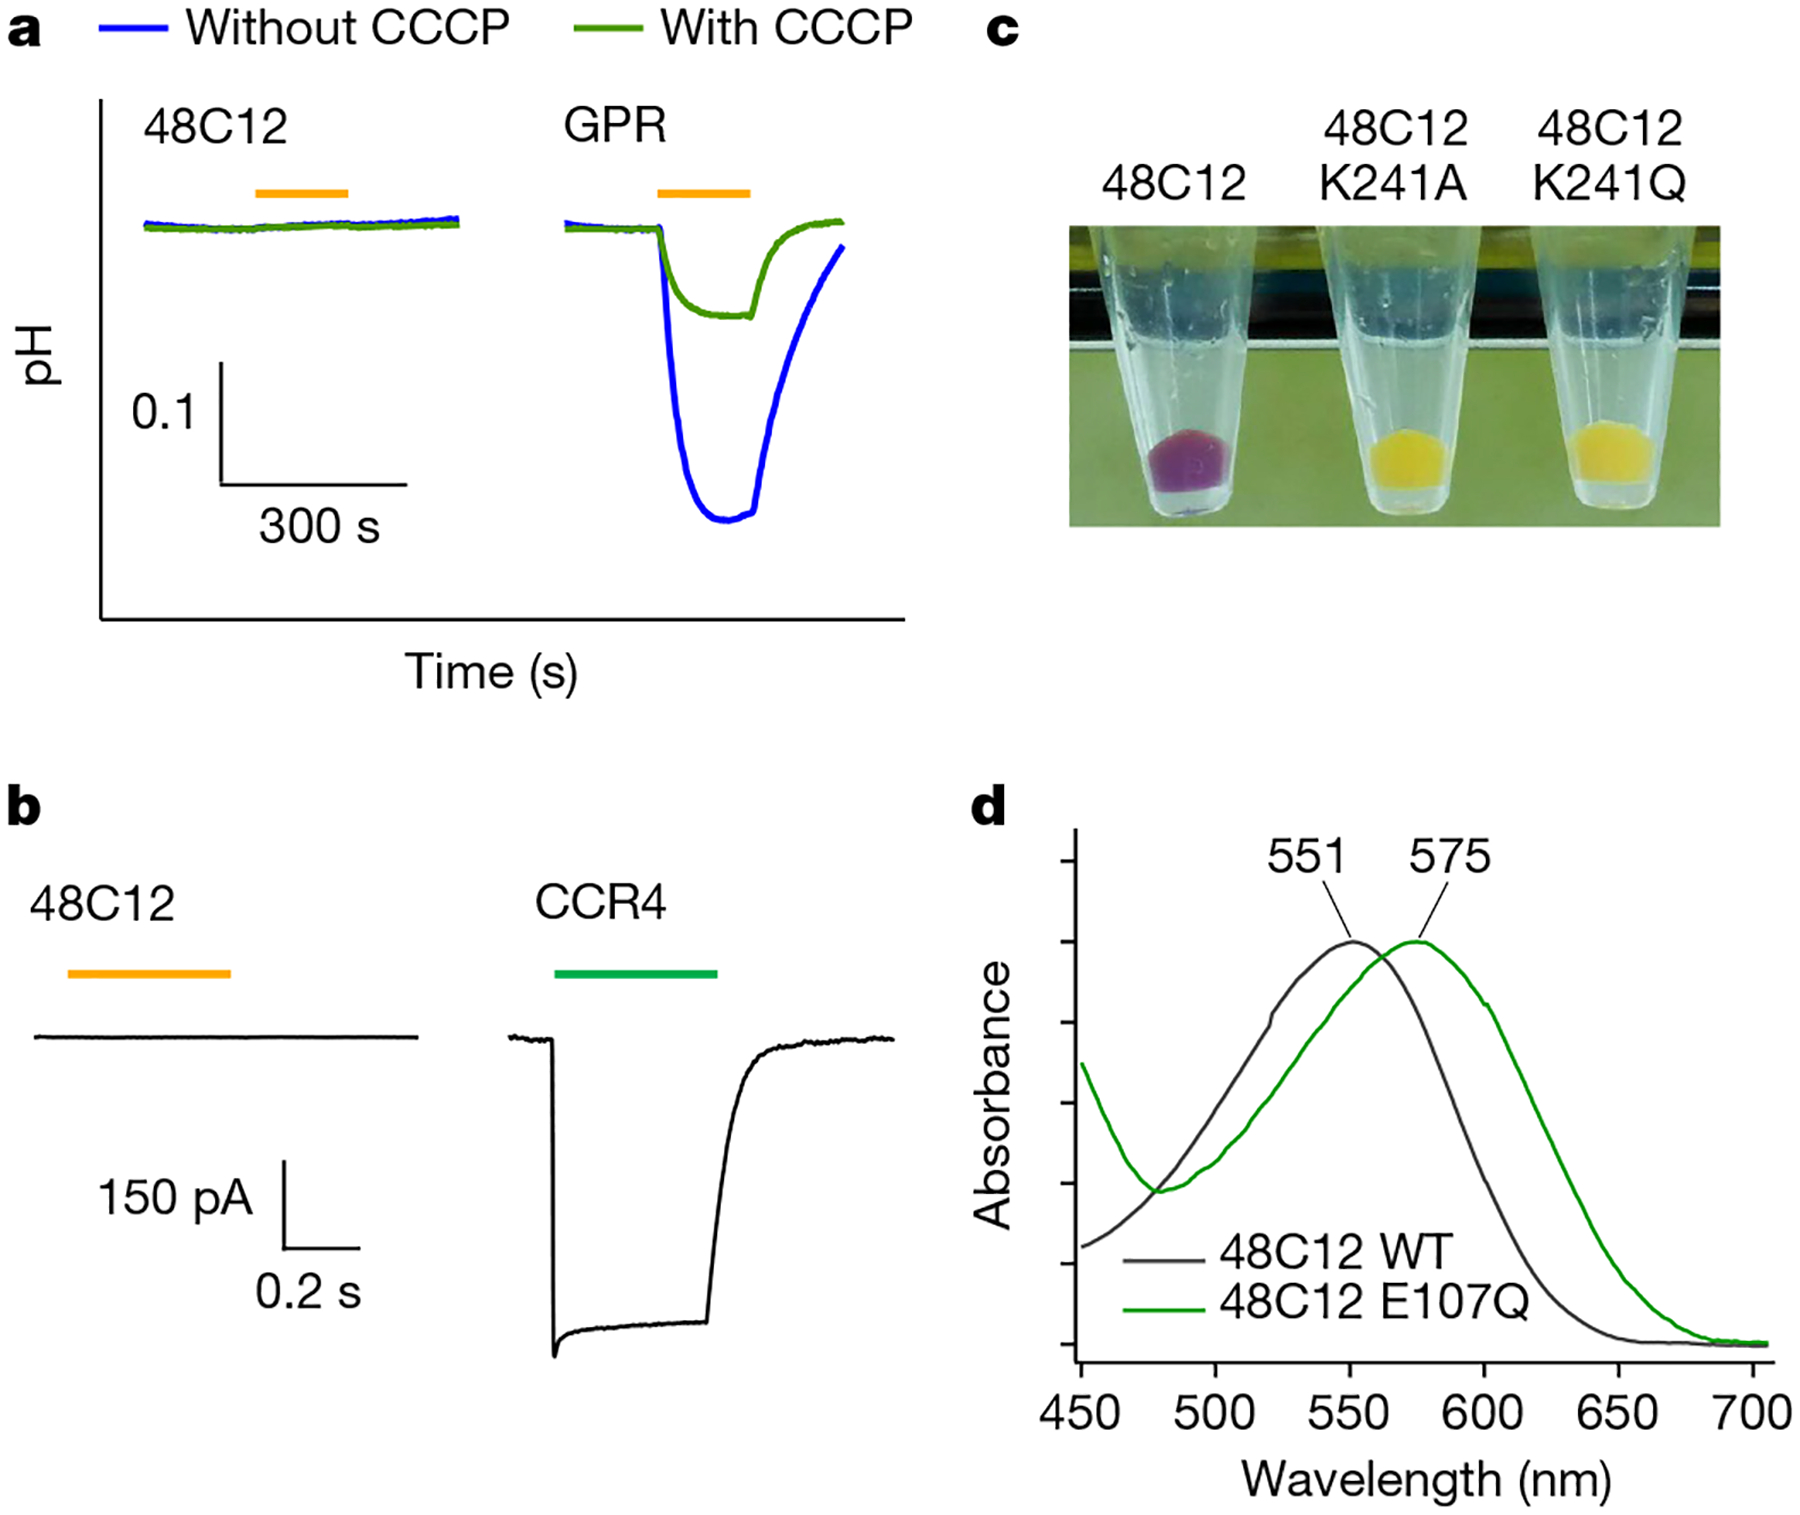
a, Ion transport activity assay of heliorhodopsin 48C12 by observing the pH changes of E. coli cell suspensions, and comparison with type-1 rhodopsin (a light-driven proton-pump proteorhodopsin, green-absorbing proteorhodopsin GPR) in the absence and presence of the protonophore (carbonyl cyanide m-chlorophenyl hydrazone (CCCP)). Light was present for the time region indicated by the orange bars. b, Electrophysiological measurements of heliorhodopsin 48C12 by observing photocurrents on ND7/23 cells, and a comparison with type-1 rhodopsin (a channelrhodopsin from Guillardia theta (Gt)CCR4). The membrane potential was held at −60 mV and light was present for the time region indicated by the orange or green bar (550 nm for heliorhodopsin 48C12 and 520 nm for CCR4, n = 10 cells). c, E. coli cells expressing heliorhodopsin 48C12 wild type, as well as the K241A and K241Q mutants. d, Absorption spectra of heliorhodopsin 48C12 and the E107Q mutant.
We then characterized the molecular properties of heliorhodopsin 48C12 by constructing the protein with a 6× His-tagged N terminus. The secondary structure and alignment examination (Fig. 1c and Extended Data Fig. 1b) suggest that the conserved K241 in TM7 is the retinal-binding residue, and the loss of purple colour in K241A and K241Q mutants is consistent with this prediction (Fig. 3c). The protein expressed in the E. coli membrane showed an absorption peak at 551 nm (Fig. 3d), and the spectral red-shift for the E107Q mutant (Fig. 3d) suggests that the conserved E107 in TM3 (Fig. 1d) is the counterion of the protonated Schiff base, as in type-1 rhodopsins. From pH titration, the pKa was determined to be 11.5 for the Schiff base (Extended Data Fig. 5a) and 3.7 for E107 (Extended Data Fig. 5b). A high-performance liquid chromatography analysis showed that most of the retinal (>97%) bound to heliorhodopsin 48C12 adopts an all-trans configuration in the dark, whereas the proportion of the 13-cis form increased upon illumination (Extended Data Fig. 6). These molecular properties are essentially similar to those of type-1 rhodopsins2.
Transient absorption measurements (Fig. 4a) detected major accumulation of the blue-shifted M intermediate at 401 nm, followed by the appearance of the red-shifted O intermediate at 629 nm. Kinetic measurements showed that the photocycle of heliorhodopsin 48C12 is very long (about 5 s) (Fig. 4b). Among type-1 rhodopsins, a long photocycle is commonly observed in sensory rhodopsins, which is apparently advantageous for the interaction with transducer proteins1,3. The long photocycle of heliorhodopsin 48C12 and other heliorhodopsins (Extended Data Fig. 7b, c) suggests that they function as a distinct type of signalling photoreceptor. The heliorhodopsin 48C12 photocycle is summarized in Extended Data Fig. 7a; despite the distant relationship between heliorhodopsins and type-1 rhodopsins, they produce similar photocycle intermediates.
Fig. 4 |. Photocycle of heliorhodopsin 48C12.
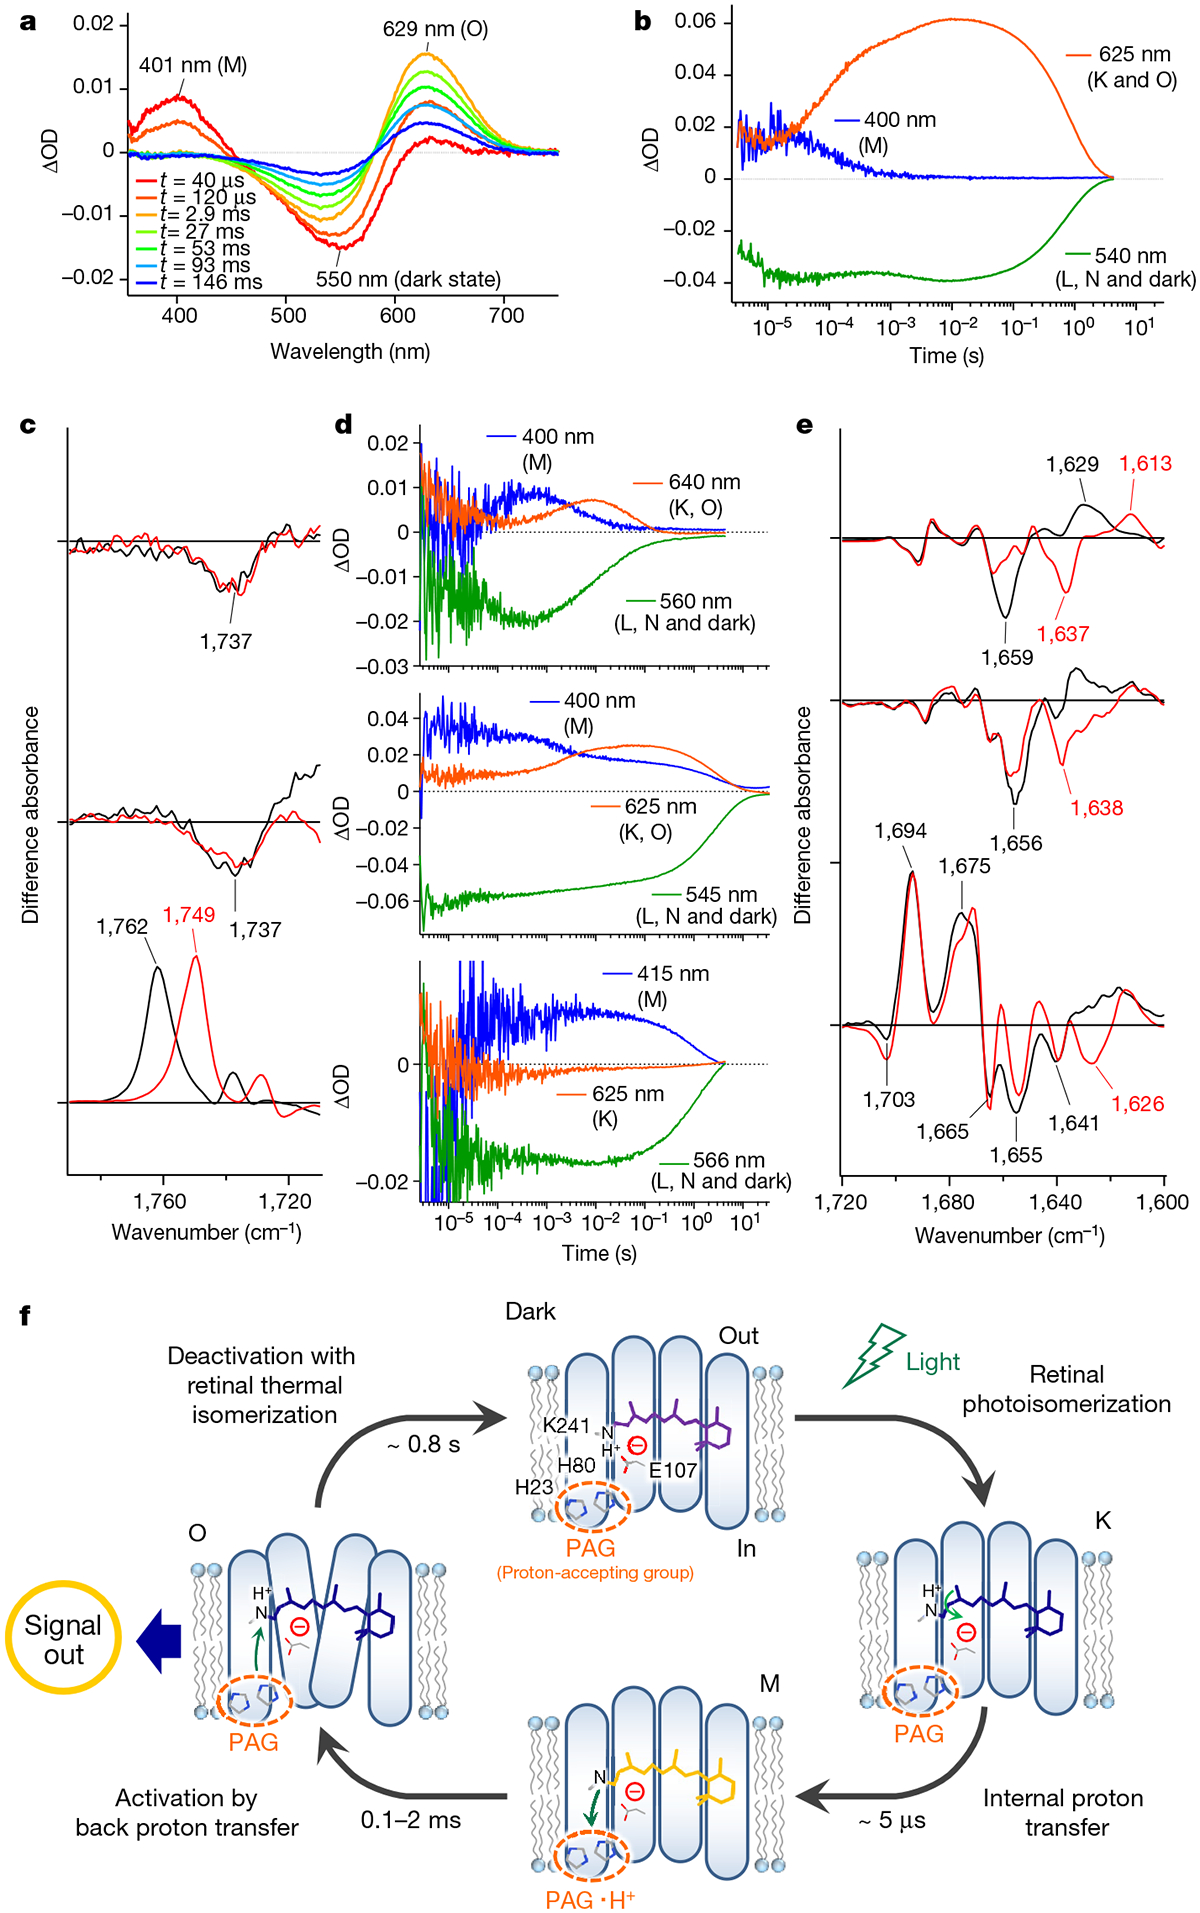
a, Transient absorption spectra of heliorhodopsin 48C12 excited at λpump = 532 nm. OD, optical density. b, Time evolutions of transient absorption change at specific wavelengths. Each of the wavelengths probes different photochemical species: 400 nm for the M intermediate; 540 nm for the L and N intermediates, and bleached dark state; and 625 nm for the K and O intermediates. c, Light-induced difference FTIR absorption spectra of heliorhodopsin 48C12 at 240 K (top spectrum) and 277 K (middle spectrum), and bacteriorhodopsin at 250 K (bottom spectrum) in the region of 1,790−1,710 cm−1, in which the intermediates produced are the M and O intermediates of heliorhodopsin 48C12 and the M intermediate of bacteriorhodopsin, respectively. Spectra are measured in H2O (black) and D2O (red). d, Time evolutions of transient absorption change at specific wavelengths for heliorhodopsin 48C12 E107Q (top), H23F (middle) and H80F (bottom) mutants. e, Light-induced difference FTIR absorption spectra of heliorhodopsin 48C12 at 77 K (top spectrum), 240 K (middle spectrum) and 277 K (bottom spectrum) in the region of 1,720−1,600 cm−1. Spectra are measured in H2O (black) and D2O (red). f, Photoreaction cycle of heliorhodopsin 48C12. The chromophore retinal isomerizes from all-trans to 13-cis form upon illumination (dark-to-K). Then, the proton of the retinal Schiff base is transferred to the proton-accepting group (PAG), which is probably composed of several amino acid residues that include H23 and H80 (K-to-M). The proton returns to the Schiff base and a large conformational change of protein moiety occurs on the O (M-to-O). The conformational change is expected to generate an inter-protein signal to an unidentified counterpart protein. Finally, the protein returns to the dark state and deactivation occurs by retinal thermal isomerization (O-to-dark).
We next studied the structural dynamics of heliorhodopsin 48C12 using low-temperature Fourier-transform infrared (FTIR) spectroscopy. We successfully trapped K, M and O intermediates at 77, 240 and 277 K, respectively (Extended Data Fig. 8a). Retinal vibrations that are similar to those of the type-1 rhodopsin bacteriorhodopsin (Extended Data Fig. 8b) suggest that the primary photochemical reaction of heliorhodopsin is the all-trans to 13-cis isomerization. The M formation corresponds to the Schiff base deprotonation, which accompanies protonation of the counterion in many type-1 rhodopsins2. Positive peaks at 1,762 cm−1 (wavenumbers per cm) in H2O and 1,749 cm−1 in D2O originate from the D85 protonation signal in bacteriorhodopsin22 (Fig. 4c, bottom spectrum), but this signal was absent for the M and O intermediates of heliorhodopsin 48C12 (Fig. 4c, top and middle spectra). This observation indicates that E107, the Schiff base counterion, does not act as the proton acceptor for the Schiff base. The formation of the M intermediate during the photocycle of the E107Q mutant (Fig. 4d, top and Extended Data Fig. 9a) is consistent with the FTIR and findings with results of other carboxylate mutants (Extended Data Fig. 9d–f). The Schiff base proton might be transiently released to the aqueous phase, whereas the transient pH change of the solution, using a pH-sensitive dye, was observed for proteorhodopsin but not for heliorhodopsin 48C12 (Extended Data Fig. 10). Thus, there must be an internal proton acceptor. Flash photolysis analysis of the H23F and H80F mutants showed that photocycles substantially slowed in both mutants, and that H80F failed to produce the O intermediate (Fig. 4d, middle and bottom, and Extended Data Fig. 9c). The M formation was observed for both H23F and H80F, which indicates that neither of these histidines is the proton acceptor and that both are important for the proton transfer reaction. Indeed, both H23 and H80 are conserved among most heliorhodopsins (Extended Data Fig. 1a and Supplementary Data 2).
If heliorhodopsin is a photosensor, the long-lived O intermediate is a good candidate for the signalling state in which protein structural changes are expected to occur. This is indeed the case; compared to the K and M intermediates, amide-I vibrations largely alter in the O intermediate, indicating extensive conformational changes. Based on the present results, we propose a photocycle dynamics model for heliorhodopsins (Fig. 4f). All-trans retinal is bound to K241 through the protonated Schiff base linkage, and E107 forms an ion pair. The primary reaction is the retinal isomerization from the all-trans to the 13-cis form in the K intermediate. The Schiff base proton is transferred to the proton-accepting group (PAG) in the M intermediate, which involves H23 and H80 but not E107. Thus, the PAG is probably located within the N-terminal region of heliorhodopsins that faces the cytoplasmic side, given that the membrane topology of heliorhodopsins is opposite to that of type-1 and type-2 rhodopsins. The O intermediate is formed by the transfer of a proton back from the PAG to the Schiff base, and the substantially altered protein conformation is the active state for signal transduction.
Heliorhodopsins described here were initially detected using functional metagenomics. This discovery calls for further exploration in search of novel pigments, including those not based on retinal chromophores, using the same screening strategies or additional functional assays.
METHODS
DNA sampling and library preparation.
Sampling was performed on 1 September 2015 at 10:00 in Lake Kinneret, Station A (32° 49.27792 N, 35° 35.34253 E). Forty litres of water from 3-m depth were filtered through GF/D filters (Whatman) and collected on a 0.22-μm Durapore filter (Millipore). The Durapore filter was suspended in lysis buffer (50 mM Tris-HCl, pH 8.0, 40 mM EDTA, pH 8.0, 0.75 M sucrose) and frozen using liquid nitrogen. DNA was extracted from the filter using a phenol–chloroform protocol26.
Fosmid libraries were constructed with a pCC1Fos copy control library kit according to the manufacturer’s protocol (Epicentre Biotechnologies, Cat. No. CCFOS110), and 75 96-well plates were stored in 7% LB-glycerol at −80 °C.
Proton-pumping activity assay and colour screen.
Cells were inoculated from a fully thawed library plate into two 96-well 2.2-ml plates (ABgene, Cat. No. AB-0932) filled with 1 ml LB (supplemented with 25 μg/ml chloramphenicol, CopyControl fosmid autoinduction solution and 15 μM all-trans retinal) in each well, and grown at 30 °C with shaking at 700 r.p.m. for 17 h covered by an AeraSeal air-permeable sheet (EXCEL Scientific). Cells were collected by 5 min centrifugation at 3,000× RCF (Sigma 4–16KS centrifuge) and washed twice with 0.5 ml minimal salt solution (10 mM NaCl, 10 mM MgSO4 and 100 μM CaCl2). Finally, cells from both plates were re-suspended in 150 μl (final volume) minimal salt solution in dark well plates with a transparent bottom (Greiner Bio-One, Cat. No. 655096). Cells were allowed to settle for 10 min in the dark at room temperature, after which a functional screening was performed using a customized robotic system (TECAN), as follows: eight pH electrodes (Sentek, Cat. No. P13/2.5M/BNC) were measured by a multi-parameter analyser (Consort, model 3060). Changes in pH were logged every 1 s for 3 min of dark, followed by 2 min of illumination by 2 LED lights: warm white light (2,600–3,700 correlated colour temperature, spanning 420–700 nm, with intensity 12 Lm, Cree) and a blue light (485 nm peak, intensity 10.7 Lm, Cree), constituting all the visible spectrum under each well. The dark–light cycles were measured twice to confirm consistency. Eight wells were measured simultaneously, each well illuminated by 2 LED lights with a distance of 17 mm between the LEDs and the cells, a setup constructed by Neotec Scientific Instrumentation. Each well received a light intensity of 450 μE. Clones suspected of proton-pumping activity were isolated and repeated.
Plates showing colour phenotype were re-screened by colour-optimized protocol; they were inoculated into U-shaped-bottom 96-well plates (Thermo Scientific Cat. No. 163320) containing 150 μl LB supplemented with 25 μg/ml chloramphenicol and CopyControl fosmid autoinduction solution and shaken overnight at 30 °C and 700 r.p.m. In the morning, the plate was left to rest for 4 h at 37 °C with all-trans retinal (40 μg/ml final). To observe the colour, cell pellets were collected by 5 min of centrifugation at 3,000× RCF (Sigma 4–16KS centrifuge) and LB was removed. Positive clones were subjected to Tn5 transposition in vitro, using the manufacturer’s protocol (EZ-Tn5<KAN-2> Insertion Kit Cat. No. EZI982K, Epicentre).
E. coli membrane preparation.
A fresh colony of KIN48C12 was inoculated into 200 ml LB (supplemented with 25 μg/ml chloramphenicol and CopyControl fosmid autoinduction solution) and shaken overnight at 200 r.p.m. in a 500-ml Erlenmeyer. All-trans retinal (15 μg/ml final) was added, and the culture was shaken at 200 r.p.m. for 4 h at 37 °C. Cells were collected by centrifugation and washed twice with 10 ml buffer A (50 mM Tris-Cl pH 8 and 5 mM MgCl2). Cells were resuspended in 25 ml buffer A and disrupted by 3 passes in a micro-fluidizer at 50 psi. Whole cells were removed by 10 min of centrifugation at 3,000× RCF (Sigma 4–16KS centrifuge). Membrane containing supernatant was centrifuged for 1 h at 30,000 r.p.m. (Beckman Coulter Optima L-90K Ultracentrifuge) to pellet the membranes.
Cloning of heliorhodopsin 48C12 into expression vector.
The suspected heliorhodopsin open reading frame was cloned into pET-9d (Novagen) as three constructs; an N-terminal 6× His tag (primers 45–47), a C-terminal 6× His tag (primers 46–48) and no His tag (primers 46–47), using custom primers (Supplementary Table 4).
PCR was performed according to the manufacturer’s protocol (TAKARA Ex-Taq) with 30 s of denaturation at 98 °C, 30 s of annealing at 55 °C and 1 min of elongation at 72 °C, for 28 cycles. pET-9d vector and PCR products were double-digested using NcoI and BamHI (New England BioLabs), and ligated using T4 DNA ligase (Thermo Scientific) overnight at 4 °C. All manipulations were performed using E. coli strain DH10B. For expression, sequence-verified clones were transformed into E. coli strain BL21(DE3), grown overnight, induced 3 h with IPTG (0.4 mM final) and then supplemented with all-trans retinal (40 μg/ml final) for 3 additional hours.
Heliorhodopsin 48C12 membrane-topology analysis.
The first heliorhodopsin–β-lactamase fusion construct (G51blaM Extended Data Fig. 3b, containing TM1 fused to TEM β-lactamase (amplified from pGEM-T-easy, primers number 11 and 12; Supplementary Table 5)) was designed according to previously published methods18,19 and constructed using Gibson assembly27,28 with NEB Gibson Assembly Master Mix, according to the manufacturer’s protocol (see primers 2–5 in Supplementary Table 5 for the primers used). All other fusions were constructed by cutting construct G51blaM with NcoI and SacI (cutting out TM1) and inserting PCR products (cut with NcoI and SacI) that spanned various regions of heliorhodopsin (see Supplementary Table 5 and Extended Data Fig. 3b), which produced the constructs A94blaM, D127blaM, K155blaM, G184blaM and G222blaM. All manipulations were performed using E. coli strain DH10B. Sequence-verified clones were transformed into E. coli strain BL21(DE3) and grown on ampicillin (100 μg/ml) according to previously published methods18,19.
Sequencing and annotations.
Library preparation was done using the Nextera XT sample prep kit (Illumina) according to manufacturer’s protocol. The sequencing of the 75 paired-end run was done using HiSeq 2500 (Illumina) rapid mode, using rapid V2 reagents (Illumina). De novo assembly was done by SPAdes 3.5.029 using default parameters after elimination of host sequences (library bacterium E. coli EPI300).
Protein analyses.
The non-redundant nucleotide and amino acid sequence databases of the NCBI were searched for sequence similarity to heliorhodopsins using BLASTX17, PSI-BLAST17 and CD-blast30. Profile–profile sequence similarity searches were performed using HHpred31,32, and structure-based searches were performed using Phyre233 with default parameters. Multiple alignments of protein sequences were constructed using MUSCLE34. The prediction of transmembrane helices and membrane orientation of proteins was performed using TMHMM35, Phobius36, Philius37 and SPOCTOPUS38.
In haloarchaea and in bacteria, type-1 sensory rhodopsins form essential complexes with membrane-associated transducer proteins, such as the haloarchaeal HtrI and HtrII proteins, or soluble transducers, such as the 14-kD protein (ASRT) in Anabaena1,2. No homologues of these transducers or any other conserved genes were identified in the vicinity of the heliorhodopsin genes, which suggests that there are substantial differences between the light-sensing signal transduction pathways of type-1 rhodopsins and those of heliorhodopsins.
Heliorhodopsins may share common ancestry with type-1 rhodopsins but the sequence similarity between the two families is low, and there is a major structural difference that results in opposite membrane topologies and substantial differences in photobiology. Heliorhodopsins were detected in numerous microbial groups that were not previously known to sense light—for example, in the archaeal orders Thermococcales, Methanococcales and the recently described Asgard group39; in the bacterial phylum Thermotogales; and in the candidate phyla Saccharibacteria (TM7), Kerfeldbacteria, Woykebacteria, Levybacteria and Berkelbacteria40,41—thus markedly expanding the diversity of known light-processing microorganisms. Heliorhodopsins are completely missing in cultured Proteobacteria, a phylum in which numerous type-1 rhodopsins are detected. The major differences between type-1 rhodopsins and heliorhodopsins, and their broad and partially complementary distributions among bacteria and archaea, imply that the divergence between these two families is one of the earliest events in the evolution of the seven transmembrane proteins.
Phylogenetic trees.
Maximum likelihood phylogenetic trees were constructed using phylogeny.fr pipeline42, which included PhyML v3.043 with various substitution models for amino acids (see legend of Fig. 1 and Supplementary Data 3–8), and 100 bootstrap replicates.
Metagenomic analysis.
Metagenomes from different environments, including samples collected from freshwater, hot springs, oceans, and saline lakes, were downloaded from the ENA-EMBL using the Aspera Connect (Emeryville) ascp client (version 3.7.4). Accession numbers of the analysed metagenomes can be found in Supplementary Table 1.
Reads from each metagenome were aligned using DIAMOND (version 0.9.10)44 in the ‘blastx’ mode (aligner options:–top 3 –evalue 0.00000001 -b1.0) against a rhodopsin DIAMOND database containing 89 protein sequences from type-1 rhodopsin and heliorhodopsin representatives (Supplementary Table 2).
Reads from DIAMOND alignments with at least 20 amino acids of alignment length and 50% identity were retrieved for a second DIAMOND ‘blastx’ analysis against a database composed of the UniRef clusters (http://www.uniprot.org, accessed on 15 September 2017)45.
A list of UniRef45 clusters containing type-1 rhodopsins or heliorhodopsins was compiled from the DIAMOND alignment of UniRef45 clusters to the rhodopsin DIAMOND database using DIAMOND in the ‘blastp’ mode (aligner options:–more-sensitive –max-target-seqs 0 -b2.0), assigning the clusters to type-1 rhodopsins or heliorhodopsins on the basis of the best DIAMOND hit; alignments with less than 25% identity were classified on the basis of manual inspection of the cluster representative protein sequence. The list of UniRef45 rhodopsin clusters (Supplementary Table 3) was used to curate the metagenomic alignments to remove the false positives.
The number of aligned reads from the curated alignment results for each sample were normalized by sampling depth and gene length to calculate RPKM using the package pandas (version 0.20.1)46 in Python (version 3.6.0) (https://www.python.org). Normalized results were visualized using an in-house Jupyter notebook47 with the packages pandas and Seaborn (version 0.8.0, https://seaborn.pydata.org/index.html). For the depth-abundance profile, RPKM counts from the Tara Oceans metagenomes20,21 were grouped in 50-m bins according to the sampling depth.
Pump-activity assay of rhodopsins.
The light-driven pump-activity assay was carried out according to previously reported protocols48,49. The number of E. coli cells expressing rhodopsins was estimated by the apparent optical density at 660 nm (OD660), and 15 OD660·ml cell culture was used for the experiment. The cells were washed with unbuffered 100 mM NaCl solution three times and resuspended in the same solution. The cell suspension was placed in the dark and then illuminated at λ > 500 nm by the output of 1-kW tungsten–halogen projector lamp (Rikagaku) through a glass filter (Y-52, AGC Techno Glass). The light-induced pH changes were measured with a pH electrode (HORIBA). Measurements were repeated under the same conditions with addition of 10 μM CCCP, a protonophore molecule.
Heterologous expression in ND7/23 cells.
The gene from fosmid KIN48C12 was subcloned in peGFP-N1 vector between 1,395 bp and 1,412 bp by In-Fusion HD cloning kit (Takara) to fuse GFP at the N terminus of 48C12. The plasmid carrying a cation channelrhodopsin, GtCCR4, has previously been described50. ND7/23 cells from DS Pharma Biomedical were cultured in high-glucose DMEM medium (Wako) in an incubator at 37 °C, 5% CO2. Transfection of ND7/23 cells, which are a hybrid of mouse neuroblastoma and rat neuron (the cell line is commercially available from Merck or DS Pharma Biomedical), was performed by Lipofectamine 2000 (Invitrogen). Cells were supplemented with 1 μM all-trans retinal (Sigma Aldrich). After transfection (16–24 h), electrophysiological study was performed.
Electrophysiology.
Patch-clamp measurement on ND7/23 cells (whole-cell mode) was performed as previously reported50. In brief, an Axopatch 200B amplifier (Molecular Devices) was used for recording. Continuous light was provided by a Xenon lamp, MAX-303 (Asahi spectra) with an appropriate band-pass filter, 520 nm or 550 nm (Asahi spectra), via a light guide into an inverted microscope, IX-70 (Olympus). Illumination was controlled by a mechanical shutter LS6S (Vincent Associates). The glass pipette resistance was between 2.0–3.5 MΩ. The pipette electrode was controlled by a micro manipulator, PCS-5000 (Burleigh instruments). Cells that showed bright GFP fluorescence on the cellular membrane were chosen for the measurement. Current traces were recorded at 10 kHz and filtered to 2 kHz by an internal circuit of the amplifier. Data acquisition and shutter triggering were performed by pClamp 9 software via a Digidata 1320 (Molecular Devices). The external solution contained 140 mM NaCl, 2 mM MgCl2, 2 mM CaCl2, 2 mM KCl, 10 mM Hepes–NaOH, pH 7.2. The internal solution contained 110 mM NaCl, 2 mM MgCl2, 1 mM CaCl2, 5 mM KCl, 10 mM EGTA, 10 mM HEPES–NaOH, pH 7.2.
Purification of heliorhodopsin 48C12.
The gene of heliorhodopsin 48C12 was subcloned into a pET9d-vector with N-terminal 6× His-tag. For mutagenesis, a QuikChange site-directed mutagenesis kit (Stratagene) was used according to a standard protocol. Wild-type and mutant proteins were expressed in E. coli C43(DE3) strain. Protein expression was induced by 1 mM isopropyl β-d-thio-galactopyranoside (IPTG) for 4 h at 37 °C, at which point 10 μM all-trans retinal (Sigma Aldrich) was supplemented in the culture. The expressed proteins were purified from E. coli cells using previously reported protocols45,51. The cells were disrupted by a French press (Ohtake) and the membrane fraction was collected by ultracentrifugation (125,000g, 1 h). The protein was solubilized with 2% n-dodecyl-β-d-maltoside (DDM) (Anatrace) in the presence of 300 mM NaCl, 5 mM imidazole and 50 mM MES (pH 6.5). After loading on Co2+-NTA affinity resin, the sample was washed extensively with buffer (50 mM MES, pH 6.5) containing 300 mM NaCl, 50 mM imidazole and 0.1% w/v DDM to remove non-specifically bound proteins. The histidine-tagged proteins were then eluted with elution buffer (0.1% DDM, 300 mM NaCl, 50 mM MES, pH 6.0 and 500 mM imidazole). The collected fractions were dialysed against a solution containing 50 mM Tris-HCl pH 8.5, 100 mM NaCl, 0.1% DDM to remove imidazole.
HPLC analysis of retinal configuration in heliorhodopsin.
The configuration of retinal bound in heliorhodopsin was analysed by high-performance liquid chromatography (HPLC) as previously described49,52. A silica column (6.0 × 150 mm; YMC-Pack SIL, YMC) was used for the analysis. We added hydroxylamine (final concentration of 500 mM) to 100 μl of 4 μM heliorhodopsin solution (100 mM NaCl, 20 mM Tris-HCl (pH 8.5)) on ice, and then the protein was denatured with 66% (v/v) methanol. The retinal in heliorhodopsin was released as retinal oxime and it was extracted with 600 μl of hexane. The extracted sample was analysed by HPLC (solvent composition: 12% (v/v) ethyl acetate and 0.12% (v/v) ethanol in hexane) with 1.0 ml/min flow rate. The molar composition of each retinal isomer was calculated from the ratio of the areas of corresponding peaks in the HPLC patterns. Each peak was assigned by comparing them with the HPLC pattern of retinal oximes obtained from authentic all-trans and 13-cis retinals. To analyse the retinal configuration of heliorhodopsin under illumination, the sample solution was illuminated with 540 ± 10 nm light for 1 min before the addition of hydroxylamine on ice. To estimate the experimental error, four identical measurements were performed for both the dark- and light-adapted samples.
pH titration.
To investigate the pH dependence of the absorption spectra of heliorhodopsin 48C12, about 6 μM protein was solubilized in 6-mix buffer (10 mM citrate, 10 mM MES, 10 mM HEPES, 10 mM MOPS, 10 mM CHES and 10 mM CAPS). Then, the pH was changed by addition of concentrated HCl or NaOH. The absorption spectra were measured with a UV-visible spectrometer (V-2400PC, SHIMADZU) at every approximately 0.5-pH change.
Laser-flash photolysis.
The transient absorption change after the photo-excitation of heliorhodopsins was investigated by laser-flash photolysis method45,51,53. The E. coli cells expressing heliorhodopsins were suspended in 100 mM NaCl, 20 mM Tris-HCl (pH 8.5). Then, the cells were treated with 1 mM lysozyme and disrupted by sonication for 10 min, three times. The large membrane fraction and undisrupted cells were removed by centrifugation (15,000 r.p.m., 10 min). The optical density of the suspension was adjusted to be 0.8–0.9 by dilution. The sample solution was illuminated with a second harmonics generation of a nano-second pulsed Nd3+-YAG laser (λ = 532 nm, INDI40, Spectra-Physics) with the pulse energy of 3.8 mJ/cm2· pulse. The transient absorption spectrum of rhodopsin after the laser excitation was obtained by measuring the intensity of white light that passed through the sample before and after laser excitation at λ = 350–750 nm with an ICCD linear array detector (C8808–01, Hamamatsu). To increase the signal-to-noise ratio, 60–90 identical spectra were averaged and singular value decomposition analysis was applied45. The time evolution of transient absorption change at specific wavelengths after photo-excitation was measured by monitoring the change in intensity of the monochromated output of an Xe arc lamp (L9289–01, Hamamatsu Photonics) passed through the sample suspension by a photomultiplier tube (R10699, Hamamatsu Photonics) equipped with a notch filter (532 nm, bandwidth = 17 nm, Semrock) to remove scattered pump pulse. The signals were monitored and stored by a digital oscilloscope (DPO7104, Tektronix). We averaged 50–100 identical signals.
The observation of proton release and uptake by rhodopsin was carried out by measuring transient absorption change of the pH-indicating dye, cresol red54. To minimize the buffering effect by the solvent, we removed any buffer from the solvent (0.1% n-dodecyl-β-d-maltoside (DDM) and 100 mM NaCl) and the pH was adjusted to about 8.1, close to pKa of cresol red, by addition of NaOH. The transient absorption change of cresol red was obtained by subtracting the transient absorption signals at 429 and 573 nm (representing the protonated and deprotonated form of cresol red, respectively) obtained without cresol red from those obtained with 20–30 μM cresol red.
FTIR spectroscopy.
Low-temperature light-induced difference FTIR spectroscopy was performed as previously described55,56. The purified proteins of heliorhodopsin 48C12 were reconstituted into a mixture of POPE and POPG membrane (molar ratio = 3:1) with a protein-to-lipid molar ratio of 1:50 by removing DDM with Bio-Beads (SM-2, Bio-Rad). The reconstituted samples were washed three times with 1 mM NaCl and 2 mM Tris-HCl (pH 8.5) or 2 mM CAPS–NaOH (pH 10.0). The pellet was resuspended in the same buffer, in which the concentration was adjusted to 1.7–2.5 mg/ml. A 60-μl aliquot was placed onto a BaF2 window and dried with an aspirator. The films were then rehydrated with 2 μl H2O or D2O, and the sample was placed in an Oxford DN-1704 cryostat mounted in the Bio-Rad FTS-40 spectrometer. For the formation of the K intermediate, samples were illuminated with 540 nm light (interference filter) from a 1-kW halogen–tungsten lamp for 2 min at 77 K. The K intermediate was photoreversed with λ > 610 nm light (R-63 cut-off filter, Toshiba) for 1 min, followed by illumination with 540 nm light. For each measurement, 128 interferograms were accumulated at a spectral resolution of 2 cm−1, and 30 and 50 identical recordings were averaged for H2O and D2O, respectively. For the formation of the M intermediate, samples were first illuminated with λ > 520 nm light (O-54 cut-off filter, Toshiba) for 1 min at 240 K. The M intermediate was photoreversed with λ = 410 nm light (interference filter) for 2 min, followed by illumination at λ > 520 nm light. For each measurement, 128 interferograms were accumulated with a spectral resolution of 2 cm−1, and 58 and 60 identical recordings were averaged for H2O and D2O, respectively. For the formation of the O intermediate, samples were illuminated with λ > 520 nm light (O-54 cut-off filter, Toshiba) at 277 K, and the difference spectra were measured during-minus-before illumination. For each measurement, 128 interferograms were accumulated with a spectral resolution of 2 cm−1, and 50 identical recordings were averaged for both H2O and D2O.
Extended Data
Extended Data Fig. 1 |. Full alignment of heliorhodopsin and type-1 rhodopsin.
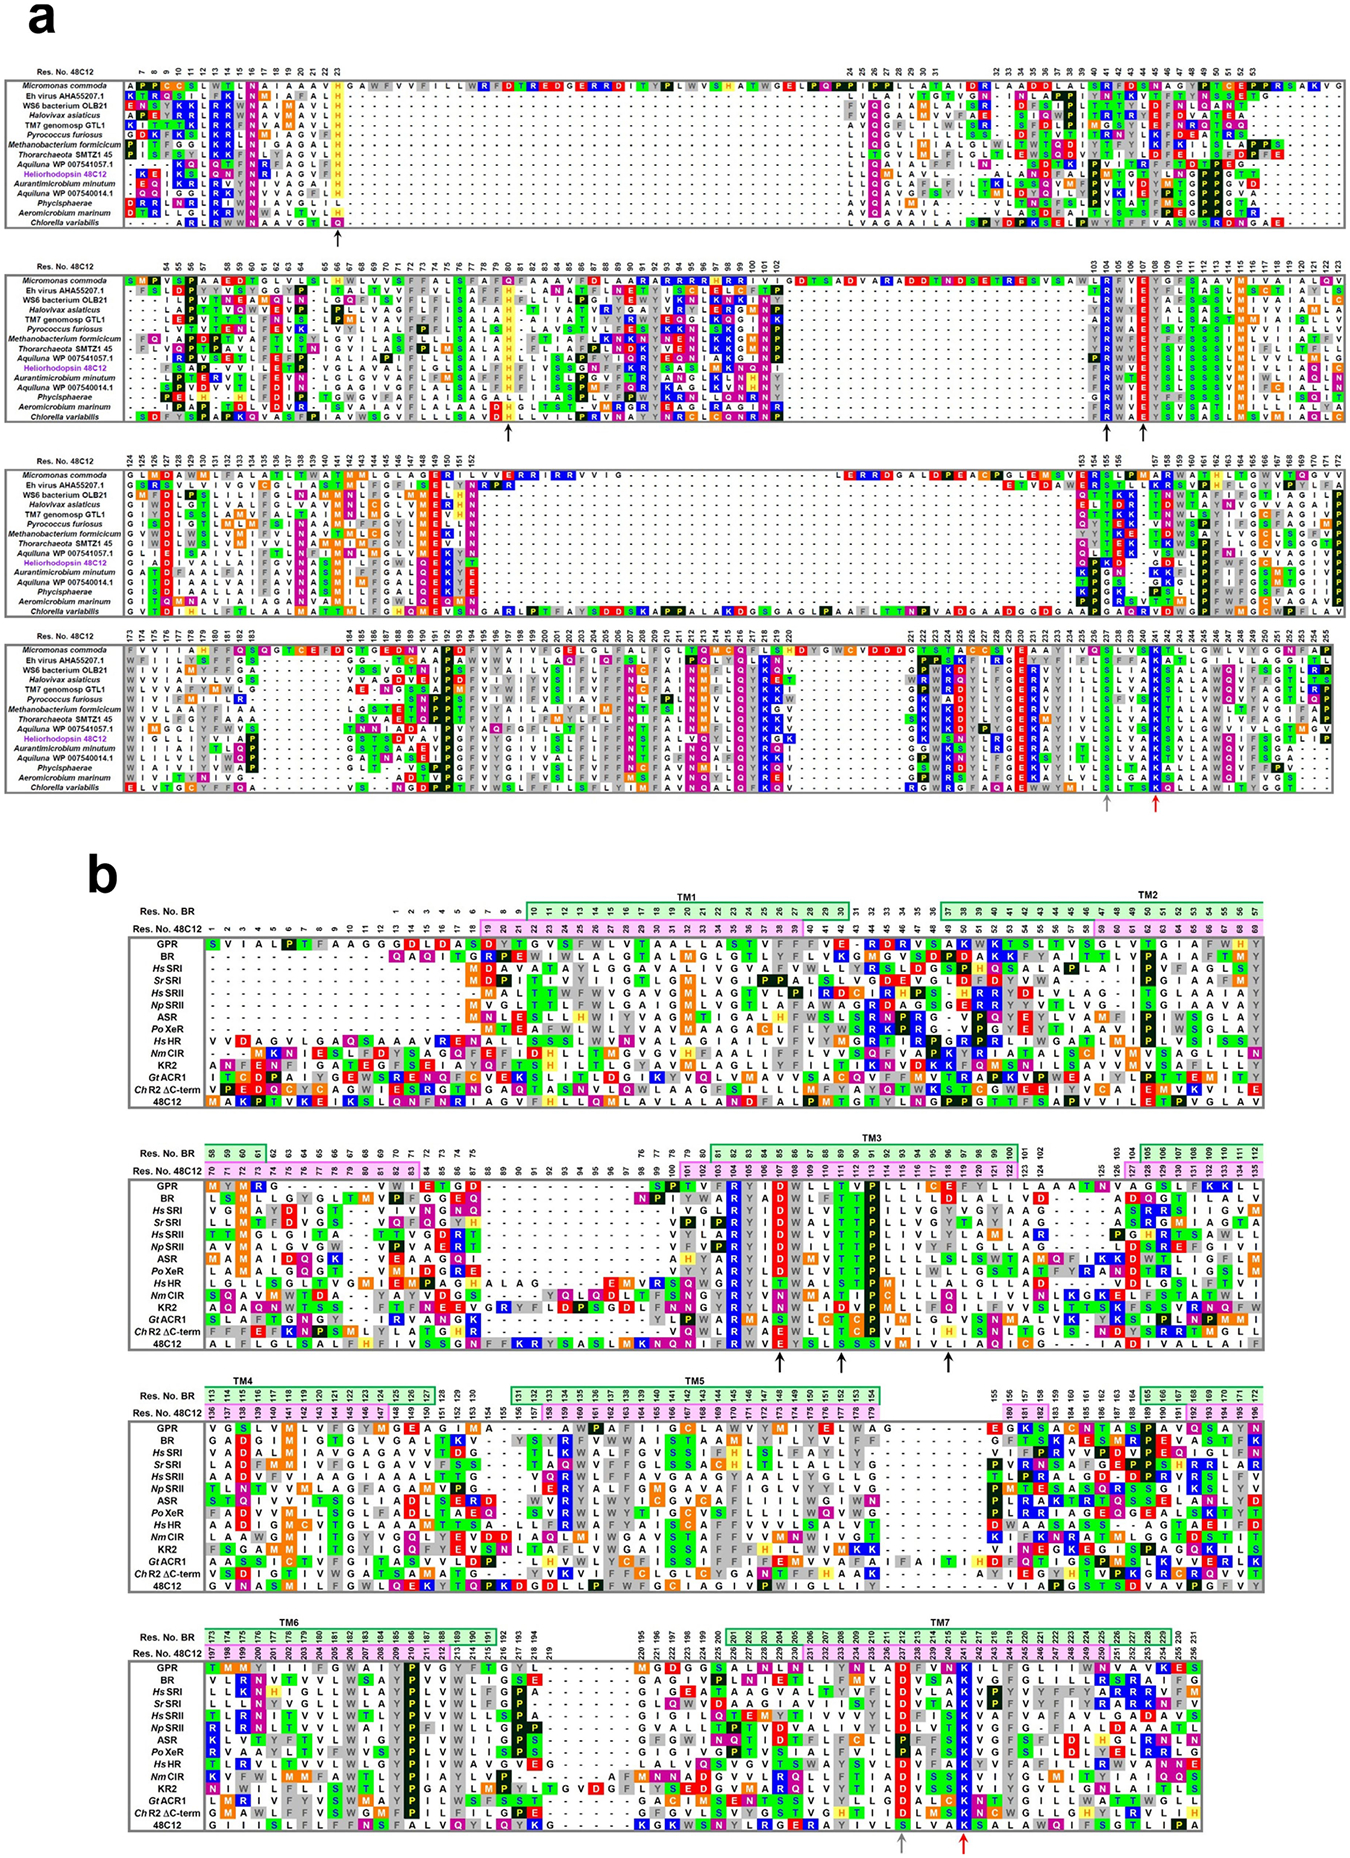
a, Multiple amino acid alignment of different heliorhodopsins. Positions 23, 80, 104 and 107 (heliorhodopsin 48C12 numbering) are marked with black arrows, as well as position 237 (grey arrow) and lysine in position 241 (red arrow). b, Multiple amino acid alignment of heliorhodopsin (48C12) with green absorbing proteorhodopsin (GPR), bacteriorhodopsin (BR), sensory rhodopsin I from Halobacterium salinarum (HsSRI) and Salinibacter ruber (SrSRI), sensory rhodopsin II from H. salinarum (HsSRII) and Natronomonas pharaonis (NpSRII), Anabaena sensory rhodopsin (ASR), xenorhodopsin from Parvularcula oceani (PoXeR), halorhodopsin from H. salinarum (HsHR), eubacterial chloride-pump rhodopsin from Nonlabens marinus (NmClR), sodium-pump rhodopsin from Krokinobacter eikastus (KR2) (K. eikastus is also known as Dokdonia eikasta), anion channelrhodopsin from Guillardia theta (GtACR1) and cation channelrhodopsin2 from Chlamydomonas reinhardtii (C-terminal side omitted, ChR2 ΔC-term). Positions 85, 89 and 96 (bacteriorhodopsin numbering) are marked with black arrows, as well as position 212 (grey arrow) and lysine in position 216 (red arrow).
Extended Data Fig. 2 |. Relationship and depth distribution of heliorhodopsins and type-1 rhodopsins.
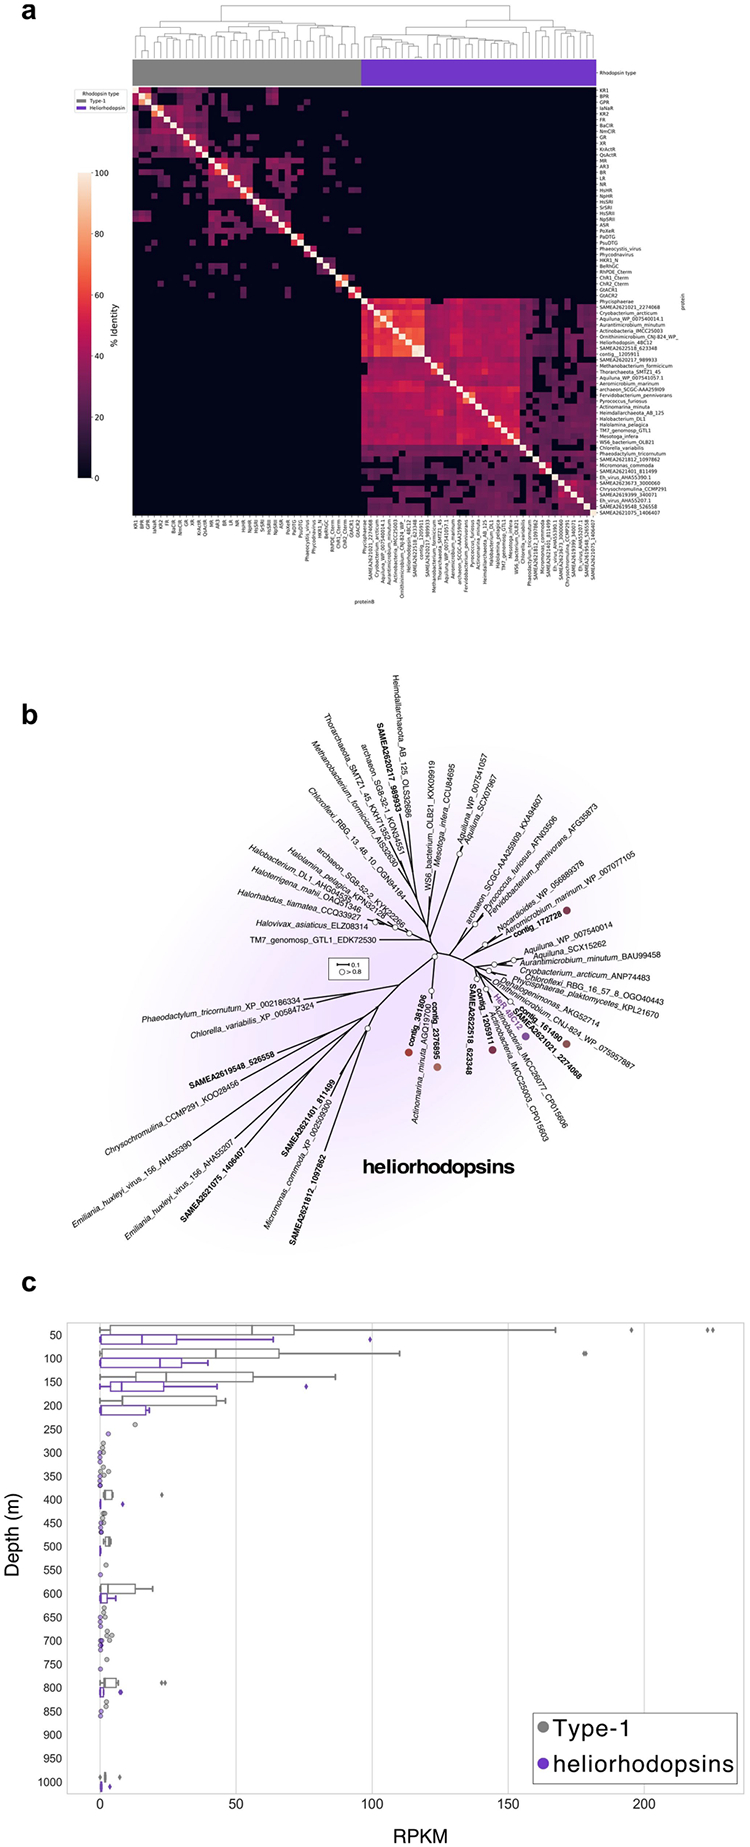
a, Clustering analysis separates heliorhodopsins (purple leaves in dendrogram tree) from type-1 rhodopsins (grey leaves in dendrogram tree) based on per cent identity obtained using protein–protein blast v.2.7.157. The hierarchical clustering was performed using the clustermap function from the Python package seaborn, with default parameters for metric and linkage. The code used to generate the figure is available as a Jupyter notebook at https://github.com/BejaLab/heliorhodopsin. b, Detailed phylogenetic relationships within the heliorhodopsin family. White circles represent bootstrap values of >80%. The scale bar indicates the average number of amino acid substitutions per site. Coloured circles indicate heliorhodopsins expressed in this study. c, Depth profiles of the relative abundance of type-1 rhodopsins and heliorhodopsins from marine metagenomes collected during the Tara Oceans expedition.
Extended Data Fig. 3 |. Heliorhodopsin membrane topology.
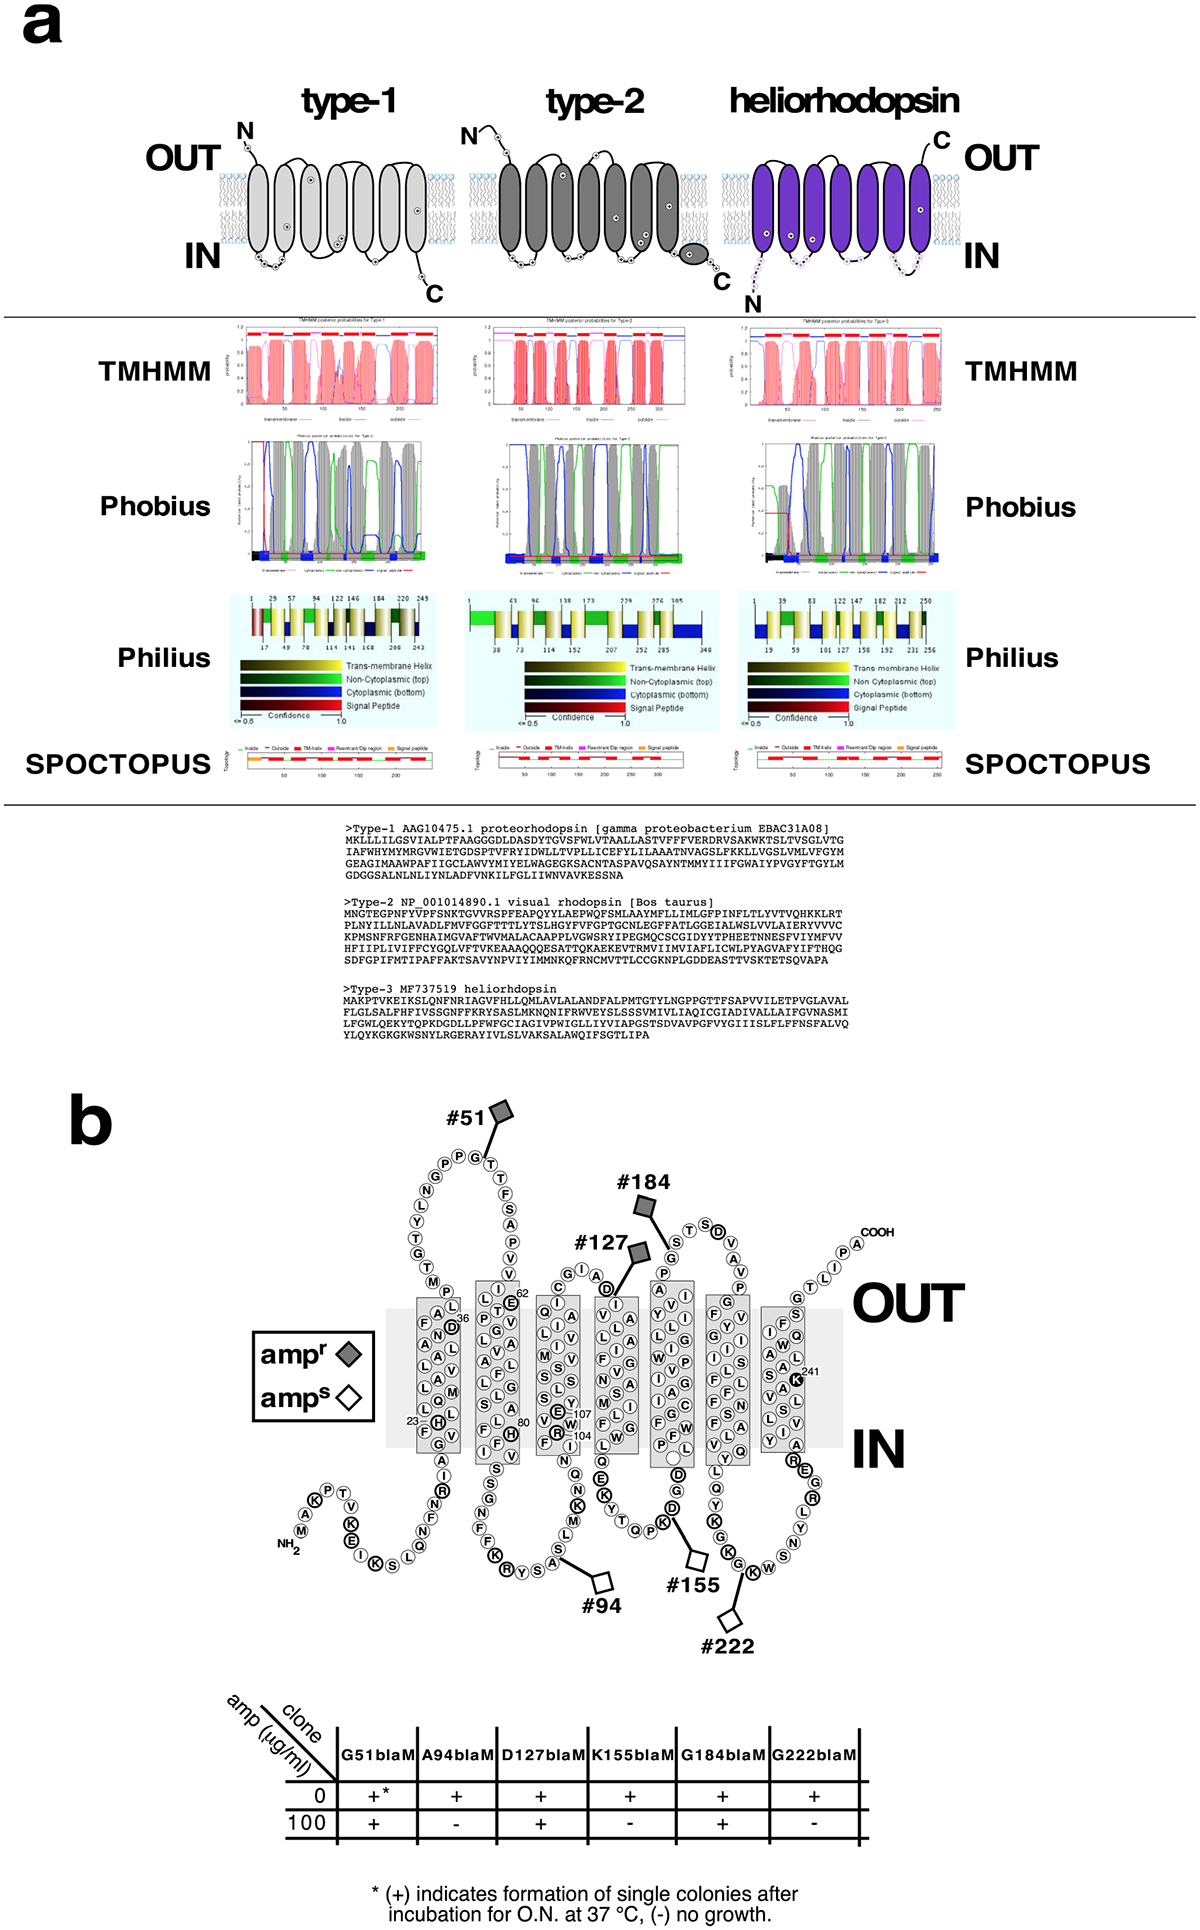
a, Predictions of membrane topology for type-1 rhodopsins, type-2 rhodopsins and heliorhodopsin. Upper panel, suggested schematic topologies for type-1 rhodopsins, type-2 rhodopsins and heliorhodopsins. Positively charged amino acids are labelled. N, amino-terminal tail, C, carboxy-terminal tail. Middle panel, membrane topology predictions by TMHMM35, Phobius36, Philius37 and SPOCTOPUS38. Lower panel, the rhodopsin sequences used for membrane topology predictions. b, Arrangement of heliorhodopsin 48C12 protein across the E. coli membrane. The heliorhodopsin–β-lactamase fusion sites resulting in ampicillin resistance (ampr) and ampicillin sensitivity (amps) are indicated. This experiment was repeated twice.
Extended Data Fig. 4 |. Ion-transport activity assay of heliorhodopsins.
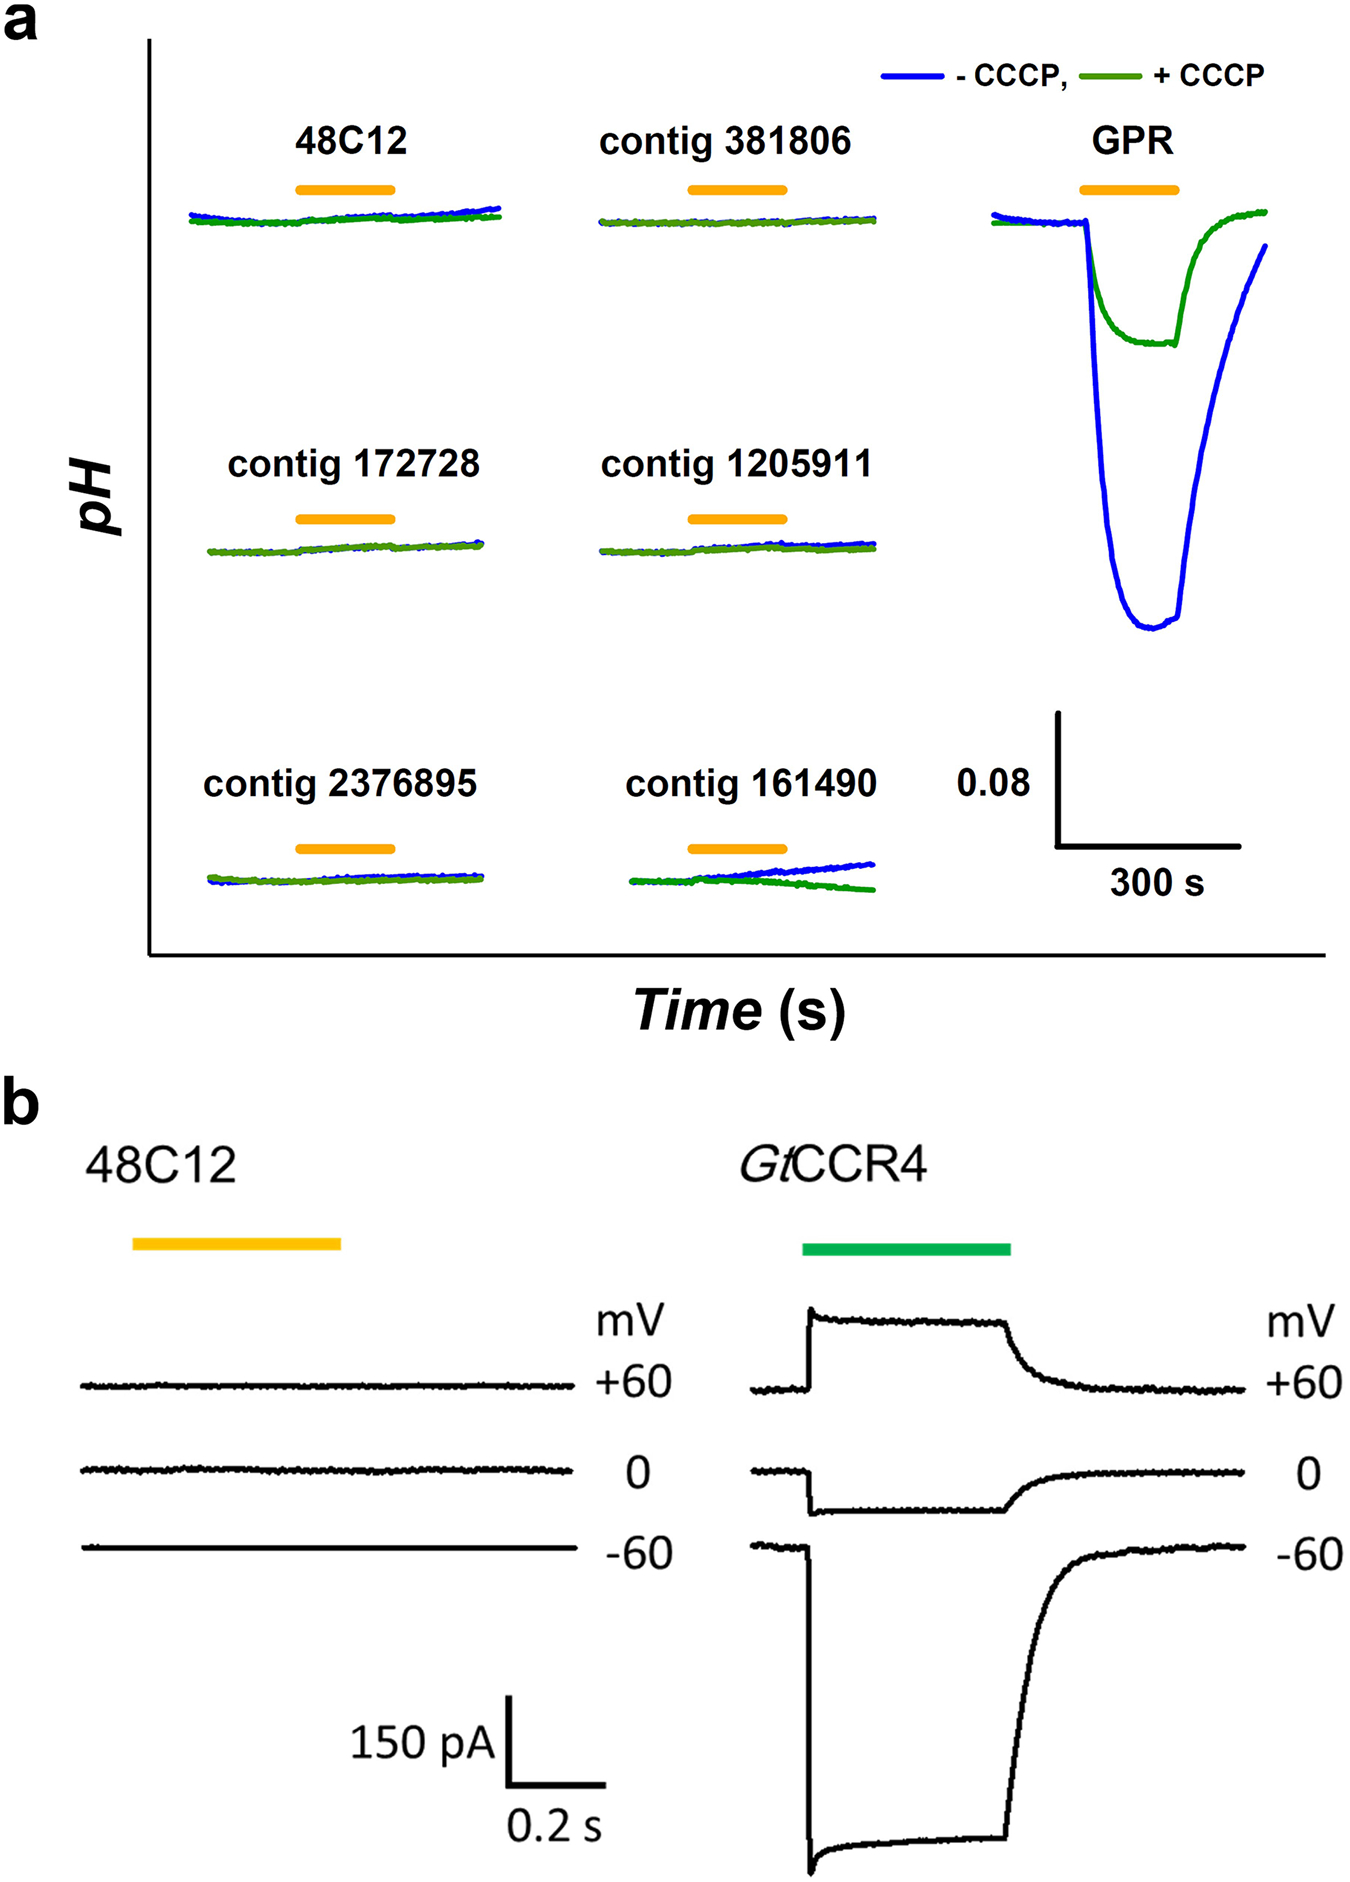
a, Ion-transport activity assay of six kinds of heliorhodopsin (48C12, and contigs 172728, 2376895, 381806, 1205911 and 161490), and a comparison with a type-1 rhodopsin (a light-driven proton pump; green-absorbing proteorhodopsin, GPR) in the absence and presence of the protonophore CCCP. Light was present for the time region indicated by the orange bars. b, Patch-clamp assay of heliorhodopsin 48C12. The photocurrent was measured at 60, 0 or −60 mV by whole-cell mode. Left, 48C12-expressing cells were illuminated with 550-nm light (2.6 mW/mm2), indicated by a yellow bar (n = 10 cells). Right, cells expressing GtCCR4 were illuminated with 520-nm light (2.4 mW/mm2), indicated by a green bar.
Extended Data Fig. 5 |. UV-visible absorption of heliorhodopsin 48C12 at different pH values.
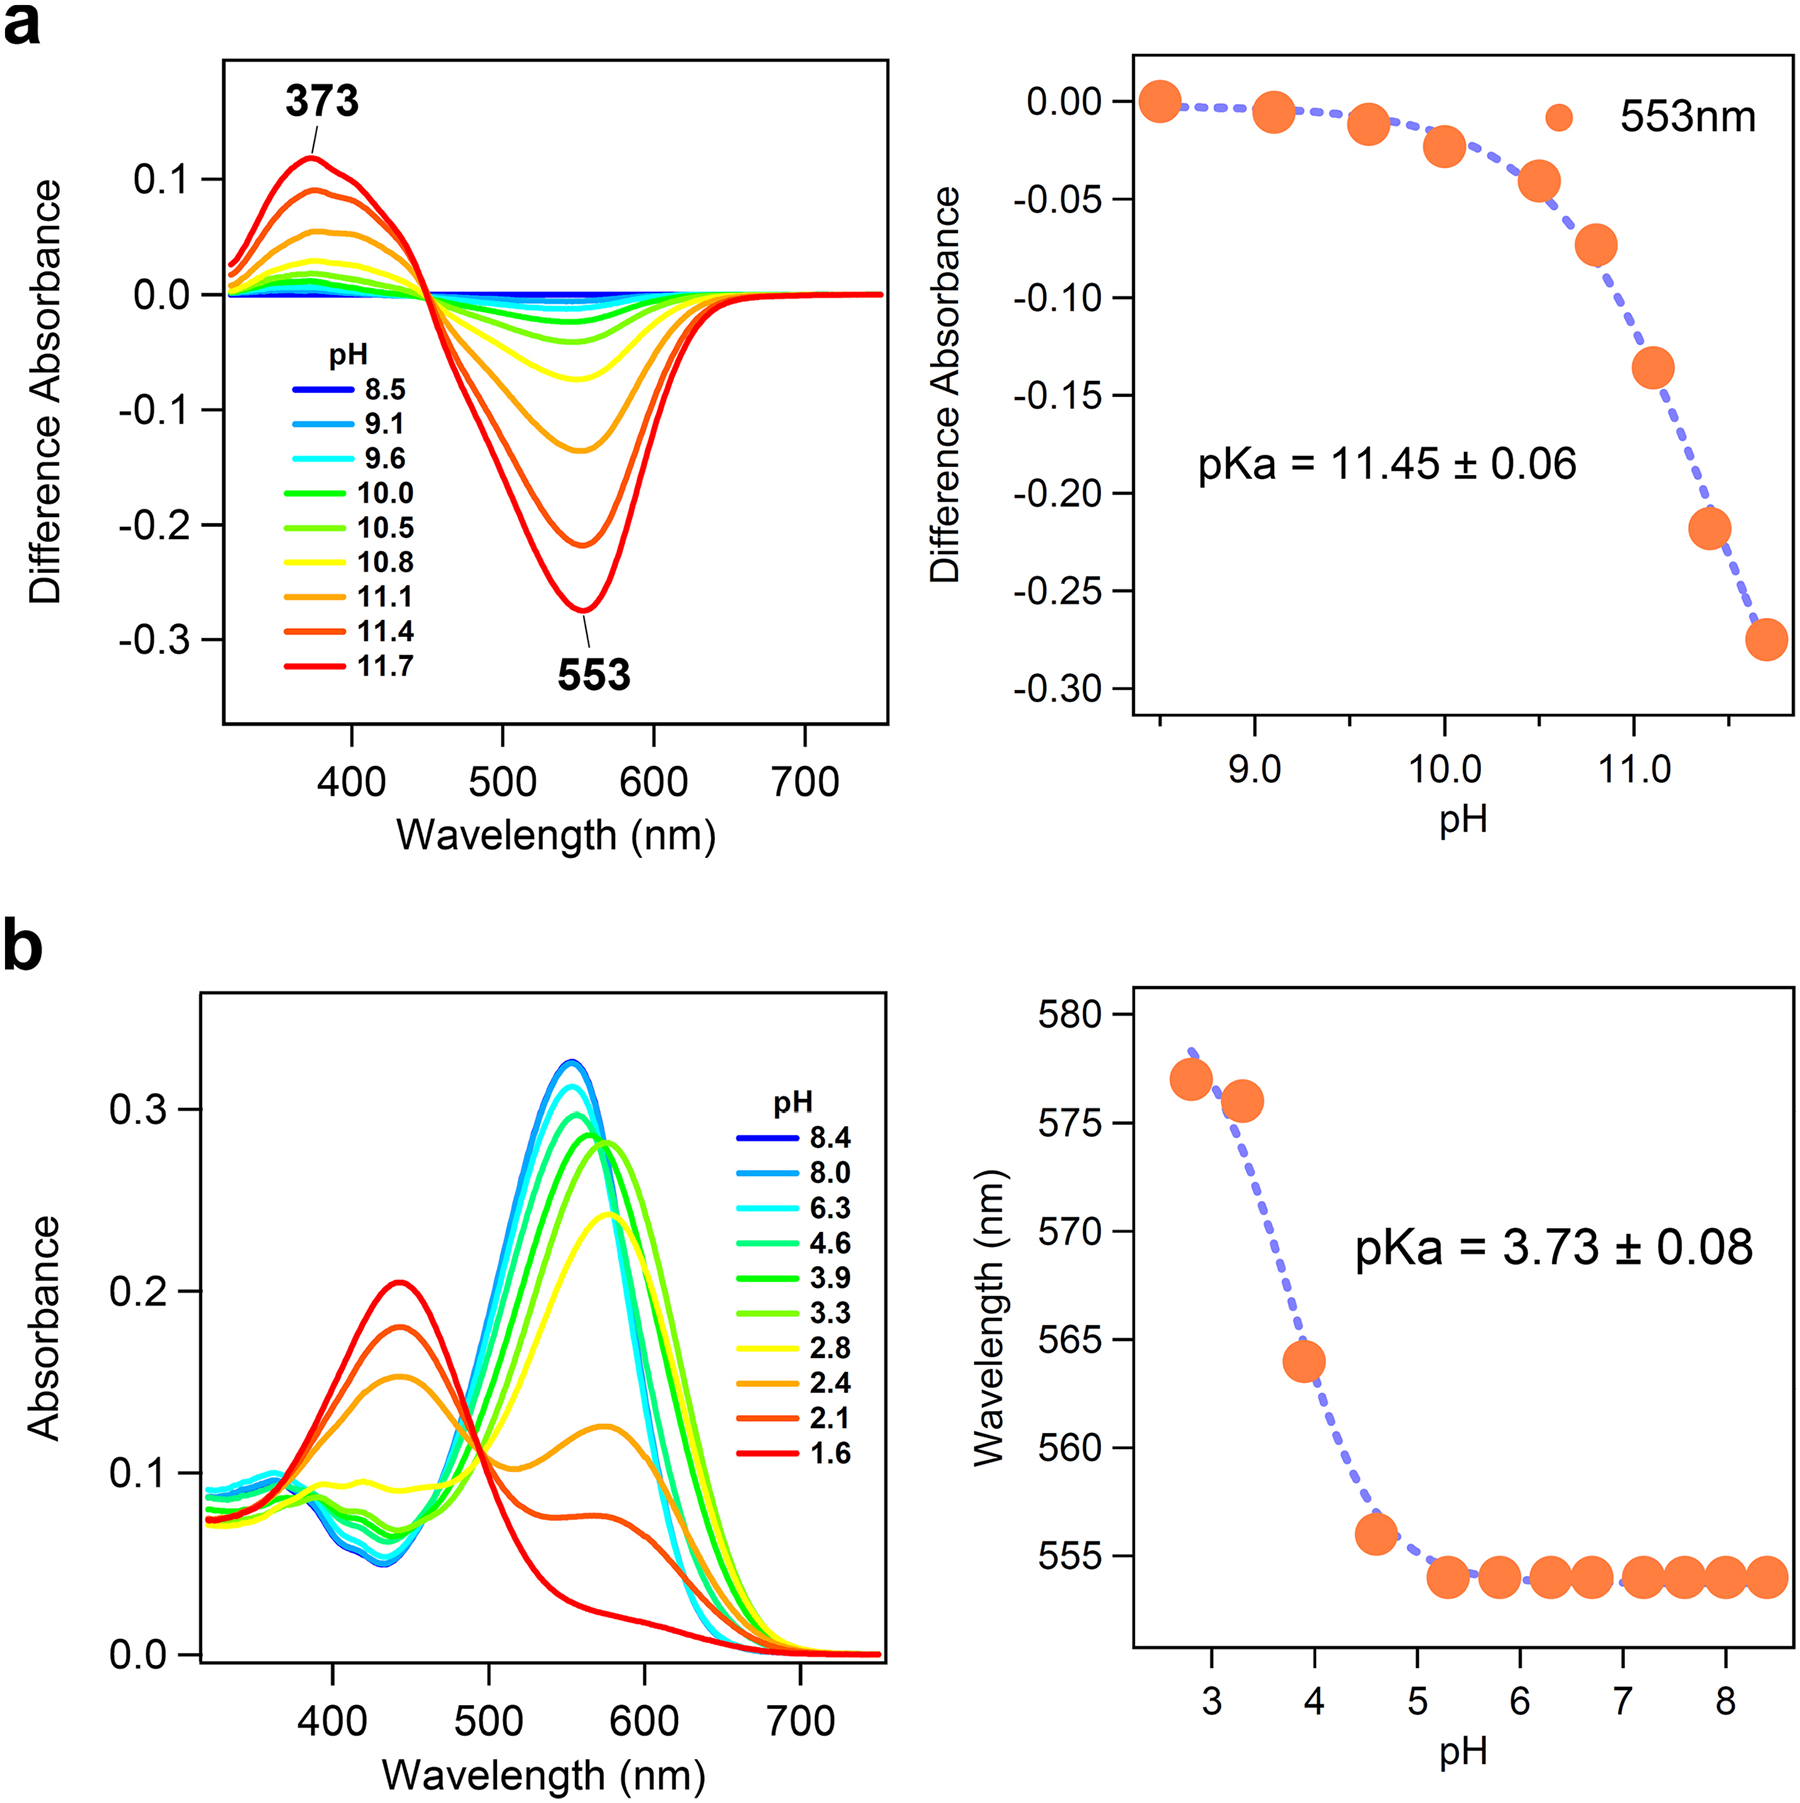
a, Deprotonation of the retinal Schiff base of heliorhodopsin 48C12 at alkaline pH. Difference absorption spectra (left) and absorption change at λ = 553 nm (right, orange solid circles) of heliorhodopsin 48C12 upon pH change from 8.5 to higher values. The deprotonated form of retinal Schiff base showed the absorption at λ = 373 nm. b, Red-shift of UV-visible absorption spectrum of heliorhodopsin 48C12, and protonation of the counterion. UV-visible absorption spectra (left) and the λmax (right, orange solid circles) of heliorhodopsin 48C12 at pH 2.8–8.4. When pH is lowered a red-shift of the absorption is observed, which is commonly reported for many type-1 rhodopsins and reflects the protonation of counterions. Thus, the red-shift of heliorhodopsin 48C12 originates from protonation of E107, which is fitted with the Henderson–Hasselbalch equation (blue dashed line), and the pKa of counterion (E107) is estimated to be 3.7. At pH values of less than 2.8, a large blue-shift to 443 nm is observed, presumably owing to the acid denaturation of the protein. The pKa values in right panels indicate mean ± s.d.
Extended Data Fig. 6 |. HPLC pattern of retinal extracted from heliorhodopsin 48C12.
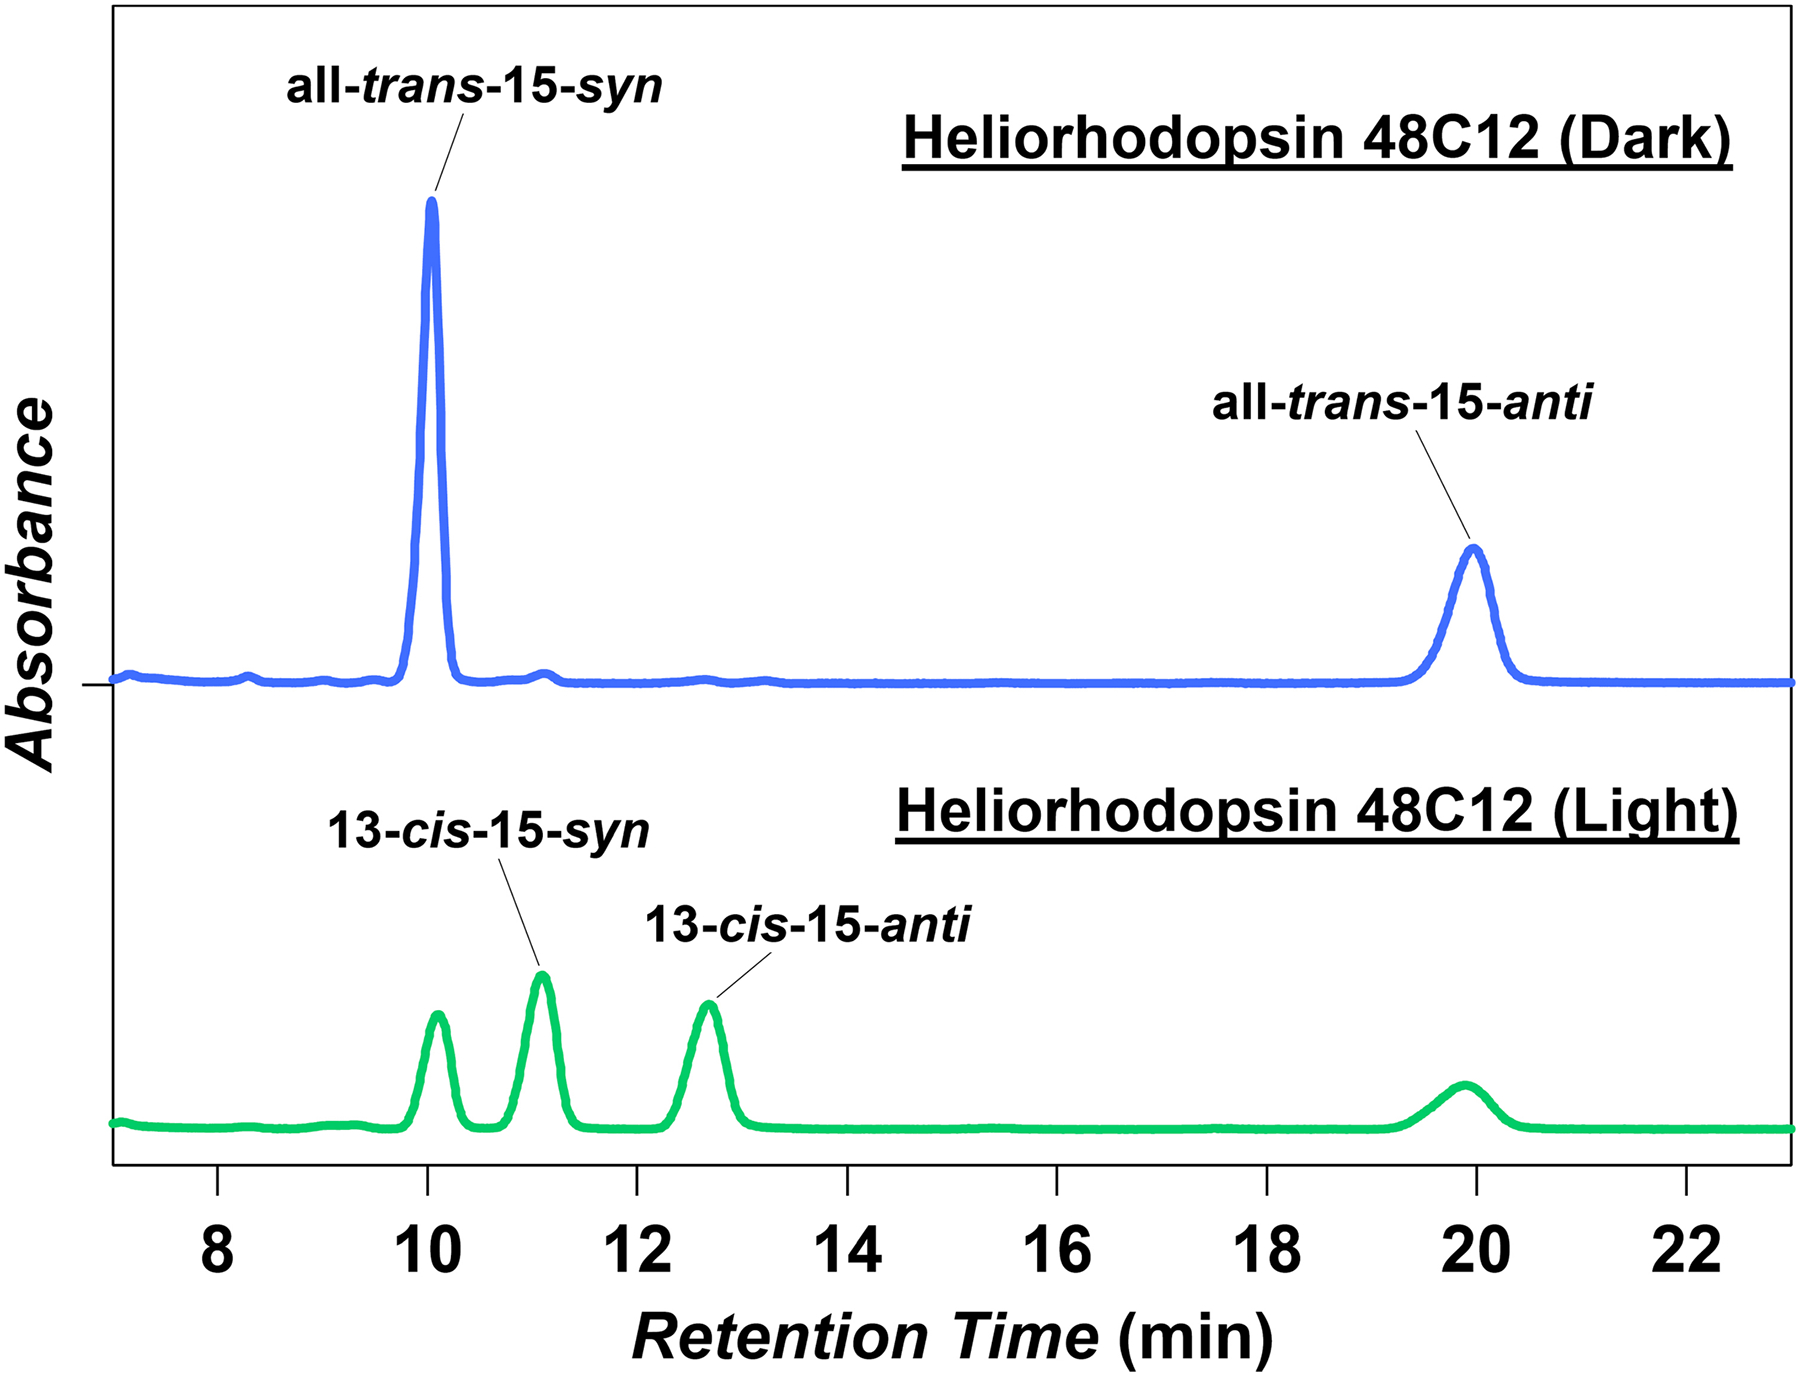
HPLC pattern of retinal extracted from heliorhodopsin 48C12 in the dark (blue) and under illumination at λ = 540 ± 10 nm (green). Most of the retinal (>97%) bound to heliorhodopsin 48C12 adopts an all-trans configuration in the dark (n = 4). When the retinal is extracted after illumination (λ > 500 nm), the proportion of the 13-cis form increased to 59 ± 5% (mean ± s.d., n = 4).
Extended Data Fig. 7 |. Photocycle of heliorhodopsins.
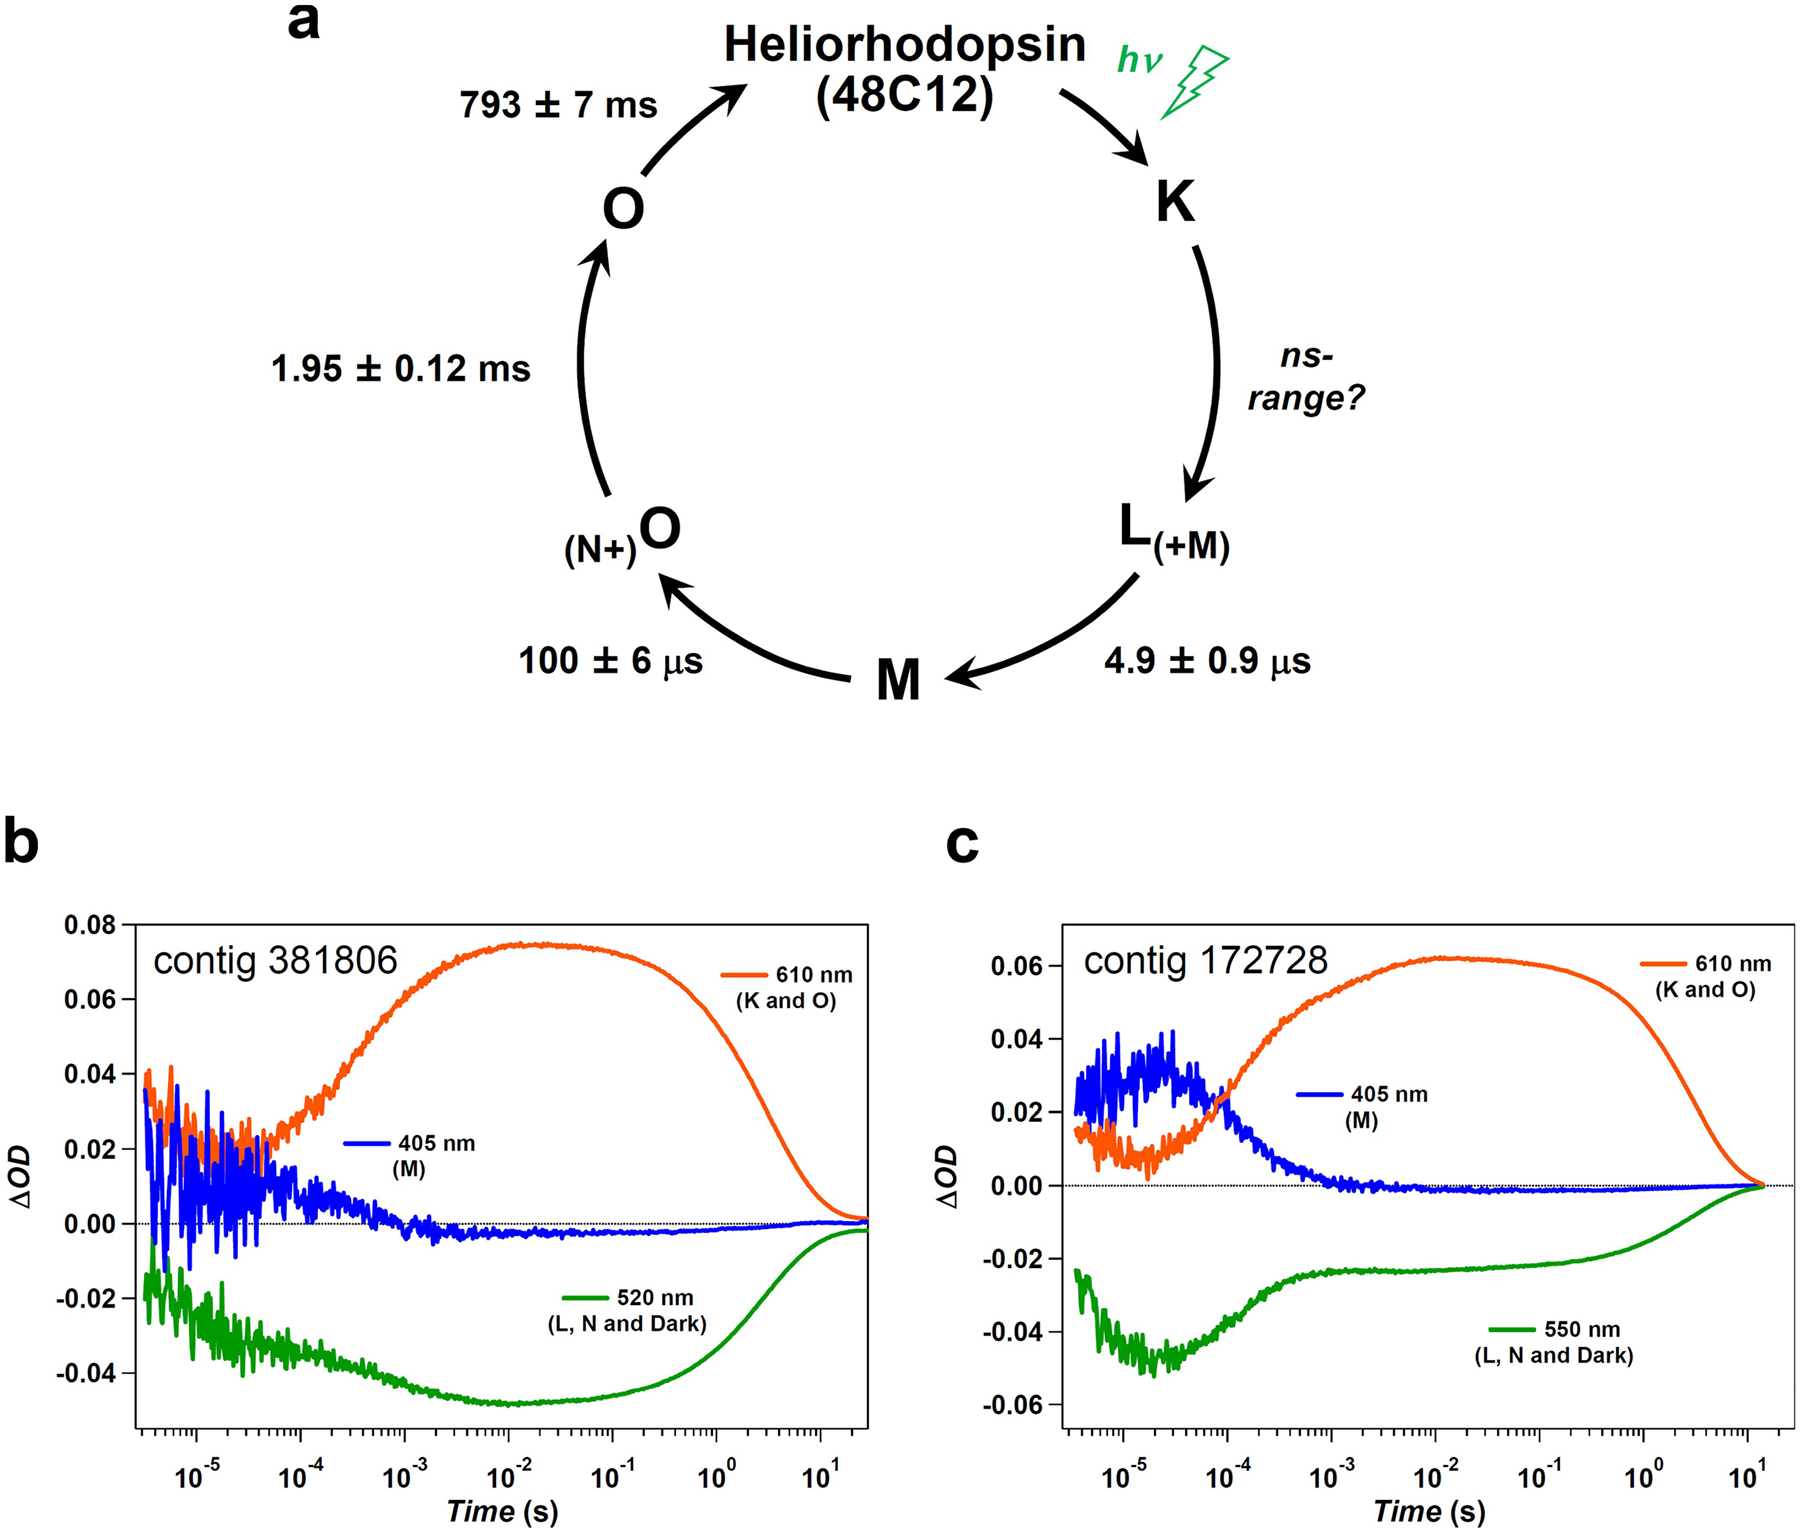
a, The photocycle of heliorhodopsin 48C12 determined by the multi-exponential fitting for the time evolution of transient absorption change shown in Fig. 4a, b. The lifetimes of the intermediates are indicated as mean ± s.d. b, c, Time evolution of transient absorption change of photo-excited contigs 381806 (b) and 172728 (c).
Extended Data Fig. 8 |. Light-induced FTIR difference spectra of heliorhodopsin 48C12.
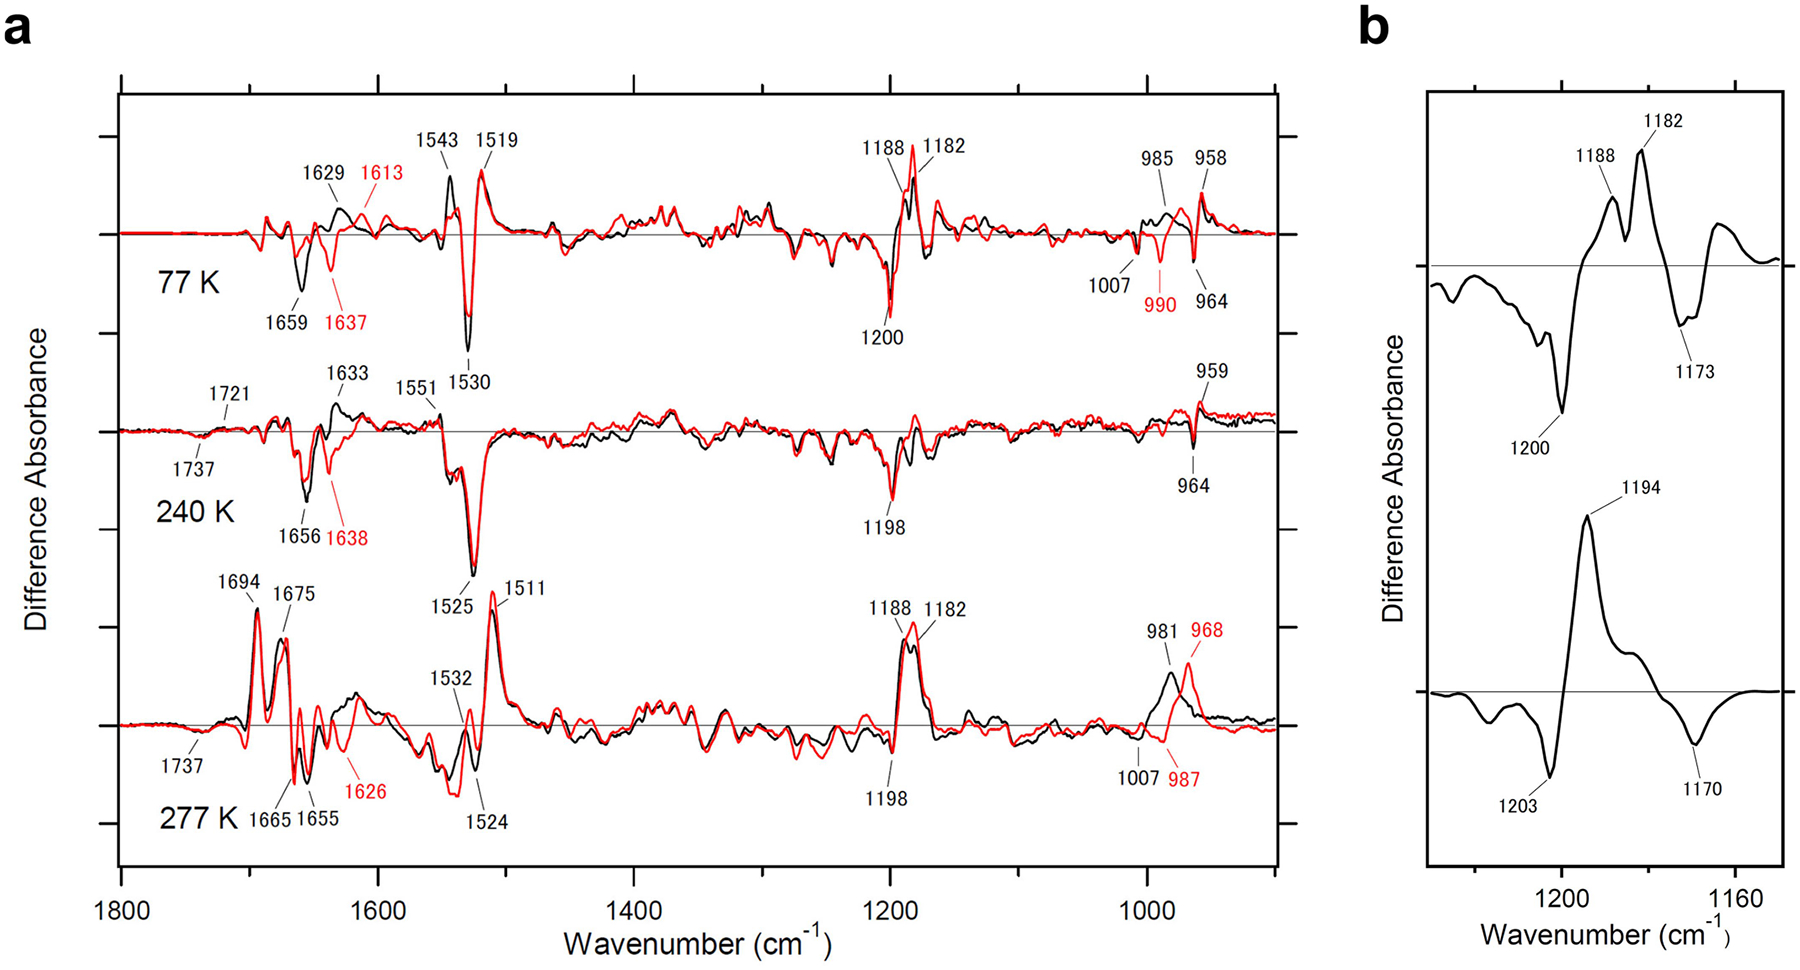
a, Light-induced FTIR spectra of heliorhodopsin 48C12 at 77 K (upper spectrum), 240 K (middle spectrum) and 277 K (lower spectrum) in the 1,800−900 cm−1, in which the intermediate produced is the K, M and O intermediate, respectively. Spectra are measured in H2O (black) and D2O (red). The amide-I vibration of the peptide backbone and the C=N stretch vibration of the Schiff base appear at 1,700−1,600 cm−1. Peaks at 1,659(−) and 1,629(+) cm−1 in H2O, and at 1,637(−) and 1,613(+) cm−1 in D2O at 77 K probably originate from a C=N stretch of the Schiff base, and small changes in amide-I suggest that the primary K intermediate does not undergo a major conformational change. This is also the case for the M intermediate, for which negative peaks at 1,656 cm−1 in H2O and at 1,638 cm−1 in D2O originate from the C=N stretch of the Schiff base, and changes in amide-I vibrations are small. By contrast, the appearance of strong peaks at 1,694 and 1,675 cm−1 in the O intermediate indicates extensive conformational changes. b, Light-induced difference FTIR absorption spectra of the K intermediate of heliorhodopsin 48C12 and bacteriorhodopsin. Light-induced difference FTIR absorption spectra of heliorhodopsin 48C12 (upper spectrum) and bacteriorhodopsin (lower spectrum) at 77 K in the 1,230−1,150 cm−1 region, which were measured in H2O. The bands at 1,200(−) and 1,188(+) cm−1 were observed at 77 K, similar to the type-1 rhodopsin bacteriorhodopsin, which suggests that the primary photochemical reaction of heliorhodopsin is the all-trans to 13-cis isomerization.
Extended Data Fig. 9 |. Transient absorption change of heliorhodopsin 48C12 mutants.
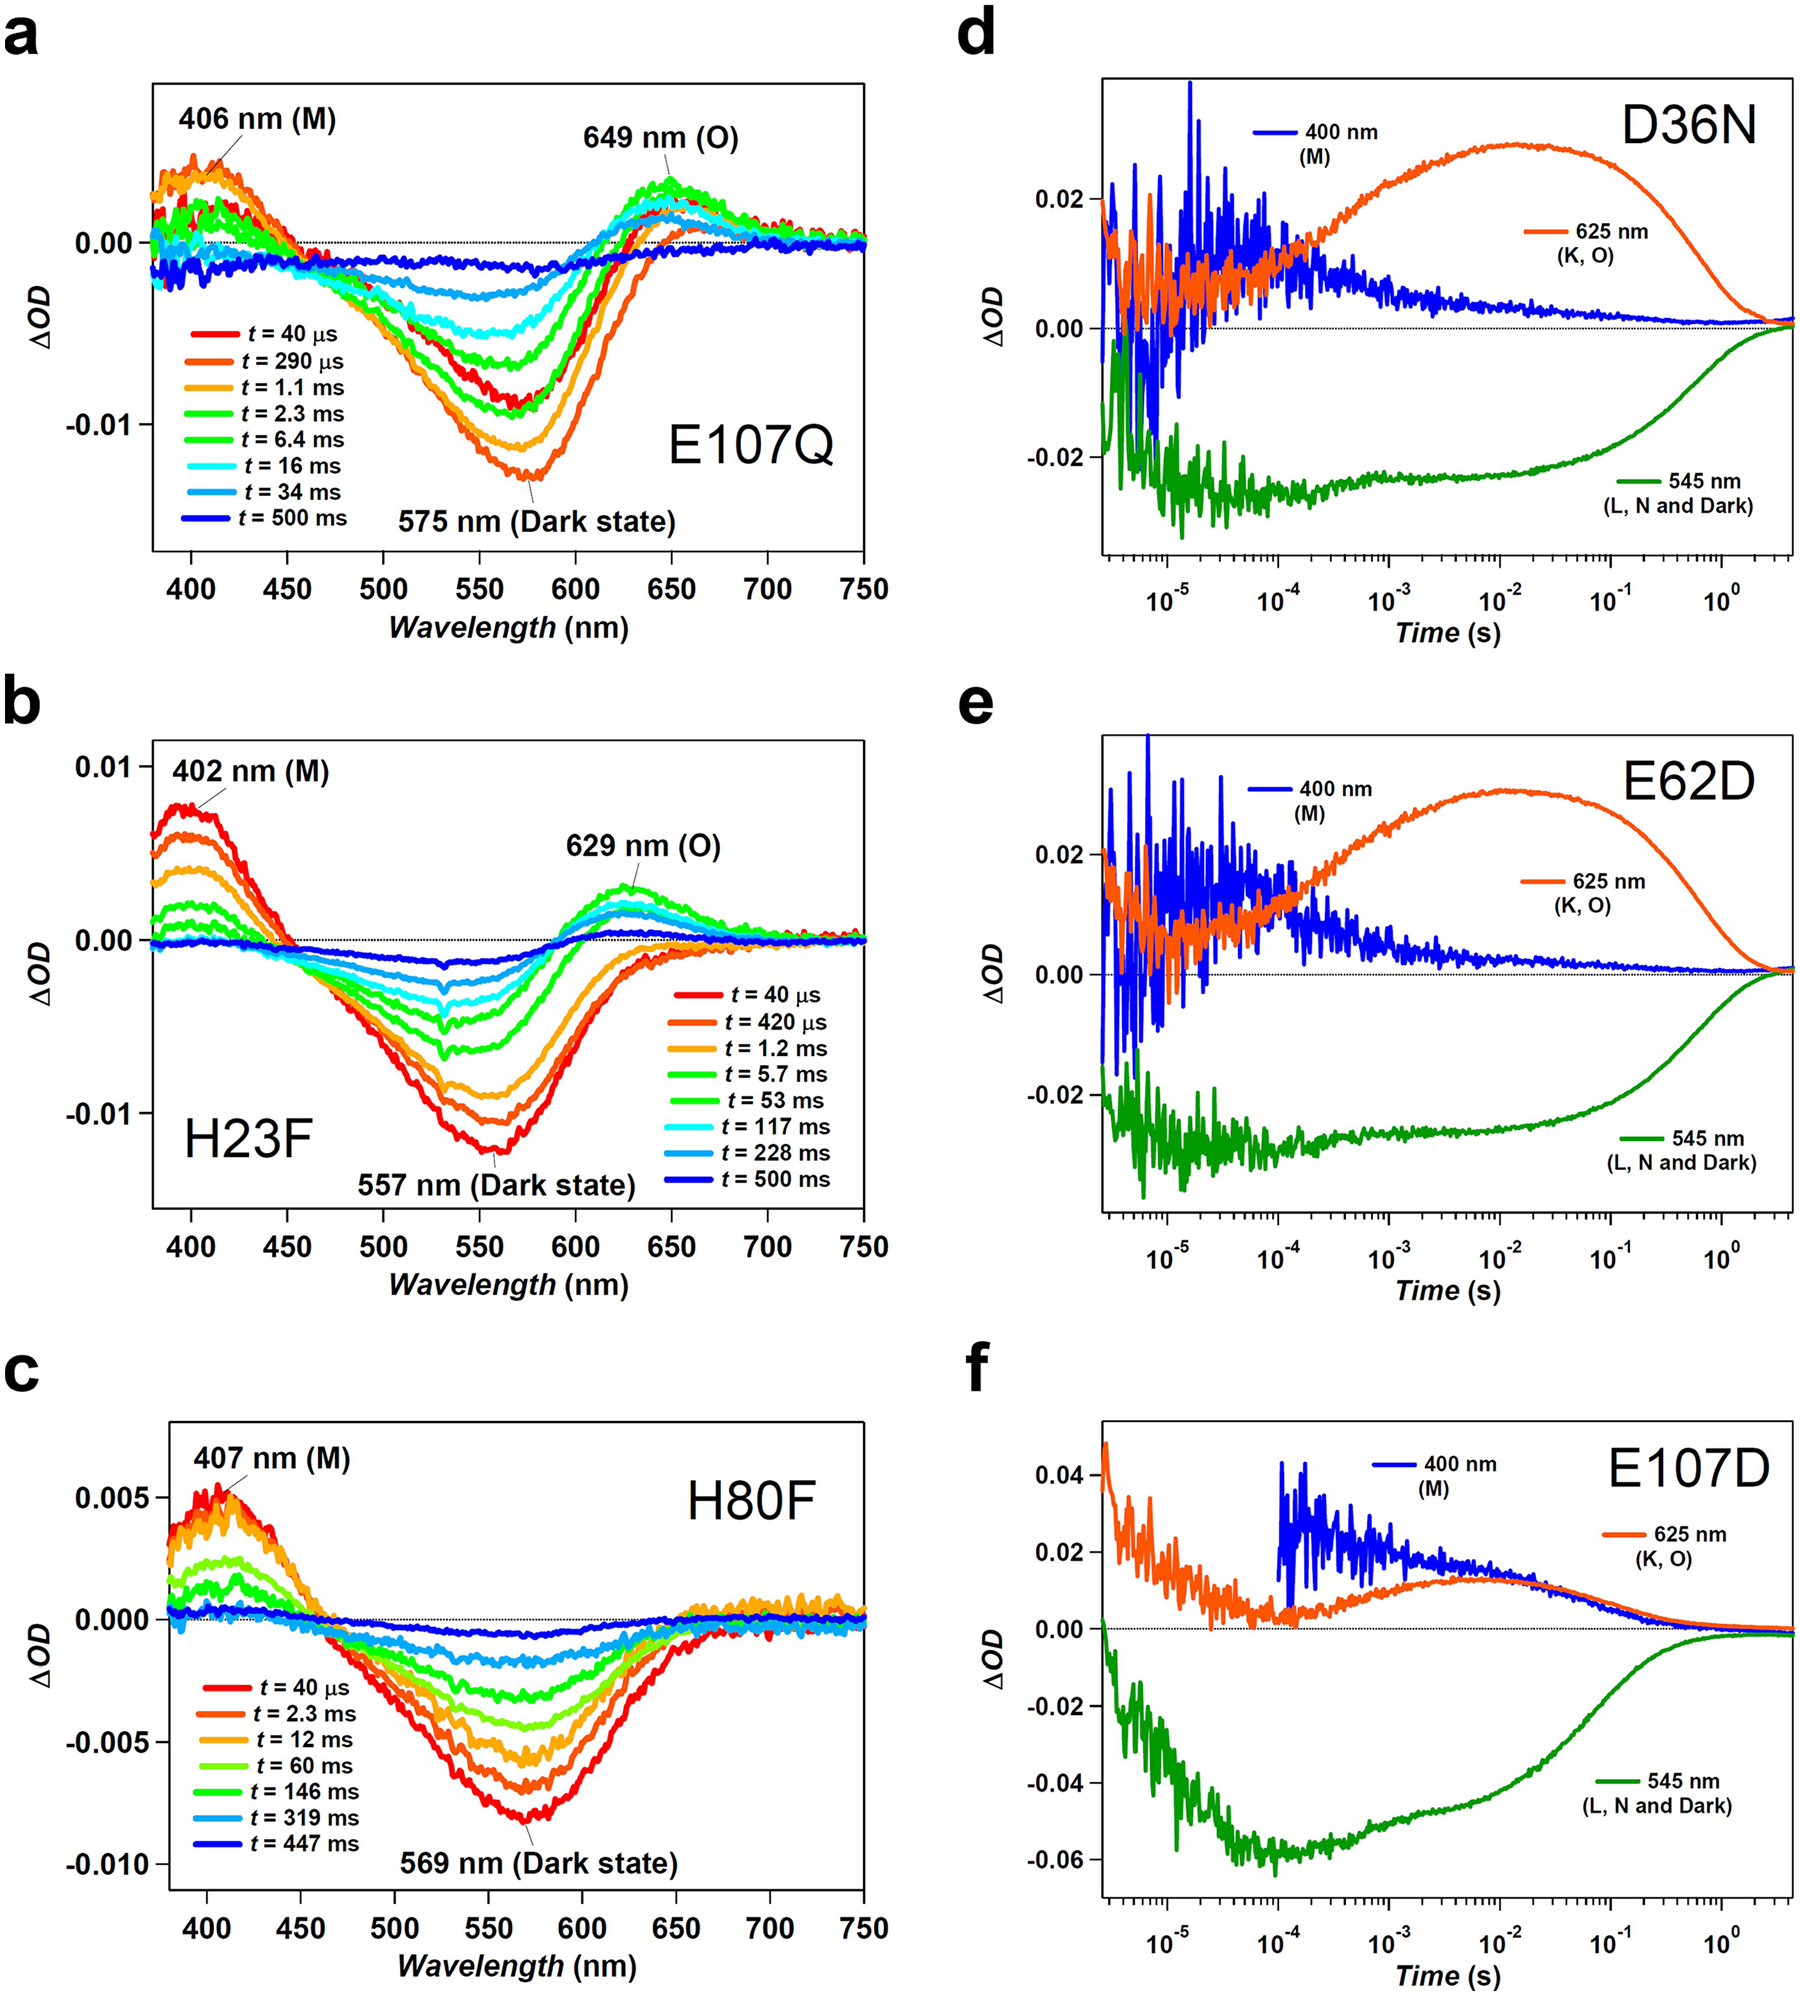
a–c, Transient absorption spectra of photo-excited heliorhodopsin 48C12 E107Q (a), H23F (b) and H80F (c) mutants. The M intermediate is formed for all these mutants, which suggests that none of these residues is the proton acceptor of the Schiff base. In the case of the H80F mutation, the O intermediate is not formed. d–f, Time evolution of transient absorption change of photo-excited heliorhodopsin 48C12 D36N (d), E62D (e) and E107D (f) mutants. The fact that the M intermediate forms in these mutants excludes the possibility that one of these residues acts as the proton acceptor for the Schiff base.
Extended Data Fig. 10 |. Proton release and uptake observed with cresol red.
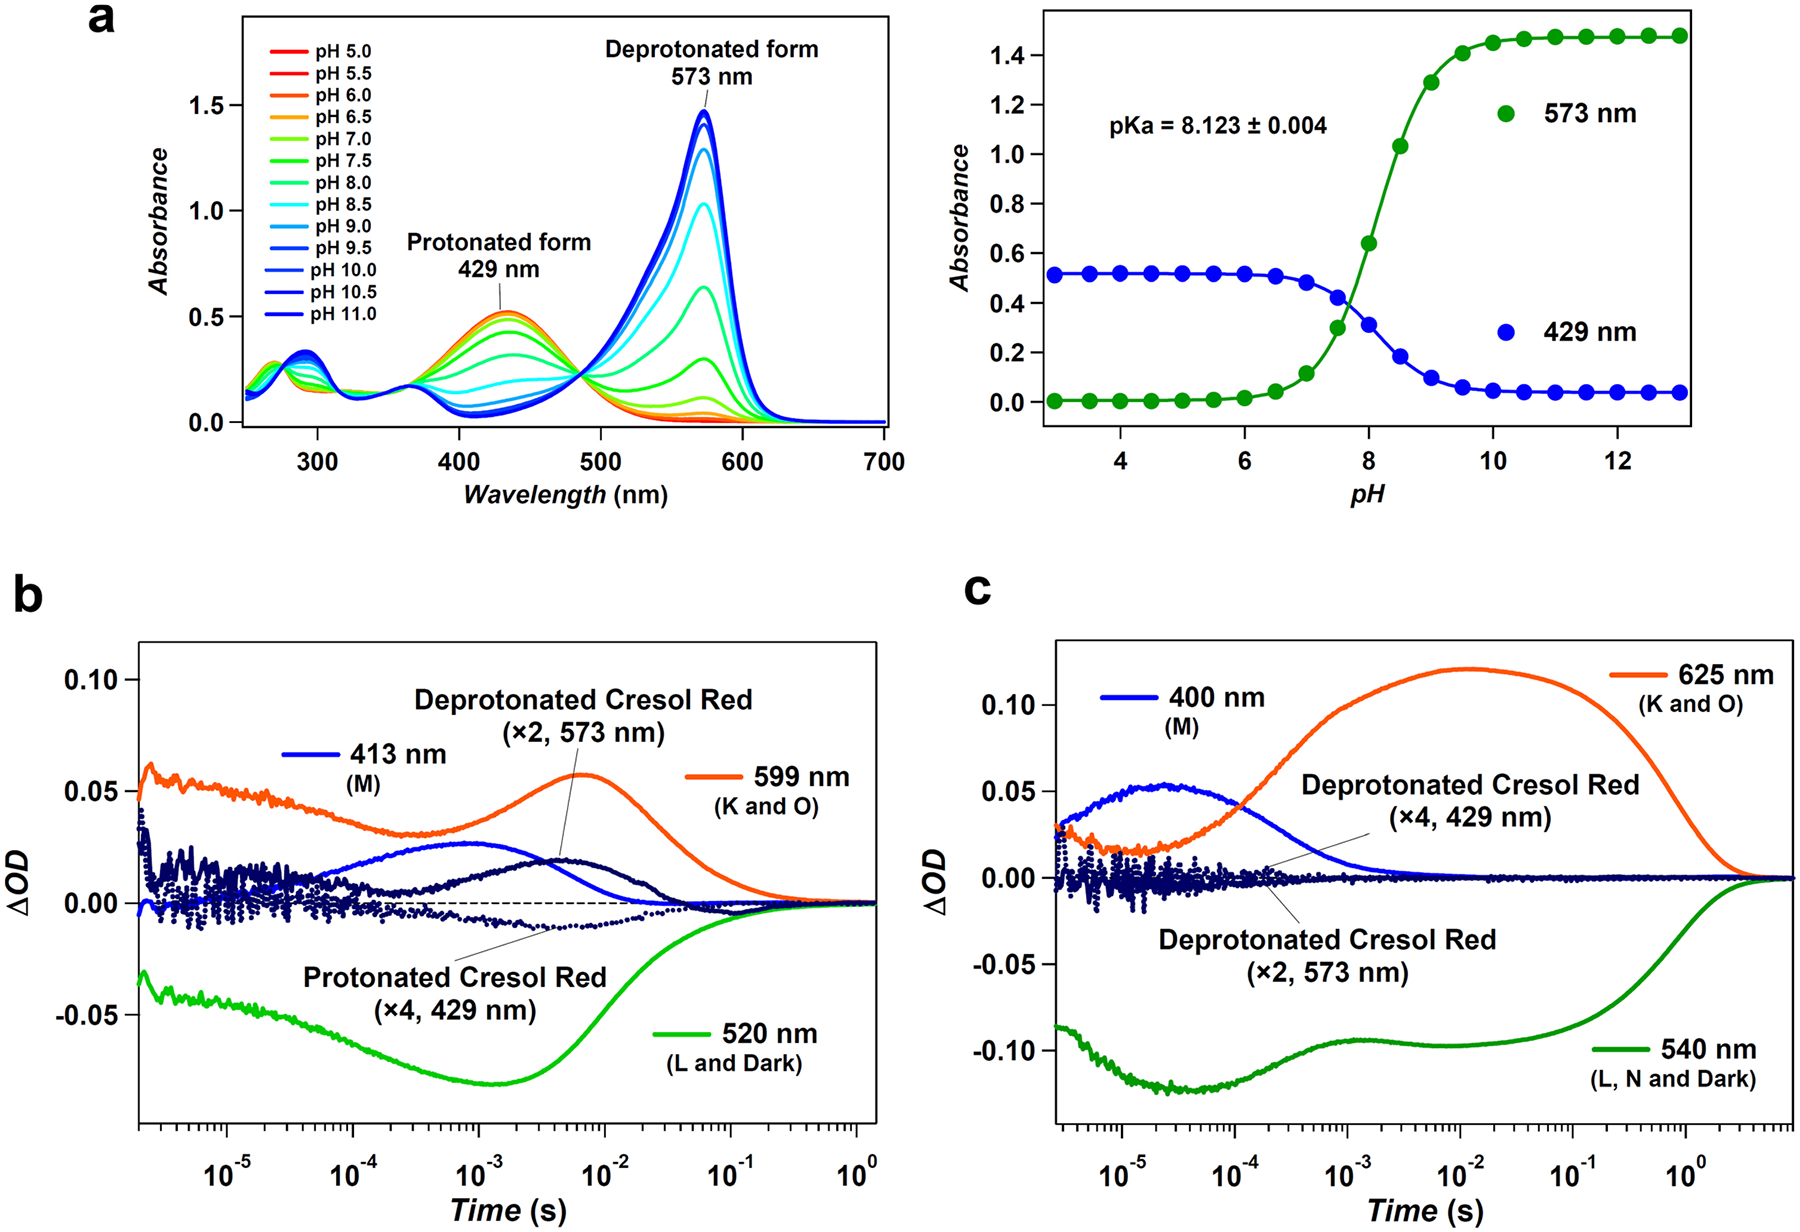
a, UV-visible absorption spectra of cresol red (left) and its absorbance at 429 nm (blue circles) and 573 nm (green circles) (right), at different pH values in 100 mM NaCl and 6-mix buffer (10 mM citrate, 10 mM MES, 10 mM HEPES, 10 mM MOPS, 10 mM CHES and 10 mM CAPS). Global fitting for absorption at different pH values with the Henderson–Hasselbalch equation showed the pKa of cresol red to be 8.123 ± 0.004 (mean ± s.d.). b, c, Time evolutions of transient absorption change of GPR (b) and heliorhodopsin 48C12 (c) in unbuffered 100 mM NaCl and 0.1% DDM. The pH value was adjusted to be approximately 8.1 by addition of NaOH. The transient absorption change of cresol red was calculated by the subtracting transient absorption changes obtained with cresol red from those without cresol red at 429 and 573 nm (corresponding to accumulations of protonated and deprotonated state of cresol red, respectively).
Supplementary Material
Acknowledgements
We thank G. Hevroni and M. Diamant for technical help with sampling, D. Cohen for help with the HPC ATLAS cluster, and M. Habib for help in constructing the protein fusions. This work was supported by Israel Science Foundation - F.I.R.S.T. (Bikura) Individual grant (545/17), the I-CORE Program of the Planning and Budgeting Committee and the Grand Technion Energy Program (GTEP), and is part of the Leona M. and Harry B. Helmsley Charitable Trust reports on Alternative Energy series of the Technion Israel Institute of Technology and the Weizmann Institute of Science, the Lorry I. Lokey Interdisciplinary Center for Life Sciences and Engineering, the Russell Berrie Nanotechnology Institute, the Louis and Lyra Richmond Memorial Chair in Life Sciences (to O.B.), the Japanese Ministry of Education, Culture, Sports, Science and Technology (26708001, 26115706, 26620005 to K.I. and 25104009, 15H02391 to H.K.), JST PRESTO grants (JPMJPR15P2 to K.I. and JPMJPR1688 to S.P.T.) and JST CREST grant (JPMJCR1753 to H.K.).
Footnotes
Reporting summary. Further information on experimental design is available in the Nature Research Reporting Summary linked to this paper.
Code availability. All the scripts and notebooks used to process the metagenomic data analysis results are available at https://github.com/BejaLab/heliorhodopsin.
Online content
Any Methods, including any statements of data availability and Nature Research reporting summaries, along with any additional references and Source Data files, are available in the online version of the paper at https://doi.org/10.1038/s41586-018-0225-9.
Competing interests The authors declare no competing interests.
Extended data is available for this paper at https://doi.org/10.1038/s41586-018-0225-9.
Supplementary information is available for this paper at https://doi.org/10.1038/s41586-018-0225-9.
Data availability.
The fosmid KIN48C12 sequence has been deposited in the GenBank under accession number MF737519. All other data are available from the corresponding authors upon request.
References
- 1.Spudich JL, Yang CS, Jung KH & Spudich EN Retinylidene proteins: structures and functions from archaea to humans. Annu. Rev. Cell Dev. Biol 16, 365–392 (2000). [DOI] [PubMed] [Google Scholar]
- 2.Ernst OP et al. Microbial and animal rhodopsins: structures, functions, and molecular mechanisms. Chem. Rev 114, 126–163 (2014). [DOI] [PMC free article] [PubMed] [Google Scholar]
- 3.Govorunova EG, Sineshchekov OA, Li H & Spudich JL Microbial rhodopsins: diversity, mechanisms, and optogenetic applications. Annu. Rev. Biochem 86, 845–872 (2017). [DOI] [PMC free article] [PubMed] [Google Scholar]
- 4.Yutin N & Koonin EV Proteorhodopsin genes in giant viruses. Biol. Direct 7, 34 (2012). [DOI] [PMC free article] [PubMed] [Google Scholar]
- 5.Philosof A & Béjà O Bacterial, archaeal and viral-like rhodopsins from the Red Sea. Environ. Microbiol. Rep 5, 475–482 (2013). [DOI] [PubMed] [Google Scholar]
- 6.Béjà O et al. Bacterial rhodopsin: evidence for a new type of phototrophy in the sea. Science 289, 1902–1906 (2000). [DOI] [PubMed] [Google Scholar]
- 7.Béjà O, Spudich EN, Spudich JL, Leclerc M & DeLong EF Proteorhodopsin phototrophy in the ocean. Nature 411, 786–789 (2001). [DOI] [PubMed] [Google Scholar]
- 8.Finkel OM, Béjà O & Belkin S Global abundance of microbial rhodopsins. ISME J 7, 448–451 (2013). [DOI] [PMC free article] [PubMed] [Google Scholar]
- 9.Venter JC et al. Environmental genome shotgun sequencing of the Sargasso Sea. Science 304, 66–74 (2004). [DOI] [PubMed] [Google Scholar]
- 10.Sabehi G et al. New insights into metabolic properties of marine bacteria encoding proteorhodopsins. PLoS Biol 3, e273 (2005). [DOI] [PMC free article] [PubMed] [Google Scholar]
- 11.Rusch DB et al. The Sorcerer II Global Ocean Sampling expedition: northwest Atlantic through eastern tropical Pacific. PLoS Biol 5, e77 (2007). [DOI] [PMC free article] [PubMed] [Google Scholar]
- 12.Atamna-Ismaeel N et al. Widespread distribution of proteorhodopsins in freshwater and brackish ecosystems. ISME J 2, 656–662 (2008). [DOI] [PubMed] [Google Scholar]
- 13.Sharma AK et al. Actinorhodopsin genes discovered in diverse freshwater habitats and among cultivated freshwater Actinobacteria. ISME J 3, 726–737 (2009). [DOI] [PubMed] [Google Scholar]
- 14.Koh EY et al. Proteorhodopsin-bearing bacteria in Antarctic sea ice. Appl. Environ. Microbiol 76, 5918–5925 (2010). [DOI] [PMC free article] [PubMed] [Google Scholar]
- 15.Martínez A, Bradley AS, Waldbauer JR, Summons RE & DeLong EF Proteorhodopsin photosystem gene expression enables photophosphorylation in a heterologous host. Proc. Natl Acad. Sci. USA 104, 5590–5595 (2007). [DOI] [PMC free article] [PubMed] [Google Scholar]
- 16.Pushkarev A & Béjà O Functional metagenomic screen reveals new and diverse microbial rhodopsins. ISME J 10, 2331–2335 (2016). [DOI] [PMC free article] [PubMed] [Google Scholar]
- 17.Altschul SF et al. Gapped BLAST and PSI-BLAST: a new generation of protein database search programs. Nucleic Acids Res 25, 3389–3402 (1997). [DOI] [PMC free article] [PubMed] [Google Scholar]
- 18.Broome-Smith JK & Spratt BG A vector for the construction of translational fusions to TEM β-lactamase and the analysis of protein export signals and membrane protein topology. Gene 49, 341–349 (1986). [DOI] [PubMed] [Google Scholar]
- 19.Broome-Smith JK, Tadayyon M & Zhang Y β-lactamase as a probe of membrane protein assembly and protein export. Mol. Microbiol 4, 1637–1644 (1990). [DOI] [PubMed] [Google Scholar]
- 20.Brum JR et al. Patterns and ecological drivers of ocean viral communities. Science 348, 1261498 (2015). [DOI] [PubMed] [Google Scholar]
- 21.Sunagawa S et al. Structure and function of the global ocean microbiome. Science 348, 1261359 (2015). [DOI] [PubMed] [Google Scholar]
- 22.Braiman MS et al. Vibrational spectroscopy of bacteriorhodopsin mutants: light-driven proton transport involves protonation changes of aspartic acid residues 85, 96, and 212. Biochemistry 27, 8516–8520 (1988). [DOI] [PubMed] [Google Scholar]
- 23.Palczewski K et al. Crystal structure of rhodopsin: a G protein-coupled receptor. Science 289, 739–745 (2000). [DOI] [PubMed] [Google Scholar]
- 24.Toyama D et al. Metagenomics analysis of microorganisms in freshwater lakes of the Amazon basin. Genome Announc 4, e01440–16 (2016). [DOI] [PMC free article] [PubMed] [Google Scholar]
- 25.Yan Q et al. Impacts of the Three Gorges Dam on microbial structure and potential function. Sci. Rep 5, 8605 (2015). [DOI] [PMC free article] [PubMed] [Google Scholar]
- 26.Wright JJ, Lee S, Zaikova E, Walsh DA & Hallam SJ DNA extraction from 0.22 μM Sterivex filters and cesium chloride density gradient centrifugation. J. Vis. Exp 31, 1352 (2009). [DOI] [PMC free article] [PubMed] [Google Scholar]
- 27.Gibson DG et al. Enzymatic assembly of DNA molecules up to several hundred kilobases. Nat. Methods 6, 343–345 (2009). [DOI] [PubMed] [Google Scholar]
- 28.Gibson DG, Smith HO, Hutchison CA III, Venter JC & Merryman C Chemical synthesis of the mouse mitochondrial genome. Nat. Methods 7, 901–903 (2010). [DOI] [PubMed] [Google Scholar]
- 29.Bankevich A et al. SPAdes: a new genome assembly algorithm and its applications to single-cell sequencing. J. Comput. Biol 19, 455–477 (2012). [DOI] [PMC free article] [PubMed] [Google Scholar]
- 30.Marchler-Bauer A et al. CDD/SPARCLE: functional classification of proteins via subfamily domain architectures. Nucleic Acids Res 45, D200–D203 (2017). [DOI] [PMC free article] [PubMed] [Google Scholar]
- 31.Söding J, Biegert A & Lupas AN The HHpred interactive server for protein homology detection and structure prediction. Nucleic Acids Res 33, W244–W248 (2005). [DOI] [PMC free article] [PubMed] [Google Scholar]
- 32.Alva V, Nam SZ, Söding J & Lupas AN The MPI bioinformatics Toolkit as an integrative platform for advanced protein sequence and structure analysis. Nucleic Acids Res 44, W410–W415 (2016). [DOI] [PMC free article] [PubMed] [Google Scholar]
- 33.Kelley LA, Mezulis S, Yates CM, Wass MN & Sternberg MJ The Phyre2 web portal for protein modeling, prediction and analysis. Nat. Protocols 10, 845–858 (2015). [DOI] [PMC free article] [PubMed] [Google Scholar]
- 34.Edgar RC MUSCLE: multiple sequence alignment with high accuracy and high throughput. Nucleic Acids Res 32, 1792–1797 (2004). [DOI] [PMC free article] [PubMed] [Google Scholar]
- 35.Krogh A, Larsson B, von Heijne G & Sonnhammer EL Predicting transmembrane protein topology with a hidden Markov model: application to complete genomes. J. Mol. Biol 305, 567–580 (2001). [DOI] [PubMed] [Google Scholar]
- 36.Käll L, Krogh A & Sonnhammer EL A combined transmembrane topology and signal peptide prediction method. J. Mol. Biol 338, 1027–1036 (2004). [DOI] [PubMed] [Google Scholar]
- 37.Reynolds SM, Käll L, Riffle ME, Bilmes JA & Noble WS Transmembrane topology and signal peptide prediction using dynamic Bayesian networks. PLOS Comput. Biol 4, e1000213 (2008). [DOI] [PMC free article] [PubMed] [Google Scholar]
- 38.Viklund H, Bernsel A, Skwark M & Elofsson A SPOCTOPUS: a combined predictor of signal peptides and membrane protein topology. Bioinformatics 24, 2928–2929 (2008). [DOI] [PubMed] [Google Scholar]
- 39.Zaremba-Niedzwiedzka K et al. Asgard archaea illuminate the origin of eukaryotic cellular complexity. Nature 541, 353–358 (2017). [DOI] [PubMed] [Google Scholar]
- 40.Brown CT et al. Unusual biology across a group comprising more than 15% of domain Bacteria. Nature 523, 208–211 (2015). [DOI] [PubMed] [Google Scholar]
- 41.Anantharaman K et al. Thousands of microbial genomes shed light on interconnected biogeochemical processes in an aquifer system. Nat. Commun 7, 13219 (2016). [DOI] [PMC free article] [PubMed] [Google Scholar]
- 42.Dereeper A et al. Phylogeny.fr: robust phylogenetic analysis for the non-specialist. Nucleic Acids Res 36, W465–W469 (2008). [DOI] [PMC free article] [PubMed] [Google Scholar]
- 43.Guindon S et al. New algorithms and methods to estimate maximum-likelihood phylogenies: assessing the performance of PhyML 3.0. Syst. Biol 59, 307–321 (2010). [DOI] [PubMed] [Google Scholar]
- 44.Buchfink B, Xie C & Huson DH Fast and sensitive protein alignment using DIAMOND. Nat. Methods 12, 59–60 (2015). [DOI] [PubMed] [Google Scholar]
- 45.Suzek BE, Wang Y, Huang H, McGarvey PB & Wu CH UniRef clusters: a comprehensive and scalable alternative for improving sequence similarity searches. Bioinformatics 31, 926–932 (2015). [DOI] [PMC free article] [PubMed] [Google Scholar]
- 46.McKinney W Data structures for statistical computing in Python. In Proc. 9th Python in Science Conference. (eds van der Walt S & Millman J) 51–56 (SciPy, Austin, 2010). [Google Scholar]
- 47.Kluyver T et al. Juypter notebooks – a publishing format for reproducible computational workflows. In Positioning and Power in Academic Publishing: Players, Agents and Agendas. Proc. 20th International Conference on Electronic Publishing. (eds Loizides F & Schmidt B) 87–90 (IOS, Amsterdam, 2016). [Google Scholar]
- 48.Inoue K et al. A light-driven sodium ion pump in marine bacteria. Nat. Commun 4, 1678 (2013). [DOI] [PubMed] [Google Scholar]
- 49.Inoue K et al. A natural light-driven inward proton pump. Nat. Commun 7, 13415 (2016). [DOI] [PMC free article] [PubMed] [Google Scholar]
- 50.Yamauchi Y et al. Molecular properties of a DTD channelrhodopsin from Guillardia theta. Biophys. Physicobiol 14, 57–66 (2017). [DOI] [PMC free article] [PubMed] [Google Scholar]
- 51.Kato HE et al. Structural basis for Na+ transport mechanism by a light-driven Na+ pump. Nature 521, 48–53 (2015). [DOI] [PubMed] [Google Scholar]
- 52.Kawanabe A, Furutani Y, Jung KH & Kandori H FTIR study of the photoisomerization processes in the 13-cis and all-trans forms of Anabaena sensory rhodopsin at 77 K. Biochemistry 45, 4362–4370 (2006). [DOI] [PubMed] [Google Scholar]
- 53.Inoue K, Koua FH, Kato Y, Abe-Yoshizumi R & Kandori H Spectroscopic study of a light-driven chloride ion pump from marine bacteria. J. Phys. Chem. B 118, 11190–11199 (2014). [DOI] [PubMed] [Google Scholar]
- 54.Krebs RA, Alexiev U, Partha R, DeVita AM & Braiman MS Detection of fast light-activated H+ release and M intermediate formation from proteorhodopsin. BMC Physiol 2, 5 (2002). [DOI] [PMC free article] [PubMed] [Google Scholar]
- 55.Tanimoto T, Furutani Y & Kandori H Structural changes of water in the Schiff base region of bacteriorhodopsin: proposal of a hydration switch model. Biochemistry 42, 2300–2306 (2003). [DOI] [PubMed] [Google Scholar]
- 56.Furutani Y et al. FTIR spectroscopy of the O photointermediate in pharaonis phoborhodopsin. Biochemistry 43, 5204–5212 (2004). [DOI] [PubMed] [Google Scholar]
- 57.Camacho C et al. BLAST+: architecture and applications. BMC Bioinformatics 10, 421 (2009). [DOI] [PMC free article] [PubMed] [Google Scholar]
Associated Data
This section collects any data citations, data availability statements, or supplementary materials included in this article.
Supplementary Materials
Data Availability Statement
The fosmid KIN48C12 sequence has been deposited in the GenBank under accession number MF737519. All other data are available from the corresponding authors upon request.