

Abstract
Tristetraprolin (TTP; also known as NUP475, GOS24, or TIS11)), encoded by Zfp36, is an RNA -binding protein that regulates target gene expression by promoting mRNA decay and preventing translation. Although previous studies have indicated that TTP deficiency is associated with systemic inflammation and a catabolic-like skeletal phenotype, the mechanistic underpinnings remain unclear. Here, using both TTP-deficient (TTPKO) and myeloid-specific TTPKO (cTTPKO) mice, we reveal that global absence or loss of TTP in the myeloid compartment results in a reduced bone microarchitecture, whereas gain-of-function TTP knock-in (TTPKI) mice exhibit no significant loss of bone microarchitecture. Flow cytometry analysis revealed a significant immunosuppressive immune cell phenotype with increased monocytic myeloid-derived suppressor cells (M-MDSCs) in TTPKO and cTTPKO mice, whereas no significant changes were observed in TTPKI mice. Single-cell transcriptomic analyses of bone marrow myeloid progenitor cell populations indicated a dramatic increase in early MDSC marker genes for both cTTPKO and TTPKO bone marrow populations. Consistent with these phenotypic and transcriptomic data, in vitro osteoclastogenesis analysis of bone marrow M-MDSCs from cTTPKO and TTPKO displayed enhanced osteoclast differentiation and functional capacity. Focused transcriptomic analyses of differentiated M-MDSCs showed increased osteoclast-specific transcription factors and cell fusion gene expression. Finally, functional data showed that M-MDSCs from TTP loss-of-function mice were capable of osteoclastogenesis and bone resorption in a context-dependent manner. Collectively, these findings indicate that TTP plays a central role in regulating osteoclastogenesis through multiple mechanisms, including induction of M-MDSCs that appear to regulate skeletal phenotype.
Keywords: Tristetraprolin, myeloid derived suppressor cells, transcriptome, osteoclasts, osteoimmunology
Graphical Abstract
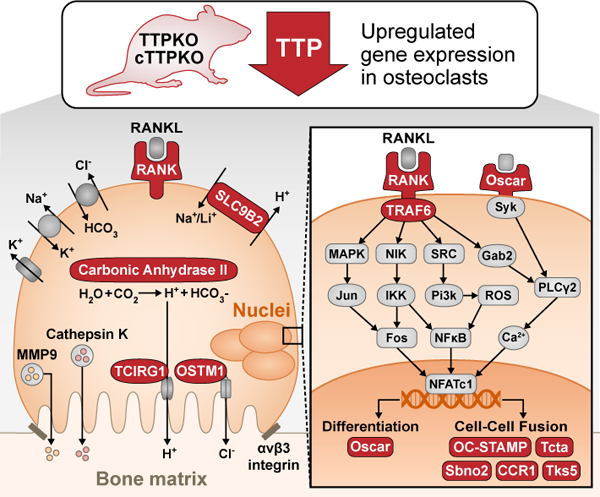
Mechanisms of Tristetraprolin (TTP) to control osteoclast differentiation and bone resorption activity with implications in skeletal aging.
Introduction
The adult skeleton is continuously remodeled throughout life through crosstalk between osteoclasts and osteoblasts (1, 2). Osteoclasts are the only cells capable of resorbing bone and are differentiated from progenitor cells of the myeloid lineage (2–5). Osteoclasts play a central role in bone homeostasis in bone remodeling when balanced with osteoblast-mediated bone formation. However, several inflammatory-associated bone pathologies including arthritis, osteoporosis, and periodontitis, manifest due to excessive osteoclastic activity. Critical to initiate osteoclast formation from myeloid progenitors is macrophage colony-stimulating factor (M-CSF) and C-FMS (or CSF1R) that promote proliferation and survival signals and induces receptor activator of NF-κB (RANK) expression and RANK-RANK ligand (RANKL) interaction is indispensable for differentiation, proliferation, and function of osteoclasts from precursor cells (6, 7). As a direct consequence of RANK-RANKL interaction, downstream signaling activates NF-κB and MAPK signaling pathways, resulting in expression of NFATc1, a master transcription regulator of osteoclastogenesis, resulting in a fully mature osteoclast (8).
Tristetraprolin (TTP) is an RNA-binding protein essential for promoting degradation of target mRNAs, including tumor necrosis factor (TNF)-α, as well as several other immune-associated mRNAs (9, 10). TTP-deficient (TTPKO) mice appear healthy at birth, but soon develop severe inflammatory phenotypes such as splenomegaly, myeloid hyperplasia, arthritis, and cachexia (11). However, stromal-derived TTP was shown to play a major contributory role to systemic inflammation because myeloid-specific TTP-deficient (cTTPKO) mice did not show severe inflammation despite being highly susceptible to low-dose LPS (12). In contrast, TTP knock-in (TTPKI) mice, which exhibit moderate TTP overexpression from the endogenous gene locus, appeared to be protected from several inflammatory diseases, including a mouse model of rheumatoid arthritis (13). Similar studies from our group showed that local overexpression of TTP protected against inflammatory oral bone loss (14). Collectively, these studies support the concept that modulation of TTP expression is critical in bone-related inflammation through alternations in innate and adaptive immune cell populations (11, 15).
Myeloid cell subpopulations are key mediators for immune response and bone homeostasis. Myeloid-derived suppressor cells (MDSCs) are a heterogeneous population of immune cells from the myeloid-cell lineage. In mice, MDSCs are characterized as cells positive for cell surface markers, Gr-1 and CD11b (Gr-1+CD11b+). To date, two major subsets of MDSCs have been characterized: monocytic (M)-MDSCs are described as CD11b+Ly6G-Ly6Chi and granulocytic (PMN)-MDSCs as CD11b+Ly6G+Ly6Clo. MDSCs have been found in multiple tissues including the bone marrow, blood, lymph nodes, and spleen (16–18). Several studies support M-MDSC plasticity as osteoclast precursors in various pathological conditions associated with bone destruction (19–23). M-MDSC plasticity has been demonstrated mainly in tumor models where M-MDSCs isolated from tumor-bearing mice with bone metastasis have the capacity to differentiate into functional bone-resorbing osteoclasts in vitro and in vivo (23). More recently, it has been reported that M-MDSCs are differentiated into osteoclasts even in mice with inflammatory bone diseases, including arthritis or periodontal disease (20, 24, 25).
TTP expression within myeloid tissues is known to decrease with aging (26). Original studies over two decades ago demonstrated that TTP-deficient mice exhibited significantly increased bone marrow myelopoiesis (11). Our group has more recently performed an in-depth examination of the hematopoietic stem cells using single-cell transcriptomics integrated with comprehensive flow cytometric analyses provided a detailed analysis of the myeloid precursor population shifts within global and myeloid-specific TTP deficient mice. We established that TTP-deficient mice, which mimic age-associated myelopoiesis, have significantly mobilized M-MDSCs from the bone marrow through a mechanism where CC chemokine receptor 2 (CCR2)/CC chemokine ligand 2 (CCL2) axis plays a key role (27). Additionally, we had reported that TTP has a major protective effect on alveolar (oral) bone homeostasis with age (15). Since TTP regulates inflammation by inhibiting multiple proinflammatory cytokines at the post-transcriptional level, it is plausible that TTP modulates the fate of M-MDSCs in a context-dependent manner. In this study, we explore the role of TTP in M-MDSC-induced osteoclastogenesis to understand how this expanded myeloid population may contribute towards the aged-skeletal phenotype.
Materials and methods
Mice
All mice on a C57BL/6N background were maintained and housed under specific pathogen-free (SPF) conditions. Wild-type (WT) and Zfp36−/− (TTPKO) mice were generated by crossing by heterozygous dams and all mouse strains (11). TTP knock-in (TTPKI) mice were established to moderately increase TTP mRNA and protein under its own endogenous promoter as used in a previous study(13). Myeloid-specific TTP-deficient (cTTPKO) mice were generated by crossing loxP-flanked Zfp36 (Zfp36flox/flox, TTPf/f)mice with a mouse line expressing a Cre recombinase specific for myeloid lineage (LysMcre) cells(12). Genomic DNA was extracted from tail sections for PCR genotyping, and primers were used as described (27). All animal experiments were performed in the University at Buffalo’s Laboratory Animal Facilities according to an Institutional Animal Care and Use Committee approved protocol with adherence to standards articulated in the Animal Research: Reporting of In Vivo Experiments (ARRIVE).
Micro-computed Tomography (μCT)
The tibia from each animal was fixed in 10% phosphate-buffered formalin for 24 h, washed with phosphate-buffered saline, and stored in 70% ethanol at 4°C. Before scanning, the samples were allowed to warm to room temperature. The change in the bone structure was assessed using a Scanco Medical 100µCT scanner (Scanco Medical, Bruettisellen, Switzerland). The scanner was operated at 70 kVP, 114 µA, 15.2 mm FOV, 500 projections/180°, 500 ms integration time and voxel size of 12 µm. Three-dimensional images were generated, reconstructed, and analyzed using AnalyzePro software (AnalyzeDirect, Inc., Overland Park, KS). These images were rotated with a standard orientation and threshold to discern mineralized and non-mineralized tissue. Regions of interest (ROI) in the proximal portion of the tibia started from the proximal border of the growth plate. Two ROIs of 960 µm each (0–960 and 1200–2160 µm from the growth plate border) were selected, and the proximal part was used for trabecular bone analysis, and the distal part of ROI was used for cortical bone analysis. All images were analyzed individually, and the ROI was applied to each image
Isolation of tissue cells and flow cytometry
Bone marrow cells were obtained by flushing the femur with RPMI 1640 medium, and splenocytes by mincing spleen with RPMI 1640 medium. Erythrocytes were lysed by treating cells with ACK lysis buffer (Gibco, Invitrogen, USA). The cell suspension was passed through a 70-micro strainer (Corning, NY, USA) to obtain a single-cell suspension. For flow cytometry, cells were pre-treated with anti-CD16/32 Fc block (BD) to block Fc receptors. To identify the phenotype of the cells, cells were stained with the following combination of antibodies: CD11b-APC (M1/70), Ly6C-FITC (REA 796), Ly6G-PE (REA 526) (Miltenyi Biotec). Flow cytometry gating strategy was CD11b+Ly6ChiLy6G-; M-MDSC. Samples were read on the LSR Fortessa flow cytometry (BD Biosciences) and analyzed with FlowJo software (version 10.9).
T lymphocyte proliferation assay
CD3+ T lymphocytes were separated from the spleens of WT mice using the CD3ε MicroBead Kit (Miltenyi Biotec). Isolated CD3+ T lymphocytes were labeled with CellTrace Violet (CTV) Cell Proliferation Kit (Invitrogen) according to the manufacturer’s instruction. Stained CD3+ T lymphocytes were plated in 96-well U-bottom assay plate (Corning) and stimulated with anti-CD3 Ab (3μg/ml) and anti-CD28 Ab (5μg/ml, Thermo Fisher Scientific). The activated CD3+ T lymphocytes were co-cultured with isolated M-MDSCs for 3 days. The cells were washed, collected, and stained with anti-CD4-PE-Cy7 (e-Bioscience) and anti-CD8-APC-Vio770 (Miltenyi Biotec). All samples were collected and acquired on MACSQuant System (Miltenyi Biotec) and analyzed with FlowJo software (version 10.9).
Single-cell RNA sequencing
To compare myeloid progenitor population changes following TTP deficiency, we processed the previously sequenced data from femurs of control, TTPKO, and cTTPKO mice (27). After sorting cells through scCATCH, an automated platform for cell type identification, the myeloid compartment was selected and progenitor cell types were labeled as previously described (27). Data were subjected to Seurat normalization followed by the potential of heat diffusion for affinity-based transition embedding (PHATE) dimensionality reduction to cluster cells with similar transcriptomic profiles.
Osteoclast Marker Gene Module Scoring Analysis
To evaluate osteoclast potential, genes within the GO ontology term for osteoclast differentiation (GO:0030316) were evaluated using the Seurat function AddModuleScore for the osteoclast progenitor populations. This function calculates the average expression level of the selected gene set, in this case 136 marker genes contained within the ontology and is subtracted by the average expression of a randomly selected background gene set. A module score of less than zero indicates that the selected features are expressed less than expected for a given cluster, while scores above zero indicate the feature set is expressed higher than expected.
In Vitro Osteoclastogenesis and Bone Resorption Assay
M-MDSCs were isolated from the bone marrow and sorted by an AutoMACS pro separator using the Myeloid-Derived Suppressor Cell Isolation Kit (Miltenyi Biotec, USA). For the osteoclastogenic differentiation, M-MDSCs were seeded at 1×10⁵/well in a 48-well plate. For functional examination of osteoclasts, 1×10⁵/well of M-MDSCs were cultured on Corning Osteo Assay Surface 24-well plates (Corning, NY, USA) coated with calcium phosphate substrate. M-MDSCs were cultured in the presence of monocyte colony-stimulating factor (M-CSF; 25 ng/ml, R&D Systems) and RANKL (50 ng/ml, R&D Systems) in α-MEM media (Gibco, USA) containing 10% FBS, 1% penicillin/streptomycin and incubated for 8 days. Osteoclast formation was assessed using ImageJ analysis software after tartrate-resistant acid phosphatase (TRAP) staining, and pit formation was evaluated using ImageJ analysis software.
Serum enzyme-linked immunosorbent assay
For serum, blood samples were collected from each animal by cardiac puncture. The collected blood was incubated at room temperature for 30 min and centrifuged at 1,000 x g for 10 min to obtain serum. Serum levels of TRAcP5b were quantified using a microplate reader (BioTek Instruments, USA) according to the manufacturer’s instructions (Immunodiagnostic systems, USA).
Focused Transcriptomic Analyses
M-MDSCs were isolated and cultured in osteoclast differentiation medium for 8 days. mRNA was isolated from cultured cells, and expression profiling was performed using the NanoString nCounter gene expression system (NanoString Technologies, Seattle, WA). A total of 85 gene subsets were analyzed using the nCounter custom mouse Osteoclast_520 Profiling Panel designed by Mouse Genome Informatics by selecting “Osteoclast Differentiation” in the Gene Ontogeny Browser. RNA counts were normalized to housekeeping gene groups, and differentially expressed genes were calculated using a 2-sample t-test, and the results were visualized with R studio (1.0.143) using the pheatmap (1.0.12) package. We used QIAGEN’s Ingenuity Pathway Analysis (IPA, QIAGEN Redwood City, http://www.ingenuity.com) software to determine the upstream regulators. Significantly regulated genes were sorted by using a Venn diagram generator (http://bioinfogp.cnb.csic.es/tools/venny). We corrected the detection p-value using the Bonferroni method and set 0.05 as the significant threshold.
Intratibial Injection and Histological Examination
M-MDSCs isolated from cTTPKO and its littermate control mice were injected into the right tibia of 3-month-old male WT mice as described.(28–30) PBS was sham-injected into the right tibia of the control group. Briefly, mice were anesthetized, and tibia was surgically exposed. With the knee flexed, the cell suspension (5 × 10⁵ cells suspended in 20 μL sterile PBS) or PBS (20 μL) was injected into the proximal space of the bone marrow of the tibia using a 27-gauge needle. After 9 days, the mice were sacrificed, and bone parameters were assessed by μCT. After μCT, tibiae were decalcified using 0.5-M ethylenediaminetetraacetic acid (EDTA). Serial 5-μm-thick bone sections were stained with TRAP and fast green (counter stain) to enumerate osteoclasts as previously indicated (15). ImageJ software was used to quantify the number of osteoclasts per bone perimeter (N.Oc/BPm, mm−1) and the amount of bone surface covered by osteoclasts (Oc.S/BS, %), these measurements.
Statistical Analysis
Statistical analysis was done with GraphPad Prism 9.4 (GraphPad Software Inc., La Jolly, CA) with unpaired Student t tests, one and two-way analysis of variance (ANOVA) followed by Tukey’s multiple comparisons test. For scRNA-seq, per-cell gene expression was log-normalized using the Seurat function NormalizeData with default parameters, followed by data scaling using ScaleData. Differential expression testing was performed using the Wilcoxon Rank Sum test, using Seurat’s FindMarkers and FindAllMarkers functions with default parameter sets. For NanoString experiments, data were analyzed according to NanoString recommendations (http://www.nanostring.com/wp-content/uploads/Gene_Expression_Data_Analysis_Guidelines.pdf). All reported data of P-values less than 0.05 were considered statistically significant.
Results
TTP deficiency accelerates the loss of bone microarchitecture
Initial observations about the overall phenotype of TTP mutant mice indicated that the male 3-month-old TTPKO mice exhibited a smaller body phenotype compared to the WT control mice. However, the TTPKI, and cTTPKO mice showed no significant difference from the control mice (Fig 1A–B). To explore the role of loss- and gain-of-function of TTP on the bone microstructure, we first evaluated static histomorphometric parameters of the tibia using micro-computed tomography (μCT). Three-dimensional (3D) reconstruction of μCT tibial scans indicated that TTPKI showed no significant difference in bone microarchitecture compared to control mice, whereas the TTPKO and cTTPKO mice showed an osteopenic phenotype compared to the respective controls (Fig 1C–D). Quantification of the bone volume fraction (BV/TV) revealed significant increase in the TTPKI mice, whereas BV/TV was significantly decreased in both the TTPKO and cTTPKO mice compared to controls (Fig 1E). Quantification of the μCT data, demonstrated no change in TTPKI mice, whereas, in TTPKO and cTTPKO mice, trabecular thickness (Tb. Th) and trabecular number (Tb. N) decreased, and trabecular separation (Tb. Sp) increased as the effect of TTP disappeared (Fig 1F–H). Additionally, while there was no change in TTPKI mice, the cortical area fraction (Ct. Ar/Tt. Ar) and cortical thickness (Ct. Th) of the tibia were significantly reduced in TTPKO and cTTPKO mice compared to controls (Fig 1I–J). To determine whether TTP affects longitudinal bone growth, tibia length was measured. TTPKI mice showed no significant change compared to WT control. In contrast, both TTPKO and cTTPKO mice showed significant decreases compared to the controls, with TTPKO mice revealing a greater decrease, suggesting that the loss of TTP affects longitudinal bone growth as well as bone microarchitecture (Fig S1). Similar alterations in these bone microarchitecture changes were observed in female mice, indicating no sex-related differences (Fig S2).
Figure 1. Bone microarchitecture showed a significant osteolytic phenotype in TTPKO/cTTPKO mice.
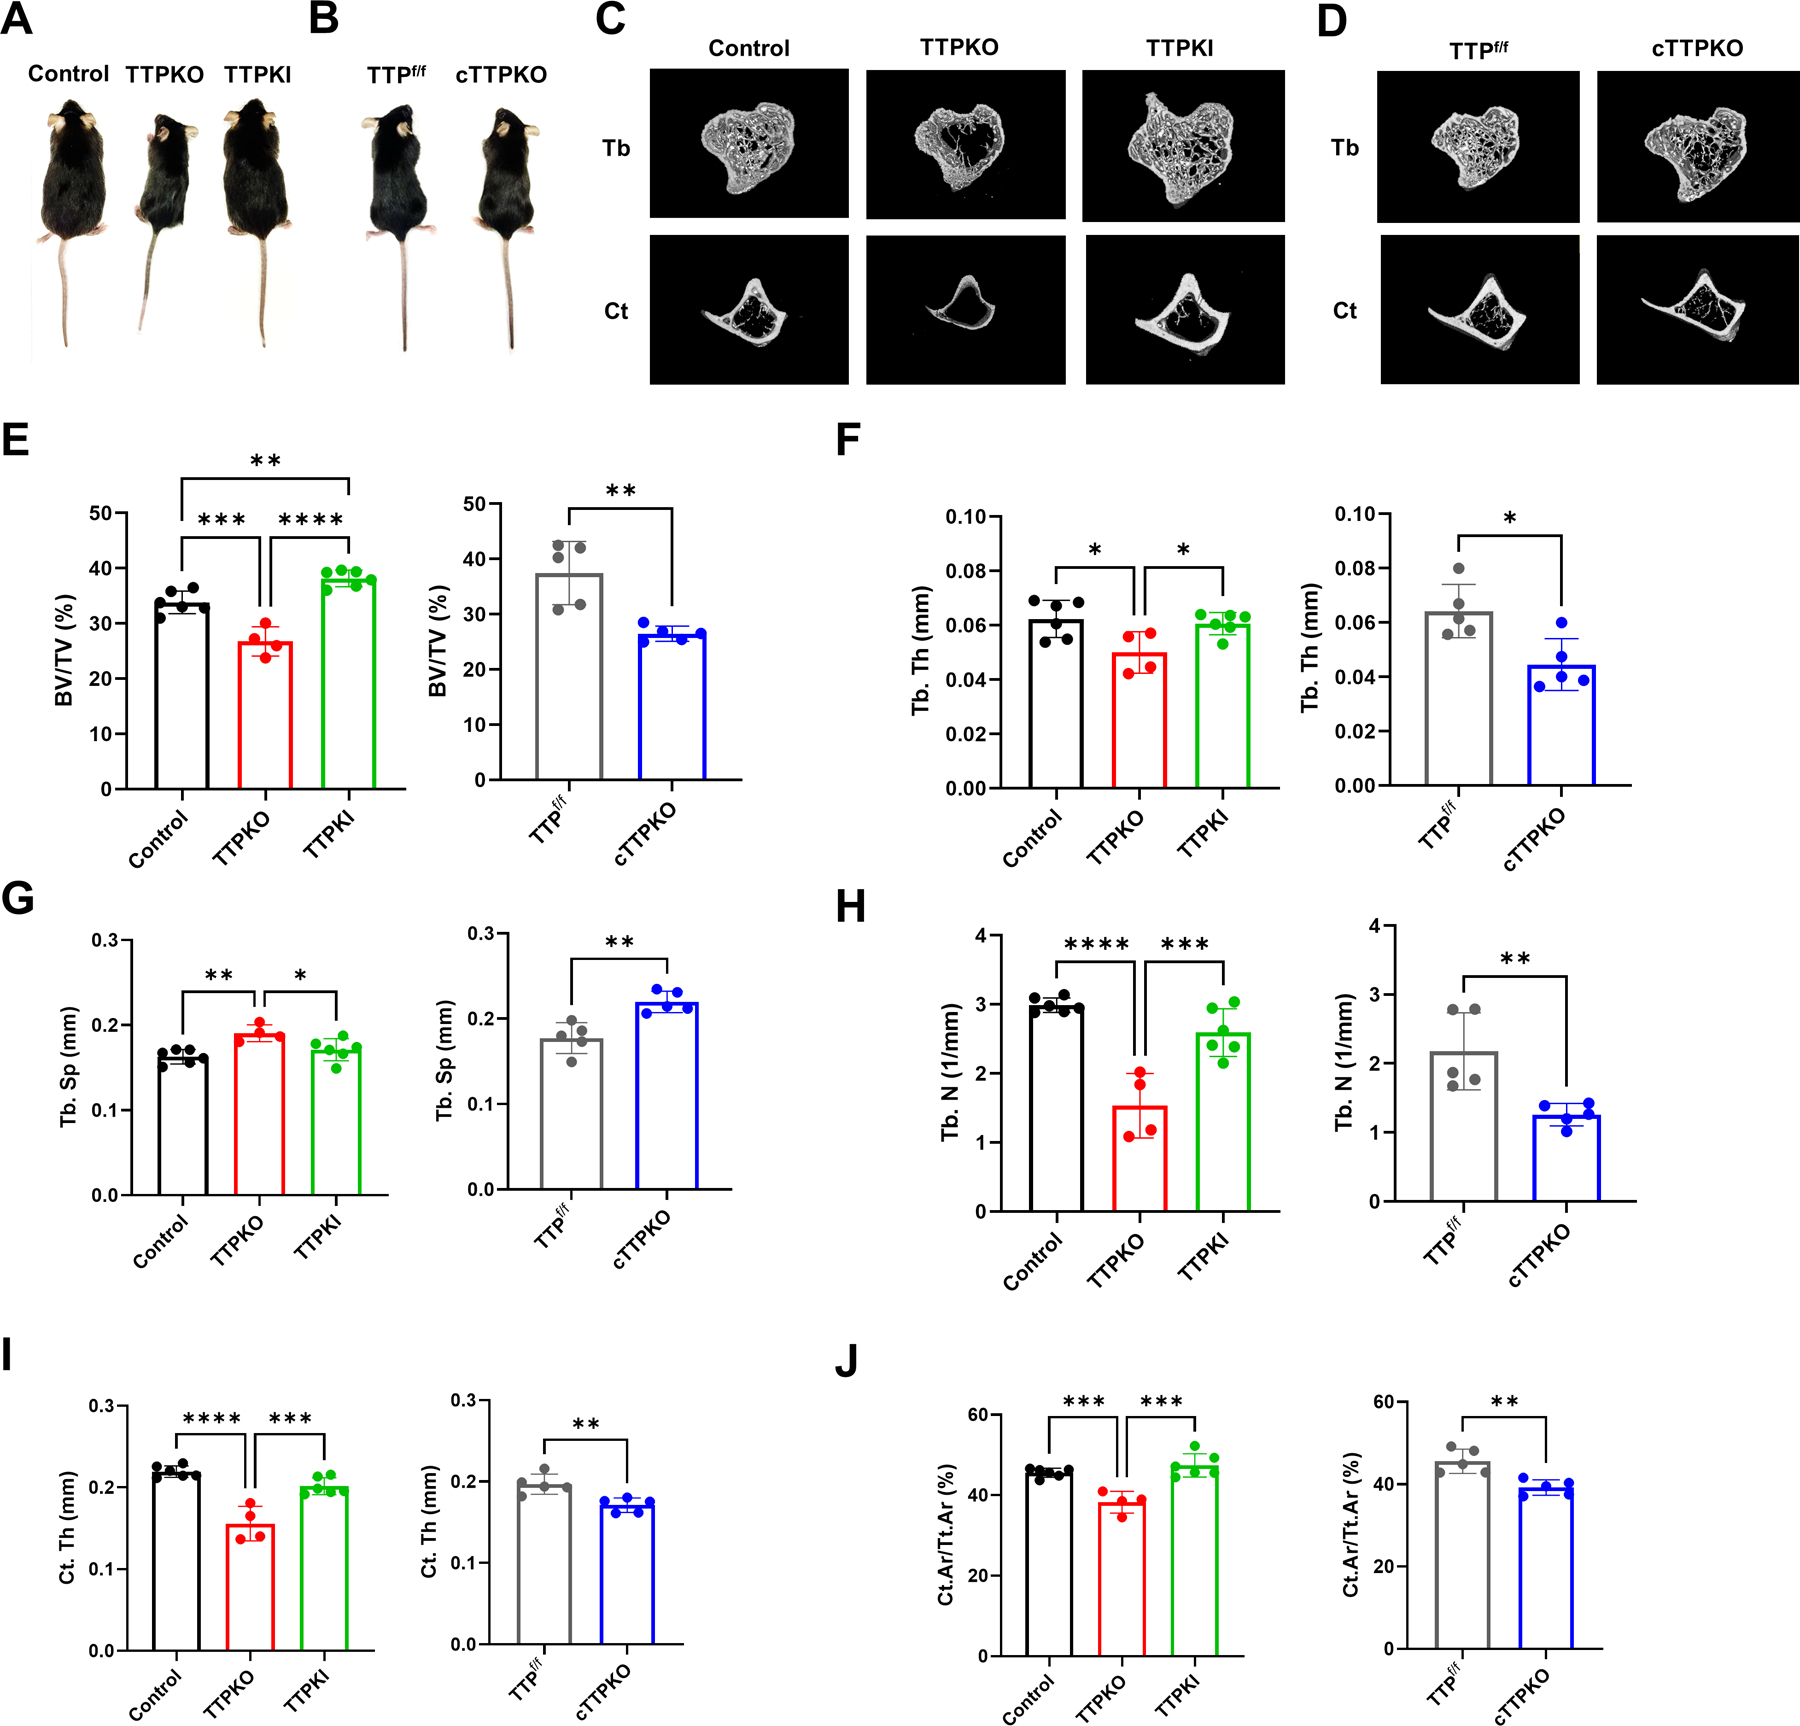
(A-B) Representative gross appearance of 3-month-old control, TTPKO, and TTPKI mice (A) and TTPf/f control, cTTPKO mice (B). (C-D) Representative microcomputed tomography (μCT) images showing quantitative bone loss in TTPKO/TTPKI mice (C) and cTTPKO mice (D). (E-J) Quantification of the bone parameters in the tibia. Quantitative analysis of the bone volume fraction (BV/TV, E), trabecular thickness (Tb.Th, F), trabecular separation (Tb.Sp, G), trabecular number (Tb.N, H), cortical thickness (Ct.Th, I), cortical area fraction (Ct.Ar/Tt.Ar, J). One-way analysis of variance with Tukey’s multiple comparisons test and unpaired t test; data are presented as mean ± SEM, *P < 0.05, **P < 0.01, ***P < 0.001, ****P < 0.0001.
TTP status alters M-MDSC populations within the spleen
Recent studies from our group have shown that altered TTP expression greatly influences bone myeloid stem cell population expansion with concomitant increased M-MDSCs in peripheral tissues (27). Because of these observations, we wanted to understand the bone phenotypic changes that may directly or indirectly result from the altered M-MDSCs expansion and differentiation. The frequency of M-MDSCs (CD11b+Ly6ChiLy6G-) in the bone marrow was not significantly different between mice, whereas in the spleen it was significantly increased in both TTPKO and cTTPKO mice compared to controls, but no changes were observed in TTPKI mice (Fig 2A–C). To demonstrate that such M-MDSCs were in fact immune suppressive, T lymphocyte proliferation assays were performed. Indeed, all M-MDSCs were shown to be suppressive for both CD4+ and CD8+ T lymphocytes, consistent with the M-MDSC phenotype (Fig 2D–E). These results suggest that TTP is one of the key factors regulating M-MDSC populations.
Figure 2. TTP deficiency increases M-MDSC expansion.
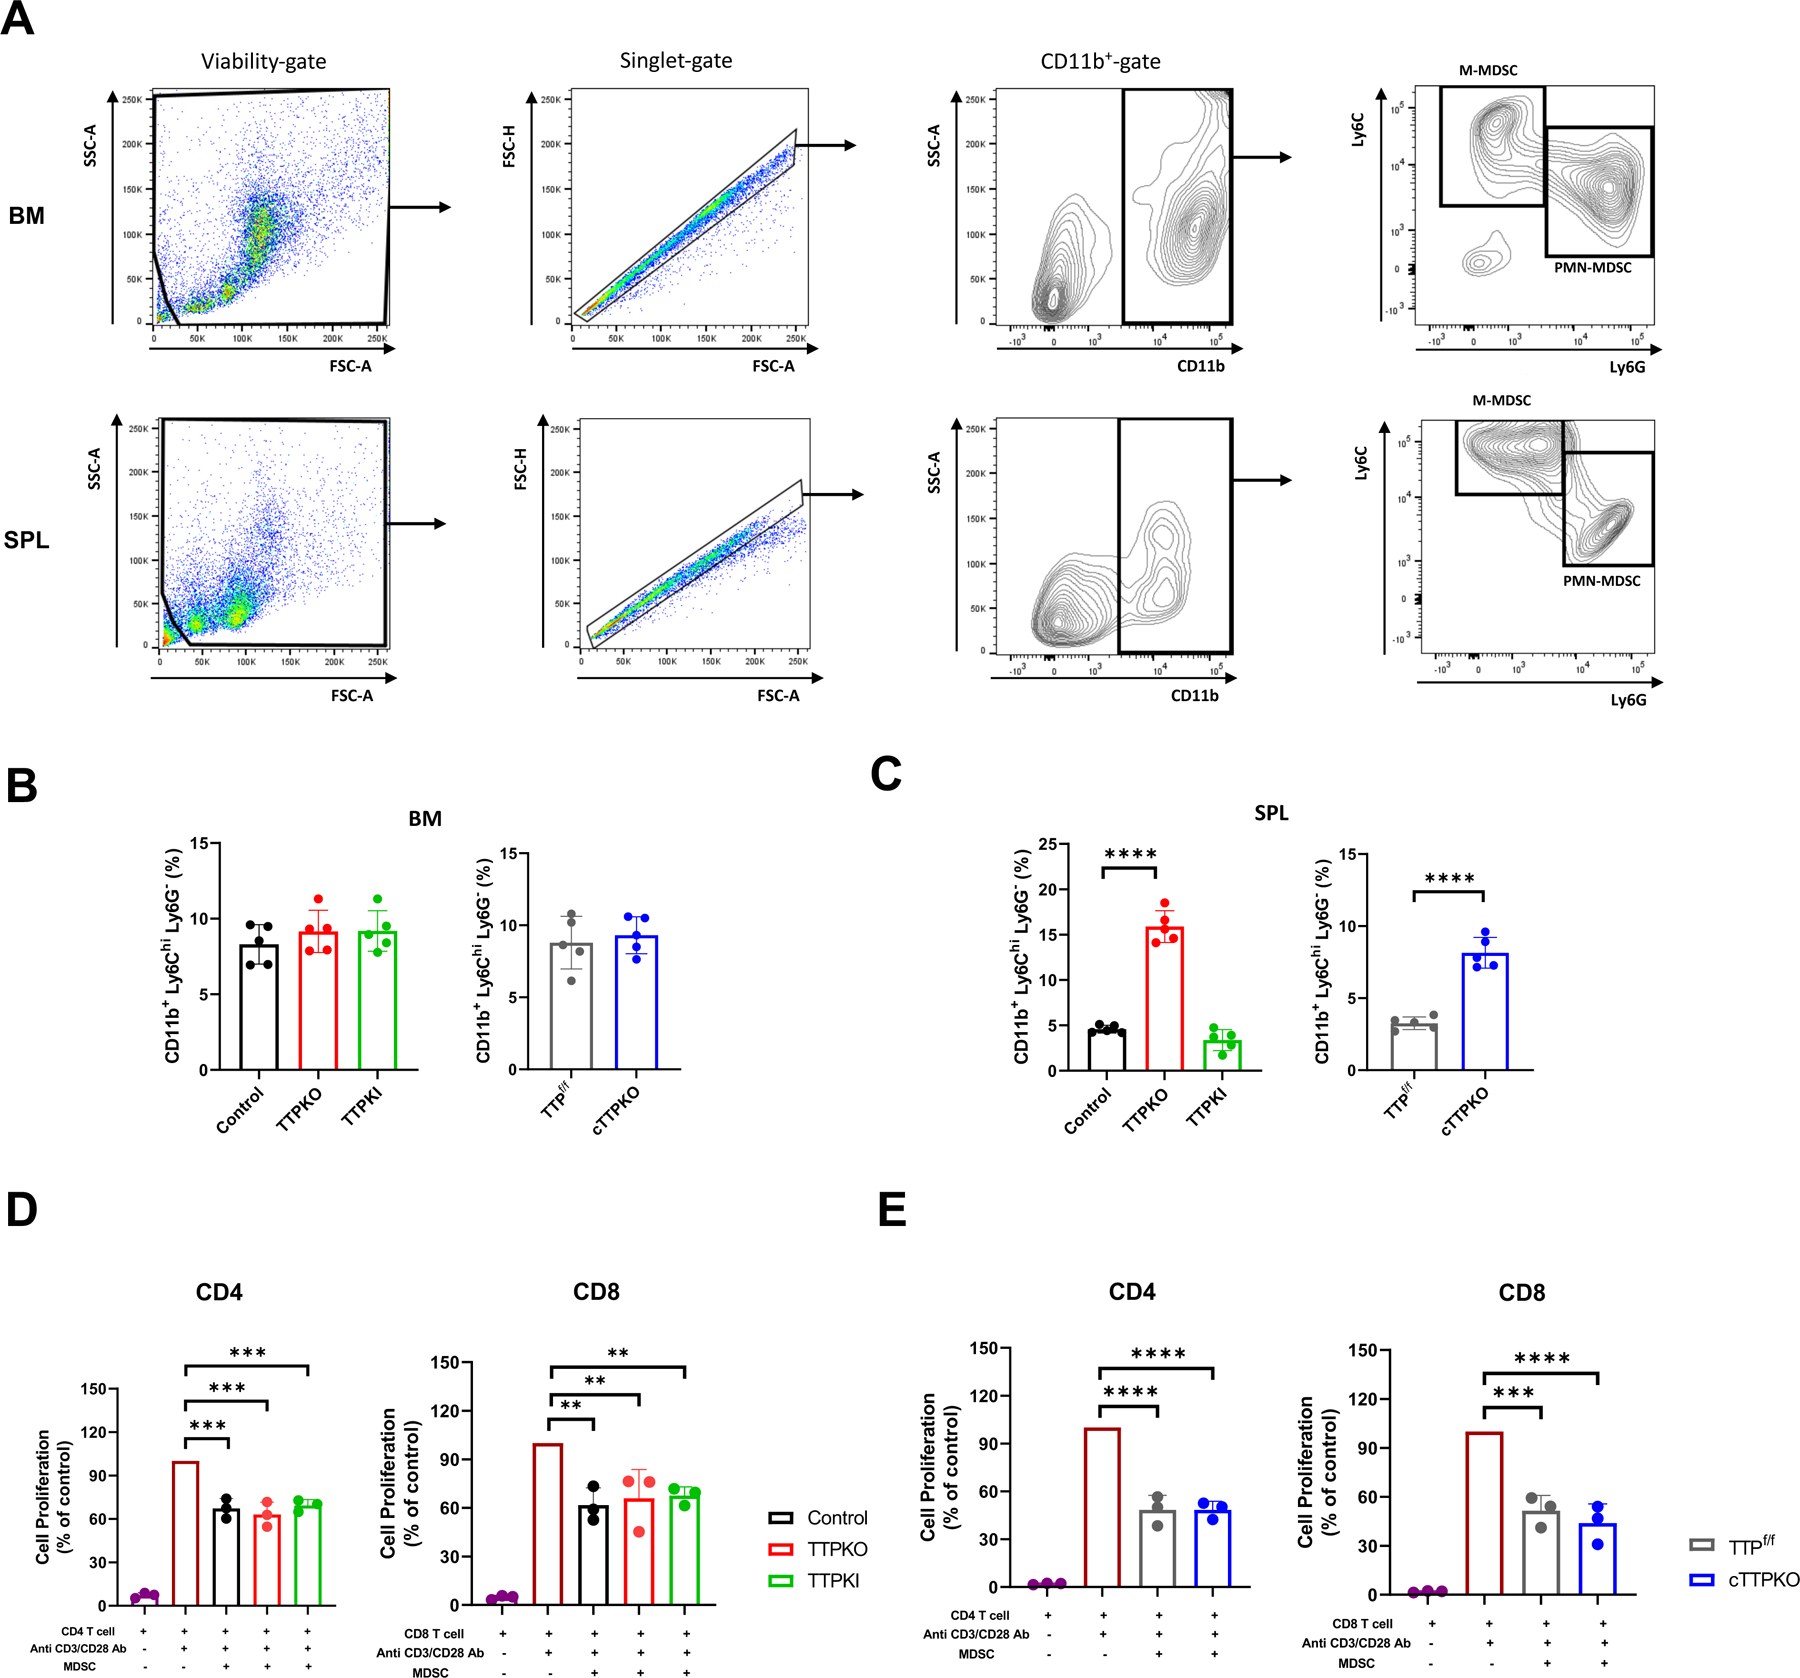
(A) Representative gating strategy of bone marrow (top) and spleen (bottom) cell populations for flow cytometry. (B) Flow cytometry analysis of M-MDSC populations in bone marrow from control, TTPKO, TTPKI, TTPf/f, and cTTPKO mice. (C) Flow cytometry analysis of M-MDSC populations in spleen from control, TTPKO, TTPKI, TTPf/f, and cTTPKO mice. (D-E) T lymphocyte proliferation assay of M-MDSCs isolated from bone marrow. (D) CD4+ T lymphocyte (left) and CD8+ T lymphocyte (right) proliferation assay using M-MDSCs isolated from control (black), TTPKO (red), and TTPKI (green) mice. (E) CD4+ T lymphocyte (left) and CD8+ T lymphocyte (right) proliferation assay using M-MDSCs isolated from TTPf/f (grey), and cTTPKO (blue) mice. One-way analysis of variance with Tukey’s multiple comparisons test and unpaired t test; data are presented as mean ± SEM, *P < 0.05, **P < 0.01, ***P < 0.001, ****P < 0.0001.
Single-cell RNA sequence analysis revealed high expression of osteoclast markers in early MDSC populations
In this series of single-cell RNA sequence analyses, C57BL/6N wild-type (WT) mice were used as controls because there were no significant differences in myeloid populations between WT and TTPf/f mice (Fig S3). To appreciate transcriptomic changes in MDSCs expanded from mice lacking TTP, we analyzed single-cell RNA sequence data focusing on myeloid progenitor populations and obtained 12 distinct cell populations (Fig 3A). Consistent with flow cytometry data showing M-MDSC peripheral expansion, the transcript profiles of early MDSCs were increased in cTTPKO and TTKO mice compared to the control mice (Fig 3B). To determine whether the increases in early MDSCs were primed for osteoclast differentiation in the bone marrow, we generated an osteoclast marker gene module score for the myeloid progenitor cell populations. In cTTPKO and TTPKO mice, the osteoclast marker gene module score was higher in early monocytes and early MDSCs, whereas no significant changes were observed in granulocyte-monocyte progenitor (GMP) and common monocyte progenitor/monocyte progenitor (cMoP/MP) clusters (Fig 3C). Because the osteoclast marker gene module scoring was increased in MDSC progenitor clusters, the expression levels of key genes related to osteoclast differentiation were compared. Expression of Csf1r, which is central to the differentiation of osteoclast precursor cells, Fos encoding c-Fos, also essential for osteoclast differentiation, along with Traf6, a major signaling adaptor for RANK, and Nfatc1, a master regulator of osteoclastogenesis, were all increased in cTTPKO and TTPKO mice compared to the controls (Fig 3D). Since the cell cycle plays an important regulatory role in cell differentiation, (31) the cell cycle was observed to determine whether changes in the myeloid progenitor populations affected the monocyte cluster. We found that the lack of TTP caused changes in the myeloid progenitor populations, resulting in different cell cycles in monocyte clusters (Fig S3). These results suggest that the lack of TTP increases early MDSCs and primes early MDSCs in the bone marrow to readily differentiate into osteoclasts.
Figure 3. scRNA-sequencing shows increased osteoclast potential in MDSC progenitors.
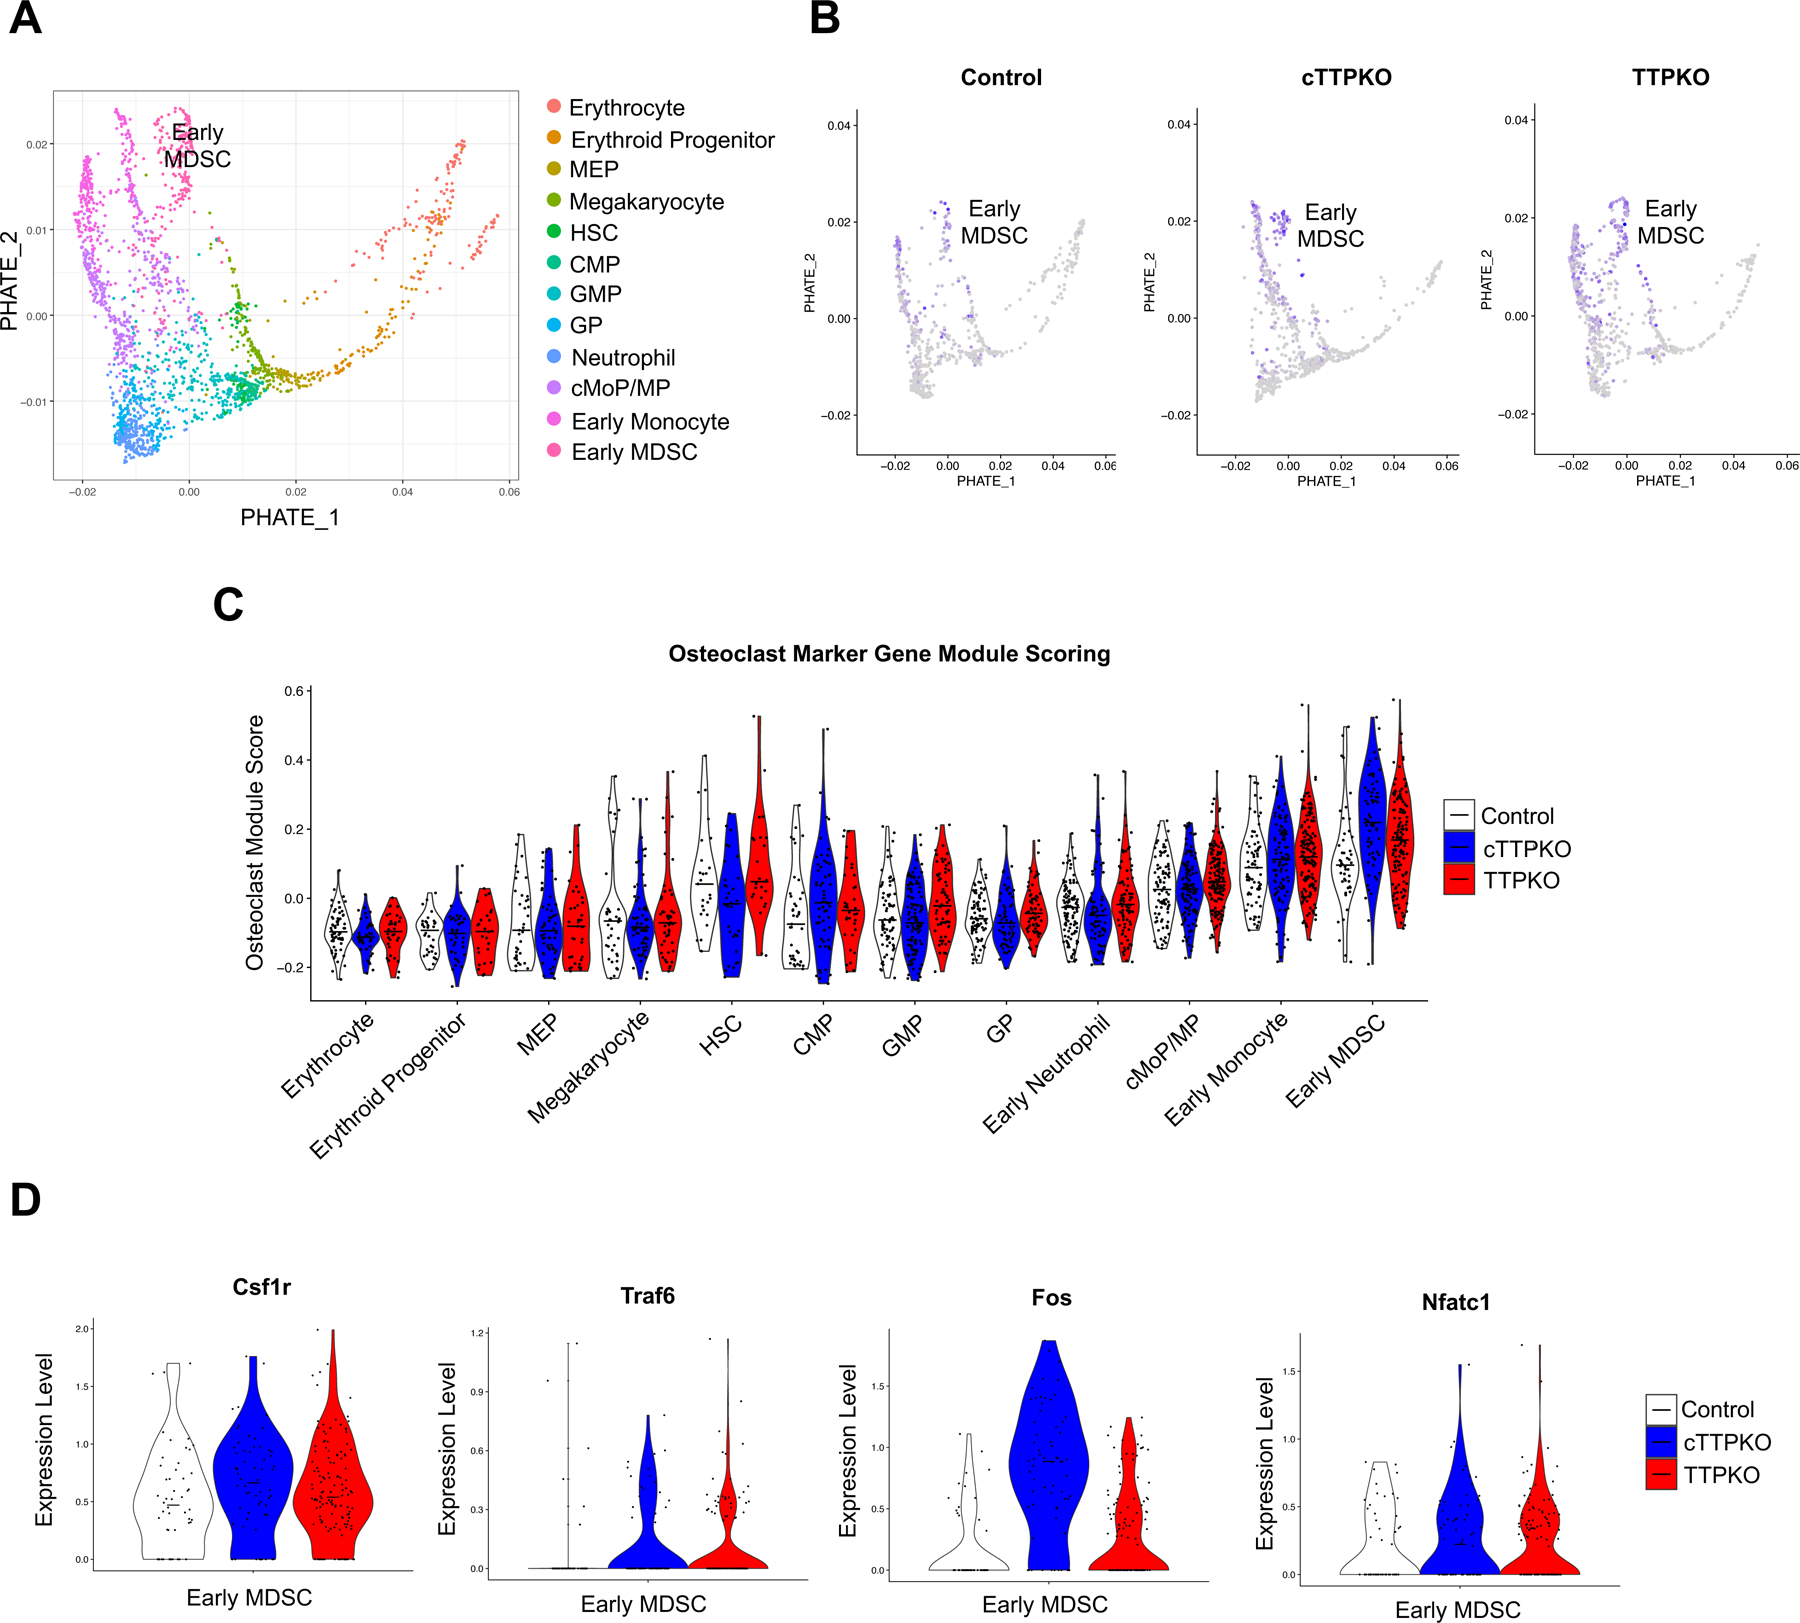
(A) PHATE dimension reduction on progenitor cell populations from scRNA sequencing from mouse bone marrow. (B) Feature plots of Osteoclast module scoring from control, cTTPKO and TTPKO mice. (C) Violin plots of osteoclast module scoring by progenitor type and sample. The mid-line represents the mean osteoclast module score. (D) Expression of Osteoclast marker genes that show increased expression in cTTPKO and TTPKO mice in the MDSC population.
TTP deficiency enhances the osteoclastogenic potential of M-MDSCs
Because MDSC progenitor cells from the bone marrow have the potential to differentiate into osteoclasts, a TRAP assay was performed to enumerate osteoclasts and directly compare osteoclastogenesis between M-MDSCs from TTP-mutant mouse strains. M-MDSCs from cTTPKO and TTPKO mice formed significantly larger osteoclasts and exhibited a greater capacity to form mature osteoclasts (≥3 nuclei/OC) under the same in vitro experimental conditions compared to M-MDSCs from control mice (Fig 4A–B). Quantitative analysis of TRAP+ staining of osteoclast formation revealed that osteoclast number/area was higher in TTPKO/cTTPKO mice (Fig 4C). Quantitative analysis of the ‘pit’ assay showed that resorption was significantly increased in TTPKO/cTTPKO mice, whereas it was significantly decreased in TTPKI mice (Fig 4D). For quantitative measurement of tartrate-resistant acid phosphatase activity isoform 5b (TRAcP 5b), ELISAs were performed using sera. Similarly, there was a significant increase in TTPKO/cTTPKO mice, while no change was observed in TTPKI mice (Fig 4E). C-telopeptide of type 1 collagen (CTX-1) was also measured; however, no significant differences were observed (data not shown).
Figure 4. TTP deficiency increases osteoclastogenic differentiation potential in vitro.
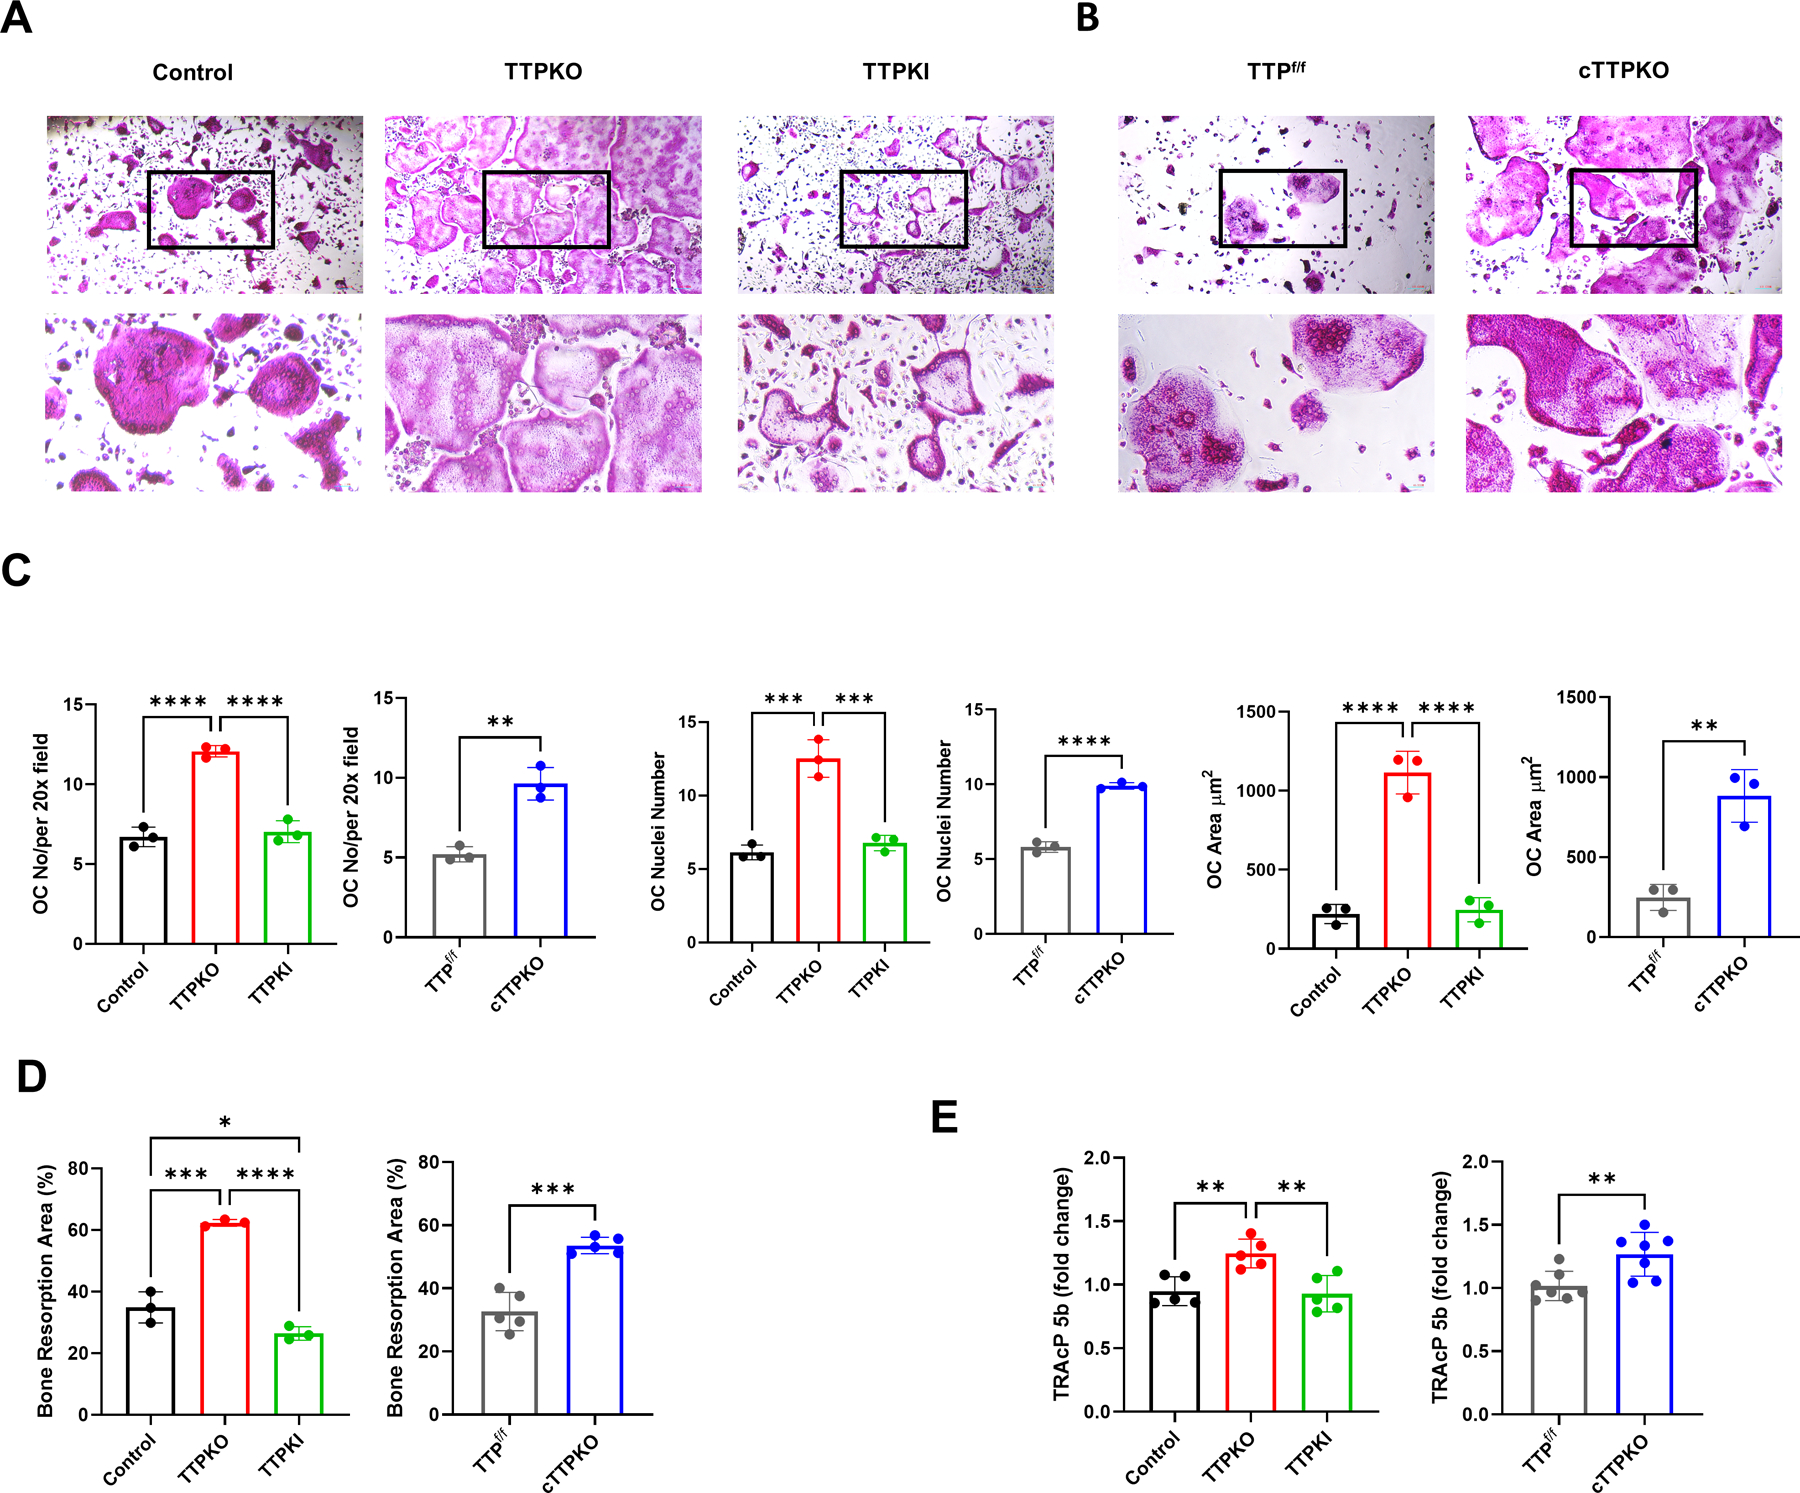
(A-B) Representative tartrate-resistant acid phosphate (TRAP) stain in which M-MDSCs from control/TTPKO/TTPKI (A) and TTPf/f/cTTPKO (B) mice were cultured in osteoclastogenic differentiated medium. (C) Osteoclast cellular endpoints were performed on TRAP-stained control/TTPKO/TTPKI and TTPf/f /cTTPKO mice. (D) Osteoclasts were generated from M-MDSCs in bone resorption assay plates under osteoclast differentiation medium. (E) Serum levels of tartrate-resistant acid phosphatase 5b (TRAcP5b) in TTPKO/TTPKI and cTTPKO mice compared to controls. One-way analysis of variance with Tukey’s multiple comparisons test and unpaired t test; data are presented as mean ± SEM, *P < 0.05, **P < 0.01, ***P < 0.001, ****P < 0.0001.
TTP status changes transcriptomic profiles in osteoclastogenesis
To compare the mRNA transcripts related to osteoclast differentiation in each gene, M-MDSCs of each mouse were cultured in osteoclast differentiation medium, and NanoString analysis was performed focusing on the osteoclast differentiation profile (Supplementary Table 1). We used heatmaps to visualize the gene expression profiles of mice, which clearly differentiated control versus TTPKO mice, especially TTPKO/TTPKI mice (Fig 5A). Similarly, gene expression profiles were clearly distinguished between control and cTTPKO mice (Fig 5B). To predict transcriptional regulators, upstream regulator analysis in Ingenuity Pathway Analysis (IPA) was performed. In M-MDSCs of TTPKO and cTTPKO mice, there were many activated transcriptional regulators, whereas, in M-MDSCs of TTPKI mice, there were many inhibited transcriptional regulators (Fig 5C). In particular, Tnfsf11, Mitf, and Epo are activated in M-MDSCs of TTPKO and cTTPKO mice and inhibited in M-MDSCs of TTPKI mice, highlighting that they are critical effectors of TTP regulation in osteoclastogenesis (Fig 5C). We present Venn diagrams of up-/down-regulated genes compared to the WT control samples (Fig 5D). We detected 64 genes that were differentially expressed compared to WT control out of a total of 85 genes. Among them, 39 genes were upregulated, and 25 genes were downregulated. Among the 39 upregulated genes, 18 were shared between TTPKO and cTTPKO mice. Conversely, 16 of the total 25 downregulated genes were found only in TTPKI mice, indicating that overexpression of TTP downregulated the differentiation of M-MDSCs into osteoclasts.
Figure 5. Gene expression profile of osteoclast differentiation increases in M-MDSCs of TTPKO/cTTPKO mice.
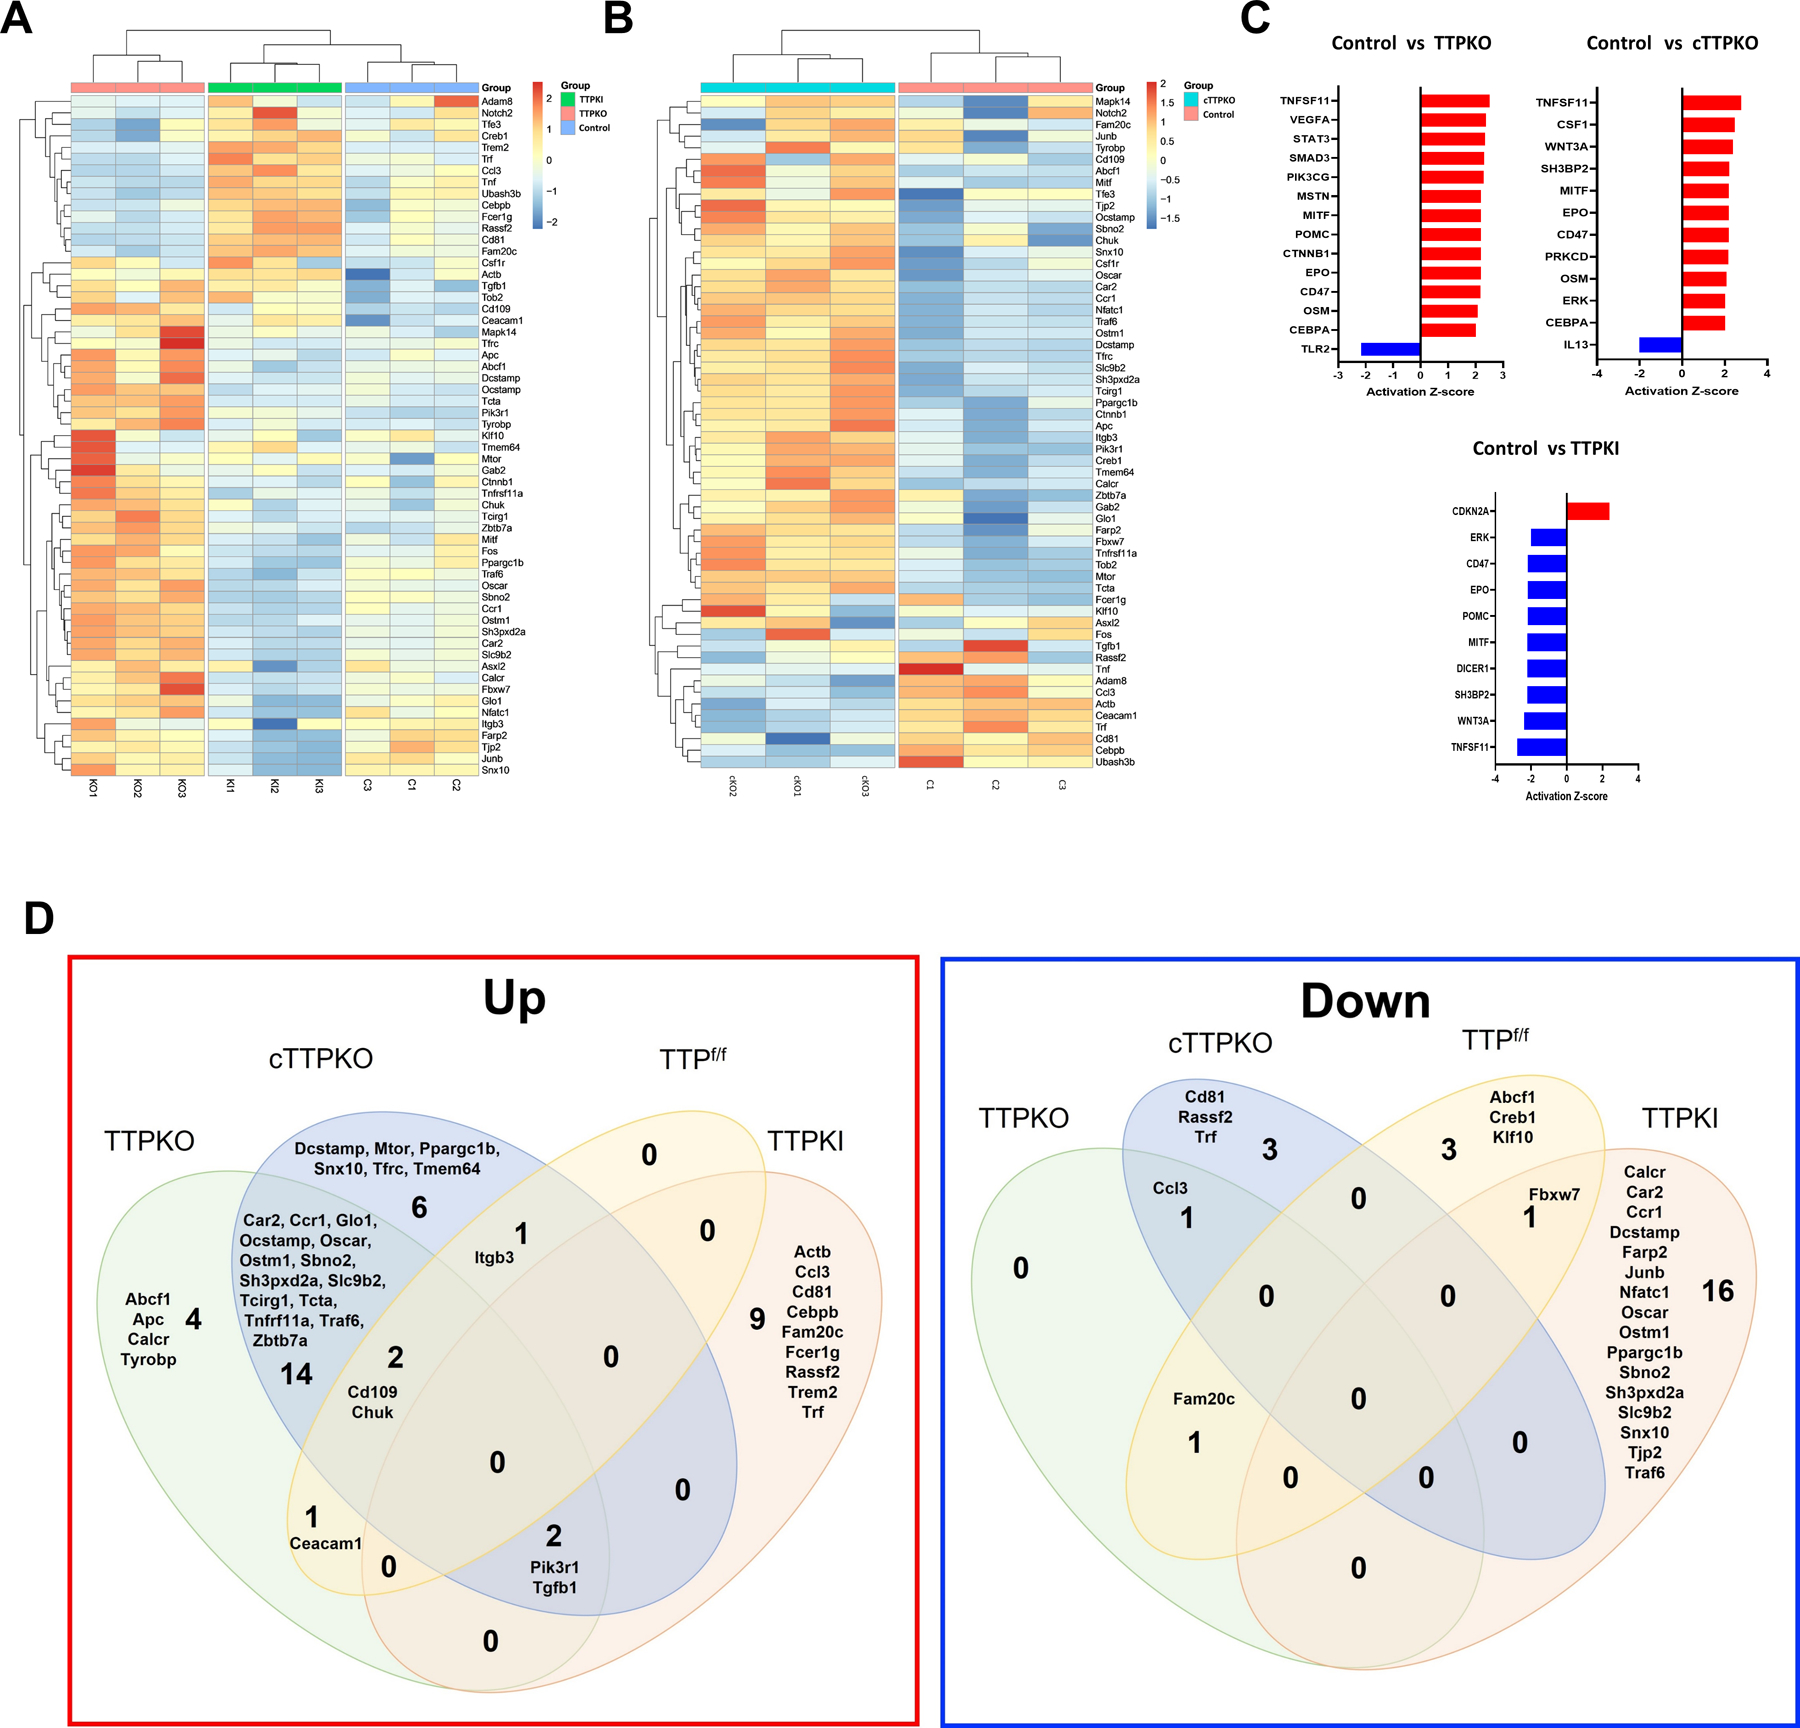
(A-E) NanoString Analysis of M-MDSCs in control/TTPKO/TTPKI and TTPf/f /cTTPKO mice. (A-B) Heat map showing the 59 significant genes that were differentially expressed among the control, TTPKO, and TTPKI mice (A) and 58 significantly differentially expressed genes were shown between TTPf/f and cTTPKO mice (B). (C) Upstream regulators, either activated (positive Z-score) or suppressed (negative Z-score) based on IPA. (D) Venn diagram showing the number of differentially expressed genes (fold change >2) of up-regulated and down-regulated genes compared to WT control.
Next, osteoclast-related gene expression was compared to determine whether TTP alters the gene expression profile of M-MDSCs. The expression of 6 (Traf6, Ccr1, Ostm1, Sbno2, Slc9b2, Sh3pxd2a) out of 85 genes was significantly increased in TTPKO and TTPcKO and decreased in TTPKI M-CSF/RANKL stimulated M-MDSCs (Fig 6A). In addition, the gene expression of 6 (Tnfrsf11a, Car2, Oscar, Tcirg1, Tcta, Ocstamp) out of 85 genes were significantly increased when TTP was deficient, but no significant difference was shown in TTPKI M-MDSCs (Fig 6B). Conversely, only one mRNA, the C-C motif chemokine ligand 3 like 3 (Ccl3), was highly expressed in TTPKI mice and low in cTTPKO mice (Fig 6C). These results indicate that TTP regulates M-MDSC pre-osteoclasts through selective transcriptomic mechanisms. Among the 13 genes that were differentially regulated, there were no known direct TTP target mRNAs. However, differences in the expression of TNF-related factors such as Traf6 and Tnfrsf11a, which are indirectly regulated by TTP through TNFα, suggests that osteoclast differentiation of M-MDSCs maybe indirectly regulated by TTP.
Figure 6. TTP alters the gene expression profile associated with osteoclast differentiation in M-MDSCs.
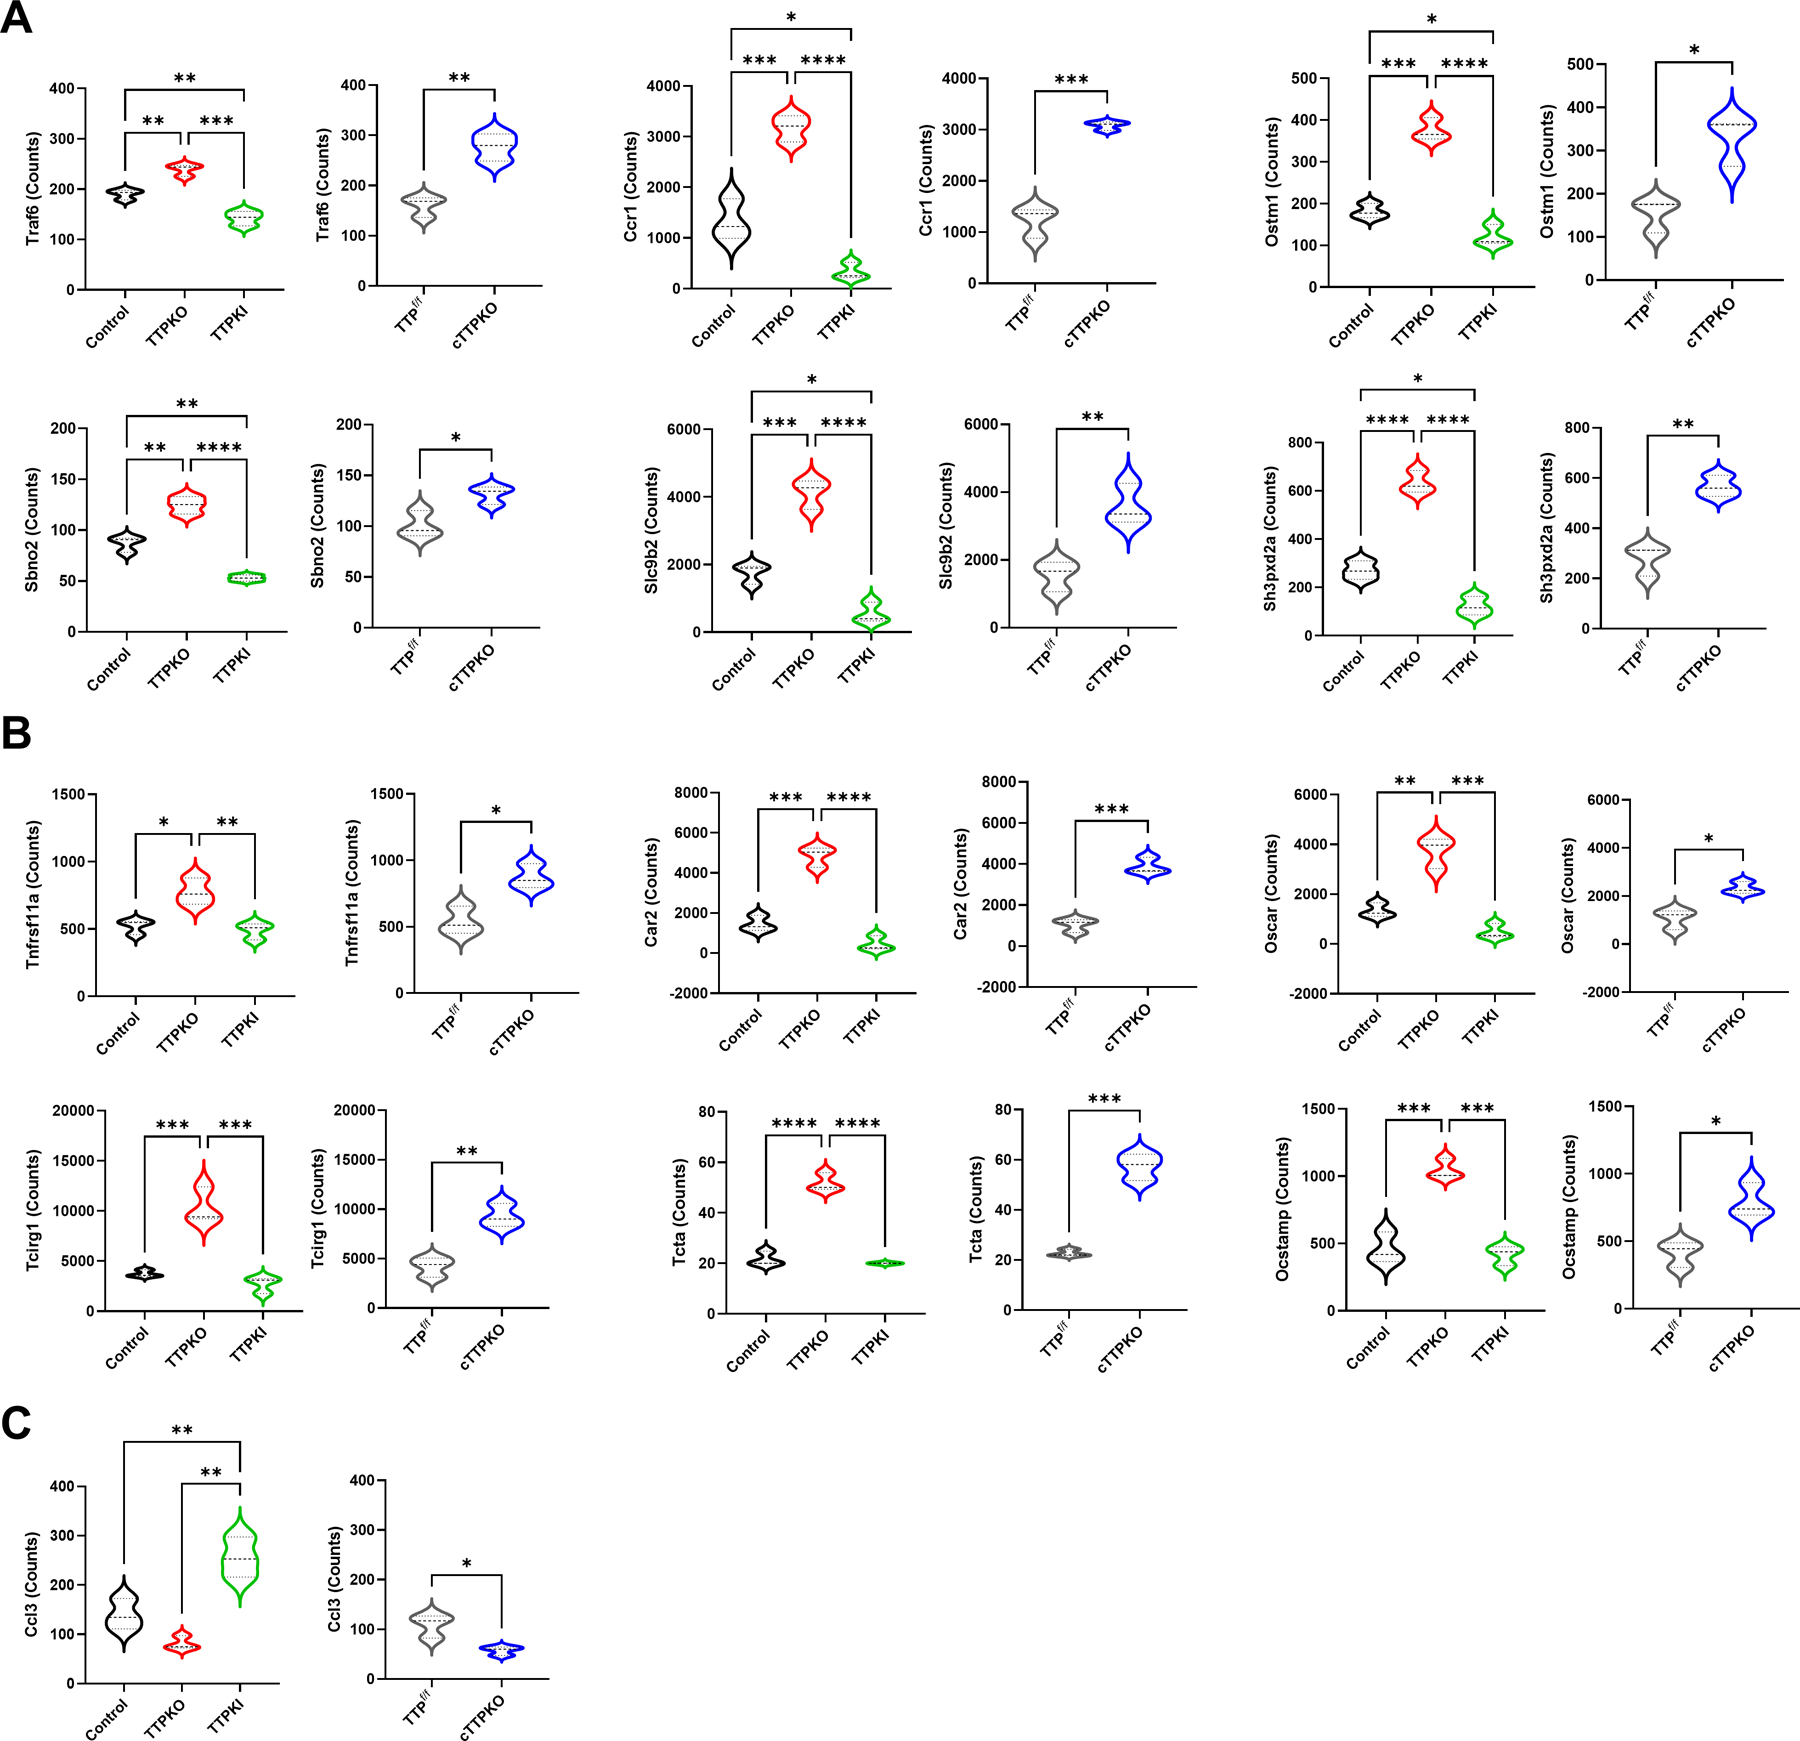
(A-C) Select NanoString gene expression differences of M-MDSC populations in bone marrow from control/TTPKO/TTPKI, and TTPf/f/cTTPKO mice. One-way analysis of variance with Tukey’s multiple comparisons test and unpaired t test; data are presented as mean ± SEM, *P < 0.05, **P < 0.01, ***P < 0.001, ****P < 0.0001.
TTP deficiency increases osteoclastogenic differentiation potential of M-MDSCs in vivo
To investigate in vivo whether the lack of TTP affects the differentiation of M-MDSCs into osteoclasts and the function of osteoclasts, intra-tibial injection was performed. Here, M-MDSCs from cTTPKO C57BL/6N mice were micro-injected in syngeneic WT recipients to understand if M-MDSCs from myeloid-deficient TTP mice had altered osteoclast potential. Because body weight can affect bone mass, it was confirmed that there was no difference between the groups based on weight measurements taken of all groups before the injection (32) (data not shown). In the 3-D reconstruction image of micro-computed tomography (μCT), the tibia injected with M-MDSCs isolated from the bone marrow of control/cTTPKO mice showed osteoporosis patterns compared to mice injected with PBS (Fig 7A). Bone mineral density (BMD) and cortical thickness (Ct. Th) were significantly reduced when injected with M-MDSCs of cTTPKO mice (Fig 7B and C). Trabecular thickness (Tb. Th) was significantly decreased when M-MDSCs of control mice were injected and decreased even more so when M-MDSCs of cTTPKO mice were injected (Fig 7D). The quantification of trabecular spacing (Tb. Sp) was significantly increased when M-MDSCs of cTTPKO mice were injected (Fig 7E). To determine the role of TTP in osteoclast formation of M-MDSCs, TRAP staining for osteoclast enumeration was performed. The area and number of osteoclasts were significantly increased in the tibia injected with M-MDSCs of cTTPKO mice and significantly increased compared with that injected with M-MDSCs of control mice (Fig 7 G–H). These data directly support the concept that M-MDSCs from myeloid-specific TTP mice are more primed to differentiated into osteoclasts with enhanced resorption activity in a bone matrix microenvironment.
Figure 7. Primed M-MDSCs exhibit stronger osteoclastogenic differentiation potential in vivo.
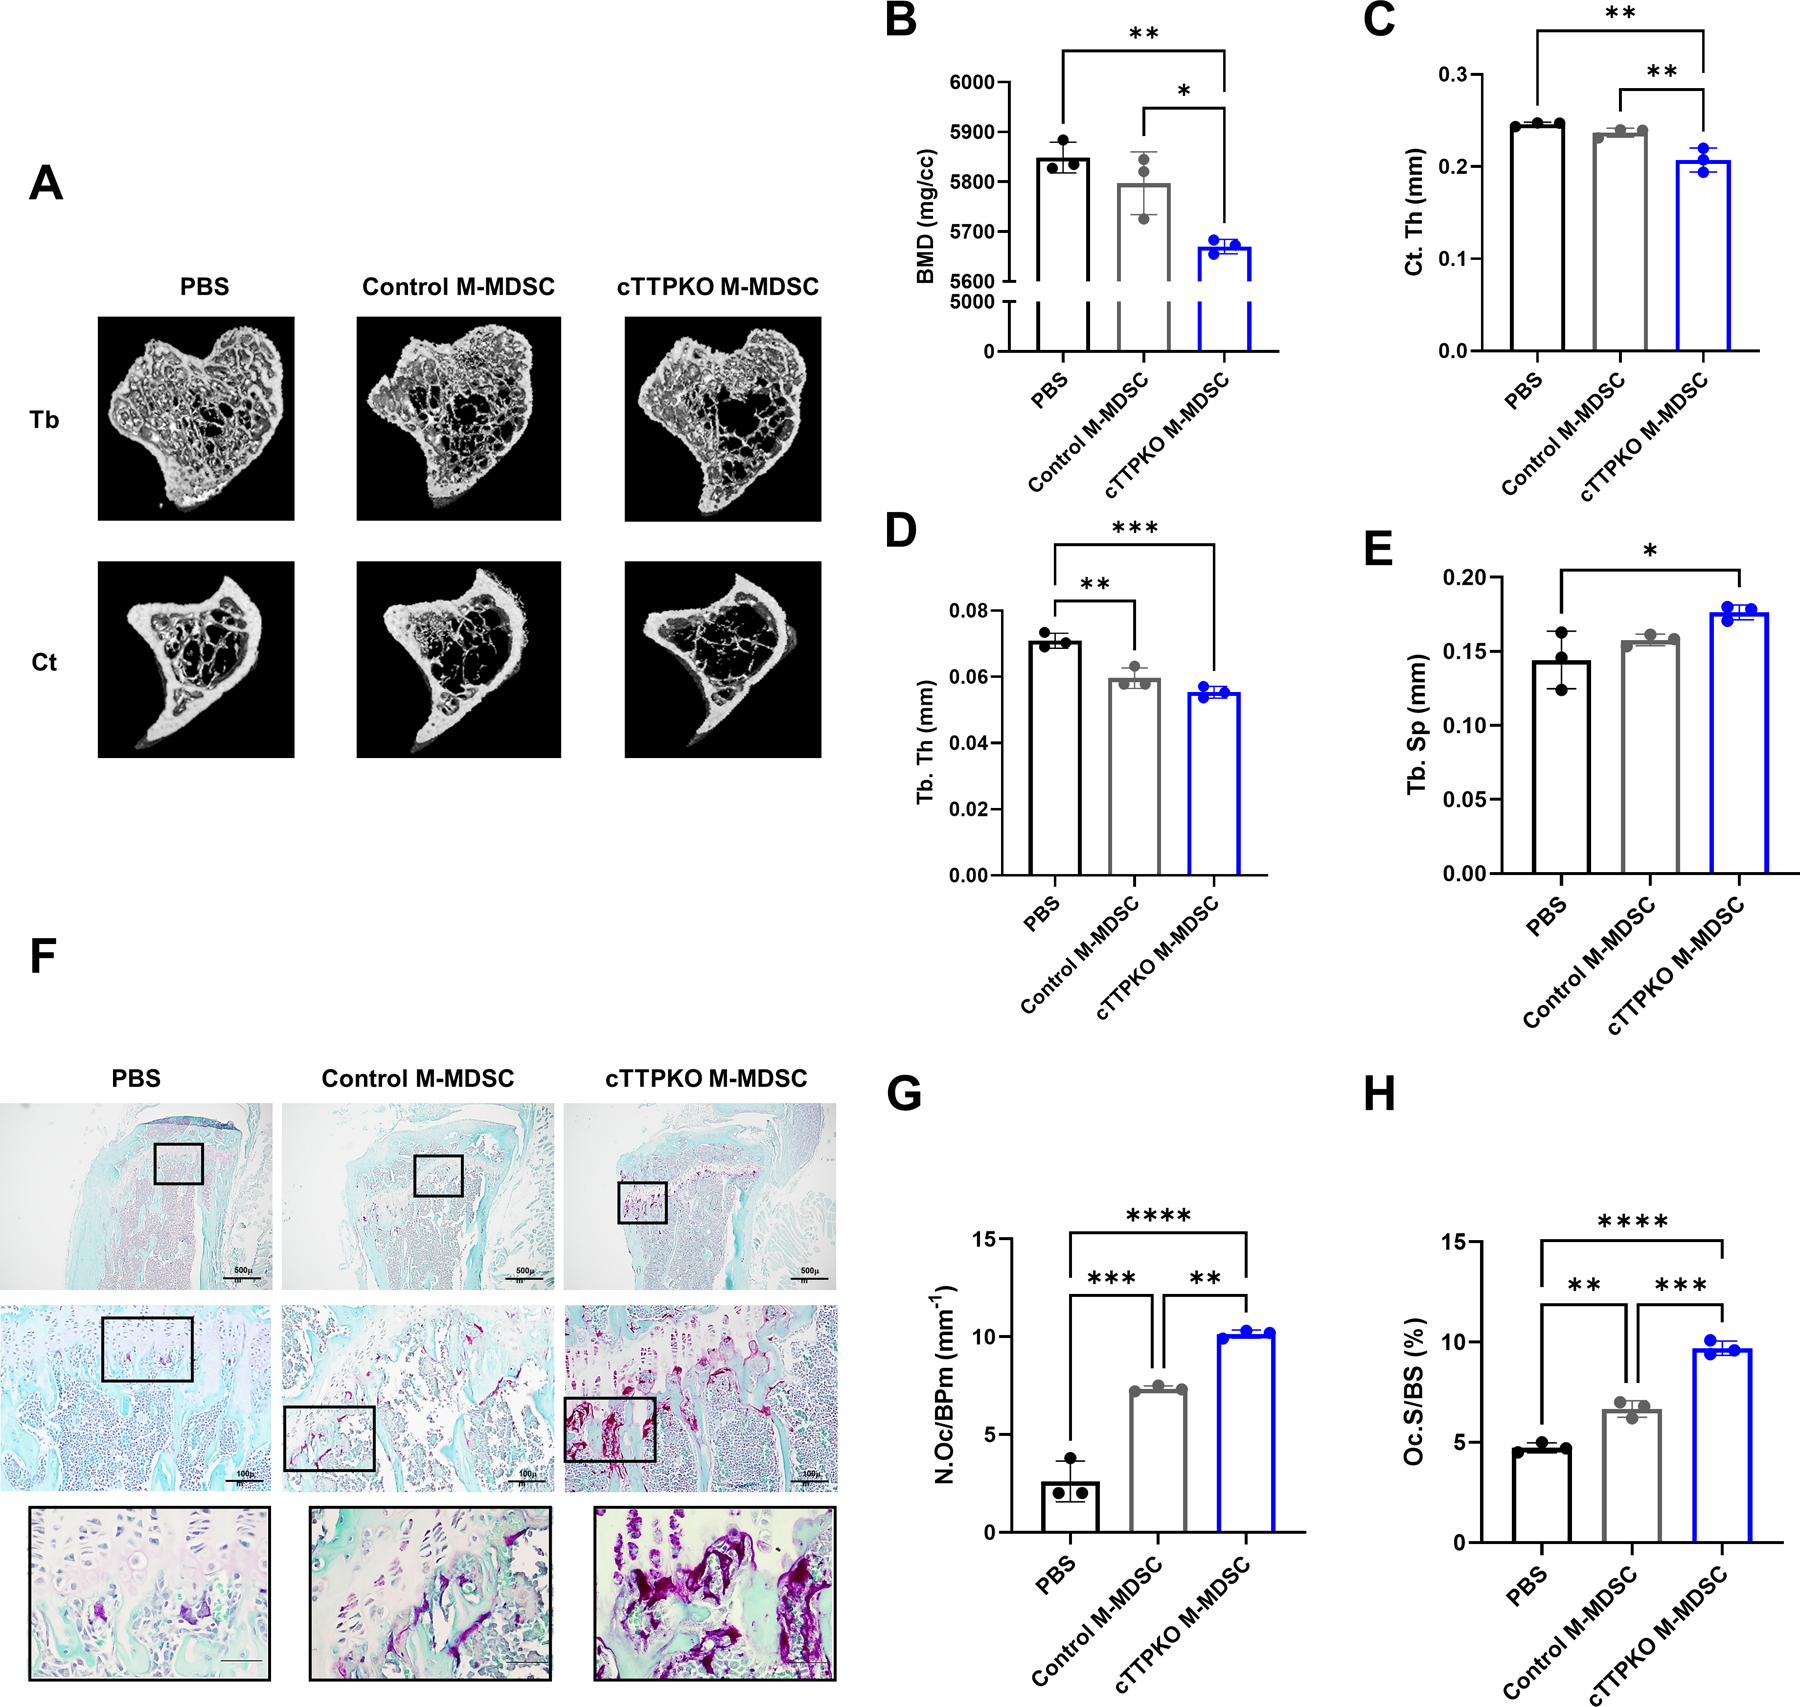
(A) Representative image of μCT 3D reconstruction of the injected tibia. (C-E) Quantification of the bone parameters in the injected tibia. Quantitative analysis of the bone marrow density (BMD, B), cortical thickness (Ct. Th, C), Trabecular Thickness (Tb Th, D), and Trabecular separation (Td Sp, E). Representative TRAP and fast green counterstained of injected tibia (F). Osteoclast numbers (N.Oc/BPm, mm−1, G) and osteoclast surface (Oc.S/BS, %, H) were calculated on TRAP and fast green counterstained tibia in each group. One-way analysis of variance with Tukey’s multiple comparisons test; data are presented as mean ± SEM, *P < 0.05, **P < 0.01, ***P < 0.001.
Discussion
Mature osteoclasts are the only mammalian cells capable of bone resorption with several inflammatory bone diseases occurring as a direct consequence of excessive osteoclastic function. Therefore, understanding the mechanisms related to osteoclast development and osteoclast function are essential for therapeutic strategies for osteoclast-related disorders. In this study, we provide new molecular insights for the RNA-binding protein, TTP, as a key player required for maintaining a healthy skeletal phenotype. Unlike other RNA-binding proteins, the expression of TTP has been shown to decrease with aging in myeloid tissues (26). Using loss of function mouse models, to mimic the aging process, revealed expansion of specific pre-osteoclastogenic myeloid lineage cell populations, particularly M-MDSCs, that contribute towards increased number and function of osteoclasts, while gain of function TTP transgenic mice with modest TTP overexpression reversed this phenotype with reduced osteoclastogenic capacity within the M-MDSC pre-osteoclastic populations.
The results herein highlight the significance of TTP expression in the myeloid compartment towards maintenance of a normal skeletal phenotype, as TTP deficiency increased systemic inflammation resulting in loss of skeletal integrity. When an inflammatory insult occurs, the hematopoietic system responds immediately by generating effector cells, including monocytes and granulocytes. Because of the inflammatory phenotype has long been appreciated in TTP-deficient mice, many prior studies mainly reported on Gr-1+ granulocytes. These reports found that the number of mature granulocytes increased in the bone marrow of 6-month-old female mice deficient in TTP and that CD11b+Gr-1+ increased in the bone marrow and spleen of 6–8-week-old female TTPKO mice (11, 33). These current studies continue to explore the consequence of M-MDSC expansion from prior studies where we observed that the percentage of myeloid populations was consistently higher in the spleen and other peripheral tissues in TTP deficient mice (27). The present study showed that expansion of M-MDSCs significantly and adversely affects the skeletal phenotype under conditions of TTP decline, including aging (26, 27).
As an RNA-binding protein, TTP functions as a key negative regulator of inflammation by inhibiting the production of multiple pro-inflammatory cytokines (34). TTP is a key molecular target in the p38 mitogen activated protein kinase (MAPK)/MAPK-activated protein kinase-2 (MK2) stress signaling pathways with a primary role in binding to adenosine-uridine rich elements (AREs) in the 3’ untranslated regions (3’-UTRs) by virtue of the tandem CCCH zinc finger within target mRNA transcripts, thus destabilizing and promoting mRNA degradation of targets such as TNFα, IL-1β, and IL-6 (35–37). Data from our focused transcriptomic analyses using osteoclast specific mRNA code sets suggests that TTP does not target major known mRNA targets in RANKL-differentiated pre-osteoclastic populations. These data suggest that TTP functions in an indirect manner rather than directly targeting any osteoclast-specific genes. However, most studies that have identified TTP mRNA target genes utilized LPS-stimulated cells rather than M-CSF/RANKL pre-osteoclastogenic populations, which may partially explain the lack of identification of known TTP targets (26, 34, 38, 39). Nonetheless, additional studies are needed to validate these findings.
Using scRNAseq data sets from previously sequenced data from bone marrow of control, TTPKO, and cTTPKO mice, myeloid progenitor populations were interrogated for osteoclastogenic potential. Using scCATCH and hand annotation of myeloid populations, we have previously provided a deeper transcriptomic profile to better define MDSCs (27). We found that the osteoclast module scores of early monocytes and MDSC populations, which are progenitors capable of differentiating into osteoclasts, were expanded in TTPKO/cTTPKO mice. Focusing on early MDSCs, we observed that the expression of Csf1r, a cognate receptor of M-CSF, was higher in TTPKO/cTTPKO mice. The CSF1R-mediated signaling pathway plays a key role in the differentiation of osteoclast precursors, as revealed by severe osteoclast deficiency in Csf1r-deficient mice (40). Because CSF1R-mediated signaling induces RANK expression in osteoclast precursors and RANKL-mediated signaling, we also investigated factors related to RANK-RANKL-mediated signaling in early MDSC populations. Given the abundant evidence that TRAF6 signaling operates immediately downstream of RANK-RANKL-mediated interaction, we investigated Traf6 mRNA expression and found that it was significantly increased in cTTPKO/TTPKO mice compared to control. Additionally, c-Fos (encoded by Fos) is known as an essential regulator for osteoclastogenesis downstream of RANK-RANKL-mediated signaling, and its expression was also increased (41). Further, TTP-deficiency increased the expression level of Nfactc1, considered a master transcription regulator in the RANK-RANKL-mediated signaling pathway. Collectively, these scRNAseq data suggest that not only CSF1R-mediated signaling but also RANK-RANKL signaling is activated in TTP-deficient early MDSCs, suggesting that M-MDSCs in the bone marrow of TTPKO/cTTPKO mice are primed for differentiation into osteoclasts.
Quantitative analysis of osteoclastogenesis using TRAP staining and enumeration revealed that the area and number of osteoclasts was significantly higher in M-MDSCs isolated from TTPKO/cTTPKO mice compared with M-MDSCs in control mice. These data support that when TTP expression is reduced as we have recently demonstrated with aging mice, M-MDSCs in the bone marrow may be affected resulting in enhanced osteoclastogenic potential (27). This point was supported not only in TRAP staining but also in the serum analysis where TRAP was elevated in TTPKO/cTTPKO mice. Moreover, functional data showed that osteoclastic bone resorption capacity was greater in TTPKO/cTTPKO mice compared to the controls. It is important to note that although TTP clearly regulates the osteoclastic potential, it does not affect the immune suppressive activity of M-MDSCs.
A focused transcriptional analysis of M-MDSCs during osteoclast differentiation in TTPKO/cTTPKO mice revealed that 30 out of 85 genes in the focused osteoclast-specific NanoString code set had a significantly higher levels of expression. Of those, 18 genes were common between both TTPKO and cTTPKO mice. Conversely, 17 of 85 osteoclast differentiation genes were less expressed in TTPKI mice than in control mice, and 16 of them were expressed less in TTPKI mice only. Although we observed several osteoclastogenic genes that were decreased in the TTPKI M-MDSC, we did not detect a decrease in the in vitro osteoclastogenic assays. These differences may reflect the supraphysiologic nature of the M-CSF/RANKL used in in vitro assays or the subtle changes of induced TTP expression in the TTPKI mice. Nevertheless, several mRNAs of osteoclast signaling mediators, such as Traf6, within the well-known RANKL-stimulated signaling pathway were increased in M-MDSCs derived from TTPKO/cTTPKO mice. RANK, encoded by Tnfrsf11A, was also significantly increased in both TTPKO and cTTPKO mice supporting the overall osteopenic phenotype of these TTP-null mouse strains.
Interestingly, in M-MDSCs derived from TTPKO/cTTPKO mice, several mRNAs were also increased in co-stimulatory signaling pathways other than the RANKL-stimulated signaling pathway. Among them, Oscar2 (Osteoclast-associated immunoglobulin-like receptor)2, which is highly expressed in TTPKO/cTTPKO mice, is related to osteoclast maturation and activation (42). It has also been shown that Oscar signaling in monocytes upregulates the expression of adhesion molecules and increases the secretion of chemokines and cytokines (43). Based on these findings, OSCAR signaling appears to support osteoclastogenesis, as well as enhance immune cell recruitment and activation. Since the M-MDSC is also a monocyte lineage-derived cell, it seems likely that it will not only augment the differentiation of M-MDSCs into osteoclast but also affect other myeloid-lineage cells. Future studies will be needed to understand the role of Oscar on osteoclastogenesis in TTPKO/cTTPKO mice.
In addition to these major pro-osteoclastogenic genes being elevated in both TTPKO and cTTPKO mice, many other osteoclast fusion and functional genes were also increased. Fusion-specific genes, including Ccr1, Ocstamp (Osteoclast stimulatory transmembrane protein), Sbno2 (Strawberry notch homologue 2), Sh3pxd2a (SH3 and PX domains 2A or Tks5) and Tcta (T-cell leukemia translocation-associated gene), were all shown to be increased in both TTPKO and cTTPKO M-MDSCs. Similarly, osteoclast function-associated genes, including Ostm1 (osteopetrosis-associated transmembrane protein), Tclrg1 (T cell immune regulator 1), Car2 (Carbonic anhydrase II), and Slc9b2 (solute carrier family 9, subfamily B), which all participate in various aspects of osteoclastic function to degrade a mineralized matrix are increased in both TTPKO and cTTPKO mice compared to controls. Collectively, these data highlight the idea that TTP is a key negative regulator of osteoclast differentiation and activity. Ongoing studies in the laboratory are exploring the role of TTP in aging models to understand if TTP could be a new therapeutic target for osteoporosis to help maintain a healthy skeleton.
Intriguingly, we while we observed that the expression of Ccr1 (C-C chemokine receptor 1) was increased, the expression of Ccl3 (chemokine (C-C motif) ligand 3) was decreased in M-MDSCs derived from TTPKO/cTTPKO mice. As CCL3 can bind to CCR1, a receptor expressed in osteoclasts to generate osteoclasts in a RANKL-signaling dependent manner (44, 45), we believe this represents a potential compensatory mechanism for regulating osteoclast formation in TTPKO/cTTPKO mice. It appears necessary to compare M-MDSC osteoclast differentiation transcriptome differences with other osteoclast progenitor populations to understand whether transcriptome differences are unique to M-MDSC progenitor populations. However, since the transcriptome of M-MDSCs in this study is different from that of M-MDSCs when differentiating into osteoclasts in our previous study during obesity, at least M-MDSCs seem to have different transcriptomic signatures depending on the disease state, reflecting the plasticity of this context-dependent nature of this myeloid-cell population (24).
We also demonstrated that primed M-MDSCs in sterile inflammatory conditions induced by myeloid-restricted loss of TTP can differentiate into active osteoclasts in normal WT in vivo conditions. We observed a decrease in bone microarchitecture and an increase in the number of osteoclasts in WT mice injected with M-MDSCs isolated from cTTPKO mice compared with mice injected with M-MDSCs isolated from control mice. Although most studies have been performed in the tumor-associated microenvironment, there are reports that ability of MDSCs to differentiate into osteoclasts is dependent upon environmental cues, highlighting the plasticity of this myeloid cell population. More specifically, it has been reported that MDSCs are recruited to the mouse mammary fat pad tumor microenvironment (TME) to differentiate into endothelial cells, and there is also a report that MDSCs in the primary TME can differentiate into tumor-associated macrophages that contribute to tumor growth (46). Here, we provide additional evidence of MDSC cellular plasticity where M-MDSCs can differentiate into osteoclasts in the bone microenvironment with concomitant transcriptomic differences. These data support the notion that the environment where M-MDSCs reside prominently influences their cellular fate.
Overall, our study demonstrates that TTP directly modulates MDSCs, leading to MDSC differentiation into osteoclasts and induces bone loss, identifying this cell population as an important regulator of osteolytic bone disease and as a potential therapeutic target. The regulation of TTP expression, as well as targeting MDSCs seem to be potential therapeutic targets to control osteolytic bone disease. Indeed, several inflammatory-related skeletal pathologies, including arthritis and periodontitis, are reduced when TTP is overexpressed (13, 14). Although further studies are needed to apply these findings clinically, our results strongly suggest that targeting TTP or M-MDSCs will limit the osteoclast-driven skeletal pathologies.
Supplementary Material
Acknowledgments
This work was supported by the National Institutes of Health (NIH) grants, R01DE028258 (KK), R01DE028258S1 (KLK, SIA), K18DE029526 (KK), K07AG060266 (BT), Indian Trail Foundation (BT), and by the National Research Foundation of Korea (NRF) grant funded by the Korea government (MSIT), RS-2023-00280791 (to KHK).
Included in article.
The data that support the findings of this study are available in the methods and/or supplementary material of this article.
Abbreviations:
- TTP
tristetraprolin
- KO
knockout
- TTPKO
tristetraprolin-deficient
- cTTPKO
myeloid-specific TTP knockout
- TTPKI
TTP knock-in
- MDSC
myeloid-derived suppressor cell
- M-MDSC
monocytic myeloid-derived suppressor cell
- M-CSF
macrophage colony-stimulating factor
- RANK
receptor activator of NF-kB
- RANKL
receptor activator of NF-kB ligand
- SPF
specific pathogen free
- WT
wild type
- μCT
micro-computed tomography
- scRNA-seq
single-cell ribonucleic acid sequence
- TRAP
tartrate-resistant acid phosphatase
- BV/TV
bone volume fraction
- Tb. Th
trabecular thickness
- Tb. N
trabecular number
- Tb. Sp
trabecular separation
- Ct. Ar/Tt. Ar
cortical area fraction
- Ct. Th
cortical thickness
- GMP
granulocyte monocyte progenitor
- cMoP/MP
common monocyte progenitor/monocyte progenitor
Footnotes
Disclosures
The authors declare that the research was conducted in the absence of any commercial or financial relationships that could be interpreted as a potential conflict of interest.
References
- 1.Karsenty G, and Wagner EF (2002) Reaching a genetic and molecular understanding of skeletal development. Dev Cell 2, 389–406 [DOI] [PubMed] [Google Scholar]
- 2.Boyle WJ, Simonet WS, and Lacey DL (2003) Osteoclast differentiation and activation. Nature 423, 337–342 [DOI] [PubMed] [Google Scholar]
- 3.Feng X, and Teitelbaum SL (2013) Osteoclasts: New Insights. Bone Res 1 [DOI] [PMC free article] [PubMed] [Google Scholar]
- 4.Park-Min KH (2018) Mechanisms involved in normal and pathological osteoclastogenesis. Cell Mol Life Sci 75, 2519–2528 [DOI] [PMC free article] [PubMed] [Google Scholar]
- 5.Tsukasaki M, and Takayanagi H (2019) Osteoimmunology: evolving concepts in bone-immune interactions in health and disease. Nat Rev Immunol 19, 626–642 [DOI] [PubMed] [Google Scholar]
- 6.Arai F, Miyamoto T, Ohneda O, Inada T, Sudo T, Brasel K, Miyata T, Anderson DM, and Suda T (1999) Commitment and differentiation of osteoclast precursor cells by the sequential expression of c-Fms and receptor activator of nuclear factor kappaB (RANK) receptors. J Exp Med 190, 1741–1754 [DOI] [PMC free article] [PubMed] [Google Scholar]
- 7.Takayanagi H (2007) Osteoimmunology: shared mechanisms and crosstalk between the immune and bone systems. Nat Rev Immunol 7, 292–304 [DOI] [PubMed] [Google Scholar]
- 8.Park-Min KH (2019) Metabolic reprogramming in osteoclasts. Semin Immunopathol 41, 565–572 [DOI] [PMC free article] [PubMed] [Google Scholar]
- 9.Lai WS, Carballo E, Strum JR, Kennington EA, Phillips RS, and Blackshear PJ (1999) Evidence that tristetraprolin binds to AU-rich elements and promotes the deadenylation and destabilization of tumor necrosis factor alpha mRNA. Mol Cell Biol 19, 4311–4323 [DOI] [PMC free article] [PubMed] [Google Scholar]
- 10.Lai WS, Carballo E, Thorn JM, Kennington EA, and Blackshear PJ (2000) Interactions of CCCH zinc finger proteins with mRNA - Binding of tristetraprolin-related zinc finger proteins to Au-rich elements and destabilization of mRNA. J Biol Chem 275, 17827–17837 [DOI] [PubMed] [Google Scholar]
- 11.Taylor GA, Carballo E, Lee DM, Lai WS, Thompson MJ, Patel DD, Schenkman DI, Gilkeson GS, Broxmeyer HE, Haynes BF, and Blackshear PJ (1996) A pathogenetic role for TNF alpha In the syndrome of cachexia, arthritis, and autoimmunity resulting from tristetraprolin (TTP) deficiency. Immunity 4, 445–454 [DOI] [PubMed] [Google Scholar]
- 12.Qiu LQ, Stumpo DJ, and Blackshear PJ (2012) Myeloid-Specific Tristetraprolin Deficiency in Mice Results in Extreme Lipopolysaccharide Sensitivity in an Otherwise Minimal Phenotype. J Immunol 188, 5150–5159 [DOI] [PMC free article] [PubMed] [Google Scholar]
- 13.Patial S, Curtis AD, Lai WS, Stumpo DJ, Hill GD, Flake GP, Mannie MD, and Blackshear PJ (2016) Enhanced stability of tristetraprolin mRNA protects mice against immune-mediated inflammatory pathologies. P Natl Acad Sci USA 113, 1865–1870 [DOI] [PMC free article] [PubMed] [Google Scholar]
- 14.Patil CS, Liu M, Zhao W, Coatney DD, Li F, VanTubergen EA, D’Silva NJ, and Kirkwood KL (2008) Targeting mRNA stability arrests inflammatory bone loss. Mol Ther 16, 1657–1664 [DOI] [PMC free article] [PubMed] [Google Scholar]
- 15.Steinkamp HM, Hathaway-Schrader JD, Chavez MB, Aartun JD, Zhang L, Jensen T, Shojaee Bakhtiari A, Helke KL, Stumpo DJ, Alekseyenko AV, Novince CM, Blackshear PJ, and Kirkwood KL (2018) Tristetraprolin Is Required for Alveolar Bone Homeostasis. J Dent Res 97, 946–953 [DOI] [PMC free article] [PubMed] [Google Scholar]
- 16.Kusmartsev SA, Li Y, and Chen SB (2000) Gr-1(+) myeloid cells derived from tumor-bearing mice inhibit primary T cell activation induced through CD3/CD28 costimulation. J Immunol 165, 779–785 [DOI] [PubMed] [Google Scholar]
- 17.Schmidtwolf IGH, Dejbakhshjones S, Ginzton N, Greenberg P, and Strober S (1992) T-Cell Subsets and Suppressor Cells in Human Bone-Marrow. Blood 80, 3242–3250 [PubMed] [Google Scholar]
- 18.Song XP, Krelin Y, Dvorkin T, Bjorkdahl O, Segal S, Dinarello CA, Voronov E, and Apte RN (2005) CD11b(+)/Gr-1(+) immature myeloid cells mediate suppression of T cells in mice bearing tumors of IL-1 beta-secreting cells. J Immunol 175, 8200–8208 [DOI] [PubMed] [Google Scholar]
- 19.Sawant A, and Ponnazhagan S (2013) Myeloid-derived suppressor cells as osteoclast progenitors: a novel target for controlling osteolytic bone metastasis. Cancer Res 73, 4606–4610 [DOI] [PMC free article] [PubMed] [Google Scholar]
- 20.Zhang H, Huang Y, Wang S, Fu R, Guo C, Wang H, Zhao J, Gaskin F, Chen J, Yang N, and Fu SM (2015) Myeloid-derived suppressor cells contribute to bone erosion in collagen-induced arthritis by differentiating to osteoclasts. J Autoimmun 65, 82–89 [DOI] [PMC free article] [PubMed] [Google Scholar]
- 21.Kirkwood KL, Zhang L, Thiyagarajan R, Seldeen KL, and Troen BR (2018) Myeloid-Derived Suppressor Cells at the Intersection of Inflammaging and Bone Fragility. Immunol Invest 47, 844–854 [DOI] [PMC free article] [PubMed] [Google Scholar]
- 22.Kwack KH, Lamb NA, Bard JE, Kramer ED, Zhang L, Abrams SI, and Kirkwood KL (2021) Discovering Myeloid Cell Heterogeneity in Mandibular Bone - Cell by Cell Analysis. Front Physiol 12, 731549. [DOI] [PMC free article] [PubMed] [Google Scholar]
- 23.Sawant A, Deshane J, Jules J, Lee CM, Harris BA, Feng X, and Ponnazhagan S (2013) Myeloid-derived suppressor cells function as novel osteoclast progenitors enhancing bone loss in breast cancer. Cancer Res 73, 672–682 [DOI] [PMC free article] [PubMed] [Google Scholar]
- 24.Kwack KH, Zhang L, Sohn J, Maglaras V, Thiyagarajan R, and Kirkwood KL (2021) Novel Preosteoclast Populations in Obesity-Associated Periodontal Disease. J Dent Res, 220345211040729. [DOI] [PMC free article] [PubMed] [Google Scholar]
- 25.Zhang L, Kirkwood CL, Sohn J, Lau A, Bayers-Thering M, Bali SK, Rachala S, Marzo JM, Anders MJ, Beier F, and Kirkwood KL (2021) Expansion of myeloid-derived suppressor cells contributes to metabolic osteoarthritis through subchondral bone remodeling. Arthritis Res Ther 23, 287. [DOI] [PMC free article] [PubMed] [Google Scholar]
- 26.Masuda K, Marasa B, Martindale JL, Halushka MK, and Gorospe M (2009) Tissue- and age-dependent expression of RNA-binding proteins that influence mRNA turnover and translation. Aging (Albany NY) 1, 681–698 [DOI] [PMC free article] [PubMed] [Google Scholar]
- 27.Kwack KH, Zhang L, Kramer ED, Thiyagarajan R, Lamb NA, Arao Y, Bard JE, Seldeen KL, Troen BR, Blackshear PJ, Abrams SI, and Kirkwood KL (2022) Tristetraprolin limits age-related expansion of myeloid-derived suppressor cells. Front Immunol 13, 1002163. [DOI] [PMC free article] [PubMed] [Google Scholar]
- 28.Berlin O, Samid D, Donthinenirao R, Akeson W, Amiel D, and Woods VL (1993) Development of a Novel Spontaneous Metastasis Model of Human Osteosarcoma Transplanted Orthotopically into Bone of Athymic Mice. Cancer Research 53, 4890–4895 [PubMed] [Google Scholar]
- 29.Fritz V, Louis-Plence P, Apparailly F, Noel D, Voide R, Pillon A, Nicolas JC, Muller R, and Jorgensen C (2007) Micro-CT combined with bioluminescence imaging: A dynamic approach to detect early tumor-bone interaction in a tumor osteolysis murine model. Bone 40, 1032–1040 [DOI] [PubMed] [Google Scholar]
- 30.Park BK, Zhang HL, Zeng QH, Dai JL, Keller ET, Giordano T, Gu KN, Shah V, Pei L, Zarbo RJ, McCauley L, Shi ST, Chen SQ, and Wang CY (2007) NF-kappa B in breast cancer cells promotes osteolytic bone metastasis by inducing osteoclastogenesis via GM-CSF. Nat Med 13, 62–69 [DOI] [PubMed] [Google Scholar]
- 31.Li VC, and Kirschner MW (2014) Molecular ties between the cell cycle and differentiation in embryonic stem cells. Proc Natl Acad Sci U S A 111, 9503–9508 [DOI] [PMC free article] [PubMed] [Google Scholar]
- 32.Iwaniec UT, and Turner RT (2016) Influence of body weight on bone mass, architecture and turnover. J Endocrinol 230, R115–130 [DOI] [PMC free article] [PubMed] [Google Scholar]
- 33.Kaplan IM, Morisot S, Heiser D, Cheng WC, Kim MJ, and Civin CI (2011) Deletion of Tristetraprolin Caused Spontaneous Reactive Granulopoiesis by a Non-Cell-Autonomous Mechanism Without Disturbing Long-Term Hematopoietic Stem Cell Quiescence. J Immunol 186, 2826–2834 [DOI] [PMC free article] [PubMed] [Google Scholar]
- 34.Brooks SA, and Blackshear PJ (2013) Tristetraprolin (TTP): interactions with mRNA and proteins, and current thoughts on mechanisms of action. Biochim Biophys Acta 1829, 666–679 [DOI] [PMC free article] [PubMed] [Google Scholar]
- 35.Zhao W, Liu M, D’Silva NJ, and Kirkwood KL (2011) Tristetraprolin regulates interleukin-6 expression through p38 MAPK-dependent affinity changes with mRNA 3’ untranslated region. J Interferon Cytokine Res 31, 629–637 [DOI] [PMC free article] [PubMed] [Google Scholar]
- 36.Palanisamy V, Jakymiw A, Van Tubergen EA, D’Silva NJ, and Kirkwood KL (2012) Control of Cytokine mRNA Expression by RNA-binding Proteins and microRNAs. J Dent Res 91, 651–658 [DOI] [PMC free article] [PubMed] [Google Scholar]
- 37.Patial S, and Blackshear PJ (2016) Tristetraprolin as a Therapeutic Target in Inflammatory Disease. Trends Pharmacol Sci 37, 811–821 [DOI] [PMC free article] [PubMed] [Google Scholar]
- 38.Fallmann J, Sedlyarov V, Tanzer A, Kovarik P, and Hofacker IL (2016) AREsite2: an enhanced database for the comprehensive investigation of AU/GU/U-rich elements. Nucleic Acids Res 44, D90–95 [DOI] [PMC free article] [PubMed] [Google Scholar]
- 39.Sedlyarov V, Fallmann J, Ebner F, Huemer J, Sneezum L, Ivin M, Kreiner K, Tanzer A, Vogl C, Hofacker I, and Kovarik P (2016) Tristetraprolin binding site atlas in the macrophage transcriptome reveals a switch for inflammation resolution. Mol Syst Biol 12, 868. [DOI] [PMC free article] [PubMed] [Google Scholar]
- 40.Yoshida H, Hayashi S, Kunisada T, Ogawa M, Nishikawa S, Okamura H, Sudo T, Shultz LD, and Nishikawa S (1990) The murine mutation osteopetrosis is in the coding region of the macrophage colony stimulating factor gene. Nature 345, 442–444 [DOI] [PubMed] [Google Scholar]
- 41.Matsuo K, Owens JM, Tonko M, Elliott C, Chambers TJ, and Wagner EF (2000) Fosl1 is a transcriptional target of c-Fos during osteoclast differentiation. Nat Genet 24, 184–187 [DOI] [PubMed] [Google Scholar]
- 42.Nedeva IR, Vitale M, Elson A, Hoyland JA, and Bella J (2021) Role of OSCAR Signaling in Osteoclastogenesis and Bone Disease. Front Cell Dev Biol 9 [DOI] [PMC free article] [PubMed] [Google Scholar]
- 43.Merck E, Gaillard C, Scuiller M, Scapini P, Cassatella MA, Trinchieri G, and Bates EEM (2006) Ligation of the FcR gamma chain-associated human osteoclast-associated receptor enhances the proinflammatory responses of human monocytes and neutrophils. J Immunol 176, 3149–3156 [DOI] [PubMed] [Google Scholar]
- 44.Menten P, Wuyts A, and Van Damme J (2002) Macrophage inflammatory protein-1. Cytokine Growth F R 13, 455–481 [DOI] [PubMed] [Google Scholar]
- 45.Oyajobi BO, Franchin G, Williams PJ, Pulkrabek D, Gupta A, Munoz S, Grubbs B, Zhao M, Chen D, Sherry B, and Mundy GR (2003) Dual effects of macrophage inflammatory protein-1 alpha on osteolysis and tumor burden in the murine 5TGM1 model of myeloma bone disease. Blood 102, 311–319 [DOI] [PubMed] [Google Scholar]
- 46.Yang L, DeBusk LM, Fukuda K, Fingleton B, Green-Jarvis B, Shyr Y, Matrisian LM, Carbone DP, and Lin PC (2004) Expansion of myeloid immune suppressor Gr+CD11b+cells in tumor-bearing host directly promotes tumor angiogenesis. Cancer Cell 6, 409–421 [DOI] [PubMed] [Google Scholar]
Associated Data
This section collects any data citations, data availability statements, or supplementary materials included in this article.