

Abstract
Background
The etiology and pathology of mucoid degeneration of the anterior cruciate ligament (MD-ACL) remain poorly understood. MD-ACL may be associated with knee osteoarthritis (OA) or a mechanism other than OA. This study evaluated the radiological differences between knees with MD-ACL and those with a normal ACL and compared the clinical and radiological features of knees with MD-ACL according to the knee OA status.
Methods
This retrospective study compared the radiological features of the intercondylar notch width index (NWI) and posterior tibial slope (PTS) of 67 MD-ACL patients (MD group) and 67 age-, sex-, and OA grade-matched patients with a normal ACL (control group). During the subgroup analysis, MD-ACL patients were divided into the non-OA subgroup (n = 41) and OA subgroup (n = 26). The pain location and characteristics of the knee, PTS, and NWI were compared between these subgroups.
Results
Compared to the control group, the MD group had a lower NWI (0.26 ± 0.03 vs. 0.28 ± 0.01, p < 0.001) and a larger PTS (11.3° ± 3.0° vs. 9.2° ± 2.5°, p < 0.001). During the subgroup analysis, the most common pain locations were the posterior and medial aspects of the knee in the non-OA subgroup (43.9%) and OA subgroup (53.8%), respectively. Pain on terminal flexion was the most common pain characteristic in both subgroups (non-OA subgroup, 73.1%; OA subgroup, 53.8%). The PTS was not different between subgroups (11.7° ± 3.2° in the non-OA subgroup vs. 10.6° ± 2.7° in the OA subgroup; p = 0.159). However, the non-OA subgroup had a lower NWI than the OA subgroup (0.25 ± 0.03 vs. 0.28 ± 0.02, p = 0.001).
Conclusions
Patients with MD-ACL had a lower NWI and a larger PTS than patients with a normal ACL. Furthermore, the clinical and radiological features of MD-ACL differed according to the knee OA status. A narrow intercondylar notch may be more closely associated with the development of MD-ACL without OA.
Keywords: Anterior cruciate ligament, Mucoid degeneration, Osteoarthritis, Notch width index, Posterior tibial slope
Mucoid degeneration of the anterior cruciate ligament (MD-ACL) is a pathological entity that causes chronic knee pain. Most cases are non-traumatic, and the primary symptom is pain during knee range of motion (ROM), which characteristically worsens during terminal flexion or extension.1,2,3) Since described for the first time by Kumar et al.4) in 1999, MD-ACL has been studied in relatively recent years. MD-ACL is diagnosed by magnetic resonance imaging (MRI) findings with the characteristics of an ill-defined margin and increases in both diameter and signal intensity, but intact continuity of the ACL.5,6,7) With the increasing use of MRI for knee disorder diagnoses in recent years, the detection of MD-ACL has also increased, with a prevalence reported to be as high as 9.2% in the total population.8)
Despite the increasing diagnostic rate of MD-ACL, its etiology and pathophysiology have yet to be clearly identified. Some authors have reported an increased posterior tibial slope (PTS) and narrow intercondylar notch as factors contributing to MD-ACL.9,10,11,12,13) These were based on the fact that an increased PTS can cause anterior tibial translation, leading to sustained stress applied to the ACL, and impingement between the ACL and a narrow intercondylar notch can cause repeated ACL microtrauma. However, previous studies had small sample sizes and no studies have investigated the factors contributing to MD-ACL based on evaluations of both the PTS and the intercondylar notch width in the same patients.
Moreover, several studies reported that patients with MD-ACL showed a higher frequency of medial meniscus tear or cartilage damage in the medial tibiofemoral compartment than patients with normal ACL.14,15) Considering that such associated pathology usually appears in early knee osteoarthritis (OA), it may support the degenerative theory that overall knee joint degeneration associated with aging causes ACL to progress to MD-ACL.1,16,17) However, MD-ACL is not always accompanied by OA and may occur in relatively young patients without OA.18) To date, no studies have focused on OA and evaluated the differences in the clinical and radiological features of MD-ACL according to the OA status.
Therefore, this study aimed to evaluate the radiological differences between knees with MD-ACL and those with normal ACL and compare the clinical and radiological features of knees with MD-ACL according to the knee OA status. We hypothesized that patients with MD-ACL would have increased PTS and narrow intercondylar notch compared to patients with normal ACL and that there would be differences in the clinical and radiological features of patients with MD-ACL according to the OA status.
METHODS
The study was approved by the Institutional Review Board of all relevant hospitals (IRB No. H-2108-145-1246) and the requirement for informed consent was waived due to the retrospective nature of this study.
Subjects
In this multicenter study, we retrospectively collected the medical records of patients diagnosed with MD-ACL in 3 teaching hospitals from March 2012 to September 2019. Patient inclusion was narrowed to patients who (1) had available magnetic resonance (MR) images and met the radiologic criteria for MD-ACL: increased signal intensity and thickened ACL fiber with intact continuity on T1- and T2-weighted images, and a “celery stalk” appearance on T2-weighted images, (2) had anteroposterior, lateral knee radiographs and full-length, standing anteroposterior radiographs taken within 1 year of the MRI, and (3) had medical records regarding the clinical presentation (pain location and characteristics) at the first outpatient department visit. As the accuracy of diagnosing MD-ACL is of utmost importance in this study, 2 fellowship-trained orthopedic surgeons (JIK and MWK) assessed the whole MRI to determine the presence of MD-ACL. The overall agreement between the 2 surgeons was 94.6%, with 88 of 93 cases diagnosed identically. The 5 discrepancies were not included in the study due to a lack of consensus between MD and normal variation. The exclusion criteria were (1) a history of fracture around the knee joint, (2) previous open knee surgery, and (3) a history of knee joint infection or inflammatory arthritis such as rheumatologic arthritis. Finally, 67 patients with MD-ACL were included in the MD group. To clarify the radiologic features of the MD-ACL patients by comparison to those with normal ACL, we retrospectively reviewed the medical records of the patients who had undergone an arthroscopic simple meniscectomy from March 2017 to September 2020. According to the preoperative MRI and arthroscopic findings, we identified 112 patients with normal ACL (control group). For subgroup analysis according to OA grade, the MD group was divided into the non-OA subgroup (n = 41, Kellgren-Lawrence [K-L] grade 0 or 1) and the OA subgroup (n = 26, K-L grade 2–4) (Fig. 1).
Fig. 1. Flow diagram of the study. MD: mucoid degeneration, ACL: anterior cruciate ligament, OA: osteoarthritis.

Clinical and Radiographic Evaluations
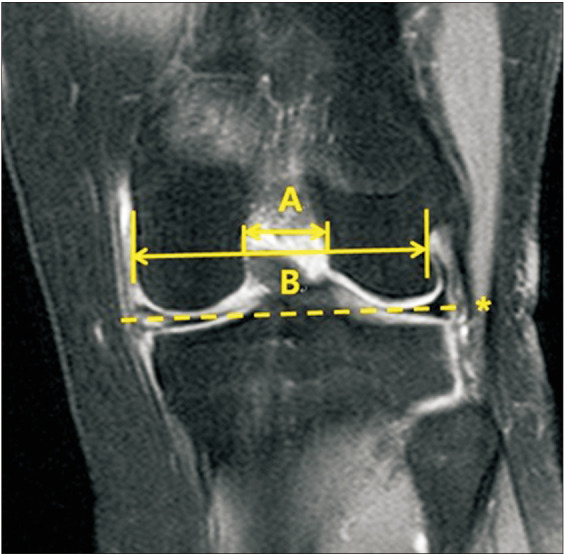
The clinical data including pain location and characteristics were collected from the medical records. Pain location was classified into anterior, medial, lateral, and posterior aspects of the knee. In addition, pain characteristics were classified into pain on activity, resting pain, pain on terminal extension, and pain on terminal flexion. The hip-knee-ankle (H-K-A) angle, PTS, and OA grade were evaluated by radiography. The H-K-A angle was defined as the intersecting angle between the mechanical axis of the femur and the mechanical axis of the tibia on a full-length standing anteroposterior radiograph. The PTS was measured at 30° of flexion on the lateral knee radiograph. The PTS was defined as the angle formed between the proximal tibial plateau and a line perpendicular to the anatomic axis of the tibial shaft (Fig. 2).19) The OA grade of the knee joint was assessed with weight-bearing anteroposterior and lateral knee radiographs using the K-L grading system, where grade I was a doubtful narrowing of the joint space and possible osteophytic lipping, grade II was definite osteophytes and possible narrowing of the joint space; grade III was moderate multiple osteophytes and definite narrowing of the joint space, and grade IV was large osteophytes and a marked narrowing of the joint space.20) The notch width index (NWI) was calculated using MRI by dividing the notch width by the bicondylar width in the T2 coronal sequences that best showed the popliteus groove. First, a line was drawn between the medial and lateral articular margins of both condyles. Then, the bicondylar width was measured parallel to this line at the level of the popliteal groove. Lastly, the notch width was measured at the same level as the bicondylar width (Fig. 3).21) Furthermore, the presence of joint effusion and ACL cyst combined with MD-ACL and posterior cruciate ligament (PCL) degeneration were also evaluated by MRI. PCL degeneration was defined as the increased signal intensity of PCL fiber on T2-weighted images.22)
Fig. 2. The posterior tibial slope (PTS) was measured at 30° of flexion in a lateral knee radiograph. First, the axis of the tibial shaft (A) was identified by applying 2 circles to the proximal tibia at 5 and 15 cm distal to the joint surface and drawing a line connecting their centers. The PTS was defined as the angle formed between the proximal tibial plateau (B) and a line (C) perpendicular to the anatomic axis of the tibial shaft.
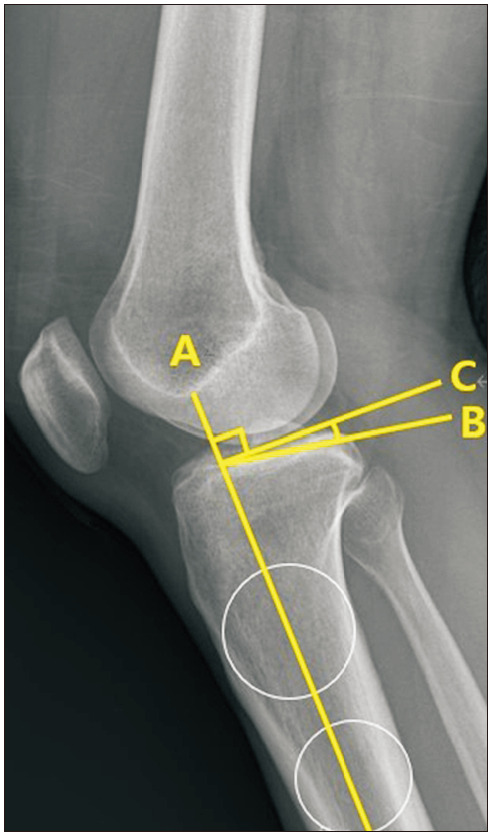
Fig. 3. The notch width index was calculated using magnetic resonance images by dividing the notch width (A) by the bicondylar width (B) in T2 coronal sequences. First, a line was drawn between the medial and lateral articular margins of both condyles (asterisk). Then, the bicondylar width was measured parallel to this line at the level of the popliteal groove. Lastly, the notch width was measured at the same level as the bicondylar width.
Statistical Analysis
Prior to the analysis, propensity score matching was performed with the variables of age, sex, and OA grade. Propensity scores from the above variables were generated using IBM SPSS Statistics for Windows Ver. 24 (IBM Corp., Armonk, NY, USA). Every patient in the MD group (n = 67) was assigned a matching patient in the control group (n = 112) with a match tolerance (maximum difference between propensity scores) of 0.1. Therefore, the final number of patients included in each group was 67, and the control group mentioned here refers to 67 of the 112 patients after propensity score matching. After matching, differences between the groups were analyzed by the t-test for continuous variables and Pearson’s chi-square test or Fisher’s exact test for categorical variables. Radiographic parameters were measured twice by 2 fellowship-trained orthopedic surgeons (JIK and MWK) at a 2-week interval between measurements. Intraobserver and interobserver measurement reliabilities were assessed by the intraclass correlation coefficient (ICC). All statistical analyses were conducted using SPSS software version 21 (IBM Corp., Armonk, NY, USA), and a p-value of < 0.05 was considered statistically significant.
RESULTS
After propensity matching, the groups were similar in terms of age, sex, and OA grade (Table 1). Compared to the control group, the MD group had a lower NWI (0.26 ± 0.03 in the MD group vs. 0.28 ± 0.01 in the control group, p < 0.001) and a larger PTS (11.3 ± 3.0° in the MD group vs. 9.2 ± 2.5° in the control group, p < 0.001). In the subgroup analysis, the patients in the non-OA subgroup were younger than those in the OA subgroup (53.3 ± 11.7 vs. 62.2 ± 9.4 years, p = 0.002). The H-K-A angle was not different between the 2 subgroups (varus 2.4° ± 4.7° in the non-OA subgroup vs. varus 3.1° ± 3.2° in the OA subgroup, p = 0.552). The most common pain location was the posterior aspect of the knee in the non-OA subgroup (43.9%) and the medial aspect of the knee in the OA subgroup (53.8%). Pain on terminal flexion was the most common pain characteristic in both subgroups (73.1% in the non-OA subgroup and 53.8% in the OA subgroup) (Table 2). There were no differences between the subgroups regarding the PTS (11.7° ± 3.2° in the non-OA subgroup vs. 10.6° ± 2.7° in the OA subgroup, p = 0.159). However, compared to the OA subgroup, the non-OA subgroup had a lower NWI (0.25 ± 0.03 in the non-OA subgroup vs. 0.28 ± 0.02 in the OA subgroup, p = 0.001). The proportion of patients with joint effusion (92.3% in the OA subgroup and 29.4% in the non-OA subgroup, p < 0.001) and PCL degeneration (57.6% in the OA subgroup and 31.7% in the non-OA subgroup, p = 0.036) was higher in the OA subgroup. However, the proportion of patients with ACL cysts combined with MD-ACL (31.7% in the OA subgroup and 57.6% in the non-OA subgroup, p = 0.622 was not different between the 2 subgroups (Table 3). Intra- and interobserver measurement reliabilities were excellent for all parameters (ICC > 0.8; range, 0.82–0.94).
Table 1. Patient Characteristics.
| Variable | MD group (n = 67) | Control group (n = 67) | p-value |
|---|---|---|---|
| Age (yr) | 56.7 ± 11.6 | 55.4 ± 11.4 | 0.501* |
| Male : female | 18 : 49 | 25 : 42 | 0.195† |
| K-L grade (0 : I : II : III : IV) | 28 : 13 : 15 : 8 : 3 | 27 : 13 : 24 : 3 : 0 | 0.118‡ |
Values are presented as mean ± standard deviation or number.
MD: mucoid degeneration, K-L: Kellgren-Lawrence.
*Student t-test. †Pearson’s chi-square test. ‡Fisher exact test.
Table 2. Pain Location and Characteristics in Non-OA and OA Subgroups.
| Variable | Non-OA subgroup (n = 41) | OA subgroup (n = 26) | |
|---|---|---|---|
| Pain location* | |||
| Anterior side | 17 (41.4) | 7 (26.9) | |
| Medial side | 7 (17) | 14 (53.8) | |
| Lateral side | 4 (9.7) | 2 (7.6) | |
| Posterior side | 18 (43.9) | 6 (23) | |
| Pain characteristics* | |||
| Pain on activity | 10 (24.3) | 8 (30.7) | |
| Resting pain | 2 (4.8) | 5 (19.2) | |
| Pain on terminal extension | 10 (24.3) | 7 (26.9) | |
| Pain on terminal flexion | 30 (73.1) | 14 (53.8) | |
Values are presented as number of patients (%).
OA: osteoarthritis.
*Multiple responses on pain location and characteristics were allowed.
Table 3. Comparison of Clinical and Radiographic Features between Non-OA and OA Subgroups.
| Variable | Non-OA subgroup (n = 41) | OA subgroup (n = 26) | p-value |
|---|---|---|---|
| Age (yr) | 53.3 ± 11.7 | 62.2 ± 9.4 | 0.002* |
| Hip-knee-ankle angle (°) | Varus 2.4 ± 4.7 | Varus 3.1 ± 3.2 | 0.552* |
| Posterior tibial slope (°) | 11.7 ± 3.2 | 10.6 ± 2.7 | 0.159* |
| Notch width index | 0.25 ± 0.03 | 0.28 ± 0.02 | 0.001* |
| No. of patients with joint effusion (%) | 12 (29.4) | 24 (92.3) | < 0.001† |
| No. of patients with ACL cyst (%) | 10 (24.3) | 5 (19.2) | 0.622† |
| No. of patients with PCL degeneration (%) | 13 (31.7) | 15 (57.6) | 0.036† |
Values are presented as mean ± standard deviation or number (%).
OA: osteoarthritis, ACL: anterior cruciate ligament, PCL: posterior cruciate ligament.
*Student t-test. †Pearson’s chi-square test.
DISCUSSION
The primary findings of the present study were as follows: (1) MD-ACL patients had a lower NWI and a larger PTS than normal ACL patients and (2) MD-ACL patients without OA were younger and had a lower NWI than MD-ACL patients with OA. Based on the findings in this study, we confirmed our hypothesis that patients with MD-ACL have an increased PTS and narrower intercondylar notch compared to patients with normal ACL and that there are differences in the clinical and radiological features of patients with MD-ACL according to the OA status. To our knowledge, this was the first clinical study to compare the clinical and radiological features of MD-ACL patients according to the OA status.
In our study, the most common pain location was the posterior aspect of the knee in the non-OA subgroup and the medial aspect of the knee in the OA subgroup, although pain on terminal flexion was the most common characteristic of pain in both subgroups. Several studies have reported the symptoms of patients with MD-ACL. In a study by Hotchen et al.,10) the highest percentage of patients complained of posterior knee pain (77%), followed by pain on terminal flexion and extension (25% each). Similarly, a study by Lee et al.23) reported that the highest percentage of patients complained of pain on terminal flexion (86%), followed by posterior knee pain (84%), and pain on terminal extension (77%). However, these studies were different from our study in that they did not analyze differences in the symptoms according to the OA status. Considering that MD-ACL is often accompanied by OA, it is important to determine whether there are differences in the main complaints from patients according to the OA status. Based on the findings of our study, it should be noted that patients with OA may complain more of medial knee pain than of posterior knee pain as a predominant symptom, which may originate from medial compartmental OA.
Several studies reported the relationship between MD-ACL and PTS. Youm et al.12) analyzed the relationship between MD-ACL and PTS in patients undergoing total knee arthroplasty, reporting that the MD-ACL patients had larger PTS than the normal ACL patients (10.8° vs. 9.9°, respectively) and such increased PTS could be one of the causative factors of MD-ACL. Similarly, Zikria et al.13) analyzed the association between MRI-based PTS and MD-ACL, reporting that the MD-ACL patients had larger PTS than the normal ACL patients (7.1° vs. 5.3°, respectively). Moreover, conditional regression analysis results also indicated that the risk of MD-ACL increased by 17% with every 1° increase in the PTS. Our study also showed that regardless of the OA status, patients with MD-ACL had larger PTS than those with normal ACL. We assume that one of the causative factors of MD-ACL is an increased PTS, which causes an increase in anterior tibial translation, leading to chronic stress on the ACL. Numerous studies24,25,26,27) have reported that an increased PTS could affect the ACL state, although these studies mainly focused on the relationship between PTS and ACL tear. While there may be some differences in the specific mechanisms, we believed that an increased PTS also acts as a potent predisposing factor for MD-ACL.
In our study, patients with MD-ACL showed a lower NWI than patients with normal ACL, while MD-ACL patients without OA showed a lower NWI than those with OA. The association between NWI and MD-ACL found in our study supports the previous theory that MD-ACL occurs due to a narrow intercondylar notch, and a narrow intercondylar notch may be due to primary narrowing or secondary narrowing by osteophyte formation around the intercondylar notch.9,10,28) Impingement between the ACL and narrow intercondylar notch causes repetitive ACL microtrauma and abnormal thickening of the ACL may occur as the site of injury is filled with mucin. In our study, the mean NWI of MD-ACL patients without OA was 0.25, whereas MD-ACL patients with OA showed a mean NWI of 0.28, with no difference compared to patients with normal ACL (normal ACL with OA: 0.28 ± 0.02, normal ACL without OA: 0.28 ± 0.01). Therefore, we assumed that there is a difference in the mechanism by which MD-ACL occurs according to the OA status. When MD-ACL occurs in relatively younger patients without OA, a congenitally narrow intercondylar notch may play a major role. In contrast, when MD-ACL occurs with OA, multifactorial knee joint degeneration including synovitis, cruciate ligament degeneration, and osteophyte formation may have a greater influence on the occurrence of MD-ACL than the morphology of the intercondylar notch.
Surgical treatment for MD-ACL may be considered if the symptoms persist despite conservative treatments such as oral medication, intra-articular injections, and physiotherapy. Surgical treatment usually involves partial or total debridement of a hypertrophic ACL with or without notchplasty. ACL debridement is accepted as a standard surgical treatment, whereas it remains debatable whether additional notchplasty should be performed.3,23,29,30) Ventura et al.30) reported that improved patient satisfaction and function were achieved by ACL partial or total debridement without additional notchplasty. However, Narvekar and Gajjar3) reported that most patients were pain-free and had recovered full ROM after ACL partial debridement along with additional notchplasty on the roof and lateral wall. Similarly, Lee et al.23) also reported that they achieved satisfactory outcomes with ACL partial debridement and concomitant notchplasty and that notchplasty could be an option for avoiding ACL total debridement. However, as demonstrated in our study, not all patients with MD-ACL have a narrow intercondylar notch. Thus, we believe that routine notchplasty is not necessary during surgical treatment for MD-ACL. However, because MD-ACL patients without OA have a narrow intercondylar notch, the NWI of patients with such conditions should be evaluated by preoperative MRI and if a narrow intercondylar notch is found, then additional notchplasty during ACL debridement should be considered.
This study has several limitations. First, this is a retrospective study with a relatively small sample size and the sample size was determined based on the number of eligible patients identified through a retrospective review, not through a power analysis. However, MD-ACL is a relatively rare pathological entity, which makes it difficult to conduct a prospective study with a large sample size. Second, while our study found that the most common pain location was medial for the OA subgroup and posterior for the non-OA subgroup, a statistical analysis of the differences between the 2 subgroups was not performed. Third, when measuring the intercondylar notch width at the level of the popliteal groove, we did not assess osteophytes that can cause secondary narrowing of the intercondylar notch. However, this was a retrospective study that diagnosed MD-ACL based on MRI. Therefore, computed tomography, which can be used to evaluate osteophytes accurately, was unavailable in most of the patients. Moreover, the non-OA subgroup with a relatively narrower intercondylar notch did not have OA. Thus, the cause of the narrowing may be congenital rather than a secondary cause due to osteophytes. Because the non-OA subgroup had a narrower intercondylar notch, additional notchplasty to reduce impingement between the ACL and the intercondylar notch could be helpful when performing surgical treatment, especially for MD-ACL patients without OA. However, our study did not analyze the clinical outcomes after surgical treatment. Well-designed follow-up studies based on our findings are warranted to confirm its efficacy. Last, this study solely focused on analyzing morphological parameters through radiography and MRI, while the risk of MD-ACL may be influenced by several other factors such as previous trauma history and ligament instability, which were not accounted for in this investigation. Therefore, future studies should be conducted using multiple logistic regression analysis to assess the potential contribution of other factors.
In conclusion, patients with MD-ACL had a lower NWI and a larger PTS than patients with normal ACL. Furthermore, the clinical and radiological features of MD-ACL differed according to the knee OA status. A narrow intercondylar notch may be more closely associated with the development of MD-ACL without OA.
ACKNOWLEDGEMENTS
The authors thank the Medical Research Collaborating Centre of Hallym University for the support in statistical analysis.
Footnotes
CONFLICT OF INTEREST: No potential conflict of interest relevant to this article was reported.
References
- 1.Kim TH, Lee DH, Lee SH, Kim JM, Kim CW, Bin SI. Arthroscopic treatment of mucoid hypertrophy of the anterior cruciate ligament. Arthroscopy. 2008;24(6):642–649. doi: 10.1016/j.arthro.2008.02.004. [DOI] [PubMed] [Google Scholar]
- 2.Lintz F, Pujol N, Boisrenoult P, Bargoin K, Beaufils P, Dejour D. Anterior cruciate ligament mucoid degeneration: a review of the literature and management guidelines. Knee Surg Sports Traumatol Arthrosc. 2011;19(8):1326–1333. doi: 10.1007/s00167-011-1433-0. [DOI] [PubMed] [Google Scholar]
- 3.Narvekar A, Gajjar S. Mucoid degeneration of the anterior cruciate ligament. Arthroscopy. 2004;20(2):141–146. doi: 10.1016/j.arthro.2003.11.030. [DOI] [PubMed] [Google Scholar]
- 4.Kumar A, Bickerstaff DR, Grimwood JS, Suvarna SK. Mucoid cystic degeneration of the cruciate ligament. J Bone Joint Surg Br. 1999;81(2):304–305. doi: 10.1302/0301-620x.81b2.9243. [DOI] [PubMed] [Google Scholar]
- 5.McIntyre J, Moelleken S, Tirman P. Mucoid degeneration of the anterior cruciate ligament mistaken for ligamentous tears. Skeletal Radiol. 2001;30(6):312–315. doi: 10.1007/s002560100336. [DOI] [PubMed] [Google Scholar]
- 6.Motmans R, Verheyden F. Mucoid degeneration of the anterior cruciate ligament. Knee Surg Sports Traumatol Arthrosc. 2009;17(7):737–740. doi: 10.1007/s00167-008-0690-z. [DOI] [PubMed] [Google Scholar]
- 7.Papadopoulou P. The celery stalk sign. Radiology. 2007;245(3):916–917. doi: 10.1148/radiol.2453050159. [DOI] [PubMed] [Google Scholar]
- 8.Hovis KK, Alizai H, Tham SC, et al. Non-traumatic anterior cruciate ligament abnormalities and their relationship to osteoarthritis using morphological grading and cartilage T2 relaxation times: data from the Osteoarthritis Initiative (OAI) Skeletal Radiol. 2012;41(11):1435–1443. doi: 10.1007/s00256-012-1379-4. [DOI] [PMC free article] [PubMed] [Google Scholar]
- 9.Cha JH, Lee SH, Shin MJ, Choi BK, Bin SI. Relationship between mucoid hypertrophy of the anterior cruciate ligament (ACL) and morphologic change of the intercondylar notch: MRI and arthroscopy correlation. Skeletal Radiol. 2008;37(9):821–826. doi: 10.1007/s00256-008-0527-3. [DOI] [PubMed] [Google Scholar]
- 10.Hotchen AJ, Demetriou C, Edwards D, Melton JT. Mucoid degeneration of the anterior cruciate ligament: characterization of natural history, femoral notch width index, and patient reported outcome measures. J Knee Surg. 2019;32(6):577–583. doi: 10.1055/s-0038-1660514. [DOI] [PubMed] [Google Scholar]
- 11.Jung KH, Cho SD, Park KB, Youm YS. Relation between mucoid degeneration of the anterior cruciate ligament and posterior tibial slope. Arthroscopy. 2012;28(4):502–506. doi: 10.1016/j.arthro.2011.08.315. [DOI] [PubMed] [Google Scholar]
- 12.Youm YS, Cho SD, Cho HY, Jung SH. Relationship between mucoid degeneration of the anterior cruciate ligament and posterior tibial slope in patients with total knee arthroplasty. Knee Surg Relat Res. 2016;28(1):34–38. doi: 10.5792/ksrr.2016.28.1.34. [DOI] [PMC free article] [PubMed] [Google Scholar]
- 13.Zikria B, Johnson A, Hafezi-Nejad N, et al. Association between MRI-based tibial slope measurements and mucoid degeneration of the anterior cruciate ligament: a propensity score-matched case-control study. Orthop J Sports Med. 2020;8(11):2325967120962804. doi: 10.1177/2325967120962804. [DOI] [PMC free article] [PubMed] [Google Scholar]
- 14.Kwee RM, Ahlawat S, Kompel AJ, et al. Association of mucoid degeneration of anterior cruciate ligament with knee meniscal and cartilage damage. Osteoarthritis Cartilage. 2015;23(9):1543–1550. doi: 10.1016/j.joca.2015.04.013. [DOI] [PubMed] [Google Scholar]
- 15.Kwee RM, Hafezi-Nejad N, Roemer FW, et al. Association of mucoid degeneration of the anterior cruciate ligament at MR imaging with medial tibiofemoral osteoarthritis progression at radiography: data from the osteoarthritis initiative. Radiology. 2018;287(3):912–921. doi: 10.1148/radiol.2018171565. [DOI] [PubMed] [Google Scholar]
- 16.Cushner FD, La Rosa DF, Vigorita VJ, Scuderi GR, Scott WN, Insall JN. A quantitative histologic comparison: ACL degeneration in the osteoarthritic knee. J Arthroplasty. 2003;18(6):687–692. doi: 10.1016/s0883-5403(03)00256-0. [DOI] [PubMed] [Google Scholar]
- 17.Fernandes JL, Viana SL, Mendonca JL, et al. Mucoid degeneration of the anterior cruciate ligament: magnetic resonance imaging findings of an underdiagnosed entity. Acta Radiol. 2008;49(1):75–79. doi: 10.1080/02841850701660497. [DOI] [PubMed] [Google Scholar]
- 18.Kusano M, Horibe S, Tanaka Y, et al. Early reconstruction should be considered in younger patients with symptomatic mucoid degeneration of the anterior cruciate ligament. Asia Pac J Sports Med Arthrosc Rehabil Technol. 2015;2(3):95–97. doi: 10.1016/j.asmart.2015.03.001. [DOI] [PMC free article] [PubMed] [Google Scholar]
- 19.Karimi E, Norouzian M, Birjandinejad A, Zandi R, Makhmalbaf H. Measurement of posterior tibial slope using magnetic resonance imaging. Arch Bone Jt Surg. 2017;5(6):435–439. [PMC free article] [PubMed] [Google Scholar]
- 20.Kohn MD, Sassoon AA, Fernando ND. Classifications in brief: Kellgren-Lawrence classification of osteoarthritis. Clin Orthop Relat Res. 2016;474(8):1886–1893. doi: 10.1007/s11999-016-4732-4. [DOI] [PMC free article] [PubMed] [Google Scholar]
- 21.Vaswani R, Meredith SJ, Lian J, et al. Intercondylar notch measurement during arthroscopy and on preoperative magnetic resonance imaging. Arthrosc Tech. 2019;8(10):e1263–e1267. doi: 10.1016/j.eats.2019.06.017. [DOI] [PMC free article] [PubMed] [Google Scholar]
- 22.McMonagle JS, Helms CA, Garrett WE, Vinson EN. Tram-track appearance of the posterior cruciate ligament (PCL): correlations with mucoid degeneration, ligamentous stability, and differentiation from PCL tears. AJR Am J Roentgenol. 2013;201(2):394–399. doi: 10.2214/AJR.11.7400. [DOI] [PubMed] [Google Scholar]
- 23.Lee JW, Ahn JT, Gwak HG, Lee SH. Clinical outcomes of arthroscopic notchplasty and partial resection for mucoid degeneration of the anterior cruciate ligament. J Clin Med. 2021;10(2):315. doi: 10.3390/jcm10020315. [DOI] [PMC free article] [PubMed] [Google Scholar]
- 24.Brandon ML, Haynes PT, Bonamo JR, Flynn MI, Barrett GR, Sherman MF. The association between posterior-inferior tibial slope and anterior cruciate ligament insufficiency. Arthroscopy. 2006;22(8):894–899. doi: 10.1016/j.arthro.2006.04.098. [DOI] [PubMed] [Google Scholar]
- 25.Hohmann E, Bryant A, Reaburn P, Tetsworth K. Is there a correlation between posterior tibial slope and non-contact anterior cruciate ligament injuries? Knee Surg Sports Traumatol Arthrosc. 2011;19 Suppl 1:S109–S114. doi: 10.1007/s00167-011-1547-4. [DOI] [PubMed] [Google Scholar]
- 26.Sonnery-Cottet B, Archbold P, Cucurulo T, et al. The influence of the tibial slope and the size of the intercondylar notch on rupture of the anterior cruciate ligament. J Bone Joint Surg Br. 2011;93(11):1475–1478. doi: 10.1302/0301-620X.93B11.26905. [DOI] [PubMed] [Google Scholar]
- 27.Zeng C, Cheng L, Wei J, et al. The influence of the tibial plateau slopes on injury of the anterior cruciate ligament: a meta-analysis. Knee Surg Sports Traumatol Arthrosc. 2014;22(1):53–65. doi: 10.1007/s00167-012-2277-y. [DOI] [PubMed] [Google Scholar]
- 28.Quasnichka HL, Anderson-MacKenzie JM, Tarlton JF, Sims TJ, Billingham ME, Bailey AJ. Cruciate ligament laxity and femoral intercondylar notch narrowing in early-stage knee osteoarthritis. Arthritis Rheum. 2005;52(10):3100–3109. doi: 10.1002/art.21340. [DOI] [PubMed] [Google Scholar]
- 29.Morice A, Coupry A, Lintz F, Robert H. Reduction plasty for hypertrophic anterior cruciate ligament mucoid degeneration: clinical and knee laxity outcomes in 23 cases. Orthop Traumatol Surg Res. 2013;99(6):693–697. doi: 10.1016/j.otsr.2013.04.010. [DOI] [PubMed] [Google Scholar]
- 30.Ventura D, Nunez JH, Joshi-Jubert N, Castellet E, Minguell J. Outcome of arthroscopic treatment of mucoid degeneration of the anterior cruciate ligament. Clin Orthop Surg. 2018;10(3):307–314. doi: 10.4055/cios.2018.10.3.307. [DOI] [PMC free article] [PubMed] [Google Scholar]