

Abstract
Ras proteins in the mitogen-activated protein kinase (MAPK) signaling pathway represent one of the most frequently mutated oncogenes in cancer. Ras binds guanosine nucleotides and cycles between active (GTP) and inactive (GDP) conformations to regulate the MAPK signaling pathway. Guanosine and other nucleotides exist in cells as either 2’-hydroxy or 2’-deoxy forms, and imbalances in the deoxyribonucleotide triphosphate pool has been associated with different diseases, such as diabetes, obesity, and cancer. However, the biochemical properties of Ras bound to dGNP is not well understood. Herein, we use native mass spectrometry to monitor the intrinsic GTPase activity of H-Ras and N-Ras oncogenic mutants, revealing the rate of 2’-deoxy guanosine triphosphate (dGTP) hydrolysis differs compared to the hydroxylated form, in some cases by seven-fold. Moreover, K-Ras expressed from HEK293 cells exhibited a higher than anticipated abundance of dGNP, despite the low abundance of dGNP in cells. Additionally, GTPase and dGTPase activity of K-RasG12C was found to be accelerated by 10.2- and 3.8-fold in the presence of small molecule covalent inhibitors, which may open opportunities toward the development of Pan-Ras inhibitors. The molecular assemblies formed between H-Ras and N-Ras, including mutant forms, with the catalytic domain of SOS (SOScat) was also investigated. The results show the different mutants of H-Ras and N-Ras not only engage SOScat differently, but these assemblies are also dependent on the form of guanosine triphosphate bound to Ras. These findings bring to the fore a new perspective on the nucleotide-dependent biochemical properties of Ras that may have implications in activation of the MAPK signaling pathway and Ras-driven cancers.
Keywords: Ras, Son of Sevenless, SOS, Native Mass spectrometry, Intrinsic hydrolysis, GTPase, Guanosine nucleotide exchange factor, GEF, Sotorasib, Adagrasib
Introduction
Ras is a small GTPase that is an integral part of the mitogen-activated kinase (MAPK) signaling pathway. Ras proteins regulate diverse cellular processes, including cell differentiation, proliferation, apoptosis, and survival.1–3 The three isoforms of Ras (H-Ras, K-Ras, and N-Ras) have more than 80% overall amino acid sequence identity and share more than 93% sequence identity within the guanosine triphosphate binding domain (G domain).4, 5 Mutations in Ras attribute to 30% of human cancers and, have unique biochemical properties that underly the nature of Ras-driven cancers.6–10 Among the isoforms of Ras, K-Ras is the most frequently mutated and implicated in 70–90% of pancreatic cancers, 30–50% of colon cancer, and 20–30% of lung cancers. Mutations in N-Ras are primarily associated with 29% of melanomas and H-Ras, while less frequently mutated, is responsible for a subset of head and neck squamous cell carcinomas.11–13
Ras cycles between a guanosine diphosphate (GDP)-bound inactive and guanosine triphosphate (GTP)-bound active states.2, 14, 15 Moreover, Ras possesses low intrinsic GTP hydrolysis and guanidine nucleotide exchange rates.7, 14 These attributes are regulated by GTPase-activating proteins (GAPs), which stimulate GTP hydrolysis leading to deactivation of the active state, and activated by guanine exchange factors (GEFs), which catalyze the exchange of GDP for GTP.16 The multidomain protein, Son of Sevenless (SOS) is a GEF with the catalytic domain (SOScat) containing the cdc25 and Ras exchanger motifs.17 SOScat possesses two binding sites for Ras: binding of Ras-GTP at the distal (or allosteric) site that allosterically modulates SOScat activity; and Ras binding at the active site where nucleotide exchange is facilitated.17, 18 The nucleotide-bound state of Ras greatly impacts the degree of the allosteric modulation.17, 19, 20 Additionally, SOS is conformationally dynamic and binding of Ras-GTP at the allosteric site shifts the population to active conformation(s) of SOS.21 The molecular assemblies formed between SOScat and oncogenic mutants of Ras are distinct from those formed with K-Ras.22 Interestingly, K-RasG13D robustly engages SOScat, exhibiting higher affinity for SOScat than K-Ras, and a potent allosteric modulator of SOScat activity.
Guanosine nucleotides exist in cells as either 2’-hydroxy or 2’-deoxy guanosine nucleotides, where the 2’-deoxy guanosine nucleotides are an integral part of DNA synthesis during the S phase of the cell cycle.23 Imbalances in the deoxyribonucleotide triphosphate (dNTP) pool is associated with different diseases including diabetes, obesity and cancer, due to enhanced mutagenesis and genomic instability.24 Upon mutagenesis, Ras oncogenes have the ability to reprogram the metabolic process in cells and, in some cases, lead to the development of cancer.25 A previous study showed Ras displays a near equal affinity to 2’ hydroxy and 2’ deoxy guanosine nucleotides.26 However, K-Ras mutants displayed different abundances for nucleotides co-purified with K-Ras and three oncogenic mutants (G12C, G13D, and Q61H).27 Moreover, the intrinsic GTP hydrolysis rates of the oncogenic K-Ras mutants displayed a preference to hydrolyze 2’-deoxy guanosine triphosphate (dGTP) over GTP. Despite this discovery, it remains unclear how the activation of the signaling pathway is impacted by dGTP-bound Ras.
Despite several decades of research, direct targeting of Ras for the therapeutic interventions of Ras-driven cancers was considered elusive, due to a lack of potential druggable pockets and relatively smooth surface of the protein.7 The covalent inhibitor of K-RasG12C mutant Sotorasib, recently approved by FDA, has successfully demonstrated the direct inhibition of the protein.28 Unfortunately, applications of this inhibitor on other Ras mutants are unlikely due to its Cys-12 specific irreversible, covalent interactions. Therefore, alternative approaches are being explored. An attractive therapeutic strategy to curb aberrant Ras signaling is disrupting the interaction between Ras and SOS.7, 29, 30 Peptide mimetics and potent small molecules have been designed to disrupt Ras•SOS interactions and have shown antiproliferative activity.30–32 These results represent a viable approach for targeting Ras-driven cancers, more specifically, the therapeutic importance of targeting the Ras•SOS interaction. Despite the reported potency of small molecule Ras•SOS disruptors, BI-3406 with an IC50 of 5 nM30, 31, 33 did not disrupt the complex between K-RasG13D and SOS cat.22
Despite these advances, the nucleotide specificity of Ras, including oncogenic mutants and its isoforms, bound to the active and allosteric sites of SOS is not well understood. In this work, native mass spectrometry (MS) is utilized to investigate the biochemical properties of H- and N-Ras oncogenic mutants bound to different guanosine nucleotides. We report the intrinsic GTP and dGTP hydrolysis rates of H-Ras and N-Ras, revealing differences in rates depending on the bound nucleotide. We also characterize the molecular assemblies formed between SOScat with H-Ras and N-Ras and investigate the dependence on the nucleotide bound to Ras.
Methods
Protein expression and purification.
The genes encoding H-Ras (residues 1–166, UniProt P01112) and N-Ras (residues 1–172, UniProt P0111) were codon optimized for E. coli, synthesized as gBlock gene fragments (Integrated DNA Technologies), and cloned into a modified pCDF-1b (Novagen) expression construct. The resulting constructs were DNA sequence confirmed. The proteins were expressed with an N-terminal TEV protease cleavable 6xHis tag in Lemo21-(DE3) E. coli (New England Biolabs). SOS1cat (residues 558–1049) plasmid (a kind gift from Prof. John Kuriyan at the University of California Berkeley) was used to express in E. coli Rosetta 2(DE3) cells (Novagen) as previously described.17 Cells containing the expression plasmid were grown in LB medium supplemented with either 100 μg/mL ampicillin and 34 μg/mL chloramphenicol. Protein expression was induced with 500 μM IPTG once the cells reached an OD600 of 0.6–0.8 and grown at 18 °C overnight. Cells were harvested by centrifugation (5,000xg) and pellets stored at −80 °C. Cell pellets were thawed on ice and resuspended in buffer A (300 mM NaCl, 20 mM Tris pH 7.4) supplemented with a 1 mM MgCl2, and 5 mM β-mercaptoethanol (β-ME). In cases where the goal was not determining co-purified nucleotides, 50 μM of nucleotide (GDP or GTP) was added to the buffer. The cell suspension was lysed by a microfluidizer (Microfluidics M-110P) operating at 20,000 psi. The lysate was clarified by centrifugation at 40,000xg for 20 minutes. All purification steps were performed at 4 °C. The clarified lysate was loaded onto a 5 mL HisTrap HP column (GE Healthcare) pre-equilibrated in buffer A containing 20 mM imidazole. The protein was eluted with buffer A containing 500 mM imidazole. The fractions containing protein were pooled and desalted using a HiPrep 26/10 desalting column (GE Healthcare) equilibrated in buffer A. The desalted protein was then digested with TEV protease at 4 °C and incubated overnight to remove the N-terminal affinity tag. The proteins were passed over a 5 mL HisTrap HP column equilibrated with buffer A, and flow-through containing tag-less protein was collected. Proteins were then immediately analyzed via native MS for its nucleotide bound states. Single measurement was recorded. The protein collected in the flow-through was concentrated and subjected to size exclusion chromatography using a Highload 16/600 Superdex 75 pg column (GE Healthcare) equilibrated in buffer C (150 mM sodium chloride, 5 mM β-ME, 10% w/v glycerol, 0.5 mM MgCl2, ± 50 μM nucleotide (GDP or GTP), and 20 mM Tris pH 7.4). Peak fractions containing the target protein were pooled, glycerol was added to a final concentration of 10%, concentrated using a centrifugal concentrator (Millipore, 10K molecular weight cutoff (MWCO)), flash-frozen using liquid nitrogen, and stored at −80 °C.
Stable cell line generation and expression of K-Ras proteins in HEK293 cells.
The genes encoding 6xHistag-MBP-K-Ras4b (residues 1–169, Uniprot P01116-2) was cloned from the plasmid R989-X05-636 provided by the NCI RAS Initiative at the Frederick National Laboratory for Cancer Research (kindly obtained from Dominic Esposito)34 into a pHR-CMV-TetO2 transfer plasmid containing IRES-EmGFP (Addgene 113884). The resulting constructs were confirmed by DNA sequencing. Lentivirus containing the K-Ras transgene was generated following the previously reported protocol.35 In short, transgene containing K-Ras, envelope, and packaging DNA were mixed with PBS in equal ratio and incubated with PEI max for 20 minutes. And the mixture was then diluted with 90% DMEM (Corning), 10% FBS (Gibco) media up to 4 mL and was pour into fully confluent HEK293T Lenti-X (Takara) in T-25 flak and was incubated at 37 °C, 5% CO2 for 72 hours. Harvested Lentivirus was filtered and polybrene transfection reagent (EMD) was added. Fully confluent Expi293F™ inducible GnTl− Cells (HEK293; Gibco) in T-25 flask was transduced with this lentivirus, and grown in 90% DMEM, 10% FBS, 2 μg/mL blasticidine S HCl (Goldbio) with the addition of penicillin-streptomycin (Corning). Transduced HEK293 were then sorted using fluorescence assisted cell sorting (FACs) flow cytometry using the EmGFP as a fluorescent marker. Upon FACs, K-Ras stable HEK293 cell lines were grown and transitioned into suspension in Expi293 expression medium (Gibco). For expression of K-Ras, fully confluent HEK293 suspensions containing K-Ras gene were induced with 1 μg/mL doxycycline hydrochloride (Fisher) and incubated for 48 hours. Cells were harvested by centrifugation (5,000xg) and pellets stored at −80 °C. For purification, cell pellets were thawed on ice and lysed in buffer A containing 1% Triton-X (300 mM NaCl, 20 mM Tris, 1% Triton-X pH 7.4) supplemented with a 1 mM MgCl2, and 5 mM β-ME. Cells were lysed for 20 minutes in ice, and the lysate was clarified by centrifugation at 40,000xg for 20 minutes. All purification steps were performed at 4 °C. The clarified lysate was loaded onto a 5 mL MBP-Trap HP column (GE Healthcare) equilibrated with lysis buffer. The protein was washed with buffer A without Triton-X and eluted with buffer A containing 10 mM D-(+)-Maltose. The protein was then digested with TEV protease at 4 °C and incubated overnight to remove the N-terminal affinity tag. The proteins were passed over a 5 mL HisTrap HP column equilibrated with buffer A, and flow-through containing tag-less protein was collected. Proteins were then immediately analyzed via native MS for its nucleotide bound states. Single measurement was recorded.
Loading of Ras and oncogenic mutants with nucleotides.
Ras and oncogenic mutants were incubated with 30- to 50-fold molar excess of dGTP, GTP, or GDP in the presence of 10 mM EDTA for 3 hours at 4 °C. The reaction mixture was then supplemented with 10 mM MgCl2 and incubated for 30 minutes at 4 °C. Excess nucleotide, MgCl2 and EDTA were removed using a Micro Bio-Spin 6 desalting column (Bio-Rad). The procedure of nucleotide exchange was repeated until full or complete exchange of the intended nucleotide was achieved as determined by native MS measurements.
Determination of Protein Concentration.
The protein concentration was determined using a Detergent Compatible (DC) Protein Assay (Bio-Rad) with bovine serum albumin as the standard. Using a known protein concentration from the DC Protein Assay, molecular extinction coefficients (ε) for an absorbance at 280 nm were determined to be 19540 M−1cm−1 (K-Ras), 13905 M−1cm−1 (H-Ras), 17915 M−1cm−1 (N-Ras), and 49481 M−1cm−1 (SOScat).
Native Mass Spectrometry.
Samples were buffer exchanged using Micro Bio-Spin 6 desalting column (Bio-Rad) into 200 mM ammonium acetate (pH adjusted with ammonium hydroxide to 7.4). Specific details on instrument tuning parameters are provided in Table S1–S3. To monitor intrinsic GTPase and dGTPase activity, buffer exchanged Ras proteins were supplemented with 10 μM of magnesium acetate prior to start of the experiment. Samples were incubated at 25 °C and were loaded into pulled borosilicate glass capillaries prepared in house36 and electrosprayed with a voltage applied through a platinum wire inserted directly into the solution inside the glass capillary. Ionized samples were introduced into Thermo Exactive Plus with an Extended Mass Range Orbitrap mass spectrometer. The mole fractions of GDP-bound Ras at different time points were deconvoluted using Unidec37 and calculated as follows:
where i is the number of adducts (A) bound to Ras. The mole fraction was calculated as follows:
Where Ptot represents the enzyme’s total concentration. The mole fraction and concentration of of RAS · GTP were calculated in a similar fashion as RAS · GDP. For investigating Ras-SOS complexes, Ras proteins loaded with the intended nucleotide were mixed with SOScat in 3:1 molar ratio for native MS analysis. Three replicate measurements were recorded for each sample.
Analysis of Intrinsic GTPase Data.
The kinetic data was globally fitted to a first-order rate constant as follows:
and the integrated form:
The reverse reaction rate was assumed to be negligible. Triplicate samples were analyzed.
Monitoring K-RasG12C inhibitors’ impact on nucleotide hydrolysis.
Recombinant K-RasWT and K-RasG12C expressed from E. coli following the protocols from the previous report27 was loaded with the intended nucleotides as steps described above. Upon loading, K-Ras proteins were mixed with 2x molar equivalence of either Sotorasib (TargetMol), or Adagrasib (TargetMol). The intrinsic GTPase and dGTPase activities were of K-Ras proteins were monitored via native MS. For control sample not containing any drug molecules, DMSO was added to match the final solvent composition as the samples containing drug molecules. Triplicate samples were analyzed.
Results
Nucleotide bound states of recombinant Ras proteins.
As previous work showed the presence of different nucleotides co-purifying with K-Ras,27 recombinant H- and N-Ras proteins were analyzed by native mass spectrometry to catalog the co-purified nucleotides. Native mass spectra of purified H-Ras and N-Ras revealed the proteins co-purified with diphosphate and triphosphate forms of both 2’-deoxyguanosine and guanosine nucleotides (Figure 1). 2’-deoxyguanosine 5’-diphosphate (dGDP) is 16 Da lighter than GDP that can readily be resolved in the mass spectrum, and the presence of dGDP is consistent with previous findings for K-Ras.27 For H-Ras, the most intense signal corresponded to H-Ras bound to GDP, followed by H-Ras bound to GTP with a 21 Da addition, possibly either a Na+ or Mg2+ adduct (Figure 1B). Nearly 30% of the nucleotides co-purified with H-Ras were 2’-deoxyguanosine nucleotides (dGNPs). This value is much higher than that observed for K-Ras, in which more than 10% corresponded to dGNPs. For N-Ras, the most intense signal corresponded to N-Ras bound to GTP with another 21 Da addition, followed by N-Ras bound to GDP (Figure S2B). N-Ras was predominantly (more than 90%) bound to guanosine nucleotides (GNPs).
Figure 1. Recombinant H- and N-Ras proteins co-purify with different guanosine nucleotides.
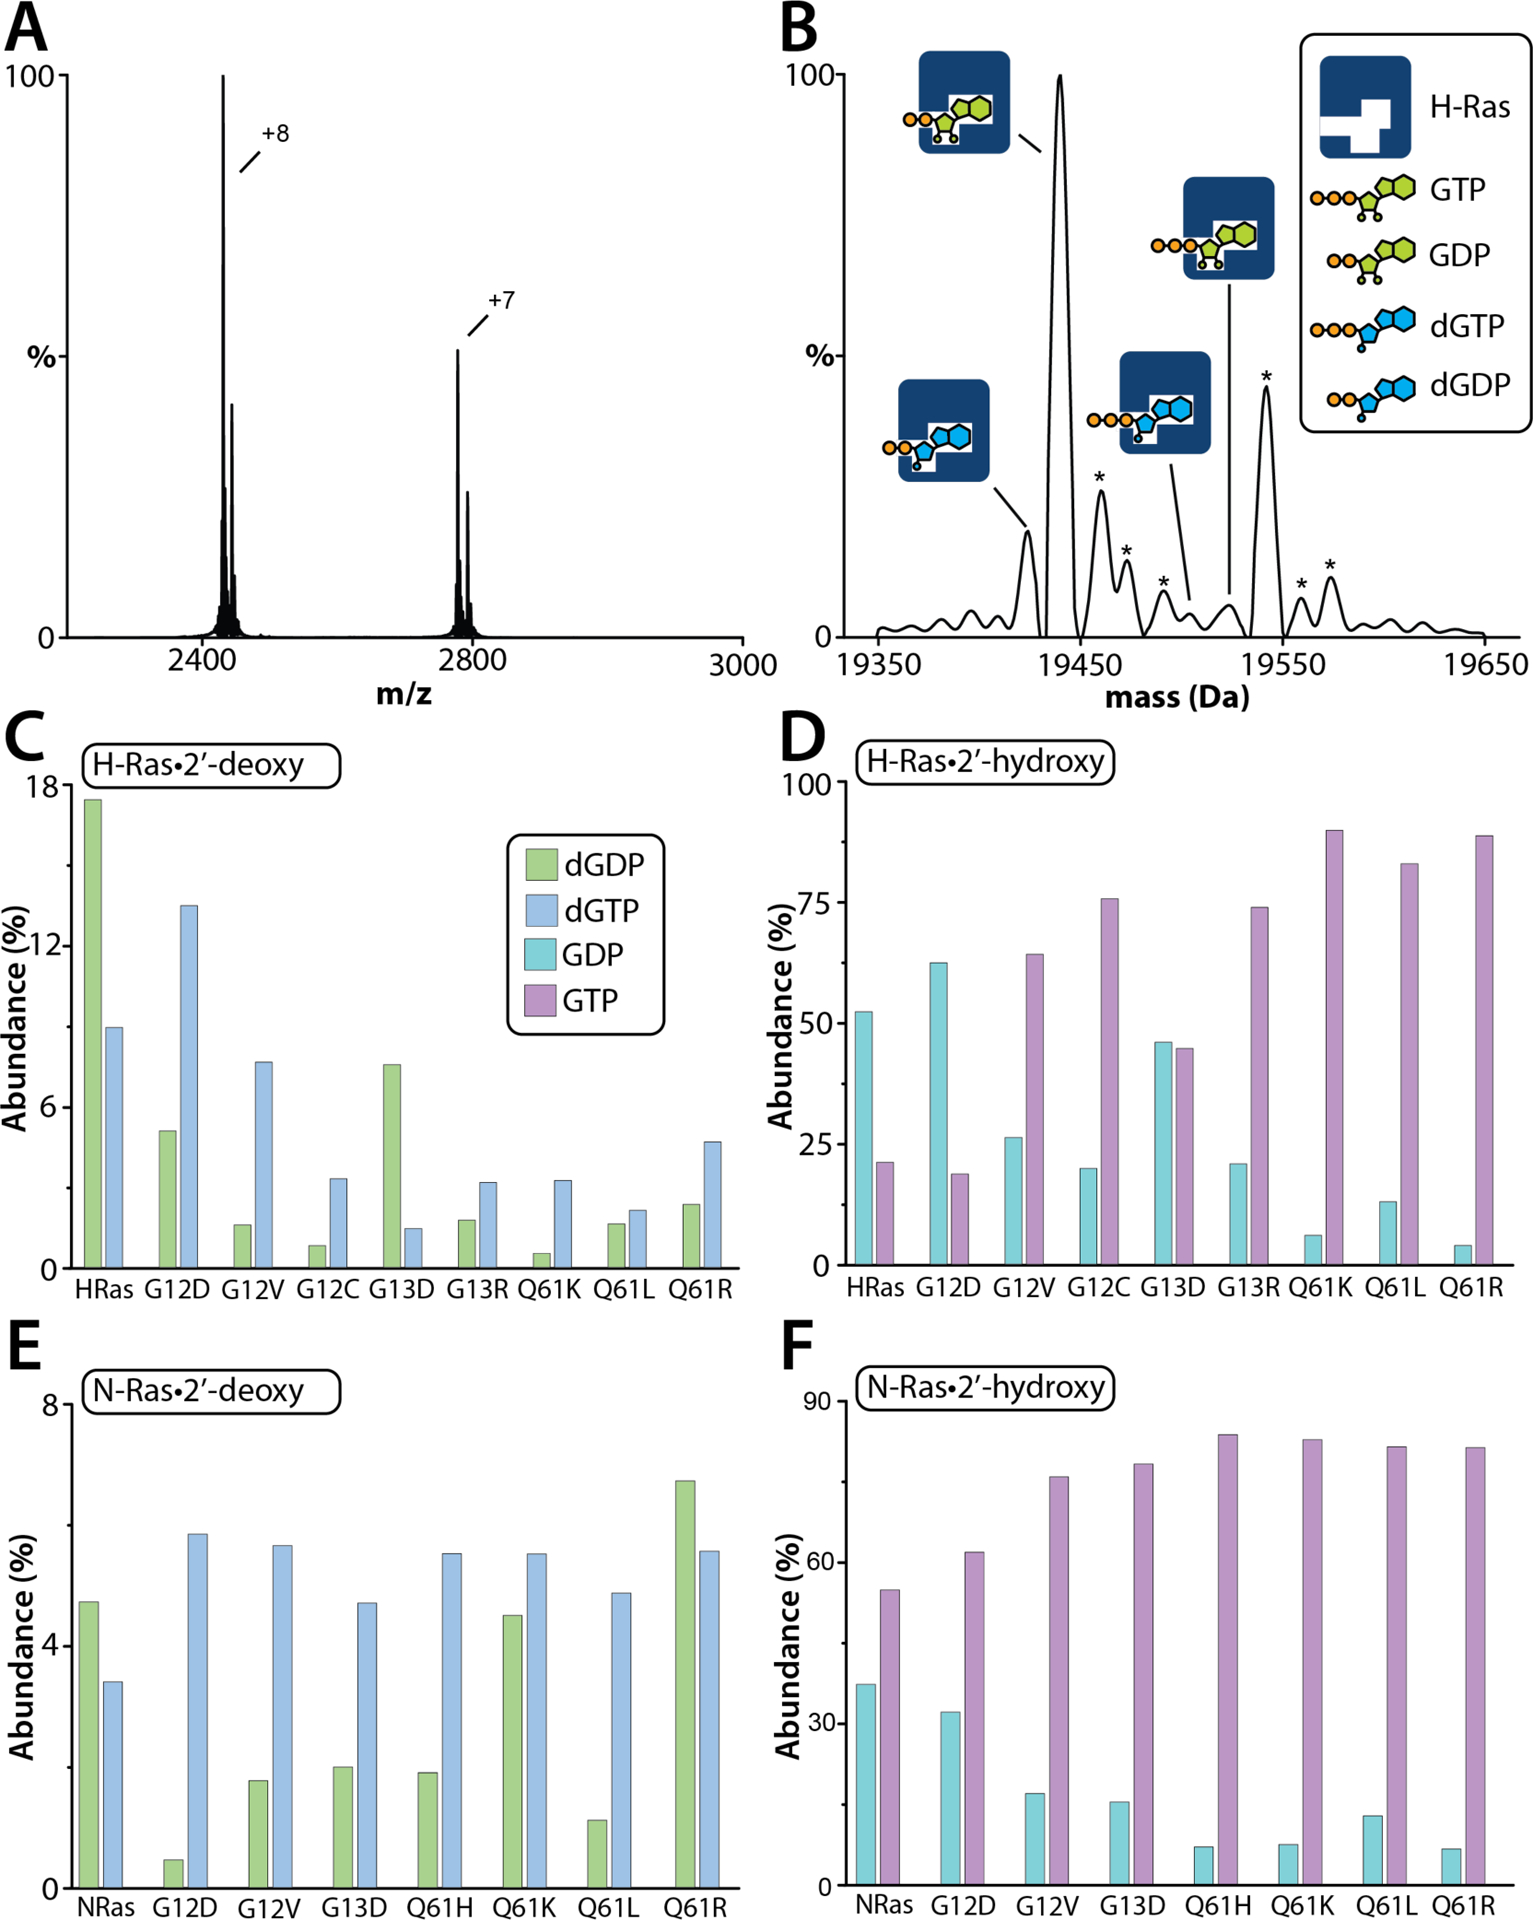
(A) Native mass spectrum of H-Ras in 200 mM ammonium acetate (pH 7.4). (B) Deconvolution of the mass spectrum shown in panel A. Different nucleotide bound Ras species are labeled. Asterisks denote sodium and/or magnesium bound adducts. (C) Mole fraction of 2’-deoxy guanosine di- and triphosphate bound to H-Ras and oncogenic mutants. (D) Mole fractions of 2’-hydroxy guanosine di- and triphosphate bound to H-Ras and oncogenic mutants. (E) Mole fraction of 2’-deoxy guanosine di- and triphosphate bound to N-Ras and oncogenic mutants. (F) Mole fractions of 2’-hydroxy guanosine di- and triphosphate bound to N-Ras and oncogenic mutants. Reported is the abundance from one measurement.
Similar results were observed for a subset of H-and N-Ras oncogenic mutants, a total of 15 (7 for H-Ras and 8 for N-Ras) that were selected based on their occurrence in cancer (Figure 1C–F).6 Specifically, oncogenic H-Ras mutants for their occurrence in head and neck squamous cell carcinomas13 and oncogenic N-Ras mutants for their occurrence in melanomas.11, 12 In general, a higher abundance of GTP and dGTP bound to the Ras mutants was observed compared to GDP and dGDP respectively (Figure 1C–F). The native mass spectra also show considerable differences in the mole fraction of dGNPs and GNPs that varied among the mutant proteins. For example, H-Ras wild type and H-RasG12D mutant had similar amounts of dGNPs and GNPs. In contrast, most of the other oncogenic H-Ras mutants had a substantial decrease in the abundance of dGNP-bound species (Figure 1C). In some instances, the mutant H-Ras proteins were mostly bound to GTP, such as H-RasQ61K-GTP (90%). Despite the high sequence similarity, N-Ras wild type and N-RasG12D did not follow the trends observed for H-Ras proteins (Figure 1E). The abundance of dGNPs bound to N-Ras wild-type and mutant proteins was around ~10%, and this value is considerably lower than that observed for H-Ras. Notably, all Q61 oncogenic mutants of N-Ras, including those for H-Ras, were primarily bound to GTP (Figure 1D and Figure 1F), a result opposite to what was observed for K-RasQ61H.27 These results suggest that each oncogenic mutant may have different affinities for dGNPs and GNPs, and nucleotide preferences are not conserved between Ras isoforms despite the same mutation.
Physiological relevance of different nucleotide bounds states.
To further elucidate the physiological relevance of these results, K-Ras proteins were expressed in HEK293 cells to evaluate the nucleotide-bound states. Notably, K-Ras proteins were co-purified with varying amounts of different nucleotides (Figure 2). K-RasWT was purified with majority of its species bound to GDP, whereas K-RasG12C was purified with majority of its species bound to GTP (Figure 2A and B). Furthermore, K-RasG12C displayed ~4-fold higher abundance of dGTP compared to the wild type (Figure 2C), which is aligned with what has been previously reported from E. coli.27 Interestingly, the overall abundance of 2’-deoxy bound K-RasWT and K-RasG12C expressed from HEK293 cells were at about 4 and 7 % respectively. This is considerably lower than what was observed for K-Ras proteins expressed and purified from bacteria with ~15% bound to dGNPs.27 Taken together, K-Ras expressed and purified from bacteria and a human cell line consistently co-purify with GNPs and dGNPs.
Figure 2. Native mass spectra reveal different guanosine nucleotides co-purifiy with K-Ras proteins purified from HEK293 cells.
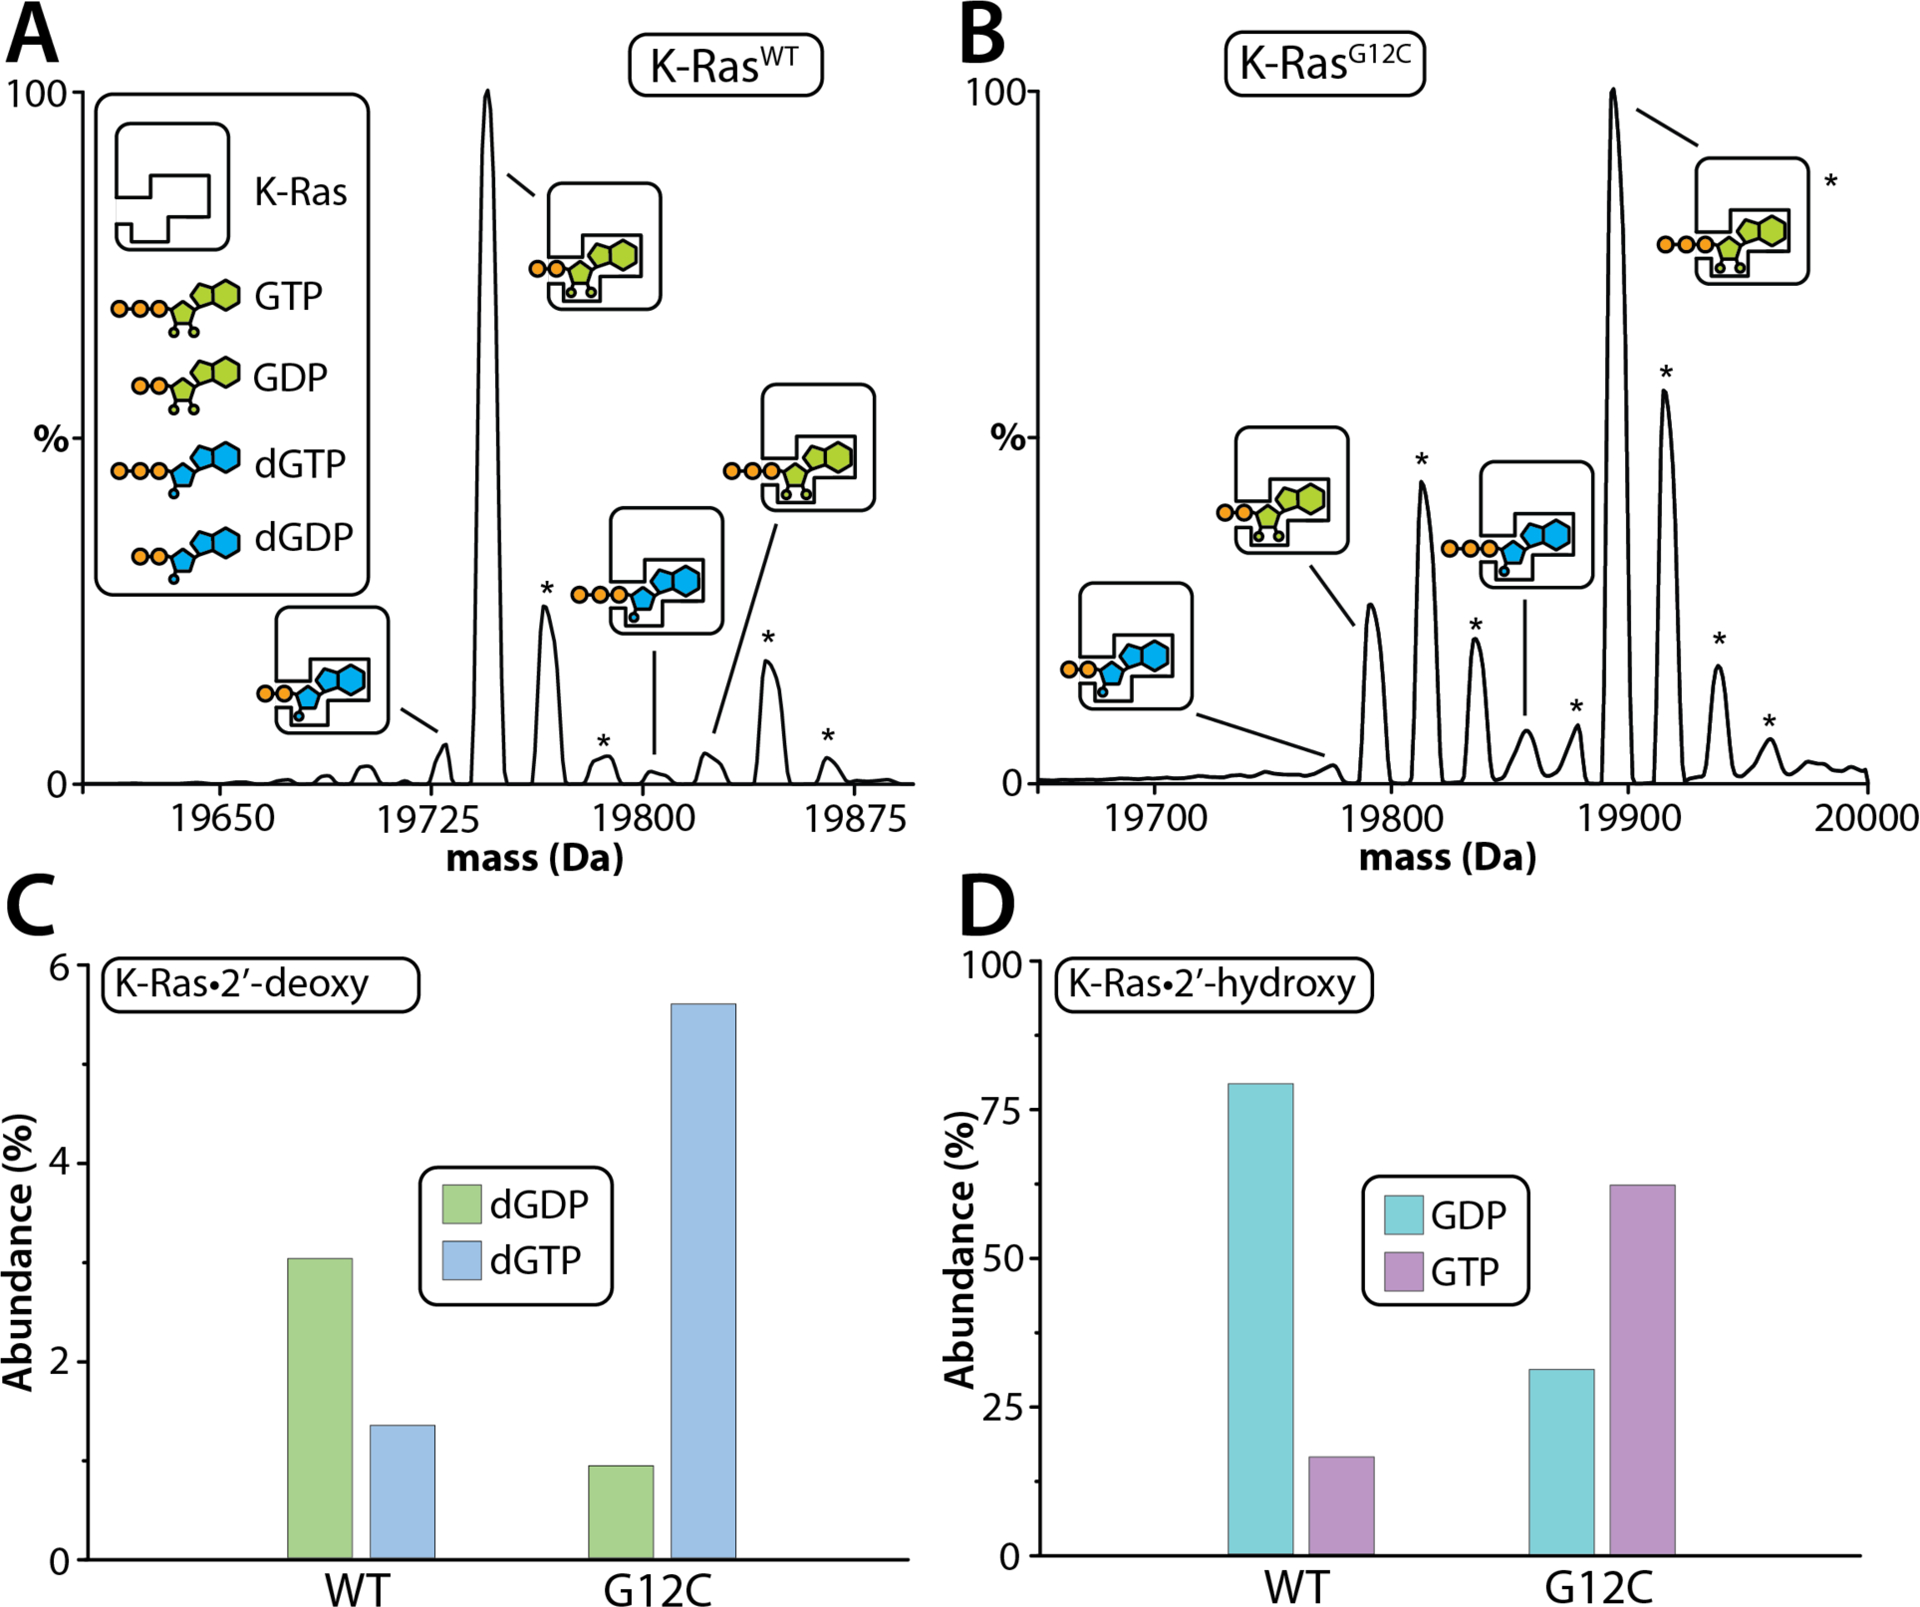
(A) Deconvolution of K-RasWT expressed from HEK293 cells in 200 mM ammonium acetate (pH 7.4). (B) Deconvolution of K-RasG12C expressed from HEK293 cells in 200 mM ammonium acetate (pH 7.4). Different nucleotide bound K-Ras species are labeled. Asterisks denote sodium and/or magnesium bound adducts. (C) Mole fraction of 2’-deoxy guanosine di- and triphosphate bound to K-Ras and the oncogenic mutant. (D) Mole fraction of 2’-hydroxy guanosine di- and triphosphate bound to K-Ras and the oncogenic mutant. Reported is the abundance from one measurement.
Intrinsic GTPase activity of H- and N-Ras and their oncogenic mutants.
The presence of different nucleotides co-purifying with the Ras proteins prompted us to characterize their intrinsic GTPase activity (Figure 3). In a similar fashion as our previous study,38 the hydrolysis of the bound GTP can directly be monitored by the loss of inorganic phosphate and the appearance of Ras bound to GDP (Figure S3A–S6A). H- and N-Ras and their oncogenic mutants were loaded with GTP or dGTP. The native mass spectra, collected after each nucleotide loading step, showed that most Ras were completely loaded with GTP or dGTP. However, some Ras proteins were not able to be loaded (up to >90%) with the intended nucleotide, despite the nucleotides being loaded three consecutive rounds (Figure S1). In these cases, the initial concentration of the dGTP- or GTP-loaded Ras was adjusted based on abundance at the start of the reaction. Several adducts consistent with the molecular weight of magnesium and/or sodium were present, and these were accounted for when deconvoluting the mass spectra. Mass spectra was acquired at different time points to determine the intrinsic GTP and dGTP hydrolysis rates (Figure S3–S6). H- and N-Ras proteins and their oncogenic mutants displayed distinct intrinsic GTPase and dGTPase activities (Figure 3). For example, H-Ras displayed faster hydrolysis of dGTP, while N-Ras displayed similar hydrolysis rates for dGTP and GTP. Interestingly, oncogenic mutants showed marked hydrolysis rates that were dependent on the bound nucleotide. H-Ras mutants G12C and G12D hydrolyzed dGTP faster compared to GTP. In contrast, the H-RasG13R mutant displayed faster hydrolysis for GTP (Figure 3A). For N-Ras, G12D was the only mutant that exhibited faster hydrolysis of dGTP and with a rate comparable to the wild-type protein (Figure 3B). Apart from N-RasQ61H, H/N-Ras with mutations at Q61 exhibited extremely slow intrinsic hydrolysis rates. These findings are consistent with K-Ras Q61H and Q61L, which also have significantly reduced intrinsic GTPase activity.10 Notably, GTPase activity of N-RasQ61H was comparable to the N-Ras, however, intrinsic dGTPase activity was significantly reduced to levels comparable to other Q61 mutants. In short, the different mutants of H-Ras and N-Ras bound to GTP or dGTP can display distinct intrinsic hydrolysis rates.
Figure 3. Intrinsic GTP and dGTP Hydrolysis rates of H-Ras, N-Ras, and their oncogenic mutants.
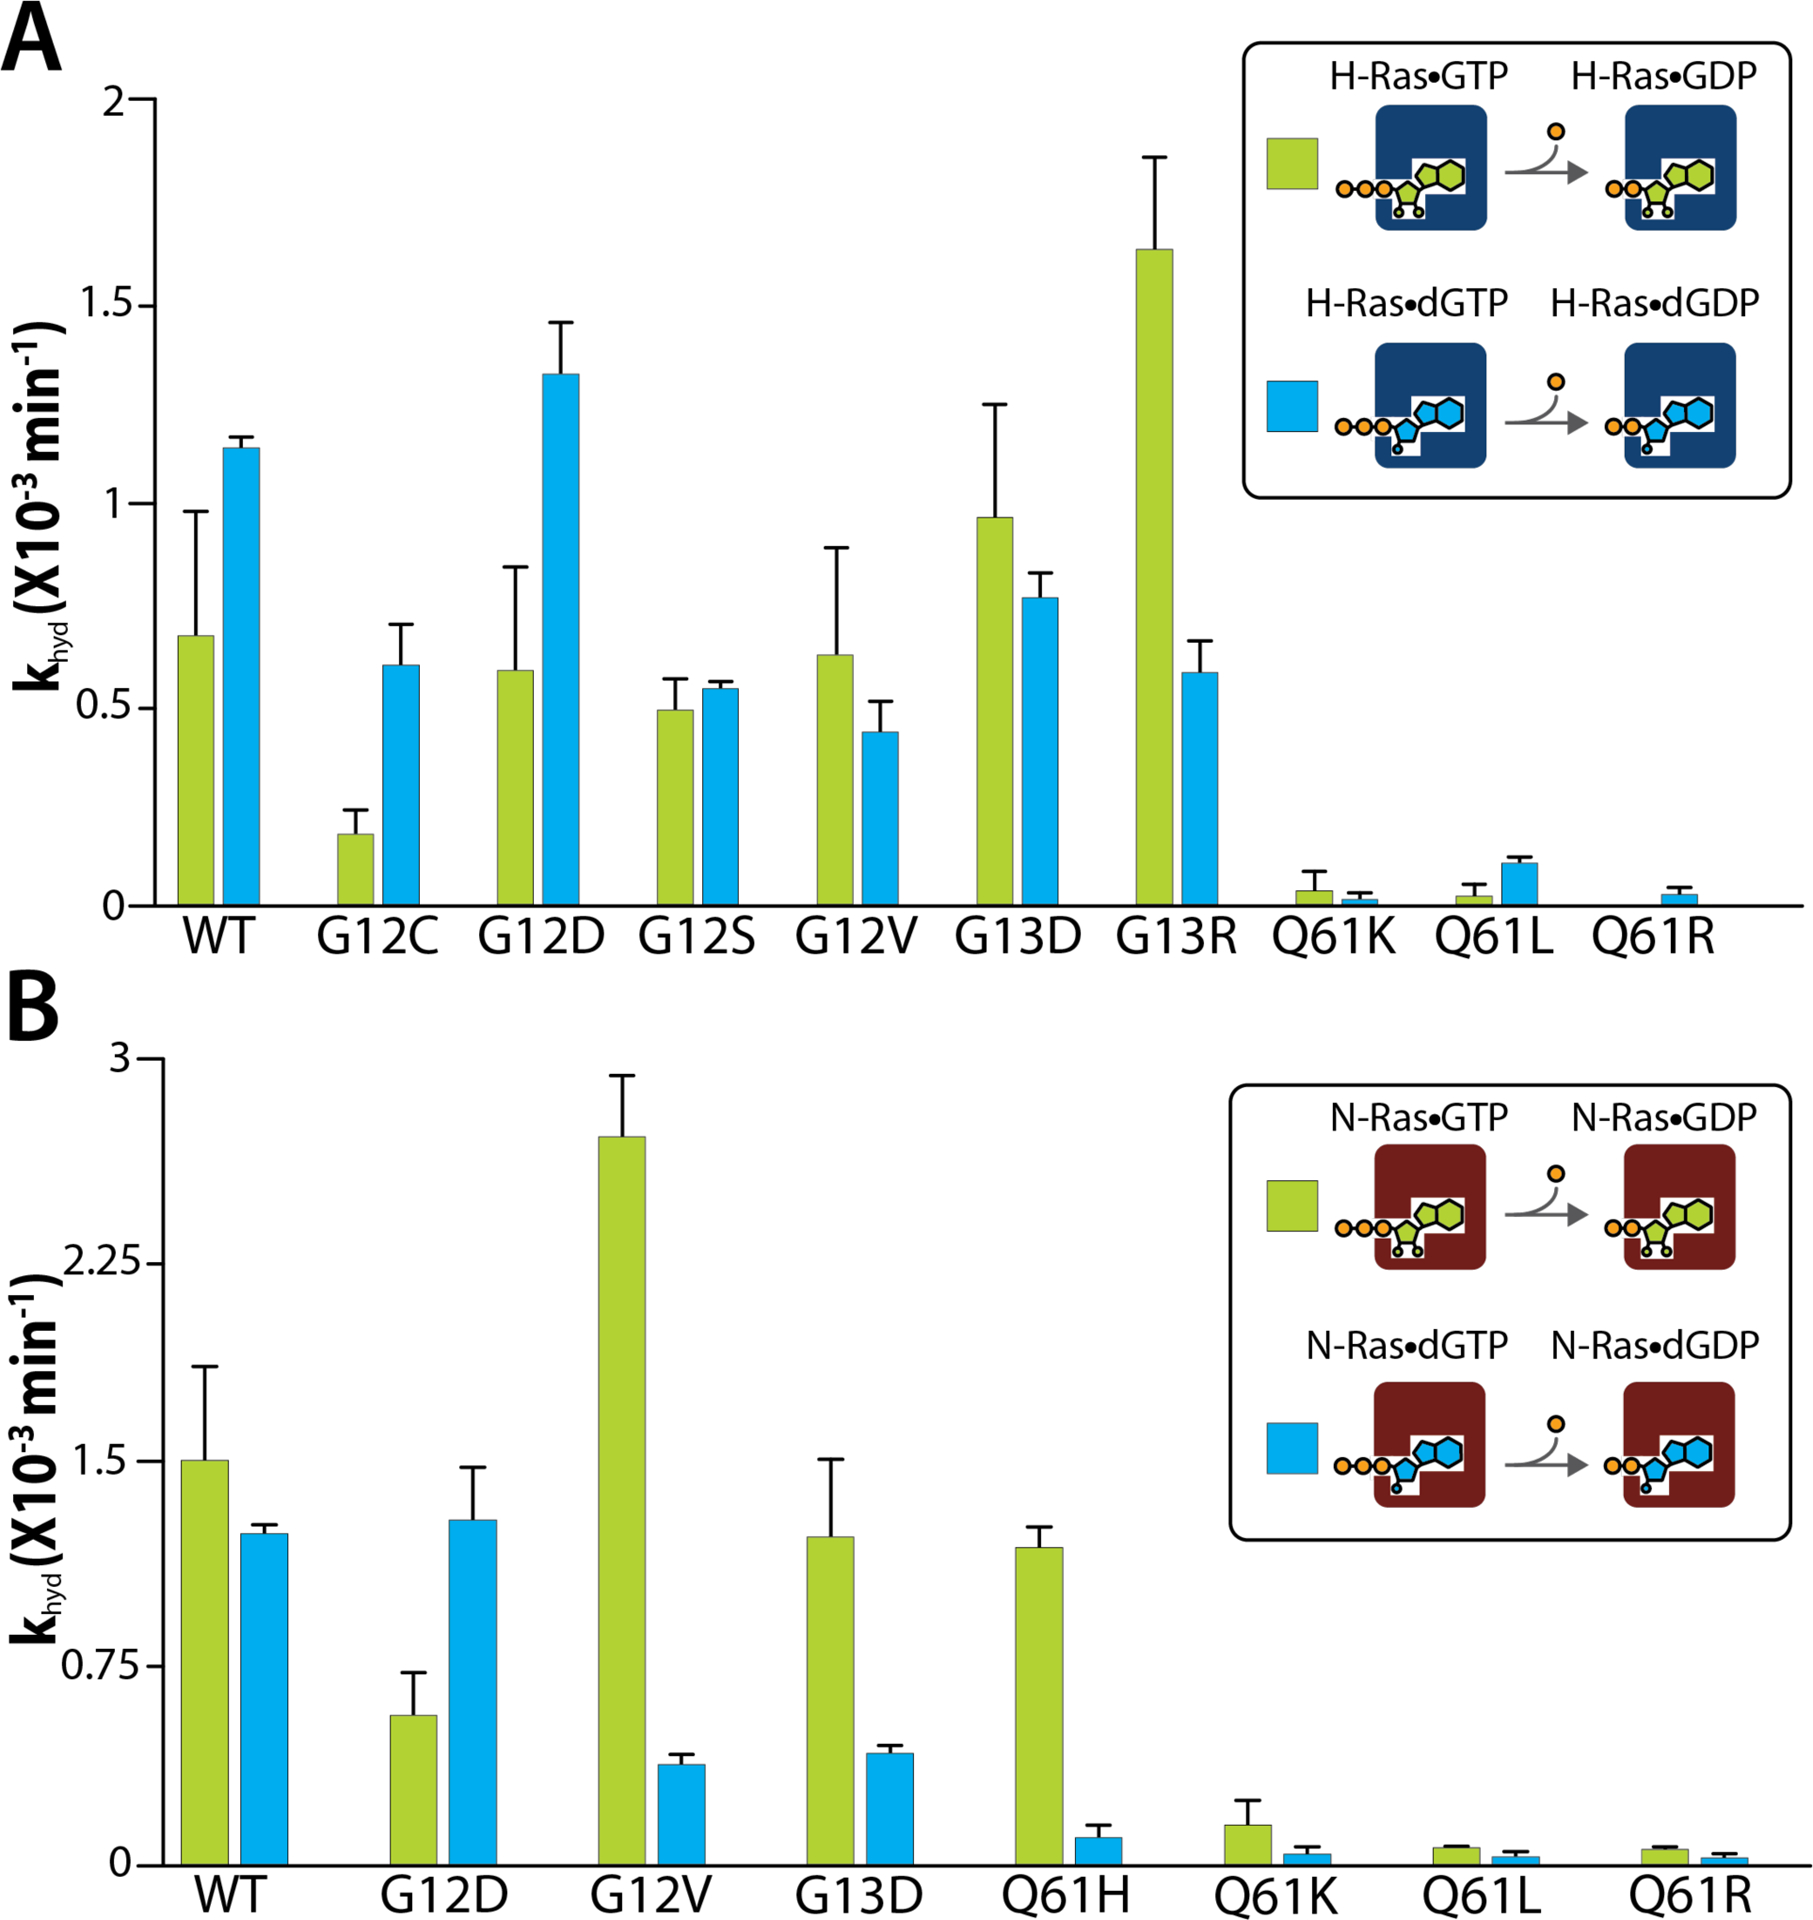
A-B) Intrinsic hydrolysis rates of GTP (green) and dGTP (blue) were determined at 25°C for A) H-Ras and B) N-Ras proteins. Reported are the mean and standard deviation (n=3).
Drugs impact on K-Ras proteins and the GTPase activity.
Recently developed FDA approved K-RasG12C inhibitors such as Sotorasib and Adagrasib have been reported to selectively bind to inactive, GDP-bound K-RasG12C inside the switch II pocket.39, 40 Native MS analysis for intrinsic hydrolysis measurement was used to monitor drug bindings to K-Ras proteins in their specific nucleotide-bound state (Figure 4 and Figure S7). In the presence of two molar equivalents of inhibitor to K-Ras , the GTP (or dGTP) bound to K-RasG12C hydrolyzed over time along with appearance of drug binding to GDP (or dGDP) bound K-RasG12C. K-RasG12C bound to GTP (or dGTP) did not bind either inhibitor, consistent with the specificity reported for the nucleotide bound state of K-RasG12C.39 It is important to note that K-RasG12C(GDP/dGDP) was completely loaded with GTP (or dGTP) at the start. In the presence of either Sotorasib or Adagrasib, the hydrolysis rate of K-RasG12C was significantly enhanced (Figure 4B and Figure S7B). More specifically, K-RasG12C displayed a 10-fold and 4-fold increase in GTPase and dGTPase activity, respectively. This enhancement in nucleotide hydrolysis was similar for both inhibitors (Figure 4D and Figure S7D). In the absence of inhibitors, K-RasG12C displayed faster intrinsic dGTPase activity, consistent with a previous report.27 However, K-RasG12C displays similar GTPase and dGTPase activities in the presence of inhibitors (Table S10), implying the stimulation of nucleotide hydrolysis is independent of the nucleotide form. However, the hydrolysis rate of wild-type K-Ras is not accelerated in the presence of inhibitors. In short, this data demonstrates that G12C inhibitors can not only covalently bind their targets but can also stimulate nucleotide hydrolysis, inactivating Ras.
Figure 4. Impact of K-RasG12C inhibitors on the intrinsic GTPase activity of K-Ras protein.
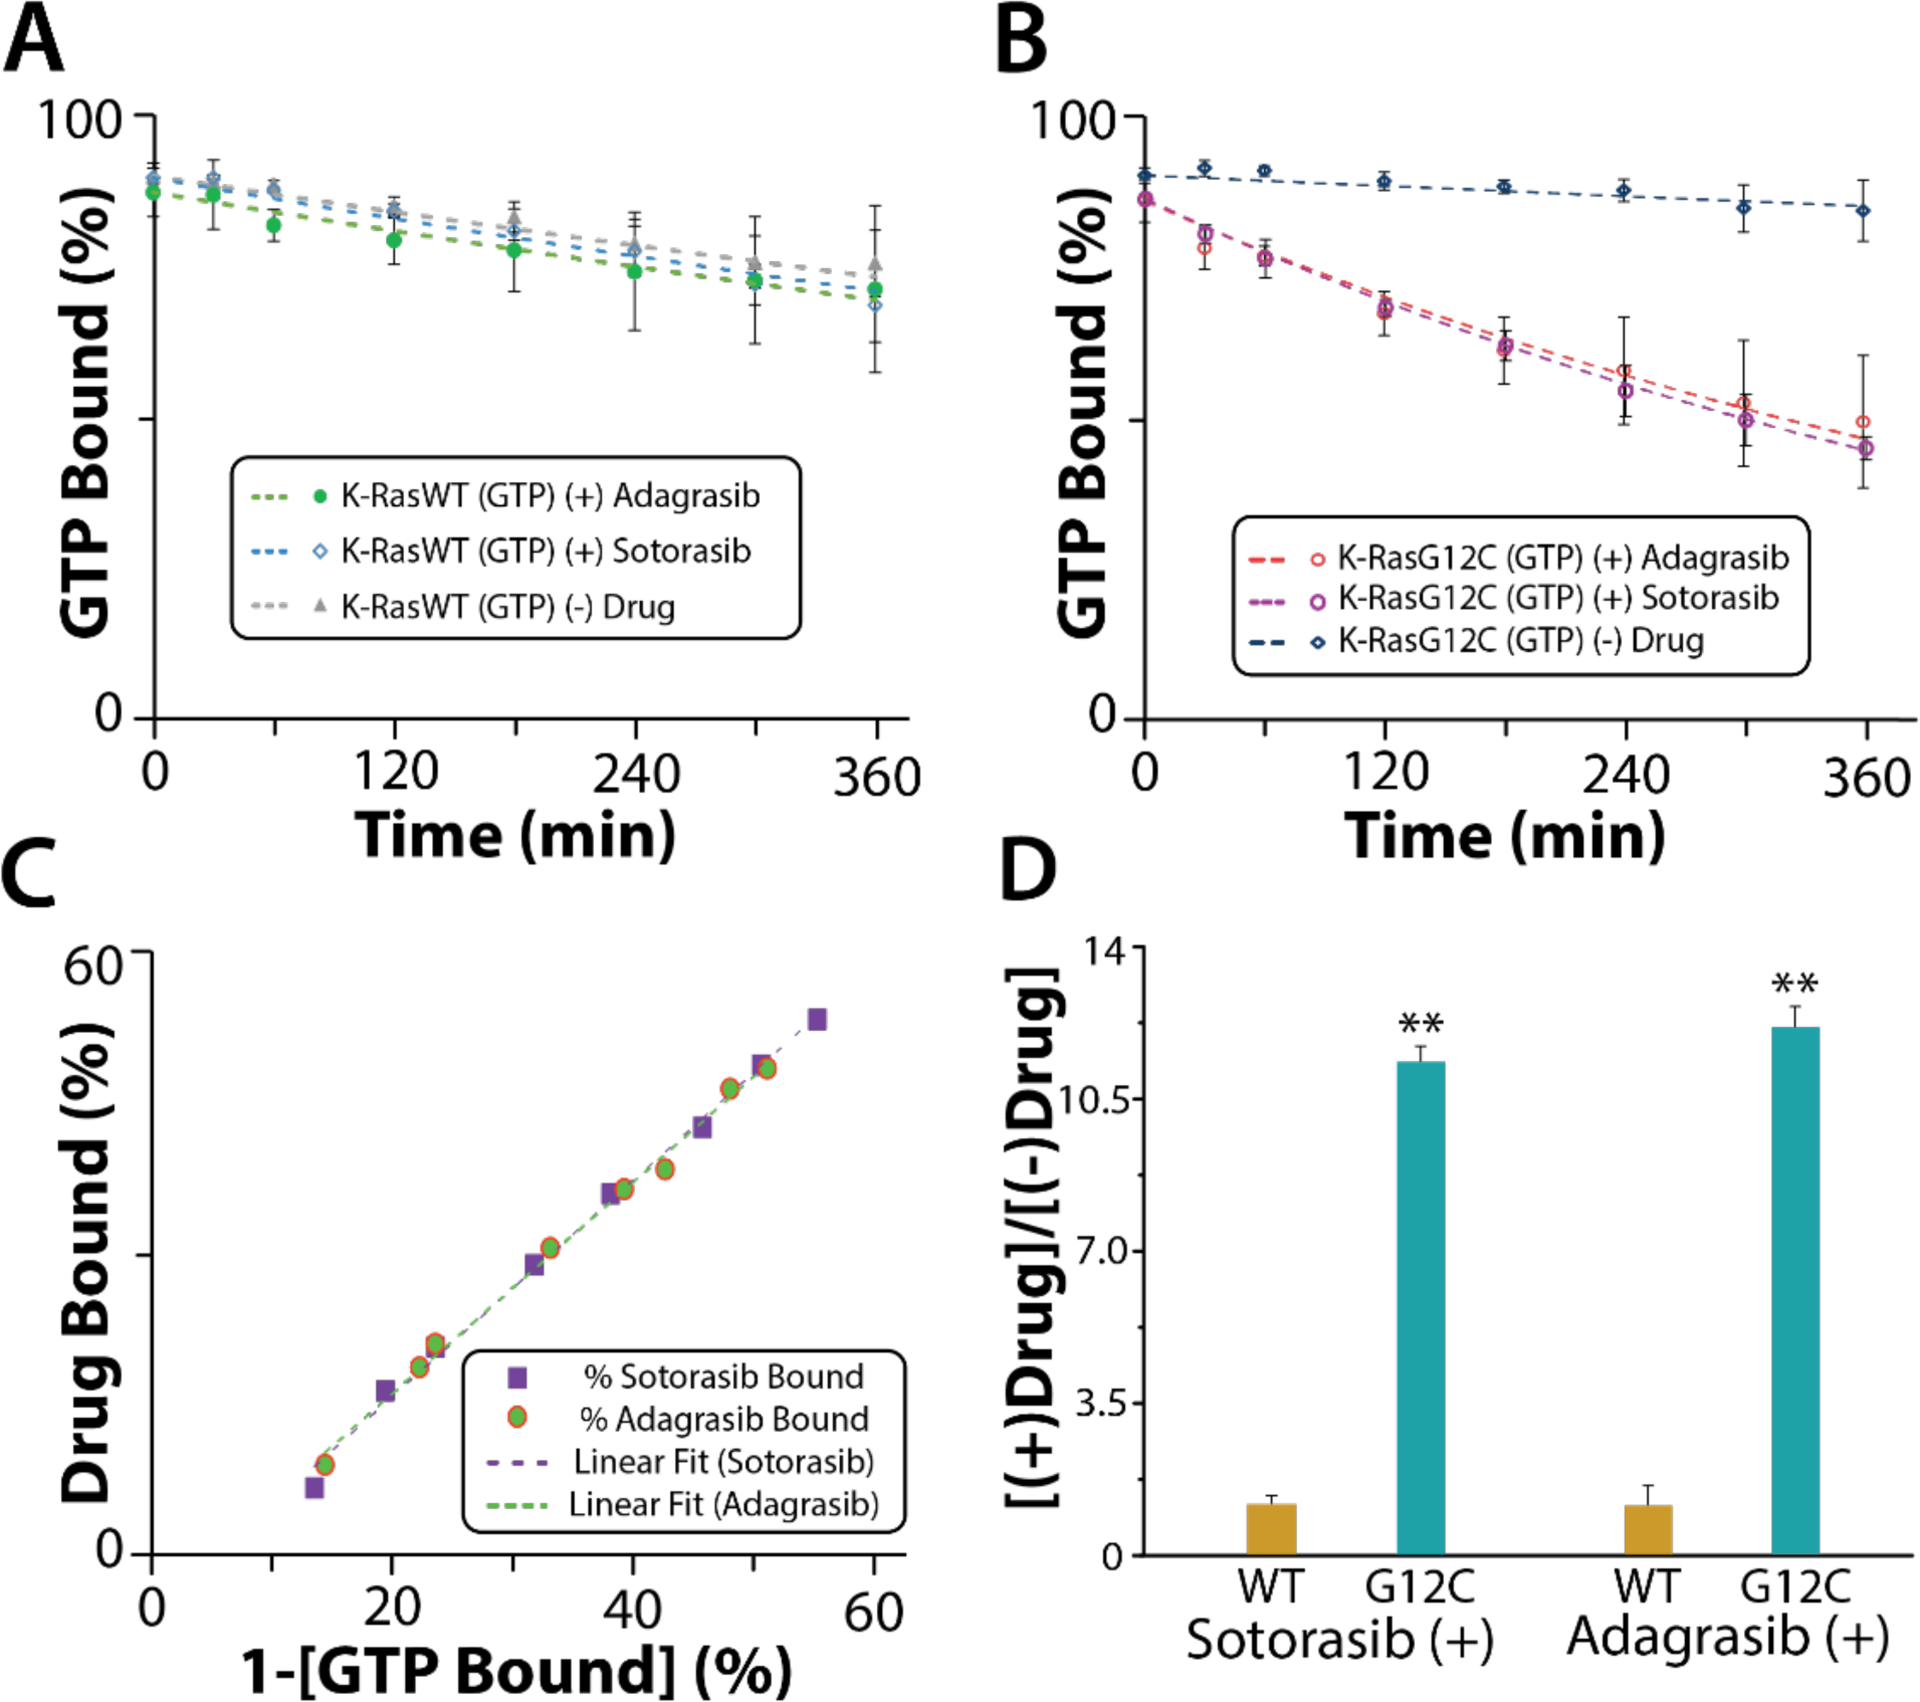
(A-B) The percentage of GTP-bound K-Ras proteins plotted over time (dots) and fit to a first-order rate constant model (line) in the presence/absence of K-RasG12C inhibitors. (C) Correlation plot of drug bound K-RasG12C vs 1-[GTP bound] K-RasG12C. R2 for linear fit (Sotorasib) is 0.99 and R2 for linear fit (Adagrasib) is 0.99. (D) Bar graph of the fold increase in GTP hydrolysis rate. One Asterisk denotes p-values <0.05 and two Asterisks denote p-values <0.01. Reported are the mean and standard deviation (n=3).
Probing H-Ras and N-Ras interactions with SOScat.
With the discovery of mutant dependent distinct interactions of K-Ras and SOScat,22 we next characterized the interaction of H-Ras proteins bound to either dGTP or GTP with SOScat. The native mass spectrum of a mixture of SOScat with three equivalents of H-Ras loaded with GTP revealed several molecular assemblies (Figure S8A). From these mass measurements we can assign a single binary complex composed of SOScat•H-Ras-GTP-Mg2+, and two ternary complexes corresponding to H-Ras•SOScat•H-Ras-GTP-Mg2+(GDP)0–1 with about 11% being bound to GDP (Figure 5A and S8A). Despite H-Ras being predominantly loaded with GTP, the abundance of H-Ras bound to GDP is consistent with results observed for K-Ras and its oncogenic mutants, in which SOScat stimulated GTPase activity.22 H-RasG13D largely formed a ternary complex with no GDP bound (Figure 5A), which is consistent with that observed for K-RasG13D.22 Most interestingly, while H-RasQ61L was loaded with GTP (>90%), significant abundance of GDP-bound H-RasQ61L in the ternary complex is observed. This result is perplexing as the intrinsic GTPase activity of H-RasQ61L is extremely slow, which cannot account for the abundance of GDP observed after a short incubation period. For the most part H-Ras mutants formed relatively equal abundances of ternary complexes and at levels comparable to H-Ras (Figure 5A). H-Ras G12C and Q61L mutants displayed similar affinities for SOScat as H-Ras, i.e. similar abundances of SOScat. H-RasG13D was the only mutant displaying an enhanced affinity for SOScat as evident by depletion of signal for SOScat. The majority of H-Ras mutants, including the wild-type protein, loaded with dGTP predominantly displayed ternary complexes not bound to dGDP (Figure 5D). In some cases, the affinity of dGTP-loaded proteins to SOScat decreased as evident by an increase in signal for SOScat, such as for H-RasQ61L.
Figure 5. Guanosine nucleotides influence the complexes formed between H-Ras and oncogenic mutants with SOScat.
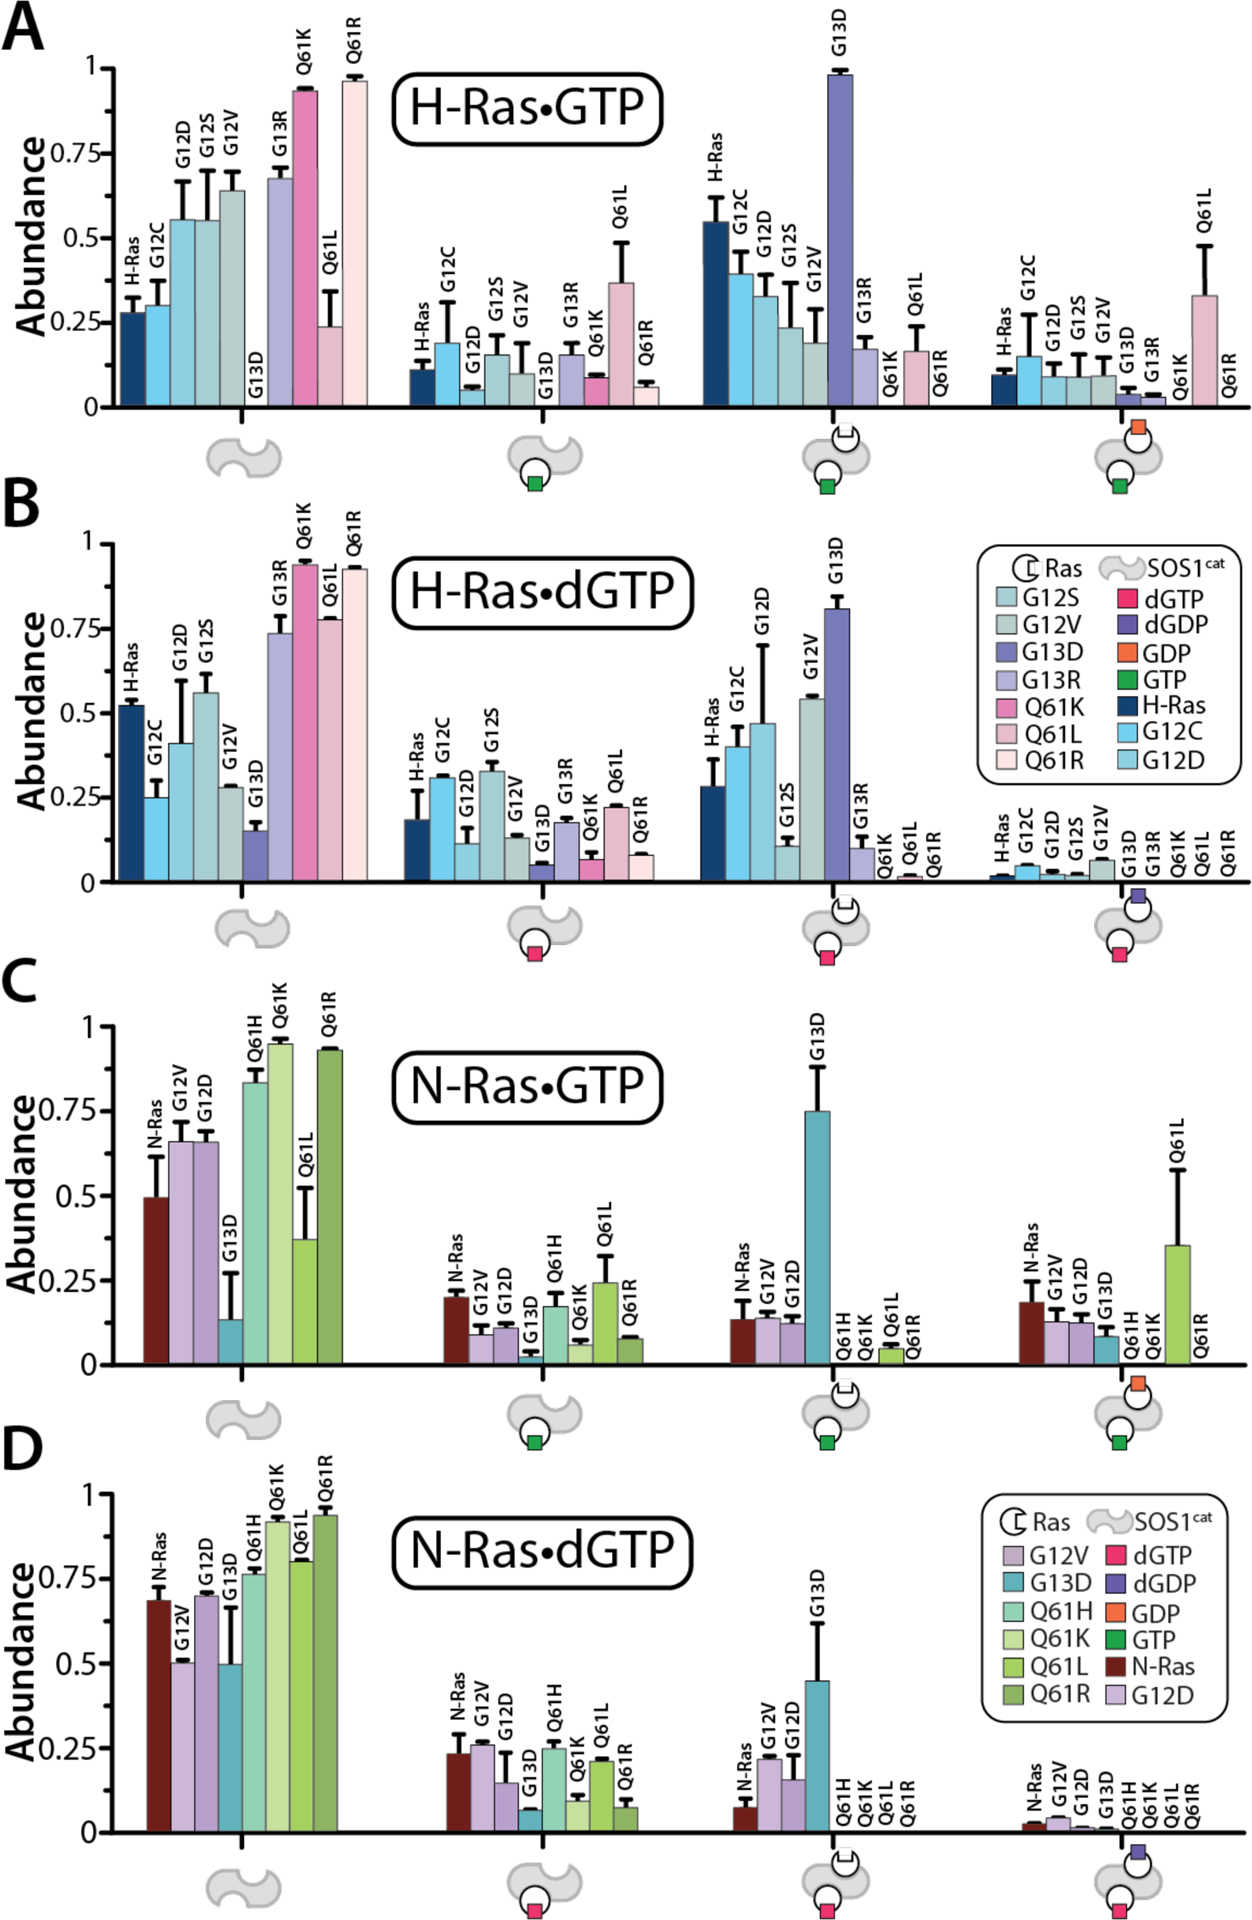
A) Mole fraction of SOScat and complexes with H-Ras and oncogenic mutants loaded with GTP. B) Shown as described for C but with H-Ras proteins loaded with dGTP. C) Mole fraction of SOScat and complexes with N-Ras and oncogenic mutants loaded with GTP. D) Shown as described for E but with N-Ras proteins loaded with dGTP. Reported are the mean and standard deviation (n=3).
We also examined the complexes formed between SOScat and N-Ras proteins loaded with either GTP or dGTP. Analogous experiments were performed as described for H-Ras. Compared to N-Ras, N-RasG13D loaded with GTP robustly engages SOScat forming mainly a ternary complex not bound to GDP (Figure 5). In contrast, N-RasQ61L mostly formed a ternary complex bound to GDP and distinct among the Q61 mutants investigated (Figure 5A and 5C). Again, the GTPase activity of N-RasQ61L is too slow to account for the abundance of GDP in the complex. Like H-Ras proteins, N-Ras proteins loaded with dGTP showed an overall decrease in affinity for SOScat (Figure 5D). Interestingly, dGTP-loaded N-RasG13D lead to a substantial reduction in complexes with SOScat, whereas H-RasG13D binding was less impacted by the type of nucleotide bound to the protein. More generally, the ratios of the two ternary complexes composed of either (GDP)0–1 or (dGDP)0–1 were different for H- and N-Ras and their oncogenic mutants. In summary, the type of nucleotide (GTP or dGTP) bound to H- and N-Ras influences the affinity and complexes formed with SOScat.
The result that H- and N-RasQ61L bound to dGTP resulted in a complete loss of ternary complex prompted additional studies. We first investigated complexes formed with SOScat containing the W729E mutation, a mutation that abolishes Ras binding at the allosteric site of SOScat.18 A mixture of H-RasQ61L and SOScat,W729E showed an absence of a binary complex (Figure S9B and S10B), confirming the binding of dGTP-RasQ61L at the allosteric site. We also tested if the addition of GDP-RasQ61L to a mixture of dGTP-RasQ61L and wild-type SOScat would lead to the formation of ternary complexes. Interestingly, a ternary complex appeared (Figure S9C and S10C), and the deconvolution of the mass spectrum revealed that the ternary complex is almost fully comprised of H-RasQ61L•SOScat•H-RasQ61L-dGTP-Mg2+(GDP)1 (Figure S9D and Figure S10D). In short, the lack of H-RasQ61L to hydrolyze dGTP, which differs from GTP, consequently prevented it from forming ternary complexes.
Discussion
2’-deoxy guanosine nucleotides co-purifying with H/N-Ras.
Native mass spectra of H- and N-Ras and their oncogenic mutants reveal that varying population of these proteins co-purify with different guanosine nucleotides. Previous reports have shown that K-Ras and a subset oncogenic mutants also co-purify with 2’-deoxy guanosine nucleotides.27, 41 Ras proteins were expressed and purified from bacteria, where the concentration of GTP in E. coli is 18-fold higher than that of dGTP, i.e. dGTP represents ~6% of the total guanosine triphosphate nucleotide pool.42 This difference can partially explain the small fraction of protein co-purifying with dGNP molecules. However, in some cases the percentage co-purifying is much higher than anticipated, such as for H-Ras where a quarter is bound to dGNP. More specifically, H-RasWT and H-RasG12D exhibited a significantly higher 2’-deoxy guanosine nucleotide population compared to the other H- and N-Ras proteins. Interestingly, the most abundant 2’-deoxy guanosine nucleotide species bound to H-RasWT was dGDP. In contrast, dGTP was the most abundant 2’-deoxy guanosine nucleotide species bound to H-RasG12D (Figure 1C). Taken together, the results imply that Ras, including mutants, have different affinities for dGNP and GNP.
2’-deoxy guanosine nucleotides co-purifying with K-Ras in HEK293 cells.
The nucleotides co-purified for Ras produced in bacteria prompted us to investigate protein expressed and purified from a human cell line to better understand the physiological relevance of 2’-deoxy guanosine in Ras activation. K-RasWT and K-RasG12C were expressed in HEK293 cells, where the concentration of GTP in human cells is 100 to 2000-fold higher than that of dGTP depending on the level of cell proliferation.43, 44 The ratio of GTP to dGTP in human cells is significantly higher than what is found in bacteria, which in part, explains the overall lower abundance of dGNP bound to K-Ras proteins expressed and purified from HEK293 cells. However, for both K-RasWT and K-RasG12C, a higher than anticipated fraction of dGNP-bound K-Ras proteins was observed when considering the nucleotide pool (Figure 2C). This is very interesting because HEK293 cells expressing K-Ras were induced at full confluency, and the ratio of GTP/dGTP has been reported to increase as cell culture becomes more confluent. For example, fully confluent human fibroblast has GTP/dGTP ratio of 2000.43 It is anticipated in the tumor cells, where dGTP concentration is ~5-fold higher, overall abundance of dGNP-bound K-Ras will inevitably be higher than the normal cells.44 Moreover, K-RasG12C exhibited ~2-fold higher abundance of dGNP than the wild-type protein (Figure 2C), indicating oncogenic mutations can enhance the affinity toward dGNP. The most abundant 2’-deoxy guanosine nucleotide species bound to K-RasG12C was dGTP, which is aligned with the previously reported data from E. coli.27 Taken together, the results indicate that K-Ras proteins and its mutant can co-purify with dGNPs, despite the extreme difference in the GNP/dGNP ratio, providing support to the physiological importance of dGNP.
Intrinsic GTPase and dGTPase activity of H- and N-Ras and their oncogenic mutants.
The fact that H-Ras, K-Ras, and N-Ras, including their mutant forms, co-purify with different nucleotides inspired us to determine intrinsic GTPase and dGTPase activities (Figure 3). Notably, the previous notion of the oncogenic mutants having a slower intrinsic GTPase activities than wild type7–10 was not consistently observed. This discrepancy can in part be rationalized if the proteins are bound to different nucleotides, which can impact hydrolysis rates as we report here. Native mass spectrometry provides powerful means to discern the nucleotide-bound state and, furthermore, directly monitor intrinsic hydrolysis by observing a loss in mass of inorganic phosphate. Importantly, we have observed that some mutants of Ras such as G12D and G12V are not able to be fully loaded with GTP (Figure S1). Although the inability to fully load can be problematic for some assays, native MS abrogates this issue by the ability to determine the fraction of Ras bound to different nucleotides.
Interestingly, some oncogenic mutants of H/N-Ras showed drastic differences between GTPase and dGTPase activities. For example, the most drastic differences for intrinsic hydrolysis rates correspond to N-RasG12V and N-RasQ61H that displayed ~7-fold faster GTPase activity compared to that for dGTP, respectively. Furthermore, intrinsic dGTPase activity of H-RasG12D and N-RasG12D is enhanced compared to the hydrolysis of GTP. Notably, N-RasQ61H was the only Q61 mutant that displayed GTPase activity that was comparable to the wild-type protein. The intrinsic hydrolysis rates for K-Ras and three oncogenic K-Ras mutants exhibited faster dGTPase activities.27 Here, only a subset of H- and N-Ras mutants followed this trend (Figure 3). More specifically, some mutants displayed a consistent trend between isoforms. In specific, H-RasG12D and N-RasG12D both displayed faster dGTPase activities. Likewise, H-RasG12C exhibited faster dGTPase activity, which is consistent with what is reported for K-RasG12C.22 On the other hand, some Ras proteins displayed isoform-independent intrinsic activities. For example, H-RasG13D displayed similar GTPase and dGTPase activities, while N-RasG13D had a faster GTPase activity. However, K-RasG13D is reported to have faster dGTPase activity.22 Thus, the three Ras isoforms with the G13D mutation have distinct GTPase and dGTPase activities. Taken together, the intrinsic hydrolysis rates of GTP and dGTP are distinct to the oncogenic mutant and, in some cases, specific to the Ras isoform.
Impact of drugs on K-Ras proteins and hydrolysis rates.
Recent developments of the FDA approved K-RasG12C inhibitors (Sotorasib and Adagrasib) have opened a new approach to inhibit Ras-driven cancers.39, 40 K-Ras loaded with GTP/dGTP showed no drug binding, which is consistent with the inhibitors inability to bind the active conformation of Ras.39 Interestingly, K-RasG12C displayed enhanced hydrolysis rates in the presence of inhibitors but not for the wild-type protein (Figure 4B and Figure S7B). The inhibitors are known to bind to the Switch-II pocket of Ras,39 and this interaction may stimulate nucleotide hydrolysis. Although the specific mechanism of stimulation is unclear, we observe that drug binding to K-RasG12C is limited by the hydrolysis of GTP. These results suggest small molecules may be developed to accelerate Ras hydrolysis rates, potentially serving as Pan-Ras inhibitors.
Molecular assemblies of H-Ras and N-Ras bound to GTP or dGTP with SOScat.
Native mass spectrometry captures the molecular assemblies formed between SOScat and H/N-Ras and their oncogenic mutants. For example, H-Ras formed a ternary complex with SOScat and bound to GDP, despite being loaded with GTP (>90%) (Figure 5A and Figure 5C). Mutations at the G12 position of N-Ras did not impact the complexes formed with SOScat (Figure 5C). On the other hand, G12 mutants of H-Ras altered the abundance of ternary complexes along with an increased abundance of free SOScat species (Figure 5A). Interestingly, H/N-RasG13D predominantly formed a GDP-free ternary complex (Figure 5A and Figure 5C), a result that is consistent with that observed for K-RasG13D.22 Isoforms of Ras containing the G13D mutation robustly engage SOScat. The H-RasG13R mutant also displayed a higher ratio of a GDP-free ternary complex, but to a lesser extent compared to H-RasG13D. A previous study showed K-RasQ61H does not form ternary complexes with SOScat.22 Except for Q61L, H/N-Ras Q61 mutants also did not form any ternary complexes. Interestingly, Q61L mutant not only formed a ternary complex but also displayed a uniquely high abundance of GDP bound in the complex (Figure 5A and Figure 5C). These findings establish that Q61L mutants can indeed form complexes with SOScat. Taken together, isoforms of Ras and oncogenic mutants form complexes with SOScat that vary in abundance.
Ras proteins loaded with dGTP formed complexes with SOScat that differed in stoichiometry and abundance compared to those loaded with GTP. In general, the ratio of (dGDP)0 and (dGDP)1 in ternary complexes was shifted to favor those being dGDP-free complexes (Figure 5B and Figure 5D). This is in part can be explained by the reduced intrinsic dGTP hydrolysis rates for some mutants. Some oncogenic Ras proteins were not able to be loaded with dGTP (>90%) upon repeated loading procedures. However, when these proteins were partially loaded with dGTP and mixed with SOScat they formed higher abundances of dGDP-bound ternary complexes. Interestingly, H- and N-RasQ61L loaded with dGTP did not form ternary complexes with SOScat. This drastic shift in molecular stoichiometry suggests that the binding of dGTP-RasQ61L with SOScat alters the specificity at the active site of SOScat. The mutant SOScat,W729E shows dGTP-RasQ61L binds at the allosteric site (Figure S9B and S10B). Furthermore, the addition of GDP-RasQ61L demonstrates the binary complex of dGTP-RasQ61L and SOScat can bind Ras at the active site (Figure S9C–S10C). Therefore, the lack of ternary complex formation for dGTP-RasQ61L could be explained through the loss of affinity of dGDP-RasQ61L at the active site of SOScat. In summary, dGTP-bound Ras proteins form different complexes with SOScat and RasQ61L appears to enhance the selectivity of binding at the active site of SOScat.
In summary, H- and N-Ras proteins and their oncogenic mutations were found to co-purify with GNPs and dGNPs. Similarly, K-Ras proteins expressed and purified from HEK293 cells also co-purified with a mixture nucleotides. This result is unexpected given the reported cellular ratio of NTP to dNTP. Moreover, the intrinsic GTPase and dGTPase activities of Ras proteins displayed differences in hydrolysis rates that was dependent on the form of the nucleotide. Interestingly, the covalent inhibitors, Sotorasib and Adagrasib, were found to accelerate the intrinsic hydrolysis rates of K-RasG12C. We also show complexes formed between H- and N-Ras proteins and SOScat are influenced by the form of nucleotide bound to Ras. For example, Q61L mutants display reduced affinity toward SOScat when bound to dGDP. In short, dGNPs can not only impact the biochemical properties of Ras proteins, but also influence their interactions with SOScat.
Supplementary Material
Acknowledgements
This work was supported by Welch Foundation (A-2106-20220331) and NIH (R01GM139876 and RM1GM1454316) awarded to A.L., and instrumentation support from NIH (P41GM128577).
Footnotes
The authors declare no potential conflicts of interest
Supporting Information.
Supporting information contains: Deconvoluted mass spectra of K-, H-, N-Ras and its mutants, native mass spectra of Ras proteins and SOScat complexes, optimized parameters for native MS analysis, Intrinsic hydrolysis rates with and without drugs, and table of mole fraction of nucleotides co-purified with Ras proteins.
Disclosure of Potential Conflicts of Interests
No potential conflicts of interest were disclosed.
Availability of Data and Materials
The data generated in this study are available within the article and its supplementary data files.
References
- 1.Colicelli J, Human RAS superfamily proteins and related GTPases. Sci STKE 2004, 2004 (250), RE13. [DOI] [PMC free article] [PubMed] [Google Scholar]
- 2.Goitre L; Trapani E; Trabalzini L; Retta SF, The Ras superfamily of small GTPases: the unlocked secrets. Methods Mol Biol 2014, 1120, 1–18. [DOI] [PubMed] [Google Scholar]
- 3.Downward J, Targeting RAS signalling pathways in cancer therapy. Nat Rev Cancer 2003, 3 (1), 11–22. [DOI] [PubMed] [Google Scholar]
- 4.Hobbs GA; Der CJ; Rossman KL, RAS isoforms and mutations in cancer at a glance. J Cell Sci 2016, 129 (7), 1287–1292. [DOI] [PMC free article] [PubMed] [Google Scholar]
- 5.Bryant KL; Mancias JD; Kimmelman AC; Der CJ, KRAS: feeding pancreatic cancer proliferation. Trends Biochem Sci 2014, 39 (2), 91–100. [DOI] [PMC free article] [PubMed] [Google Scholar]
- 6.Prior IA; Lewis PD; Mattos C, A comprehensive survey of Ras mutations in cancer. Cancer Res 2012, 72 (10), 2457–67. [DOI] [PMC free article] [PubMed] [Google Scholar]
- 7.Cox AD; Fesik SW; Kimmelman AC; Luo J; Der CJ, Drugging the undruggable RAS: Mission possible? Nat Rev Drug Discov 2014, 13 (11), 828–51. [DOI] [PMC free article] [PubMed] [Google Scholar]
- 8.Li S; Balmain A; Counter CM, A model for RAS mutation patterns in cancers: finding the sweet spot. Nature Reviews Cancer 2018, 18 (12), 767–777. [DOI] [PubMed] [Google Scholar]
- 9.Miller MS; Miller LD, RAS Mutations and Oncogenesis: Not all RAS Mutations are Created Equally. Front Genet 2011, 2, 100. [DOI] [PMC free article] [PubMed] [Google Scholar]
- 10.Hunter JC; Manandhar A; Carrasco MA; Gurbani D; Gondi S; Westover KD, Biochemical and Structural Analysis of Common Cancer-Associated KRAS Mutations. Mol Cancer Res 2015, 13 (9), 1325–1335. [DOI] [PubMed] [Google Scholar]
- 11.Fernandez-Medarde A; Santos E, Ras in cancer and developmental diseases. Genes Cancer 2011, 2 (3), 344–58. [DOI] [PMC free article] [PubMed] [Google Scholar]
- 12.Stephen AG; Esposito D; Bagni RK; McCormick F, Dragging ras back in the ring. Cancer Cell 2014, 25 (3), 272–81. [DOI] [PubMed] [Google Scholar]
- 13.Moore AR; Rosenberg SC; McCormick F; Malek S, RAS-targeted therapies: is the undruggable drugged? Nat Rev Drug Discov 2020, 19 (8), 533–552. [DOI] [PMC free article] [PubMed] [Google Scholar]
- 14.Vetter IR; Wittinghofer A, The guanine nucleotide-binding switch in three dimensions. Science 2001, 294 (5545), 1299–304. [DOI] [PubMed] [Google Scholar]
- 15.Milburn MV; Tong L; deVos AM; Brunger A; Yamaizumi Z; Nishimura S; Kim SH, Molecular switch for signal transduction: structural differences between active and inactive forms of protooncogenic ras proteins. Science 1990, 247 (4945), 939–45. [DOI] [PubMed] [Google Scholar]
- 16.Vigil D; Cherfils J; Rossman KL; Der CJ, Ras superfamily GEFs and GAPs: validated and tractable targets for cancer therapy? Nat Rev Cancer 2010, 10 (12), 842–57. [DOI] [PMC free article] [PubMed] [Google Scholar]
- 17.Margarit SM; Sondermann H; Hall BE; Nagar B; Hoelz A; Pirruccello M; Bar-Sagi D; Kuriyan J, Structural evidence for feedback activation by Ras.GTP of the Ras-specific nucleotide exchange factor SOS. Cell 2003, 112 (5), 685–95. [DOI] [PubMed] [Google Scholar]
- 18.Sondermann H; Soisson SM; Boykevisch S; Yang S-S; Bar-Sagi D; Kuriyan J, Structural Analysis of Autoinhibition in the Ras Activator Son of Sevenless. Cell 2004, 119 (3), 393–405. [DOI] [PubMed] [Google Scholar]
- 19.Vo U; Vajpai N; Flavell L; Bobby R; Breeze AL; Embrey KJ; Golovanov AP, Monitoring Ras Interactions with the Nucleotide Exchange Factor Son of Sevenless (Sos) Using Site-specific NMR Reporter Signals and Intrinsic Fluorescence. Journal of Biological Chemistry 2016, 291 (4), 1703–1718. [DOI] [PMC free article] [PubMed] [Google Scholar]
- 20.Smith MJ; Neel BG; Ikura M, NMR-based functional profiling of RASopathies and oncogenic RAS mutations. Proceedings of the National Academy of Sciences 2013, 110 (12), 4574. [DOI] [PMC free article] [PubMed] [Google Scholar]
- 21.Freedman TS; Sondermann H; Kuchment O; Friedland GD; Kortemme T; Kuriyan J, Differences in Flexibility Underlie Functional Differences in the Ras Activators Son of Sevenless and Ras Guanine Nucleotide Releasing Factor 1. Structure 2009, 17 (1), 41–53. [DOI] [PMC free article] [PubMed] [Google Scholar]
- 22.Moghadamchargari Z; Shirzadeh M; Liu C; Schrecke S; Packianathan C; Russell DH; Zhao M; Laganowsky A, Molecular assemblies of the catalytic domain of SOS with KRas and oncogenic mutants. Proc Natl Acad Sci U S A 2021, 118 (12). [DOI] [PMC free article] [PubMed] [Google Scholar]
- 23.Franzolin E; Pontarin G; Rampazzo C; Miazzi C; Ferraro P; Palumbo E; Reichard P; Bianchi V, The deoxynucleotide triphosphohydrolase SAMHD1 is a major regulator of DNA precursor pools in mammalian cells. Proc Natl Acad Sci U S A 2013, 110 (35), 14272–7. [DOI] [PMC free article] [PubMed] [Google Scholar]
- 24.Buj R; Aird KM, Deoxyribonucleotide Triphosphate Metabolism in Cancer and Metabolic Disease. Frontiers in Endocrinology 2018, 9 (177), 1–10. [DOI] [PMC free article] [PubMed] [Google Scholar]
- 25.Pavlova NN; Thompson CB, The Emerging Hallmarks of Cancer Metabolism. Cell metabolism 2016, 23 (1), 27–47. [DOI] [PMC free article] [PubMed] [Google Scholar]
- 26.John J; Sohmen R; Feuerstein J; Linke R; Wittinghofer A; Goody RS, Kinetics of interaction of nucleotides with nucleotide-free H-ras p21. Biochemistry 1990, 29 (25), 6058–65. [DOI] [PubMed] [Google Scholar]
- 27.Moghadamchargari Z; Huddleston J; Shirzadeh M; Zheng X; Clemmer DE; M Raushel F; Russell DH; Laganowsky A, Intrinsic GTPase Activity of K-RAS Monitored by Native Mass Spectrometry. Biochemistry 2019, 58 (31), 3396–3405. [DOI] [PMC free article] [PubMed] [Google Scholar]
- 28.Lito P; Solomon M; Li LS; Hansen R; Rosen N, Allele-specific inhibitors inactivate mutant KRAS G12C by a trapping mechanism. Science 2016, 351 (6273), 604–8. [DOI] [PMC free article] [PubMed] [Google Scholar]
- 29.Ostrem JM; Shokat KM, Direct small-molecule inhibitors of KRAS: from structural insights to mechanism-based design. Nat Rev Drug Discov 2016, 15 (11), 771–785. [DOI] [PubMed] [Google Scholar]
- 30.Hillig RC; Sautier B; Schroeder J; Moosmayer D; Hilpmann A; Stegmann CM; Werbeck ND; Briem H; Boemer U; Weiske J; Badock V; Mastouri J; Petersen K; Siemeister G; Kahmann JD; Wegener D; Böhnke N; Eis K; Graham K; Wortmann L; von Nussbaum F; Bader B, Discovery of potent SOS1 inhibitors that block RAS activation via disruption of the RAS-SOS1 interaction. Proc Natl Acad Sci U S A 2019, 116 (7), 2551–2560. [DOI] [PMC free article] [PubMed] [Google Scholar]
- 31.Hofmann MH; Gmachl M; Ramharter J; Savarese F; Gerlach D; Marszalek JR; Sanderson MP; Kessler D; Trapani F; Arnhof H; Rumpel K; Botesteanu D-A; Ettmayer P; Gerstberger T; Kofink C; Wunberg T; Zoephel A; Fu S-C; Teh JL; Böttcher J; Pototschnig N; Schachinger F; Schipany K; Lieb S; Vellano CP; Connell JC; Mendes RL; Moll J; Petronczki M; Heffernan TP; Pearson M; McConnell DB; Kraut N, BI-3406, a Potent and Selective SOS1–KRAS Interaction Inhibitor, Is Effective in KRAS-Driven Cancers through Combined MEK Inhibition. Cancer Discovery 2021, 11 (1), 142. [DOI] [PMC free article] [PubMed] [Google Scholar]
- 32.Lu S; Jang H; Zhang J; Nussinov R, Inhibitors of Ras–SOS Interactions. ChemMedChem 2016, 11 (8), 814–821. [DOI] [PubMed] [Google Scholar]
- 33.Shima F; Yoshikawa Y; Ye M; Araki M; Matsumoto S; Liao J; Hu L; Sugimoto T; Ijiri Y; Takeda A; Nishiyama Y; Sato C; Muraoka S; Tamura A; Osoda T; Tsuda K.-i.; Miyakawa T; Fukunishi H; Shimada J; Kumasaka T; Yamamoto M; Kataoka T, In silico discovery of small-molecule Ras inhibitors that display antitumor activity by blocking the Ras–effector interaction. Proceedings of the National Academy of Sciences 2013, 110 (20), 8182. [DOI] [PMC free article] [PubMed] [Google Scholar]
- 34.Gillette WK; Esposito D; Abreu Blanco M; Alexander P; Bindu L; Bittner C; Chertov O; Frank PH; Grose C; Jones JE; Meng Z; Perkins S; Van Q; Ghirlando R; Fivash M; Nissley DV; McCormick F; Holderfield M; Stephen AG, Farnesylated and methylated KRAS4b: high yield production of protein suitable for biophysical studies of prenylated protein-lipid interactions. Sci Rep 2015, 5, 15916. [DOI] [PMC free article] [PubMed] [Google Scholar]
- 35.Elegheert J; Behiels E; Bishop B; Scott S; Woolley RE; Griffiths SC; Byrne EFX; Chang VT; Stuart DI; Jones EY; Siebold C; Aricescu AR, Lentiviral transduction of mammalian cells for fast, scalable and high-level production of soluble and membrane proteins. Nat Protoc 2018, 13 (12), 2991–3017. [DOI] [PMC free article] [PubMed] [Google Scholar]
- 36.Laganowsky A; Reading E; Hopper JT; Robinson CV, Mass spectrometry of intact membrane protein complexes. Nat Protoc 2013, 8 (4), 639–51. [DOI] [PMC free article] [PubMed] [Google Scholar]
- 37.Marty MT; Baldwin AJ; Marklund EG; Hochberg GK; Benesch JL; Robinson CV, Bayesian deconvolution of mass and ion mobility spectra: from binary interactions to polydisperse ensembles. Anal Chem 2015, 87 (8), 4370–6. [DOI] [PMC free article] [PubMed] [Google Scholar]
- 38.Moghadamchargari Z; Huddleston J; Shirzadeh M; Zheng X; Clemmer DE; F, M. R.; Russell, D. H.; Laganowsky, A., Intrinsic GTPase Activity of K-RAS Monitored by Native Mass Spectrometry. Biochemistry 2019, 58 (31), 3396–3405. [DOI] [PMC free article] [PubMed] [Google Scholar]
- 39.Ostrem JM; Peters U; Sos ML; Wells JA; Shokat KM, K-Ras(G12C) inhibitors allosterically control GTP affinity and effector interactions. Nature 2013, 503 (7477), 548–51. [DOI] [PMC free article] [PubMed] [Google Scholar]
- 40.Vasta JD; Peacock DM; Zheng Q; Walker JA; Zhang Z; Zimprich CA; Thomas MR; Beck MT; Binkowski BF; Corona CR; Robers MB; Shokat KM, KRAS is vulnerable to reversible switch-II pocket engagement in cells. Nat Chem Biol 2022, 18 (6), 596–604. [DOI] [PMC free article] [PubMed] [Google Scholar]
- 41.Neal SE; Eccleston JF; Hall A; Webb MR, Kinetic analysis of the hydrolysis of GTP by p21N-ras. The basal GTPase mechanism. J Biol Chem 1988, 263 (36), 19718–22. [PubMed] [Google Scholar]
- 42.Buckstein MH; He J; Rubin H, Characterization of nucleotide pools as a function of physiological state in Escherichia coli. J Bacteriol 2008, 190 (2), 718–26. [DOI] [PMC free article] [PubMed] [Google Scholar]
- 43.Ferraro P; Franzolin E; Pontarin G; Reichard P; Bianchi V, Quantitation of cellular deoxynucleoside triphosphates. Nucleic Acids Res 2010, 38 (6), e85. [DOI] [PMC free article] [PubMed] [Google Scholar]
- 44.Traut TW, Physiological concentrations of purines and pyrimidines. Mol Cell Biochem 1994, 140 (1), 1–22. [DOI] [PubMed] [Google Scholar]
Associated Data
This section collects any data citations, data availability statements, or supplementary materials included in this article.
Supplementary Materials
Data Availability Statement
The data generated in this study are available within the article and its supplementary data files.