
Fig. 6.
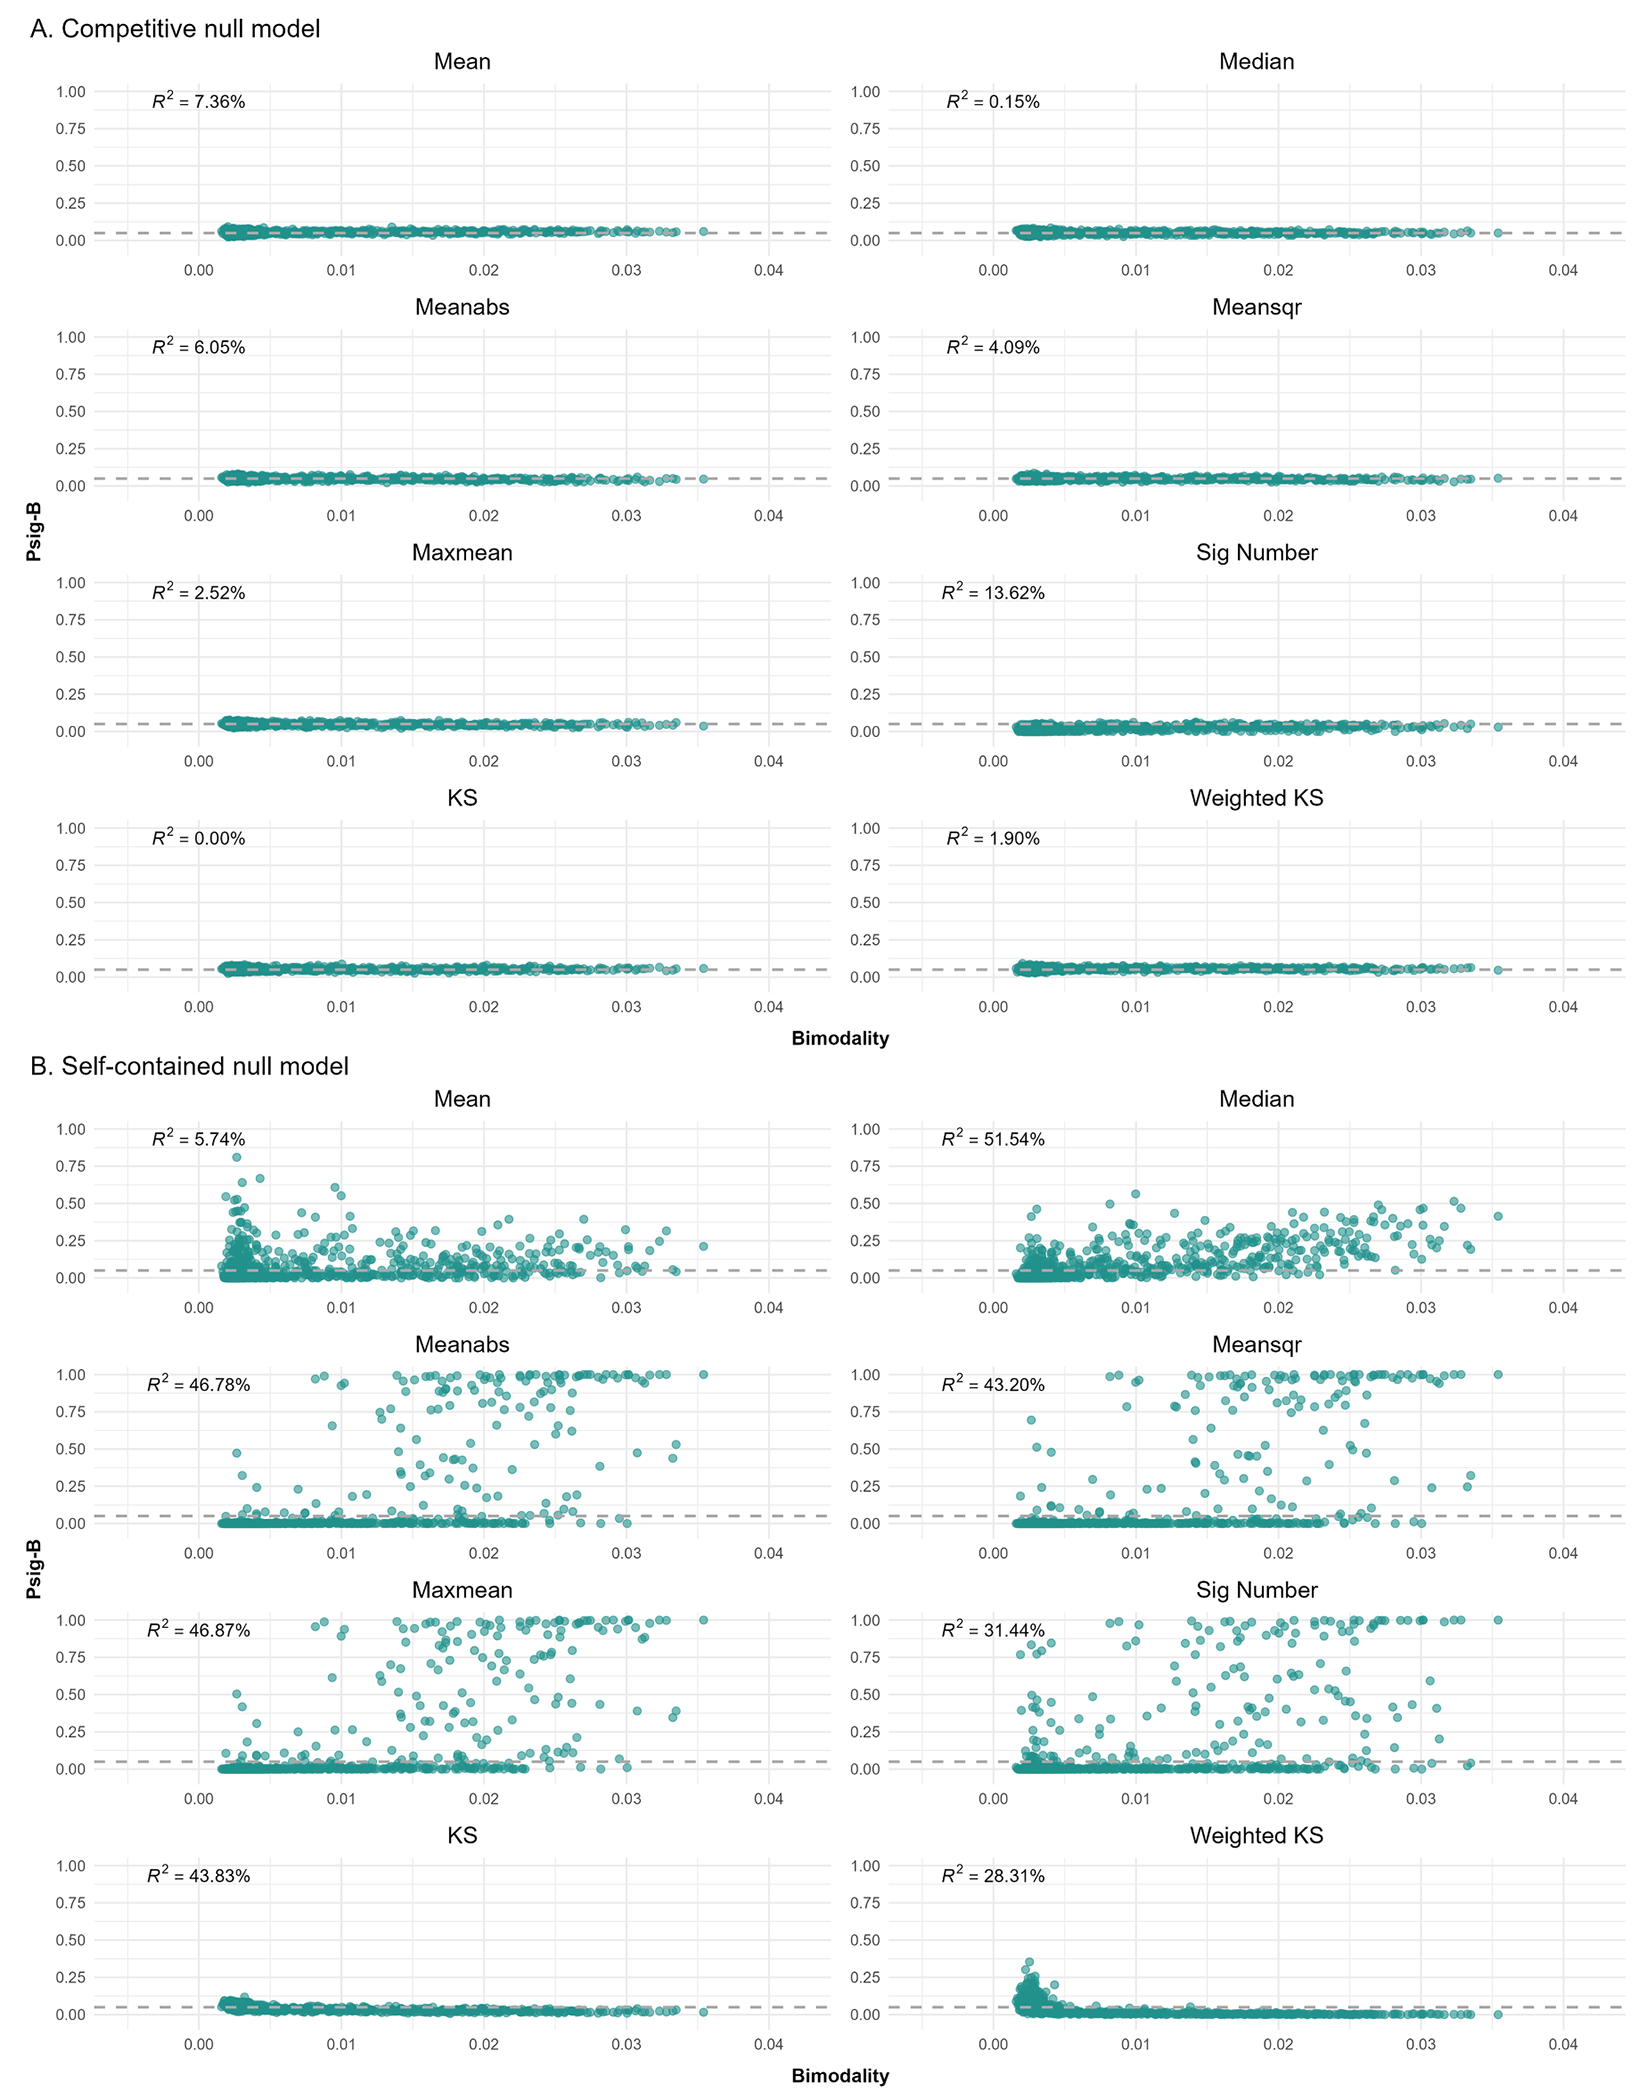
Results of the bimodality analysis for the competitive (A) and self-contained null models (B). The x-axis indicates the bimodality of the correlations between a specific brain map and transcriptional profiles of background genes, which is measured using the dip test statistic. The y-axis indicates the probability of significance for a specific brain map (Psig-B). The tests are carried out at a nominal α = 0.05 significance level. Each dot denotes a brain map and the horizontal dashed line denotes a Psig-B value of 0.05.