

Abstract
Pyuria in dipstick examination serves as the most widespread screening tool for urinary tract infections (UTI). The absence of pyuria, however, does not exclude UTI. We investigated the diagnostic value of urinary calprotectin, a mediator protein of the innate immune system, which is released by leukocytes, for the detection of UTI and compared it with dipstick pyuria. Since even low numbers of leukocytes in the urine significantly increase urinary calprotectin concentrations, calprotectin might be a more sensitive marker than pyuria detected by dipstick. All 162 patients were prospectively included and underwent a urine dipstick, urine culture, quantification of proteinuria and determination of calprotectin in the urine. Urinary calprotectin was determined using an enzyme-linked immunosorbent assay (ELISA). UTI was defined as urine cultures with detection of one or a maximum of two uropathogenic bacteria with ≥ 105 colony-forming units per millilitre (CFU/ml). Exclusion criteria were acute kidney injury, chronic renal insufficiency and tumors of the urinary tract. 71 (43.8%) patients had a UTI. Of the 91 patients without UTI, 23 had a contamination and 19 had evidence of ≥ 105 CFU/ml considered to be asymptomatic bacteriuria. The median calprotectin concentration in patients with UTI and pyuria was significantly higher than in patients with UTI and without pyuria (5510.4 vs. 544.7 ng/ml). In ROC analyses, calprotectin revealed an area under the curve (AUC) of 0.70 for the detection of significant bacteriuria. Pyuria in dipstick examinations provided an AUC of 0.71. There was no significant difference between these AUCs in the DeLong test (p = 0.9). In patients with evidence of significant bacteriuria but without pyuria, a significantly higher calprotectin concentration was measured in the urine than in patients with neither pyuria nor UTI (544.7 ng/ml vs 95.6 ng/ml, p = 0.029). Urinary calprotectin is non-inferior to dipstick pyuria in the detection of UTI.
Keywords: Calprotectin, Bacteriuria, Biomarker, Urinary tract infection
Subject terms: Immunology, Microbiology, Biomarkers, Health care, Nephrology, Urology
Introduction
Urinary tract infections (UTIs) are among the most frequently treated bacterial infections in both ambulatory and inpatient care1. UTI is proven when there is microbiological evidence of bacterial colonisation of the urinary tract (renal pelvic caliceal system, ureter, bladder, urethra) with corresponding clinical symptoms such as dysuria, fever, imperative need to urinate, pollakiuria, flank pain. The diagnosis of a UTI is the most common reason for prescribing antibiotics in outpatients, with most infections being treated empirically. Most UTIs occur in otherwise healthy, sexually active, young adult women, where anatomical and lifestyle factors predispose them to UTI. However, while simple UTIs can usually be successfully treated with empirically prescribed antibiotics on an outpatient setting, patients with additional risk factors often require targeted antibiotic treatment. Asymptomatic bacteriuria (ABU) must be distinguished from UTI2. In ABU, there are no clinical symptoms, but bacterial colonisation of the urinary tract can be detected by means of a urine culture. This requires the detection of ≥ 105 colony-forming units (CFU)/ml of urine in two consecutive urine cultures in women and in one in men if the patients are asymptomatic3,4. ABU is common and occurs in examinations of non-pregnant, healthy women and patients with anatomical and functional changes in the urinary tract. Only exceptions such as pregnant women or patients undergoing invasive procedures on the urinary tract should be treated for ABU5. The gold standard for the diagnosis of UTI is detection of bacteria in urine culture6. Significant bacteriuria in a UTI is defined by counts of > 105 colony forming units per millilitre (CFU/ml) and > 104 CFU/ml, in the midstream urine (MSU) of women and men, respectively6.
Urine culture, however, is time-consuming, expensive and does not allow a diagnosis to be made before the following day after urine collection7. Therefore, the most widespread screening tool is dipstick examination searching for pyuria. This method is inexpensive, rapid and ubiquitously available. In the majority of otherwise healthy patients with typical symptoms of UTI detection of pyuria in dipstick examination makes urine culture dispensable. Sensitivity of this technique ranges between 72 and 97% and the specificity between 41 and 86% in the literature8.
Calprotectin is a calcium-binding complex of two proteins of the so-called S100 group (S100A8/S100A9). It is released predominantly from neutrophils and, to a less extent, from monocytes9. In neutrophil cytoplasm it adds up to 60% of the cytosolic proteins10. Calprotectin is an activator of the innate immune system. If a neutrophil granulocyte is stimulated by an invading microorganism, it releases calprotectin as a damage-associated molecular pattern proteins (DAMP). Calprotectin activates toll-like receptor 4 (TLR4) and thereby amplifies inflammation11. With regard to its origin and physiological role calprotectin constitutes a promising biomarker candidate for UTI. In analogy, faecal calprotectin is an established biomarker in gastroenterology to detect inflammatory bowel conditions. Since calprotectin is released by neutrophils in high concentrations, it appears possible that it is a more sensitive marker of bacteriuria than a dipstick examination. The present study compares the diagnostic accuracy of urinary calprotectin concentrations and dipstick pyuria in the detection of UTI.
Methods
Study population and design
We conducted a prospective cohort study on inpatients recruited from University Hospital Marien Hospital Herne, tertiary care internal medicine and nephrology center at Ruhr-University Bochum, Germany. Patients were included in the study if a UTI was clinically suspected or if they submitted a urine sample for other reasons, such as renal end organ damage in the case of arterial hypertension or diabetes mellitus or in the case of an unclear increase in infection parameters. In accordance with the primary endpoint, a particular focus was placed on recruiting patients with a leucocyte-negative urine status and a positive urine culture including asymptomatic patients. In order to identify these patients, the laboratory values of all inpatients at our internal medicine clinic were screened. The respective medical history, the clinic and the presence of elevated laboratory parameters typical of infections such as C-reactive protein (CRP) or leucocytes as well as the dipstick/urine culture helped to identify potential patients. Exclusion criteria were acute kidney injury (AKI), chronic renal insufficiency and tumors of the urinary tract.
When analysing the data, both an analysis of the entire study population and a subgroup analysis of patients with and without a UTI were performed. UTI was defined as urine culture with detection of one or a maximum of two uropathogenic bacteria with ≥ 105 CFU/ml6. Urine cultures with evidence of more than two uropathogens were regarded as a contamination. The control group therefore consisted of patients with no evidence of bacteria in their urine and patients who had an asymptomatic bacteriuria.
The reporting of this study conforms to the Strengthening the Reporting of Observational Studies in Epidemiology (STROBE) statement12, which is presented in the supplementary material. Written informed consent was obtained from all participants before entry into the study. The study was performed by the Declaration of Helsinki and approved by the Ruhr-University Bochum ethics committee (ethics committee reference number: 5019-14).
Laboratory measurements
Patients provided 3 urine samples 10 ml each from MSU for examination; catheter urine was obtained from patients who had an urinary catheter. The sample for the measurement of calprotectin concentrations was stored in a freezer (− 80 °C) until measurement, the second urine sample was examined directly after acquisition from the patient in the hospital laboratory (dipstick, quantification of proteinuria using a protein- and albumin-creatinine quotient in the spontaneous urine) and the third sample was used for microbiological examination within the urine culture following the usual processing technique. For the detection of pyuria, urine dipstick analysis Combur-Test 10® from Roche13 was used without microscopic examination and for the detection and identification of uropathogenic bacteria, solely urine culture was performed without the use of a Polymerase chain reaction-based molecular assay14. In order to exclude bias of the results of the two groups due to antibiotic treatment, the inhibitor test was used2. The determination of the protein- or albumin-creatinine quotient (PCR, ACR) is a less time-consuming and simpler test compared to the 24-h urine collection. Spontaneous urine is utilised for this purpose, which allows the test to be performed at the time of the patient's examination. Albumin, protein and creatinine are quantified in the spontaneous urine and an indication in mg/l is obtained. Protein and albumin are then set in relation to the creatinine excretion for the respective quotient and an indication in mg/g creatinine is obtained. Many studies have shown that the quantification of proteinuria using PCR is almost equivalent to the determination in 24-h urine collections. The determination of PCR for the investigation of proteinuria and for monitoring chronic kidney disease has been included in the KDIGO guidelines15. A PCR of > 200 mg/g creatinine is the cut-off value for detecting proteinuria15. PCR/ACR serves to exclude renal insufficiency in this study. The determination of the urinary calprotectin concentration was performed using enzyme-linked immunosorbent assay (ELISA) kit (PhiCal® Calprotectin, catalog number K 6928, Immundiagnostik AG, Bensheim, Germany) according to the manufacturer’s protocol16,17. Creatinine, CRP and leucoyte count were determined in all patients on hospitalisation by validated standard clinical blood tests of serum samples respectively Ethylenediamine tetraacetic acid (EDTA).
Statistical analysis
The available data were checked for normal distribution using a D'Agostino-Pearson test18. This was not the case for the analysed parameters in the present population. The results were therefore presented in median and interquartile range (IQR). A Mann–Whitney U test was used to compare the data of patients with a UTI with those of patients without a UTI19. The null hypothesis stated that there was no difference between the two groups. A difference was considered significant at p < 0.05. ROC analysis was used to determine the diagnostic value of calprotectin with regard to the presence of a UTI in comparison with pyuria and to define a cut-off value for the detection of a UTI20. The Youden test was used to determine the cut-off value21. The area under the curve (AUC) of calprotectin and pyuria, which was calculated using ROC analysis, was compared using the DeLong test22. Furthermore, the sensitivity and specificity as well as the positive and negative predictive value for the detection of a UTI were calculated using calprotectin, the calprotectin-creatinine quotient and pyuria. The statistical programmes SPSS Version 26 (SPSS Inc, Chicago, Illinois, USA) and Excel® 2011 (Microsoft Corporation, Redmond, USA) were used for the analysis.
Results
Patient demographics, serum laboratory values and clinical characteristics of the study population
The demographic and clinical characteristics of the study population are presented in Table 1. A total of 162 patients were included. No kidney transplant patients were recruited. Of these, 66.67% (n = 108) were women and 33.33% (n = 54) were men. The median age was 67 years (IQR of 53.3–81.0 years), whereby the patients in the group with UTI (n = 71) were significantly older than those without UTI (n = 91) (p < 0.001). The median creatinine was 0.8 mg/dl (IQR of 0.7–0.9 mg/dl). In the subgroup analysis, there was no significant difference in relation to this value (p = 0.632). The median CRP value was 1.95 mg/dl (IQR of 0.5–6.3 mg/dl). In the group of patients with UTI, the CRP value was significantly higher (p = 0.018). Overall, 28.4% (n = 46) patients had one or more typical complaints (dysuria 4.94%, pollakisuria 3.09%, fever 24.69%). Contrary to our expectations, there was no significant difference in clinical symptoms between patients with UTI and those without UTI. A subgroup analysis of patients with and without UTI showed that 3 patients with UTI and 5 patients without UTI had dysuria (p = 0.701), 1 patient with UTI and 4 patients without UTI had pollakisuria (p = 0.272), while 22 patients with UTI and 18 patients without UTI had fever (p = 0.110). The proportion of those who had given MSU was significantly higher in the group without UTIs; the opposite was found for urine samples collected via a catheter (p = 0.02).
Table 1.
Characteristics of the study population.
| Variables | Total patients 162, (100%) | Patients with UTIs 71, (43.82%) | Patients without UTIs 91, (56.18%) | p-value* |
|---|---|---|---|---|
| Age in years (median, IQR) | 67.0 53.3–81.0 | 76.0 62.0–84.5 | 60.0 47.5–72.0 | < 0.001 |
| Females n, (%) | 108 (66.67%) | 54 (76.06%) | 54 (59.34%) | 0.002 |
| Males n, (%) | 54 (33.33%) | 17 (23.94%) | 37 (40.66%) | |
| Creatinin mg/dl (median, IQR) | 0.8 0.7–0.9 | 0.8 0.7–1.0 | 0.8 0.7–0.9 | 0.632 |
| CRP mg/dl (median, IQR) | 1.95 0.5–6.3 | 2.70 0.7–7.6 | 1.20 0.31–5.9 | 0.018 |
| Midstream urine sample, (%) | 125 (77.16%) | 48 (67.61%) | 77 (85.62%) | 0.009 |
| Catheter urine sample n, (%) | 37 (22.84%) | 23 (32.39%) | 14 (15.38%) | |
| Dysuria n, (%) | 8 (4.94%) | 3 (4.23%) | 5 (5.49%) | 0.701 |
| Pollakisuria n, (%) | 5 (3.09%) | 1 (1.41%) | 4 (4.4%) | 0.272 |
| Fever n, (%) | 40 (24.69%) | 22 30.99% | 18 (19.78%) | 0.110 |
UTIs urinary tract infections, CRP C reactive protein, IQR interquartile range.
*p-value between patients with and without UTIs from Mann–Whitney-U-Test.
Outcomes of the chemical urine analysis
Table 2 provides an overview of the results of the urine diagnostics (dipstick, calprotectin concentrations and PCR/ACR quotient) in the populations with and without UTI. The analysis of the urine dipstick comparing the subpopulations with and without UTI confirmed the results described in the previously cited literature. Proteinuria, pyuria and nitrite were significantly more frequent in the population with UTI (p < 0.05). When analysing pyuria further, it became apparent that there was only a significant difference in pronounced pyuria (500/µl) between the two groups (p < 0.05). In the lower range (25/µl, 75/µl and 100/µl), there was no significant difference between the population with and without UTI (p > 0.05). With regard to hematuria, there was no significant difference between the two groups (p > 0.05). The calprotectin concentration was found to be significantly higher overall and in relation to the creatinine concentration in the urine in patients with UTIs compared to those without UTIs (p < 0.001).
Table 2.
Results of the biochemical urine analysis.
| Variables | Total patients 162, (100%) | Patients with UTIs 71, (43.82%) | Patients without UTIs 91, (56.18%) | p-value* |
|---|---|---|---|---|
| Calprotectin in ng/ml (median, IQR) | 1758.5 242.4–6260.4 | 3811.9 1102.5–8241.2 | 787.8 86.6–3253.0 | < 0.001 |
| Calprotectin/Creatinin in ng/mg (median, IQR) | 2859.9 384.3–10,414.5 | 4637.0 1634.8–22,820.6 | 887.9 109.9–5044.8 | < 0.001 |
| Nitrites n, (%) | 32 (19.75%) | 22 (30.99%) | 10 (10.99%) | 0.002 |
| Pyuria n, (%) | 103 (63.58%) | 59 (83.10%) | 44 (48.35%) | < 0.001 |
| Pyuria 25/µl n, (%) | 25 (15.43%) | 13 (18.31%) | 12 (13.19%) | 0.372 |
| Pyuria 75/µl n, (%) | 9 (5.56%) | 3 (4.23%) | 6 (6.59%) | 0.515 |
| Pyuria 100/µl n, (%) | 9 (5.56%) | 4 (5.63%) | 5 (5.49%) | 0.969 |
| Pyuria 500/µl n, (%) | 60 (37.04%) | 39 (54.93%) | 21 (23.08%) | < 0.001 |
| Hematuria | 87 (53.70%) | 43 (60.56%) | 44 (48.35%) | 0.123 |
| Proteinuria in Urinanalysis n, (%) | 64 (39.51%) | 39 (54.93%) | 25 (27.47%) | < 0.001 |
| PCR in mg/g Creatinin (median, IQR) | 139 74.7–299.5 | 222 99.3–399.0 | 89.90 62.9–203.5 | < 0.001 |
| ACR in mg/g Creatinin (median, IQR) | 29.5 5.0–97.8 | 64.0 7.7–143.0 | 11.5 3.8–54.7 | < 0.001 |
UTIs urinary tract infections, PCR Protein/Creatinin ratio, ACR Albumin/Creatinin ration, IQR interquartile range.
*p-value between patients with and without UTIs from Mann–Whitney-U-Test.
Outcomes of the microbiological urine analysis
The microbiological examination yielded the results shown in Table 3. The higher bacterial counts (105 and 106/ml) were significantly more frequent in the population with a UTI (p < 0.001 and p = 0.011) and, in contrast, lower bacterial counts (103 and 104/ml) were significantly more frequent in the group without a UTI (p = 0.002). A bias in the results of the two groups due to antibiotic treatment could be ruled out by the inhibitor test. In total, only 23 (22.33%) of the patients received an antibiotic treatment before undergoing the urine test. The frequency was the same in both groups (p = 0.385). The microbiological examination of the urine samples revealed, in addition to uropathogenic bacteria, several non-pathogenic bacteria which were interpreted as contamination. Furthermore, the frequency of contamination was specified, as these were categorised as patients without UTI despite the detection of bacteria. Accordingly, the number of contamination in the group without UTI is significantly higher (p < 0.001). In this study, E. coli was identified as the most common uropathogen for the development of a UTI with 41.96%. It was followed in descending frequency by coagulase-negative Staphylococci, Klebsiella pneumoniae and Enterococcus faecalis. The uropathogens were always detected significantly more frequently in the population with UTI (p < 0.005). The results of the differentiation of uropathogens in the microbiological urine analysis are summarised in Table 4.
Table 3.
Results of the microbiological urine analysis.
| Variables | Total patients 162, (100%) | Patient with UTIs 71, (43.82%) | Patients without UTIs 91, (56.18%) | p-value* |
|---|---|---|---|---|
| Bacterial detection n, (%) | 103 (63.58%) | 71 (100%) | 32 (35.16%) | < 0.001 |
| No bacterial detection | 59 (36.42%) | 0 | 59 (64.84%) | |
| CFU/ml 106 n, (%) | 8 (4.94%) | 7 (9.86%) | 1 (1.1%) | 0.011 |
| CFU/ml 105 n, (%) | 82 (50.62%) | 64 (90.14%) | 18 (19.78%) | < 0.001 |
| CFU/ml 104 n, (%) | 11 (6.79%) | 0 | 11 (12.09%) | 0.002 |
| CFU/ml 103 n, (%) | 11 (6.79%) | 0 | 11 (12.09%) | 0.002 |
| Positive antimicrobial substances n, (%) | 23 (22.33%) | 12 (16.90%) | 11 (12.09%) | 0.385 |
| Contamination (> 2 Bacteria) n, (%) | 32 (19.75%) | 0 | 32 (35.16%) | < 0.001 |
UTIs urinary tract infections, CFU colony forming units, IQR interquartile range.
*p-value between patients with and without UTIs from Mann–Whitney-U-Tests.
Table 4.
Bacterial differentiation in microbiological urine analysis.
| Variables | Total patients with bacterial detection 103, (100%) | Patients with UTI with bacterial detection 71 (43.82%) | Patient without UTIs with bacterial detection 32 (56.18%) | p-value* |
|---|---|---|---|---|
| E. coli n, (%) | 47 (41.96%) | 46 (64.79%) | 1 (1.1%) | < 0.001 |
| Coagulase- negative Staphylococci n, (%) | 13 (11.61%) | 10 (14.08%) | 3 (3.30%) | 0.012 |
| Klebsiella pneumoniae n, (%) | 6 (5.36%) | 5 (7.04%) | 1 (1.1%) | 0.048 |
| Enterococcus faecalis n, (%) | 6 (5.36%) | 6 (8.45%) | 0 | 0.005 |
UTIs urinary tract infections;
*p-value between patients with and without UTIs from Mann–Whitney-U-Test.
Comparison of calprotectin concentration in different subgroups
The present analysis confirmed that the more leukocytes in the urine, the increased concentration of calprotectin can be measured. In case of a high count of leukocytes in the urine (500/µl), a significantly higher concentration of calprotectin could be detected in the urine compared to a low leukocyte count (25/µl) (p < 0.001). When the calprotectin concentration in the urine of patients with different levels of CFU was compared, it was found that the calprotectin concentration was significantly higher in the patients with high CFU (p = 0.007). In order to be able to make a more precise statement about the diagnostic ability of calprotectin, the subgroups were further divided. A total of 103 patients with pyuria were detected, of whom 72.82% (n = 71) had a CFU of ≥ 105/ml. 38 patients with pyuria had a CFU of < 105/ml. A comparison of the calprotectin concentrations in these two groups revealed a significantly higher calprotectin concentration in the group of patients with a CFU of ≥ 105/ml.
12 patients had no pyuria but a CFU of ≥ 105/ml and 47 patients a CFU of < 105/ml. Patients with a CFU of ≥ 105/ml had higher calprotectin concentrations, even in the absence of pyuria. The Mann–Whitney U test for the comparison of the calprotectin concentration in the urine of patients with UTI and those with a contamination with a CFU of ≥ 105/ml showed a p-value of 0.492. There was therefore no significant difference in the calprotectin concentration in the urine between these two groups.
Evaluation of the diagnostic accuracy of calprotectin in urine and pyuria for the detection of UTIs
ROC curves were examined to analyse the diagnostic value of calprotectin as a marker for UTI. The ROC analysis of calprotectin in urine showed an AUC of 0.70 (Fig. 1). The threshold value for calprotectin in urine for the detection of a UTI was 1575 ng/ml. A sensitivity of 67.6% and a specificity of 59.3% were determined for this threshold value (95% confidence interval 0.62 to 0.78). The positive predictive value (PPV) was 56.5% and the negative predictive value (NPV) was 70.1%.
Figure 1.

ROC curve of the calprotectin concentration in urine for the diagnosis of a UTI.
Figure 2 shows a ROC curve for the accuracy of the calprotectin-creatinine quotient for the detection of a UTI. In this ROC analysis, an AUC of 0.70 could be detected, i.e. the same quality for the detection of a UTI as by calprotectin in urine. The optimum threshold value was 2246 ng/mg creatinine. This cut-off value was associated with a sensitivity of 71.8% and a specificity of 60.4% (Fig. 2). The PPV was 58.6% and the NPV was 73.3%.
Figure 2.

ROC curve of the calprotectin-creatinine quotient for the diagnosis of a UTI.
In order to further categorise the diagnostic value of calprotectin, an ROC analysis of pyuria was performed to detect a UTI. An AUC of 0.71 was calculated (Fig. 3). At a cut-off value of 12.5 leucocytes/µl, a UTI was detected with a sensitivity of 81.7% and a specificity of 51.6%. The PPV was 56.9% and the NPV 78.3%. The results are summarised in Table 5. By comparing the AUC of calprotectin and pyuria using the DeLong test it was shown that urinary calprotectin is not inferior to pyuria in detecting UTI (p = 0.9).
Figure 3.
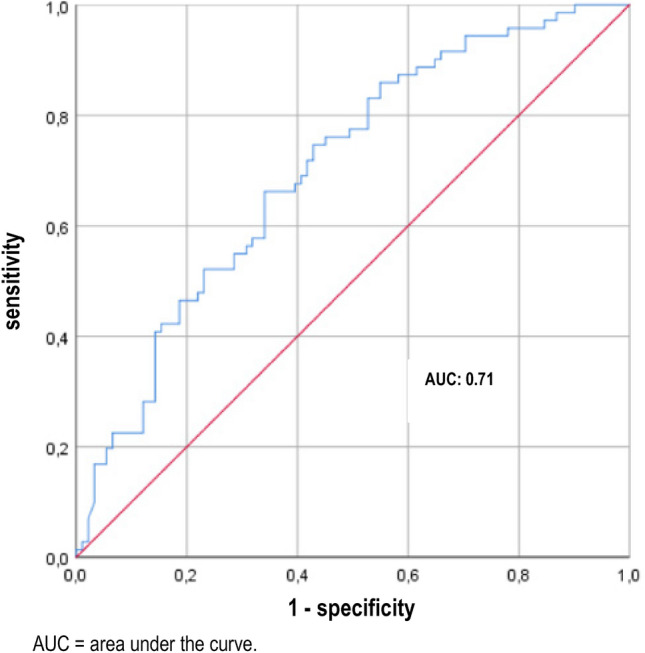
ROC curve of pyuria for the diagnosis of a UTI.
Table 5.
Comparison of calprotectin concentrations in urine in different subgroups.
| Subgroups | Calprotectin concentration ng/ml | p-value* |
|---|---|---|
| Pyuria 25/µl (median, IQR) | 1684.2 (641.0–2681.9) | < 0.001 |
| Pyuria 500/µl (median, IQR) | 7074.8 (2192.5–19,114.9) | |
| CFU/ml 106 (median, IQR) | 3318.5 (1962.1–6000.2) | – |
| CFU/ml 104 (median, IQR) | 1862.1 (600.9–4550.5) | – |
| CFU/ml 105 (median, IQR) | 4614.4 (1183.8–8634.9) | 0.007 |
| CFU/ml 103 (median, IQR) | 787.8 (110.6–2061.4) | |
| CFU/ml < 105 without pyuria (median, IQR) | 95.6 (32.6–476.4) | 0.029 |
| CFU/ml ≥ 105 without pyuria (median, IQR) | 544.7 (74.9–2152.7) | |
| CFU/ml < 105 with pyuria (median, IQR) | 1900.2 (787.8–5661.5) | 0.009 |
| CFU/ml ≥ 105 with pyuria (median, IQR) | 5510.4 (242.4–6260.4) | |
| CFU/ml ≥ 105 with contamination (median, IQR) | 5010.3 (4800.4–15,996.8) | 0.492 |
| UTI (median, IQR) | 3811.9 (1949.5–6847.9) |
UTI urinary tract infection, CFU colony forming units, IQR interquartile range;
*p-value between concentrations of calprotectin in urine in the subgroups from Mann–Whitney-U-Test.
Discussion
The present study shows that urinary calprotectin is non-inferior to dipstick pyuria for the diagnosis of UTI. The desired superiority, however, could not be demonstrated. The typical markers of urine status were abnormal. The patients with a UTI had significantly more pyuria than those without a UTI (p < 0.05). Moreover, nitrite and proteinuria were more frequent in patients with UTI. All these findings are in line with prior findings2,23–25. E. coli was the most frequently detected uropathogen, followed by Staphylococcus, Klebsiella pneumoniae, Enterococcus faecalis and Proteus mirabilis. This spectrum is in line with former studies like ARESC (Antimicrobial Resistance Epidemiological Survey on Cystitis)26.
Considering the physiological origin of calprotectin—it is mainly found in leucocytes—an association of the urinary calprotectin concentration and the extent of pyuria appeared probable. Our findings support this hypothesis. This result is analogous to the results of the investigations of faecal calprotectin in the diagnosis of chronic inflammatory bowel diseases (IBD). The more severe the degree of infection, the higher the migration of leukocytes through the intestinal wall and the higher the concentration of faecal calprotectin27. As an established biomarker in gastroenterology, calprotectin is used to assess the diagnosis, disease activity and therapeutic outcomes of chronic IBD. Although calprotectin can differentiate between functional bowel symptoms and chronic IBD, it is not conclusive for differentiating among gastrointestinal infections and colorectal carcinomas27.
The ROC analysis had an AUC of 0.70. This value shows that there is indeed an association of urinary calprotectin concentrations but the diagnostic accuracy is limited. In analogy to pyuria, however, calprotectin was not able to differentiate symptomatic and asymptomatic bacteriuria. The AUC of calprotectin was almost identical to the AUC of pyuria (0.71). Using Youden Test based cut-off values the sensitivity and specificity values were comparable between the two approaches (67.60% and 59.30% vs. 81.7% and 51.6). In order to consider the grade of concentration of the urine, urinary calprotectin/creatinine ratios were calculated. The use of this ratio resulted in an almost unchanged AUC and only slightly improved sensitivy and specificity (59,3% and 60,4%). Thus, calculating this ratio appears dispensable.
In a review by Simmerville et al. from 2005, eight studies were analysed for the evaluation of pyuria for the detection of a UTI. As a result, a sensitivity of 72–97% and a specificity of 41–86% were determined for the detection of a UTI using pyuria in urine dipstick8. The results obtained here are therefore comparable with those described in the literature. A higher sensitivity and specificity for the detection of a UTI using urine dipstick is obtained by analysing the combination of pyuria and nitrite28.
In those 12 patients with UTI without pyuria, urinary calprotectin concentrations were indeed significantly higher than in those without UTI and without pyuria (p = 0.029). The present study was not powered, however, to compare the diagnostic potency of the two approaches in this subset of patients. This finding encourages a further study on this specific group of patients.
A biomarker should have causality to the disease in order to have diagnostic or prognostic value. To this point, the relationship between the biomarker and the disease must be consistent, coherent and specific. The occurrence of the biomarker should not be explained by other diseases or influenced by variables29. Another requirement is a precise and reliable measurement that can be performed repeatedly at low cost30. Calprotectin in urine as a biomarker for UTI does not sufficiently fulfil these criteria. It has previously shown that concentrations increase in AKI16,17 and urothelial malignancies31. Thus, calprotectin is no specific biomarker for UTI.
Several other urine biomarkers have been investigated for the detection of a UTI including myeloperoxidase (MPO), xanthine oxidase (XO), lactoferrin, urinary heparin-binding protein (UHBP), soluble triggering receptor expressed on myeloid cells-1 (TREM 1), and interleukins32. The present study adds a new biomarker on this list. In line with the other biomarkers, however, calprotecin is not superior to the cheap and broadly available dipstick examinations.
The study is limited by its sample size. Moreover, the diagnosis of UTI was based solely on the microbiological findings and not on the clinical findings. Formally, this is therefore an investigation of the diagnostic performance of biomarkers for the diagnosis of “significant bacteriuria”. However, this was also the intention, as urine culture as the gold standard can also only detect this entity. In other studies that analysed biomarkers in urine, a similar definition was used as in the present study.
Conclusion
In conclusion, urinary calprotectin concentration is indeed a biomarker for UTI that is non-inferior to dipstick pyuria in ROC analyses. The lack of superiority to pyuria, however, does not justify its use in clinical practice. With regard to the findings in dipstick negative patients, it remains a candidate biomarker for symptomatic patients without pyuria. Future studies should focus on this specific group of patients.
Supplementary Information
Author contributions
SWG, CW performed the clinical study and contributed to writing the manuscript; CW measured Calprotectin and performed statistical analysis; SWG, CW, NB, XB, FS, THW revised the manuscript, THW designed the study and contributed to writing the manuscript.
Funding
Open Access funding enabled and organized by Projekt DEAL.
Data availability
The datasets used in the current study are available from the corresponding author on reasonable request.
Competing interests
The authors declare no competing interests.
Footnotes
Publisher's note
Springer Nature remains neutral with regard to jurisdictional claims in published maps and institutional affiliations.
These authors contributed equally: Sabina Waldecker-Gall and Christoph B. Waldecker.
Supplementary Information
The online version contains supplementary material available at 10.1038/s41598-024-62605-y.
References
- 1.Magill SS, O'Leary E, Janelle SJ, Thompson DL, Dumyati G, Nadle J, et al. Changes in prevalence of health care-associated infections in U.S. hospitals. N. Engl. J. Med. 2018;379(18):1732–1744. doi: 10.1056/NEJMoa1801550. [DOI] [PMC free article] [PubMed] [Google Scholar]
- 2.Wagenlehner, F. & Schmiemann, G. S3 Leitlinie Epidemiologie, Diagnostik, Therapie, Prävention und Mangement unkomplizierter, bakterieller, ambulant erworbener Harnwegisinfektionen bei Erwachsenen Patienten Aktualisierung AWMF-Register-Nr.043/044, 21–26 (2017).
- 3.Gleckman R, Esposito A, Crowley M, Natsios GA. Reliability of a single urine culture in establishing diagnosis of asymptomatic bacteriuria in adult males. J. Clin. Microbiol. 1979;9(5):596–597. doi: 10.1128/jcm.9.5.596-597.1979. [DOI] [PMC free article] [PubMed] [Google Scholar]
- 4.Kass EH. Asymptomatic infections of the urinary tract. Trans. Assoc. Am. Physicians. 1956;69:56–64. [PubMed] [Google Scholar]
- 5.Nicolle LE. Asymptomatic bacteriuria: when to screen and when to treat. Infect Dis. Clin. N. Am. 2003;17(2):367–394. doi: 10.1016/S0891-5520(03)00008-4. [DOI] [PubMed] [Google Scholar]
- 6.Anger JT, Bixler BR, Holmes RS, Lee UJ, Santiago-Lastra Y, Selph SS. Updates to recurrent uncomplicated urinary tract infections in women: AUA/CUA/SUFU guideline. J. Urol. 2022;208(3):536–541. doi: 10.1097/JU.0000000000002860. [DOI] [PubMed] [Google Scholar]
- 7.Price TK, Hilt EE, Dune TJ, Mueller ER, Wolfe AJ, Brubaker L. Urine trouble: Should we think differently about UTI? Int. Urogynecol. J. 2018;29(2):205–210. doi: 10.1007/s00192-017-3528-8. [DOI] [PubMed] [Google Scholar]
- 8.Simerville JA, Maxted WC, Pahira JJ. Urinalysis: A comprehensive review. Am. Fam. Physician. 2005;71(6):1153–1162. [PubMed] [Google Scholar]
- 9.Bjerke K, Halstensen TS, Jahnsen F, Pulford K, Brandtzaeg P. Distribution of macrophages and granulocytes expressing L1 protein (calprotectin) in human Peyer's patches compared with normal ileal lamina propria and mesenteric lymph nodes. Gut. 1993;34(10):1357–1363. doi: 10.1136/gut.34.10.1357. [DOI] [PMC free article] [PubMed] [Google Scholar]
- 10.Poullis A, Foster R, Northfield TC, Mendall MA. Review article: Faecal markers in the assessment of activity in inflammatory bowel disease. Aliment. Pharmacol. Ther. 2002;16(4):675–681. doi: 10.1046/j.1365-2036.2002.01196.x. [DOI] [PubMed] [Google Scholar]
- 11.Vogl T, Tenbrock K, Ludwig S, Leukert N, Ehrhardt C, van Zoelen MA, et al. Mrp8 and Mrp14 are endogenous activators of Toll-like receptor 4, promoting lethal, endotoxin-induced shock. Nat. Med. 2007;13(9):1042–1049. doi: 10.1038/nm1638. [DOI] [PubMed] [Google Scholar]
- 12.von Elm E, Altman DG, Egger M, Pocock SJ, Gotzsche PC, Vandenbroucke JP, et al. The strengthening the reporting of observational studies in epidemiology (STROBE) statement: Guidelines for reporting observational studies. Ann. Intern. Med. 2007;147(8):573–577. doi: 10.7326/0003-4819-147-8-200710160-00010. [DOI] [PubMed] [Google Scholar]
- 13.2017. https://diagnostics.roche.com/ch/de/products/instruments/combur_chemstripnephurnitur.html#productInfo.
- 14.Sarier M, Demir M, Goktas S, Duman I, Buyukkinaci M, Yuksel Y, et al. Results of real-time multiplex polymerase chain reaction assay in renal transplant recipients with sterile pyuria. Transplant. Proc. 2017;49(6):1307–1311. doi: 10.1016/j.transproceed.2017.02.051. [DOI] [PubMed] [Google Scholar]
- 15.Wahbeh AM, Ewais MH, Elsharif ME. Comparison of 24-hour urinary protein and protein-to-creatinine ratio in the assessment of proteinuria. Saudi J. Kidney Dis. Transpl. 2009;20(3):443–447. [PubMed] [Google Scholar]
- 16.Heller F, Frischmann S, Grunbaum M, Zidek W, Westhoff TH. Urinary calprotectin and the distinction between prerenal and intrinsic acute kidney injury. Clin. J. Am. Soc. Nephrol. 2011;6(10):2347–2355. doi: 10.2215/CJN.02490311. [DOI] [PMC free article] [PubMed] [Google Scholar]
- 17.Seibert FS, Rosenberger C, Mathia S, Arndt R, Arns W, Andrea H, et al. Urinary calprotectin differentiates between prerenal and intrinsic acute renal allograft failure. Transplantation. 2017;101(2):387–394. doi: 10.1097/TP.0000000000001124. [DOI] [PubMed] [Google Scholar]
- 18.Ghasemi A, Zahediasl S. Normality tests for statistical analysis: A guide for non-statisticians. Int. J. Endocrinol. Metab. 2012;10(2):486–489. doi: 10.5812/ijem.3505. [DOI] [PMC free article] [PubMed] [Google Scholar]
- 19.Hart A. Mann–Whitney test is not just a test of medians: Differences in spread can be important. BMJ. 2001;323(7309):391–393. doi: 10.1136/bmj.323.7309.391. [DOI] [PMC free article] [PubMed] [Google Scholar]
- 20.Hajian-Tilaki K. Receiver operating characteristic (ROC) curve analysis for medical diagnostic test evaluation. Caspian J. Intern. Med. 2013;4(2):627–635. [PMC free article] [PubMed] [Google Scholar]
- 21.Ruopp MD, Perkins NJ, Whitcomb BW, Schisterman EF. Youden Index and optimal cut-point estimated from observations affected by a lower limit of detection. Biom. J. 2008;50(3):419–430. doi: 10.1002/bimj.200710415. [DOI] [PMC free article] [PubMed] [Google Scholar]
- 22.DeLong ER, DeLong DM, Clarke-Pearson DL. Comparing the areas under two or more correlated receiver operating characteristic curves: A nonparametric approach. Biometrics. 1988;44(3):837–845. doi: 10.2307/2531595. [DOI] [PubMed] [Google Scholar]
- 23.Giesen LG, Cousins G, Dimitrov BD, van de Laar FA, Fahey T. Predicting acute uncomplicated urinary tract infection in women: A systematic review of the diagnostic accuracy of symptoms and signs. BMC Fam. Pract. 2010;11:78. doi: 10.1186/1471-2296-11-78. [DOI] [PMC free article] [PubMed] [Google Scholar]
- 24.Gatermann SFR, Handrick W, et al. Harnwegsinfektion: Mikrobiologisch-infektologische Qualitätsstandards. Urban & Fischer; 2005. [Google Scholar]
- 25.Whiting P, Westwood M, Watt I, Cooper J, Kleijnen J. Rapid tests and urine sampling techniques for the diagnosis of urinary tract infection (UTI) in children under five years: A systematic review. BMC Pediatr. 2005;5(1):4. doi: 10.1186/1471-2431-5-4. [DOI] [PMC free article] [PubMed] [Google Scholar]
- 26.Schito GC, Naber KG, Botto H, Palou J, Mazzei T, Gualco L, et al. The ARESC study: An international survey on the antimicrobial resistance of pathogens involved in uncomplicated urinary tract infections. Int. J. Antimicrob. Agents. 2009;34(5):407–413. doi: 10.1016/j.ijantimicag.2009.04.012. [DOI] [PubMed] [Google Scholar]
- 27.Gisbert JP, McNicholl AG. Questions and answers on the role of faecal calprotectin as a biological marker in inflammatory bowel disease. Dig. Liver Dis. 2009;41(1):56–66. doi: 10.1016/j.dld.2008.05.008. [DOI] [PubMed] [Google Scholar]
- 28.Dadzie I, Quansah E, Puopelle Dakorah M, Abiade V, Takyi-Amuah E, Adusei R. The effectiveness of dipstick for the detection of urinary tract infection. Can. J. Infect. Dis. Med. Microbiol. 2019;2019:8642628. doi: 10.1155/2019/8642628. [DOI] [PMC free article] [PubMed] [Google Scholar]
- 29.Kaulen, H. Biomarker: Plausibilität und Korrelation allein reichen nicht aus. Deutsches Ärzteblatt. A-2704/B-2391/C-2318 (2007).
- 30.Califf RM. Biomarker definitions and their applications. Exp. Biol. Med.. 2018;243(3):213–221. doi: 10.1177/1535370217750088. [DOI] [PMC free article] [PubMed] [Google Scholar]
- 31.Ebbing J, Mathia S, Seibert FS, Pagonas N, Bauer F, Erber B, et al. Urinary calprotectin: A new diagnostic marker in urothelial carcinoma of the bladder. World J. Urol. 2014;32(6):1485–1492. doi: 10.1007/s00345-013-1227-8. [DOI] [PubMed] [Google Scholar]
- 32.Masajtis-Zagajewska A, Nowicki M. New markers of urinary tract infection. Clin. Chim. Acta. 2017;471:286–291. doi: 10.1016/j.cca.2017.06.003. [DOI] [PubMed] [Google Scholar]
Associated Data
This section collects any data citations, data availability statements, or supplementary materials included in this article.
Supplementary Materials
Data Availability Statement
The datasets used in the current study are available from the corresponding author on reasonable request.