

Abstract
Urine ketone measurement is routinely performed in cats with diabetes mellitus to identify impending or established ketoacidosis. Studies using the urinary ketone dipstick test have shown that ketonuria is common in cats with newly diagnosed untreated diabetes mellitus. This test has a low sensitivity as it quantifies the less abundant ketone acetoacetate. The objective of the present study was to determine if ketonaemia is an inherent biochemical finding in untreated feline diabetes mellitus by measuring plasma ß-hydroxybutyrate (ß-OHB) in acutely sick cats. In 122 sick cats (37 diabetic and 85 non-diabetic cats) plasma ß-OHB, glucose, fructosamine, total protein and thyroxine were measured as part of the routine work up. Diabetic cats had significantly elevated ß-OHB values and ß-OHB measurement was a sensitive and specific test to identify diabetes mellitus. The area under the receiver operating characteristic (ROC) curve was 0.93. The cut off value with the highest positive likelihood ratio was 0.58 mmol/l. These results suggest that determination of plasma ß-OHB concentration is a useful method to distinguish between diabetic and non-diabetic sick cats.
Diabetes mellitus is a common endocrine disease in older cats. 1 Early diagnosis and treatment are important to achieve remission and to prevent metabolic decompensation. The diagnosis is based upon patient history, clinical findings, hyperglycaemia, glucosuria and fructosamine measurements. 2 Laboratory assessment is required, as clinical signs such as polyuria, polydipsia, polyphagia and/or weight loss are seen in many other diseases. Transient stress hyperglycaemia, glucosuria without hyperglycaemia in cats with acute renal failure or bladder haemorrhage and false low fructosamine concentrations in case of hypoproteinemia or hyperthyroidism hamper the diagnosis. 3–9 Prolonged insulin deficiency leads to ketosis (ketonaemia with or without ketonuria) which can rapidly progress to life-threatening ketoacidosis (ketosis combined with metabolic acidosis). The two main ketones acetoacetate and ß-hydroxybutyrate (ß-OHB) are produced in the liver and serve as energy sources for tissues in times of low insulin levels (prolonged fasting, starvation, diabetes mellitus) or insulin resistance. Although species differences exist, ß-OHB is the dominant ketone during ketosis or ketoacidosis. 10–12 Currently, identification of ketosis in feline patients is achieved by measurement of urinary ketones. This semiquantitative test measures the less abundant acetoacetate and clearly underestimates the true incidence of ketosis. 13,14 In one study more than 40% of newly diagnosed untreated diabetic cats were ketonuric. 15
The objective of this study was to assess the sensitivity and specificity of plasma ß-OHB measurement to diagnose feline diabetes mellitus and to compare its diagnostic efficacy with that of the fructosamine assay by means of receiver operating characteristic (ROC) curves.
Materials and methods
A total of 122 acutely sick cats of various breeds admitted to the University of Veterinary Medicine Vienna (Clinic for Small Animals) or a private veterinary practice (Tierklinik Bruck) with clinical findings associated with diabetes mellitus or diabetic decompensation were included and allocated into two groups (group 1: newly diagnosed untreated diabetic cats, n=37, group 2: non-diabetic cats, n=85). ß-OHB, fructosamine and total thyroxine were measured as part of the routine laboratory panel including standard biochemistry and haematology. The diagnosis of diabetes mellitus was based upon typical patient history, persistent hyperglycaemia on repeated blood glucose measurements (>8.3 mmol/l), glycosuria and response to specific therapy (diet and insulin). Twenty-five healthy university owned cats that had been fasted for 16 h served as controls (group 3). They were determined healthy on the basis of the results of physical examination and clinical laboratory data. Blood was taken with the permission of the local Animal Ethics Committee during the yearly routine health check from the cephalic vein. The group of sick non-diabetic cats was further divided into two subgroups according to plasma glucose concentration (subgroup 2a: glucose≥8.3 mmol/l, n=28; subgroup 2b: glucose<8.3 mmol/l, n=43). Cats were included in the subgroups if glucose and ß-OHB had been measured from the same blood sample. Blood samples were collected from the cephalic or jugular vein and placed into heparinised or plain tubes. After the blood had clotted the plain tubes were centrifuged (2400g for 10 min) and serum stored at −20°C for a maximum of 3 days. Except for samples collected in private practice or during weekends (plasma stored at −20°C until further analysis) measurements (glucose, fructosamine, ß-OHB, total protein) were performed within 1 h in the Central Laboratory of the university. Total thyroxine measurement (reference range 12.9–50 nmol/l) was performed in all 85 sick non-diabetic and in 30 diabetic cats.
Analytic procedures
Plasma ß-OHB was measured with a D-3 OHB esterase assay (Ranbut; Randox). Plasma fructosamine was measured using a colorimetric assay based on nitroblue tetrazolium (NTB) in alkaline solution (Fructosamine; Roche Diagnostics, Vienna, Austria). Both methods were applied on a fully selective chemistry analyser, a Hitachi 911 (Roche Diagnostics, Vienna), according to the manufacturers instructions. Both methods underwent daily quality controls. For ß-OHB the manufacturer claims a linearity range of 0.1–3.2 mmol/l. Higher concentrations of plasma ß-OHB require dilution with distilled water to allow measurements within the dynamic range. We determined a linear range from 0.016 to 1.16 mmol/l by measurement of diluted feline plasma and comparing expected to measured values (R2=0.99). The lower limit of detection was 0.01 mmol/l. The intra-assay coefficient of variation for the ß-OHB assay was calculated by assessing 10 replicates of three plasma samples ad medium (2.29±0.04 mmol/l; mean±1 standard deviation [SD]), low (0.35±0.01 mmol/l) and very low (0.06±0.007 mmol/l) ß-OHB concentrations. The coefficient of variation was 0.63%, 3.77% and 10.66%, respectively, with greater variation at the lowest concentrations. From day to day precision (cumulative quality control) was determined by measuring a commercially available aqueous control solution (Randox Assayed Multisera Level 2, target value 0.28 mmol/l) over 20 consecutive days and revealed an average bias of 2.57% and a coefficient of variation of 3.65%. Insulin therapy was associated with a significant reduction of ß-OHB concentration in diabetic cats (P<0.001).
The total allowable error for fructosamine is managed at a 20% level with a mean bias of 2.4% and a coefficient of variation of 3.68% for the low level control (target 260 mmol/l) and a mean bias of 3.4% and a coefficient of variation of 3.75% for the high level control (target 520 mmol/l).
Glucose concentrations were measured with the hexokinase method (Gluco-quant Enzyme Kit/Roche Diagnostics/Hitachi). Follow-up measurements were alternatively performed with the portable blood glucose meter Freestyle freedom (Abbott, Alameda, USA) recently validated for the use in cats. 16 Urinalysis was performed using Multistix (Bayer Diagnostics, Bridgend, UK).
Statistical and data analysis
Data analysis was performed with the laboratory software package Analyse-It version 2.03 (Analyse-It, Leeds, UK) and SigmaStat (SPSS 14, Chicago, Il, USA). All data were assessed for normality by the Kolmogorov–Smirnov test. Gender differences were compared with the χ2 test. The Kruskal–Wallis and Mann–Whitney U-test were used in case of non-normally distributed data. These data are given as median and range and are additionally shown graphically as box plots enhanced by diamond shapes beside the boxes representing means and confidence intervals (CI). For inferential statistics the level of significance was set at P<0.05. Linear regressions were calculated using Pearson's correlation. The cut off for ß-OHB to discriminate between diabetic and non-diabetic animals was determined by two different methods such as differential positive rates and positive likelihood ratios based on ROC curves. 17–19 The diagnostic efficacies of plasma ß-OHB and fructosamine were assessed by visual inspection of the ROC curves and by comparing the areas under the ROC curves. An area under the ROC curve of 1.0 was considered a perfect and 0.5 an imperfect test.
Results
As a reflection of the general cat population in Austria, domestic shorthair cats were overrepresented in all groups. No age or gender differences were found between sick diabetic and non-diabetic cats (P=0.536 and P=0.662, respectively). A significant age and gender difference was found between the control group (healthy cats) and the other groups (P<0.001). Healthy animals were on average younger and intact female cats were overrepresented. A correlation between ß-OHB concentration and age was neither found in diabetic (P=0.662) nor in sick non-diabetic (P=0.445) cats. Healthy female and male cats had comparable ß-OHB concentrations (P=0.898). Hyperthyroidism was diagnosed in four sick non-diabetic and two diabetic cats. Two diabetic cats had thyroxin concentrations within the high normal range (30.2 and 47.4 mmol/l) but further diagnostic work up was declined.
Plasma ß-OHB correlated positively with glucose in the diabetic (P<0.001, see Fig. 1), but not in the sick non-diabetic cats (r=−0.089, P=0.458). ß-OHB correlated positively with fructosamine in the diabetic (r=0.411, P=0.018) and negatively in the sick non-diabetic cats (r=−0.277, P=0.022).
Fig 1.

Scatter plots and correlations of plasma ß-OHB and glucose concentrations in diabetic (circles) and sick non-diabetic (squares) cats. The broken lines represent the regression lines.
The diabetic, the sick non-diabetic and the sick-non-diabetic hyperglycaemic cats (groups 1, 2 and 2a) had significantly higher ß-OHB values than healthy controls (group 3; P<0.001). Data for healthy cats were normally distributed (mean 0.0288 mmol/l, 95% CI: 0.0233–0.0343, SD 0.0133; for median and range see Table 1). Diabetic cats had significantly higher ß-OHB concentrations than sick non-diabetic cats (P<0.001, for box plots see Fig. 2). No significant difference was found between the subgroups 2a and 2b (P=0.376).
Table 1.
Demographic characteristics and selected laboratory data of diabetic, sick non-diabetic and healthy cats.
| Number | Age (years) | Gender (m/mn/f/fn) | Glucose (mmol/l) | Glucose (mg/dl) | Fructosamine (μmol/l) | ß-OHB (mmol/l) | |
|---|---|---|---|---|---|---|---|
| Diabetic | 37 | 12.2 (6.2–19.6) | 2/22/1/12 | 20 (10.8–47.2) | 361 (195–851) | 567 (344–841) | 1.47 (0.06–17.01) |
| Sick non-diabetic | 85 | 12 (1–18.6) | 2/46/5/32 | 7.5 (1.9–20.9) | 135 (34–376) | 217 (152–503) | 0.07 (0.00–0.75) |
| Stress hyperglycaemia | 28 | 12.7 (1.1–18.3) | 0/15/1/12 | 10.2 (8.3–20.9) | 184 (149–376) | 232 (152–503) | 0.07 (0–0.53) |
| Hypo/normoglycaemia | 43 | 12.2 (2–18.6) | 1/23/3/16 | 6.4 (1.9–8.1) | 115 (34–146) | 216 (156–361) | 0.07 (0–0.75) |
| Healthy (16 h fasted) | 25 | 2 (1.8–12.6) | 5/8/11/1 | 2.7 (2–5.8) | 49 (36–104) | 212 (183–280) | 0.03 (0–0.06) |
| 3.1–8.3 | 56–149 | <340 |
m/mn/f/fn=male/male neutered/female/female neutered. The sick non-diabetic cats were further divided into subgroups according to glucose concentrations. Data given as median and range.
Fig 2.

Box and whiskers plots of plasma ß-OHB concentrations in healthy, sick non-diabetic and diabetic cats. The bottom and top of the boxes represent the 25th and 75th percentile. The horizontal bars in the box and the whiskers represent the medians and the ranges, respectively. The diamond shapes represent means and confidence intervals.
The ß-OHB cut off value to discriminate between diabetic and non-diabetic cats associated with the highest sensitivity and specificity (calculated by the positive differential rates) was 0.22 mmol/l (sensitivity 81%, 95% CI: 65–92%; specificity 89%, 95% CI: 81–95%). No cat with moderate or severe stress related hyperglycaemia had ß-OHB concentrations above 0.22 mmol/l. The cut off value with the highest positive likelihood ratio was 0.58 mmol/l (+LR 52.84, sensitivity 62%, 95% CI: 45–78%; specificity 99%, 95% CI: 94–100%). The area under the ROC curve was 0.93 for ß-OHB (95% CI: 88–98%) and 1 for fructosamine (95% CI: 99–100%, Fig. 3). The difference of 0.07 (95% CI: 0.02–0.12) was significant (P=0.0066).
Fig 3.
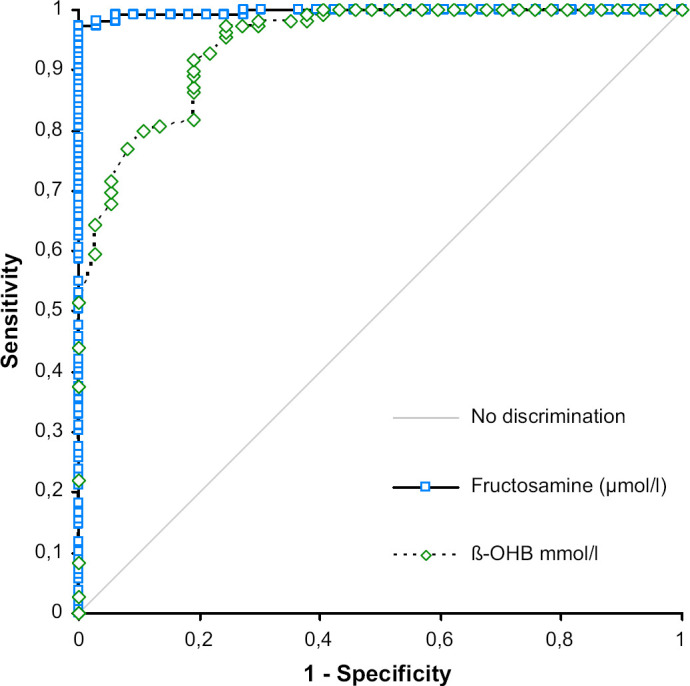
ROC curves of ß-OHB and fructosamine for prediction of diabetes mellitus in sick cats. The optimal ROC curve is the one connecting the points highest and farthest to the left corner.
Discussion
The data show that significant ketonaemia is very common in cats with newly diagnosed untreated diabetes mellitus. The high frequency of ketosis is in accordance with the situation in human patients where ketonaemia is an inherent part of diabetes mellitus independent of diabetes classification. 20 As ketonaemia is one of the most common metabolic abnormalities in diabetes and ketone determination helps to identify impending or established ketoacidosis, the lack of data in cats is surprising. 21 The hypothesis that ketonaemia is common in untreated diabetic cats is substantiated by the fact that 60% of these cats had values above 0.75 mmol/l, the highest value measured in the sick non-diabetic group and all diabetics had ß-OHB values above 0.06 mmol/l, the highest value measured in the healthy controls. Although the group of healthy cats was too small to establish a statistically sound reference interval, concentrations were almost identical to those measured by other authors in considerable older healthy cats. 22–24 No age and gender effects were observed in this study.
Although ketone levels were increased in the ill non-diabetic cats, the increments were small and notable in only one cat with severe hepatic failure. In contrast to humans, cats are relatively resistant to the development of significant ketosis after fasting and in times of energy depletion. 23,25–27 Cats as obligatory carnivores are metabolically adapted to use protein and fat as their main source of energy. Their potent gluconeogenic capacity enables this species to maintain adequate glucose levels during fasting with little mobilisation of glycogen stores. 28 Moderate ketonaemia (mean 1.57 mmol/l, SD 0.34 mmol/l; measured enzymatically, details not given) was observed in one prospective study with obese cats after 5–6 weeks of starvation, associated with severe muscle wasting and development of hepatic lipidosis. 29
Other important causes of ketosis/ketoacidosis in humans are prolonged exercise, salicylate poisoning, alcoholism, non-insulin-mediated hypoglycaemia (including inborn errors of fatty acid metabolism), ‘ketogenic’ high fat diets, advanced pregnancy, hypoadrenocorticism and growth hormone deficiency. 10,30,31 Most of these conditions are associated with low to normal blood glucose concentrations or should not be contributing factors in cats. Although we included cats with various conditions, it is possible that eminent ketonaemia does occur in specific diseases. Increased ketogenesis, evidenced by increased ß-OHB levels (mean 0.93 mmol, SD 0.14; Sigma Diagnostics kit) was found in 10 cats with spontaneous moderate to severe idiopathic hepathic lipidosis in another study. 32
The area under the curve (AUC) for plasma ß-OHB is 0.93 (95% CI: 0.88–0.98) indicating high diagnostic accuracy despite being smaller (P=0.066) than the AUC of 1.0 (95% CI: 0.99–1.00) for fructosamine. The cut off determined by differential positive rates (highest sensitivity at highest specificity) and positive likelihood ratios were 0.22 and 0.58 mmol/l, respectively. To understand cut offs or thresholds it is important to keep in mind, that they are always a trade-off between sensitivity and specificity. Cut offs with a high sensitivity are associated with low specificity and vice versa. When choosing 0.22 mmol/l as a threshold, false positive results are possible (false positive rate 9%) and additional confirmatory tests such as the fructosamine assay are necessary. While waiting for confirmatory results diabetogenic medication and high carbohydrate diets should be avoided. If patient history is inconclusive close monitoring is recommended. Interestingly the cut off 0.22 mmol/l corresponds very well to the cut off value suggested in another study to differentiate between ideal and less optimal diabetic control in insulin treated cats. 33 Values above 0.58 mmol/l clearly indicate diabetes mellitus, as false positive rate decreases to 1.2%, but sensitivity concordantly decreases from 78% to 59.5%. Only one non-diabetic cat with mild hyperglycaemia, severe hepatic failure and hepatoencephalopathy had a ß-OHB concentration above this value. The cut off to ‘rule in’ diabetes mellitus recommended in our study corroborates the threshold of 1 mmol/l previously used by other authors using the same commercial assay. An Australian cat population was screened for diabetes mellitus by measuring glucose and the diagnosis was confirmed by ß-OHB or fructosamine measurement. Data on test accuracy was not given. 34
Conclusion
All diabetic cats were ketotic at first presentation and ß-OHB measurement was an accurate predictor of diabetes mellitus. Although ketosis did occur in non-diabetic sick patients, ketonaemia was mild and 99% had ß-OHB levels below 0.58 mmol/l. Stress hyperglycaemia was not associated with significant ketosis. Plasma ß-OHB determination can be recommended as a first choice test to screen for diabetes mellitus in the acutely sick hyperglycaemic cat.
Acknowledgements
The authors would like to thank Prof JG Thalhammer for general support.
References
- 1.Panciera D.L., Thomas C.B., Eicker S.W., Atkins C.E. Epizootiologic patterns of diabetes mellitus in cats: 333 cases (1980–1986), J Am Vet Med Assoc 197, 1990, 1504–1508. [PubMed] [Google Scholar]
- 2.Rand J., Marshall R. Feline diabetes mellitus. Mooney C.T., Peterson M.E. BSAVA manual of canine and feline endocrinology, 2004, British Small Animal Veterinary Association: Gloucester, 129–141. [Google Scholar]
- 3.Rand J.S., Kinnaird E., Baglioni A., Blackshaw J., Priest J. Acute stress hyperglycemia in cats is associated with struggling and increased concentrations of lactate and norepinephrine, J Vet Intern Med 16, 2002, 123–132. [DOI] [PubMed] [Google Scholar]
- 4.Laluha P., Gerber B., Laluhova D., Boretti F.S., Reusch C.E. Stress hyperglycemia in sick cats: a retrospective study over 4 years, Schweiz Arch Tierheilkd 146, 2004, 375–383. [DOI] [PubMed] [Google Scholar]
- 5.Rich L.J., Kirk R.W. The relationship of struvite crystals to urethral obstruction, J Am Vet Med Assoc 154, 1969, 153–157. [PubMed] [Google Scholar]
- 6.Rumbeiha W.K., Francis J.A., Fitzgerald S.D., et al. A comprehensive study of Easter lily poisoning in cats, J Vet Diagn Invest 16, 2004, 527–541. [DOI] [PubMed] [Google Scholar]
- 7.Reusch C.E., Haberer B. Evaluation of fructosamine in dogs and cats with hypo- or hyperproteinaemia, azotaemia, hyperlipidaemia and hyperbilirubinaemia, Vet Rec 148, 2001, 370–376. [DOI] [PubMed] [Google Scholar]
- 8.Reusch C.E., Tomsa K. Serum fructosamine concentration in cats with overt hyperthyroidism, J Am Vet Med Assoc 215, 1999, 1297–1300. [PubMed] [Google Scholar]
- 9.Graham P.A., Mooney C.T., Murray M. Serum fructosamine concentrations in hyperthyroid cats, Res Vet Sci 67, 1999, 171–175. [DOI] [PubMed] [Google Scholar]
- 10.Laffel L. Ketone bodies: a review of physiology, pathophysiology and application of monitoring to diabetes, Diabetes Metab Res Rev 15, 1999, 412–426. [DOI] [PubMed] [Google Scholar]
- 11.Gammeltoft A. The significance of ketone bodies in fat metabolism. Blood ketone concentration in various animals during starvation and after phlorizin poisoning, Acta Physiol Scand 19, 1949, 280–287. [Google Scholar]
- 12.Fleming S.A. Bovine metabolic disorders. Ketosis in ruminants (Acetonemia). Smith B.P. Large animal internal medicine, 4th edn, 2009, Mosby: St Louis, 1364–1369. [Google Scholar]
- 13.McGillivray M.H., Li P.K., Lee J.T., Mills M.L., Putnam T.I., Schaefer P.A. Elevated plasma ß-hydroxybutyrate concentrations without ketonuria in healthy insulin-dependent diabetic patients, J Clin Endocrinol Metab 54, 1982, 665–668. [DOI] [PubMed] [Google Scholar]
- 14.Zeugswetter F., Pagitz M. Ketone measurements using dipstick methodology in cats with diabetes mellitus, J Small Anim Pract 50, 2009, 4–8. [DOI] [PubMed] [Google Scholar]
- 15.Crenshaw K.L., Peterson M.E. Pretreatment clinical and laboratory evaluation of cats with diabetes mellitus: 104 cases (1992–1994), J Am Vet Med Assoc 209, 1996, 943–949. [PubMed] [Google Scholar]
- 16.Zeugswetter F., Benesch T.H., Pagitz M. Validation of the portable blood glucose meter Freestyle freedom™ for the use in cats, Vet Med Austria 94, 2007, 143–148. [Google Scholar]
- 17.Akobeng A.K. Understanding diagnostic tests 3: receiver operating characteristic curves, Acta Paediatr 96, 2007, 644–647. [DOI] [PubMed] [Google Scholar]
- 18.Ward C.D. The differential positive rate, a derivative of receiver operating characteristic curves useful in comparing tests and determining decision levels, Clin Chem 32, 1986, 1427–1428. [PubMed] [Google Scholar]
- 19.Deeks J.J., Altman D.G. Education and debate. Statistics notes. Diagnostic tests 4: likelihood ratios, Br Med J 329, 2004, 168–169. [DOI] [PMC free article] [PubMed] [Google Scholar]
- 20.Harano Y., Kosugi K., Hyosugi T., et al. Ketone bodies as markers for type1 (insulin-dependent) diabetes and their value in the monitoring of diabetic control, Diabetologia 26, 1984, 343–348. [DOI] [PubMed] [Google Scholar]
- 21.Werk E.E., Knowles H.C. The blood ketone and plasma free fatty acid concentration in diabetic and normal subjects, Diabetes 10, 1960, 22–32. [DOI] [PubMed] [Google Scholar]
- 22.Dobenecker B. Einfluss von Futterzusammensetzung und Nahrungsentzug auf ausgewählte Parameter des Fettstoffwechsels bei der übergewichtigen Katze. Doctoral thesis, Hannover, 1994.
- 23.Dobenecker B., Kienzle E., Sallmann H.P., Fuhrmann H. Einfluss der Futterzusammensetzung und des Fütterungszeitpunktes auf die Plasmakonzentration von Cholesterin, Triglyceriden, freien Fettsäuren und ß-Hydroxybutyrat bei der Katze, Kleintierpraxis 40, 1995, 843–848. [Google Scholar]
- 24.Christopher M.M., Broussard J.D., Fallin C.W., Drost N.J., Peterson M.E. Increased serum d-lactate associated with diabetic ketoacidosis, Metabolism 44, 1995, 287–290. [DOI] [PubMed] [Google Scholar]
- 25.Owen O.E., Felig P., Morgan A.P., Wahren J., Cahill G.F. Liver and kidney metabolism during prolonged starvation, J Clin Invest 48, 1969, 574–583. [DOI] [PMC free article] [PubMed] [Google Scholar]
- 26.Ibrahim W.H., Bailey N., Sunvold G.D., Bruckner G.G. Effects of carnitine and taurine on fatty acid metabolism and lipid accumulation in the liver of cats during weight gain and weight loss, Am J Vet Res 64, 2003, 1265–1277. [DOI] [PubMed] [Google Scholar]
- 27.Thiess S., Becskei, Tomsa K., Lutz T.A., Wanner M. Effects of high carbohydrate and high fat diet on plasma metabolite levels and iv glucose tolerance test in intact and neutered male cats, J Feline Med Surg 6, 2004, 207–218. [DOI] [PMC free article] [PubMed] [Google Scholar]
- 28.Kettelhut I.C., Foss M.C., Migliorini R.H. Glucose homeostasis in a carnivorous animal (cat) and rats fed a high-protein diet, Am J Physiol 239, 1980, R437–R444. [DOI] [PubMed] [Google Scholar]
- 29.Biourge V., Groff J.M., Fisher C., Bee D., Morris J.G., Rogers Q.R. Nitrogen balance, plasma free amino acid concentrations and urinary orotic acid excretion during log-term fasting in cats, J Nutr 24, 1994, 1094–1103. [DOI] [PubMed] [Google Scholar]
- 30.Koeslag J.H., Noakes T.D., Sloan A.W. Post-exercise ketosis, J Physiol 301, 1980, 79–90. [DOI] [PMC free article] [PubMed] [Google Scholar]
- 31.Davids M.R., Segal A.S., Brunengraber H., Halperin M.L. An unusual cause of ketoacidosis, Q J Med 97, 2004, 365–376. [DOI] [PubMed] [Google Scholar]
- 32.Pazak H.E., Bartges J.W., Cornelius L.C., Scott M.A., Gross K., Huber T.L. Characterization of lipoprotein profiles of healthy, adult cats and idiopathic feline hepatic lipidosis patients, J Nutr 128, 1998, 2747S–2750S. [DOI] [PubMed] [Google Scholar]
- 33.Martin G.J., Rand J.S. Comparisons of different measurements for monitoring diabetic cats treated with porcine insulin zinc suspension, Vet Rec 161, 2007, 52–58. [DOI] [PubMed] [Google Scholar]
- 34.Rand J.S., Bobbermien L.M., Hendrikz J.K., Coopland M. Overrepresentation of Burmese cats with diabetes mellitus, Aust Vet J 75, 1997, 402–405. [DOI] [PubMed] [Google Scholar]