ABSTRACT
Renal fibrosis is a typical pathological change in chronic kidney disease (CKD). Epithelial-mesenchymal transition (EMT) is the predominant stage. Activation of macroautophagy/autophagy plays a crucial role in the process of EMT. Lycopene (LYC) is a highly antioxidant carotenoid with pharmacological effects such as anti-inflammation, anti-apoptosis and mediation of autophagy. In this study, we demonstrated the specific mechanism of LYC in activating mitophagy and improving renal fibrosis. The enrichment analysis results of GO and KEGG showed that LYC had high enrichment values with autophagy. In this study, we showed that LYC alleviated aristolochic acid I (AAI)-induced intracellular expression of PINK1, TGFB/TGF-β, p-SMAD2, p-SMAD3, and PRKN/Parkin, recruited expression of MAP1LC3/LC3-II and SQSTM1/p62, decreased mitochondrial membrane potential (MMP), and ameliorated renal fibrosis in mice. When we simultaneously intervened NRK52E cells using bafilomycin A1 (Baf-A1), AAI, and LYC, intracellular MAP1LC3-II and SQSTM1 expression was significantly increased. A similar result was seen in renal tissue and cells when treated in vitro and in vivo with CQ, AAI, and LYC, and the inhibitory effect of LYC on the AAI-activated SMAD2-SMAD3 signaling pathway was attenuated. Molecular docking simulation experiments showed that LYC stably bound to the AKT active site. After intervention of cells with AAI and GSK-690693, the expression of PINK1, PRKN, MAP1LC3-II, BECN1, p-SMAD2 and p-SMAD3 was increased, and the expression of SQSTM1 was decreased. However, SC79 inhibited autophagy and reversed the inhibitory effect of LYC on EMT. The results showed that LYC could inhibit the AKT signaling pathway to activate mitophagy and reduce renal fibrosis.
Abbreviation: AA: aristolochic acid; ACTA2/α-SMA: actin alpha 2, smooth muscle, aorta; ACTB: actin beta; AKT/protein kinase B: thymoma viral proto-oncogene; BAF-A1: bafilomycin A1; BECN1: beclin 1, autophagy related; CCN2/CTGF: cellular communication network factor 2; CDH1/E-Cadherin: cadherin 1; CKD: chronic kidney disease; COL1: collagen, type I; COL3: collagen, type III; CQ: chloroquine; ECM: extracellular matrix; EMT: epithelial-mesenchymal transition; FN1: fibronectin 1; LYC: lycopene; MAP1LC3/LC3: microtubule-associated protein 1 light chain 3; MMP: mitochondrial membrane potential; MTOR: mechanistic target of rapamycin kinase ; PI3K: phosphoinositide 3-kinase; PINK1: PTEN induced putative kinase 1; PRKN/Parkin: parkin RBR E3 ubiquitin protein ligase; PPI: protein-protein interaction; SMAD2: SMAD family member 2; SMAD3: SMAD family member 3; SQSTM1/p62: sequestosome 1; TGFB/TGFβ: transforming growth factor, beta; VIM: vimentin
KEYWORDS: AKT, lycopene, mitophagy, renal fibrosis, TGFB
Introduction
Tubulointerstitial fibrosis often occurs in progressive chronic kidney disease (CKD) and is characterized by tubular atrophy and accumulation of extracellular matrix (ECM) in renal tissue [1,2]. Usually, renal fibrosis is associated with the production of inflammation and oxidative stress in the kidney [3]. Because fibrosis is thought to be irreversible, inhibiting the progression of interstitial fibrosis is considered a potential strategy to protect against the development of CKD. Aristolochic acid I (AAI) is a toxic compound found in medicinal plants of the genera Aristolochia and Asarum [4]. Chronic administration of medicinal plants containing AA produces nephrotoxicity, leading to end-stage renal disease. Aristolochic acid nephropathy is clinically characterized by rapidly progressive fibrosing interstitial nephritis and its main pathogenic mechanism is oxidative stress, tubular cell apoptosis, inflammation, and fibrosis [5]. Increasing studies have shown that renal fibrosis is associated with epithelial-mesenchymal transition (EMT) [6–8]. Because the expression level of TGFB/TGF-β (transforming growth factor, beta) in cells is closely related to EMT and ECM production, it is considered to be a strong mediator of renal fibrosis and CKD [9]. It has been shown that overexpression of TGFB in mouse kidney activates tubulointerstitial fibrosis and glomerulosclerosis [10]. Therefore, TGFB is a potential key driver of renal fibrosis.
Macroautophagy is a cellular self-renewal process dependent on lysosomal degradation. Under normal physiological conditions, autophagy recognize and degrade damaged proteins and supernumerary damaged organelles, and subsequently release degraded products to maintain cellular homeostasis [11]. Autophagy is important for cellular homeostasis and function. And it is also a stress response mechanism under pathological and physiological conditions. Autophagy dysfunction contributes to the pathogenesis of a variety of diseases [12]. Studies have shown that streptozotocin-induced diabetic mice exhibit defects in autophagy [13]. Mitochondria are enriched in tubular epithelial cells to meet high metabolic energy requirements. Various kidney diseases result when ATP production is insufficient in mitochondria, mitochondrial dynamics are defective, and oxidative stress occurs in mitochondria [8]. Currently, mitophagy is considered an important degradation pathway during energy stress and is essential for maintaining the normal function of mitochondria [14]. PINK1 (PTEN induced putative kinase 1) can trigger mitophagy by recruiting and activating PRKN/Parkin (parkin RBR E3 ubiquitin protein ligase). The filamentous phagocytic ability mediated by PINK1 and PRKN can improve mitochondrial function.
Increasing studies have shown that the level of autophagy in the body has a close relationship with the development of organ fibrosis [15,16]. Abnormal autophagy can be considered as one of the causes of the pathogenesis of fibrosis [17]. For example, restoring autophagic activity in hepatocytes is able to attenuate the development of liver fibrosis [18]. The use of autophagy-enhancing drugs is able to promote degradation of mutant SERPINA1/α1-antitrypsin variant Z and reduce liver fibrosis [19]. In addition, a specific inhibitor (AC-73) has been shown to activate autophagy and reduce trinitrobenzene sulfonic acid -induced chronic colitis-associated intestinal fibrosis by targeting BSG/CD147 [20]. More researchers have recently confirmed that chronic autophagy deficiency or autophagy dysfunction may accelerate renal fibrosis [21]. Thus, targeting autophagic mechanisms could theoretically improve the development of CKD.
Lycopene (LYC) is a major phytochemical found in tomato [22], and it belongs to the class of carotenoids. LYC has antioxidant, anti-inflammatory, antibacterial, and anti-aging effects and has been shown to have potentially beneficial effects in several cancer diseases such as prostate, breast, and gastric cancers [23]. It has been shown that autophagy levels play a critical role in LYC-mediated pharmacological effects [24]. LYC is able to ameliorate pancreatitis by preventing oxidative stress-induced autophagic damage and by directly activating autophagy in pancreatic acinar cells [25]. LYC can inhibit high glucose-induced apoptosis in MPC5 podocytes by promoting autophagic activity through activation of the PI3K (phosphoinositide 3-kinase)-AKT/protein kinase B (thymoma viral proto-oncogene) signaling pathway [26]. AKT is a serine/threonine protein kinase and a key mediator of PI3K [27]. PI3K-AKT is known to be a critical signal transduction pathway in cells [28] and has received much attention because it plays a critical regulatory role in inflammatory responses and cellular autophagy. It has been shown that moriferin reverses IL1B-induced inflammation by promoting the autophagic process by inhibiting the PI3K-AKT-MTOR (mechanistic target of rapamycin kinase) signaling pathway [29]. In addition, our previous findings showed that mice chronically fed AAI developed pathological conditions of massive accumulation of damaged mitochondria in tubular epithelial cells and renal fibrosis. LYC alleviated AAI-induced inflammatory responses and apoptosis in the kidney. But whether LYC can affect AAI-induced renal fibrosis is unknown. A large number of studies have confirmed the close link between autophagy and EMT [30]. Therefore, in this study, we want to verify whether LYC has an improvement effect on AAI-induced renal fibrosis, and whether the specific mechanism of action is related to the mediation of AKT signaling pathway and mitochondrial autophagy.
Results
LYC attenuates pathological damage induced by AAI in renal fibrosis
To avoid the intervention of giving both drugs in parallel, we chose to administer AAI at 8:00 a.m. and LYC at 13:00 p.m. every day. Kidney tissue and blood samples were collected after 28 days of continuous gavage. The experimental flow chart is shown in Figure 1A. Clinical observations showed that the kidneys of mice in the model group were whitish in color, smaller in size, and lighter in urine color compared with mice in the control group (Figure 1B,C). Creatinine and urea nitrogen in the serum were significantly increased. Renal function was abnormal (Figure 1D). Histopathological examination showed that the nephrotoxicity of AAI was mainly aimed at renal tubules. The tubular injury score was significantly increased, which was manifested as enlarged renal tissue voids, significant tubular vacuolization, tubular epithelial cell shedding, massive infiltration of inflammatory cells, and mild glomerular atrophy (Figure 1E,F). Mice treated with LYC had reddish kidneys and became larger. Renal function recovered and histopathological changes improved (Figure 1B-F).
Figure 1.
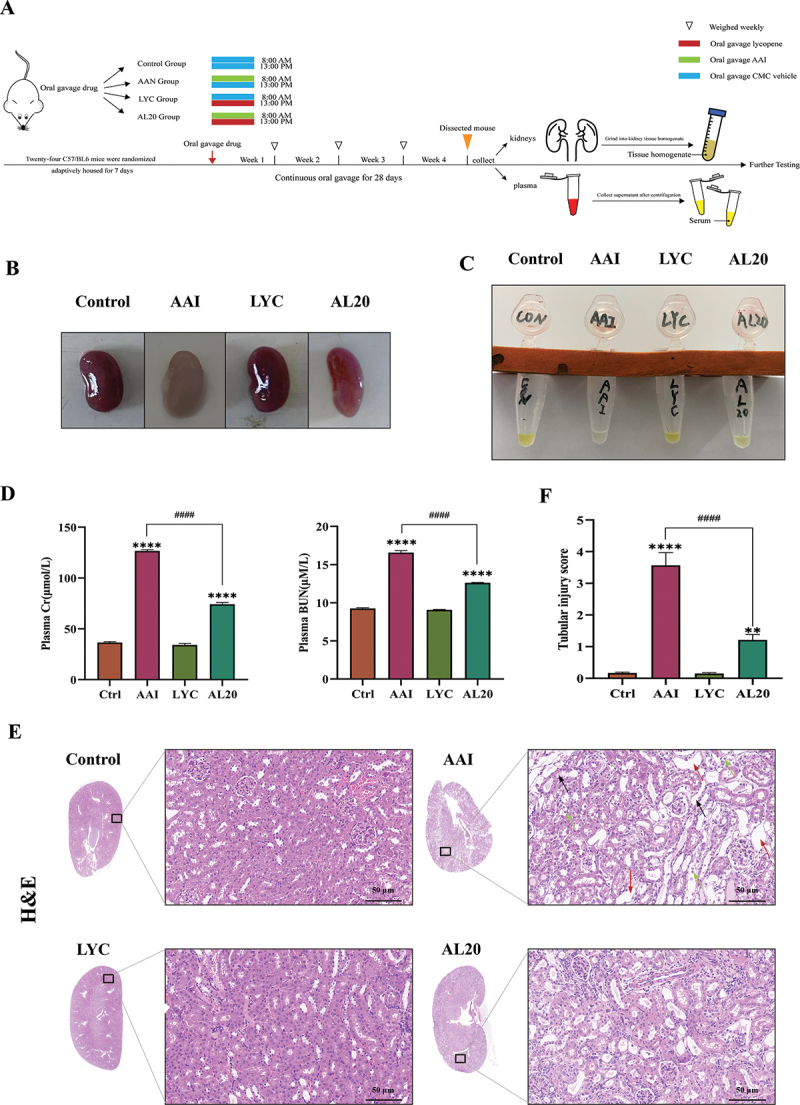
LYC ameliorated AAI-induced renal function and histopathological damage. (A) schematic diagram of establishment of animal model and sample collection. (B) kidneys were collected and photographed from mice in each group after 28 days of treatment. (C) urine was collected and photographed from mice in each group after 28 days of treatment. (D) content of cr and BUN in serum. (E) HE staining (200 ×) of mouse renal tissues. Black arrow: tubular lumen enlarged; Red arrow: tubular vacuolation; green arrow: tubular epithelial cell detachment. (F) tubular injury score. Compared with the control group, * indicates p < 0.05, ** indicates p < 0.01, *** indicates p < 0.001, and **** indicates p < 0.0001; comparison between other groups, # indicates p < 0.05, ## indicates p < 0.01, ### indicates p < 0.001, and #### indicates p < 0.0001.
LYC attenuates renal fibrosis by inhibiting EMT induced by TGFB signaling pathway
In a previous study, we demonstrated that LYC was able to decrease AAI-induced inflammatory responses in renal tissue and reduce the massive accumulation of inflammatory factors in the kidney. Therefore, we speculated whether LYC can slow the development and progression of AAI-induced renal fibrosis in mice. MASSON staining was carried out on renal tissue sections of mice in each group. The results showed that there was a large amount of collagen fiber deposition and serious fibrosis in the renal tissue of mice in the model group compared with the control group. In the LYC intervention group, collagen deposition improved. (Figure 2A). The results showed that the expression of ACTA2/α-SMA, VIM (vimentin), FN1 (fibronectin 1) was significantly increased and the expression of CDH1/E-cadherin (cadherin 1) was significantly decreased in the kidneys of mice in the model group. Compared with the model group, the expression of ACTA2, VIM, FN1 was decreased and the expression of CDH1 was increased in the LYC intervention group. (Figure 2B-E). In addition, we examined the expression of proteins involved in the TGFB signaling pathway. The results showed that the content of TGFB and the expression of p-SMAD2:SMAD2, p-SMAD3:SMAD3, CCN2 (cellular communication network factor 2), COL1 (collagen, type I) and COL3 (collagen, type III) was significantly increased in the kidneys of mice in the model group. Compared with the model group, the expression of the content of TGFB and the expression of above proteins was decreased in the LYC intervention group. (Figure 3A-E). The above results showed that LYC could act on TGFB signaling pathway and reduce collagen deposition.
Figure 2.
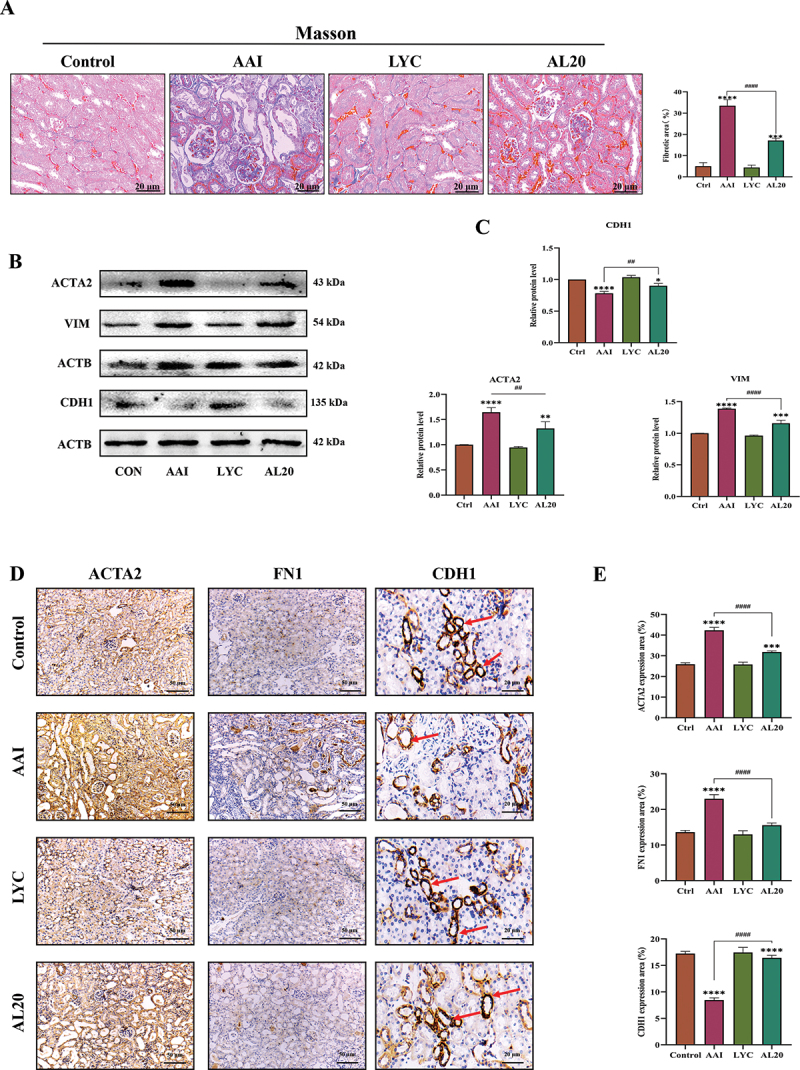
LYC ameliorated AAI-induced collagen fibril deposition and decreased expression of fibrotic marker proteins in renal tissue. (A) Representative images of MASSON staining in each group. (B-C) WB detected the expression of ACTA2, VIM, CDH1. (D-E) IHC detected the expression of ACTA2, CDH1, FN1 in renal tissue of mice in each group.
Figure 3.
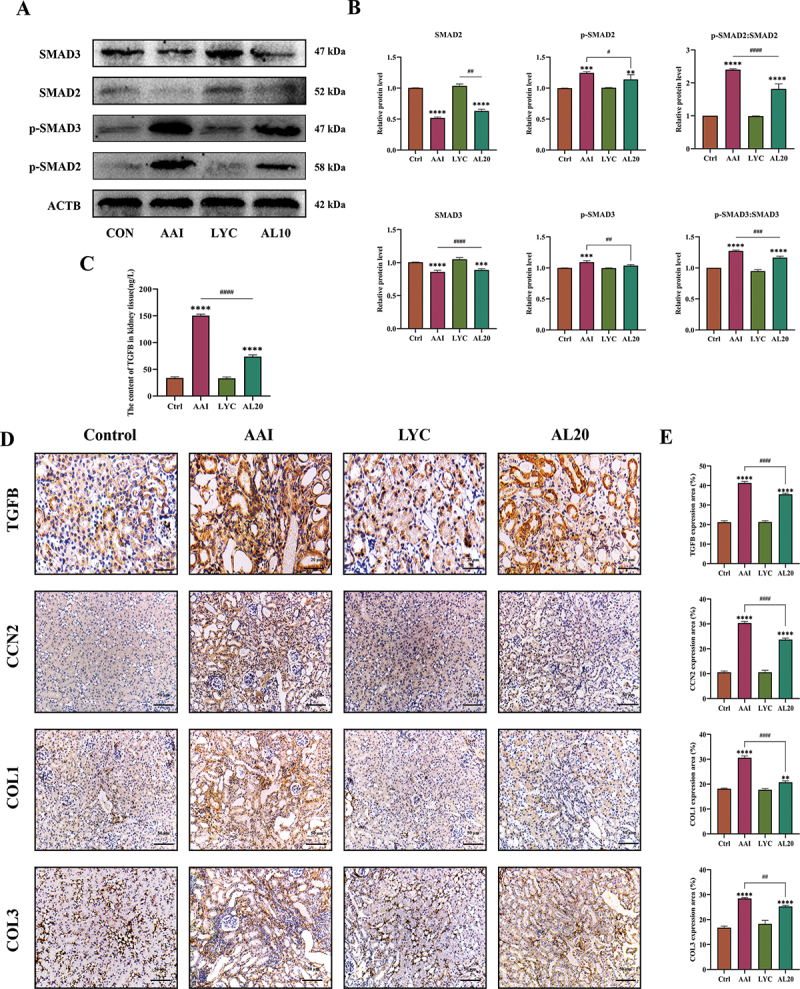
LYC affected expression of proteins involved in TGFB signaling pathway in kidney. (A-B) WB detected the expression of SMAD3, SMAD2, p-SMAD3, p-SMAD2, TGFB. (C) the content of TGFB in the interstitial fluid of the kidneys (D-C) IHC detected the expression of TGFB, CCN2, COL1, COL3 in renal tissue of mice in each group.
LYC regulates autophagy signaling in mouse kidneys
The morphological structure of renal cells in each group was observed using projection electron microscopy. The results showed that the number of autophagosomes was decreased and mitochondrial damage was severe in renal cells of AAI group compared with control group. Loss of mitochondria was characterized by swollen, vacuolated, and increased numbers of fragmented mitochondria. The number of autolysosomes increased and mitochondrial damage was relieved after LYC intervention (Figure 4A). 246 target genes of LYC were collected from PubChem database (Figure 4B). GO enrichment analysis showed that the target genes of LYC were mainly located in structures such as cytoplasm, sodium: potassium-exchanging ATPase complex, endoplasmic reticulum, mitochondrion, perinuclear region of cytoplasm, intracellular membrane-bounded organelle, phagophore assembly site and autophagosome. These genes were involved in biological functions such as negative regulation of cell proliferation, protein phosphorylation, regulation of apoptotic process, autophagosome assembly, and autophagy through molecular functions such as enzyme binding, protein binding, calcium-transporting ATPase activity, ATP binding, nucleotide binding, protein kinase activity, protein kinase binding, sodium: potassium-exchanging ATPase activity and protein serine/threonine kinase activity (Figure 4C). A total of 158 KEGG pathways were obtained by enrichment of 246 target genes of LYC (p < 0.05). Among them, the enrichment degree value of Autophagy – animal pathway is ranked in the third place, from which 28 genes enriched to this pathway are selected (Figure 4D). The results showed that the expression of MAP1LC3-II decreased, and the expression of PINK1, PRKN and SQSTM1 (sequestosome 1) increased in the renal tissue of the model group. In LYC intervention group, the expression of MAP1LC3-II was increased and the expression of PINK1, PRKN and SQSTM1 was decreased in renal tissue (Figure 4E-I). In addition, intraperitoneal injection of CQ before intragastric administration of AAI and LYC to mice significantly increased the expression of PINK1, PRKN, MAP1LC3-II, and SQSTM1 in mouse renal tissue compared with the AAI + LYC group (Figures 4H-I). These results suggested that AAI induced mitochondrial damage and inhibited mitophagy, but LYC activated mitophagy in renal tissue.
Figure 4.
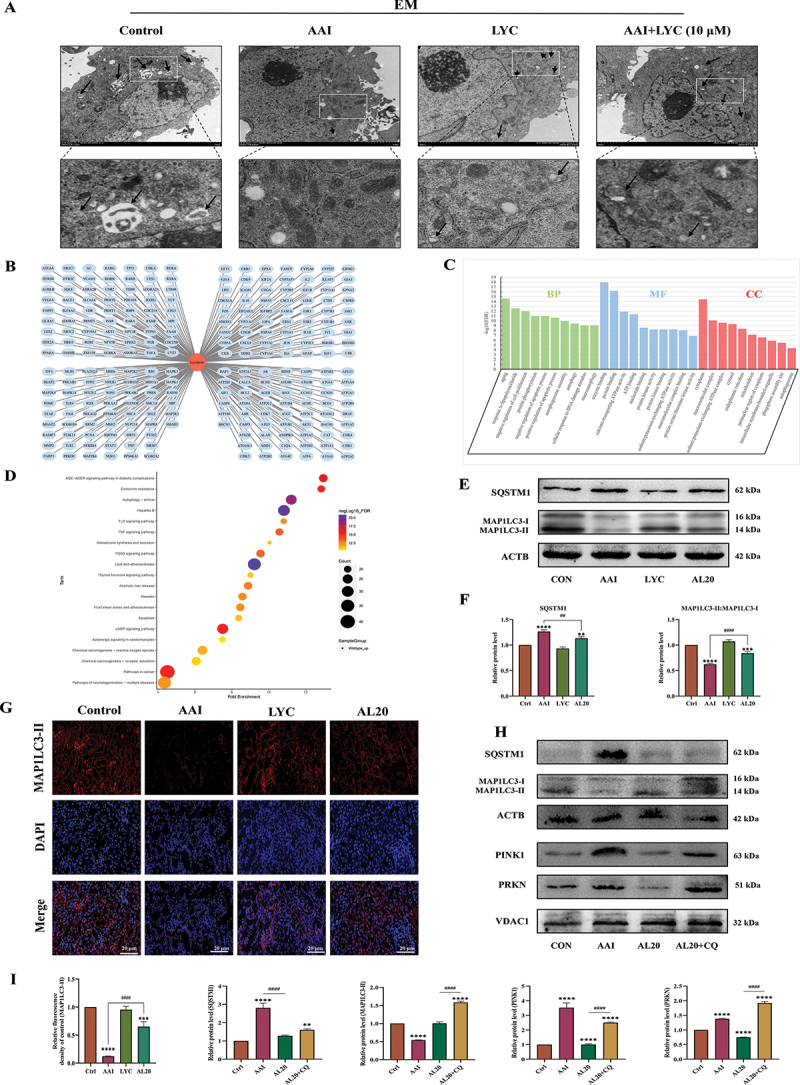
LYC affected the occurrence of autophagy and expression of autophagic flux proteins in mouse kidneys. (A) cell structure of renal cells in each group observed by transmission electron microscopy. (B) LYC-Gene target network. (C) GO enrichment analysis plot. (D) KEGG pathway enrichment analysis. (E-F) WB detected the expression of BECN1, SQSTM1, MAP1LC3-II. (G) if detected the expression of MAP1LC3-II in renal tissue of mice in each group. (H-I) WB detected the expression of BECN1, SQSTM1, MAP1LC3-II.
LYC activates mitophagy in damaged mitochondria in renal cells
The expression of BECN1 and MAP1LC3-II decreased, and the expression of PINK1, PRKN and SQSTM1 increased in the cells of the AAI group. In the LYC intervention group, the expression of BECN1 and MAP1LC3-II was increased, and the expression of PRKN, PINK1 and SQSTM1 was decreased (Figure 5A-D,5,L,5). First, the adenovirus labeled MAP1LC3-II was transfected into NRK52E cells and the cells were treated with AAI and LYC. We observed that mRFP and GFP were significantly reduced in cells after AAI induction, suggested that autophagic flux was blocked and the number of autophagosomes and autolysosomes were reduced and cellular autophagy was inhibited. In LYC + AAI group, mRFP and GFP were significantly increased. This phenomenon suggested that autophagic flux was activated, and the number of autophagosomes increased and the number of autolysosomes increased. The number of autophagosomes was significantly increased in the AAI + LYC + CQ group compared with the AAI + LYC group. The above results suggested that LYC intervention promoted autophagosome formation (Figure 5F). In order to further verify the attenuation effect of lycopene on mitochondrial damage in cells, we examined the mitochondrial membrane potential (MMP) of tubular epithelial cells in each group. The results showed that MMP and ATP content were significantly decreased in AAI group. Lycopene treatment improved the decrease of MMP and ATP content (Figure 5E,I). In addition, we added NAC to the cells for pretreatment. The results showed that SQSTM1 expression was significantly decreased and MAP1LC3-II expression was significantly increased in the cells of AAI + NAC group compared with the AAI group (Figure 5G,H). The expression of MAP1LC3-II and SQSTM1 was significantly increased after co-intervention of cells with AAI, LYC and CQ (Figure 5K,M). Similarly, the expression of MAP1LC3-II and SQSTM1 was significantly elevated in cells from the AL10 + Baf-A1 group compared to the AL10 group after intervention with Baf-A1 (Figure 5L,M). The above results demonstrated that LYC could reduce mitochondrial damage and activate mitophagy in cells (Figure 5N).
Figure 5.
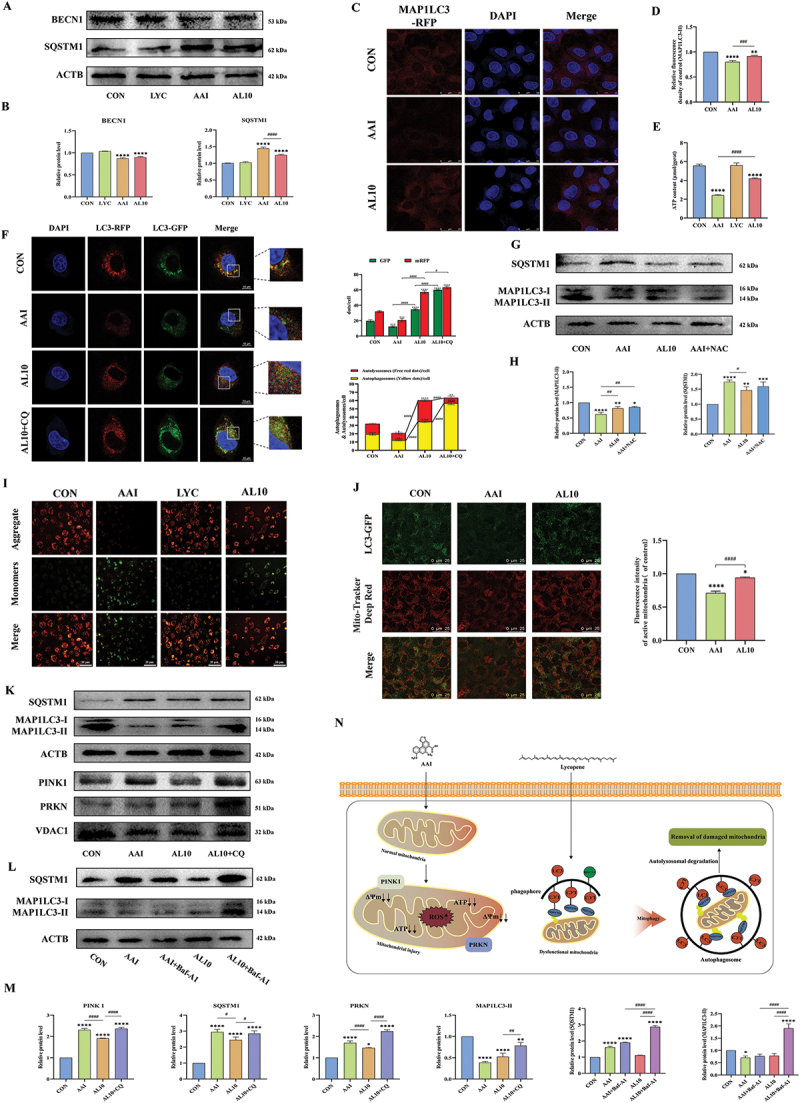
LYC activated mitophagy and ameliorated mitochondrial injury in renal tubular epithelial cells. (A-D) WB and if detected the expression of SQSTM1, BECN1, MAP1LC3-II. (E) Detection of ATP content. (F) following GFP-RFP-MAP1LC3-transfected cells, the morphology of NRK52E cells was visualized by confocal laser scanning microscopy. Yellow spots indicated autophagosomes and red spots indicated autolysosomes. (G-H) WB detected the expression of SQSTM1, MAP1LC3-II. (I) Detection of MMP. (J) the Detection of colocalization of mitochondria with MAP1LC3-II.Red fluorescence indicates active mitochondria and green fluorescence indicates labeled MAP1LC3-II protein. (K-M) WB detected the expression of SQSTM1, PRKN, PINK1, MAP1LC3-II. (N) specific action mechanism diagram.
LYC activates autophagy to inhibit EMT induced by TGFB-SMAD2-SMAD3 signaling pathway in NRK52E cells
In vitro, the results of western blot (WB) and immunofluorescence (IF) showed that the expression of TGFB, p-SMAD2:SMAD2, p-SMAD3:SMAD3, and CCN2 in NRK52E cells in the AAI intervention group were increased compared with those in control group. While the expression of these proteins in the LYC + AAI intervention group were decreased (Figure 6A,B). It further activated the expression of downstream fibrotic marker protein ACTA2 (Figure 6C,D). These results indicated that LYC is able to improve AAI-induced EMT in NRK52E cells by blocking the TGFB signal transduction pathway and the specific mechanism route is shown in Figure 6E. To verify whether the inhibitory effect of LYC on AAI-induced epithelial-mesenchymal transition in renal cells was related to its activation of mitophagy, we added the autophagy inhibitor CQ to cells in the AL10 group in vitro and examined the expression of TGFB pathway-related proteins. The results showed that although LYC was able to inhibit AAI-activated TGFB signaling pathway, the therapeutic effect of LYC was significantly attenuated after the addition of CQ. Further, the expression of TGFB, p-SMAD2:SMAD2, p-SMAD3:SMAD3, ACTA2, VIM was significantly increased and the expression of CDH1 was significantly decreased (Figure 6H,I), and p-SMAD3 was activated and incorporated into the nucleus (Figure 6F,G). The results of correlation analysis showed that there was a significant negative correlation between TGFB signaling pathway and mitophagy-related proteins (p < 0.001) (Figure 7). The above results indicated that EMT and the development of renal fibrosis are regulated by autophagy in this experiment.
Figure 6.
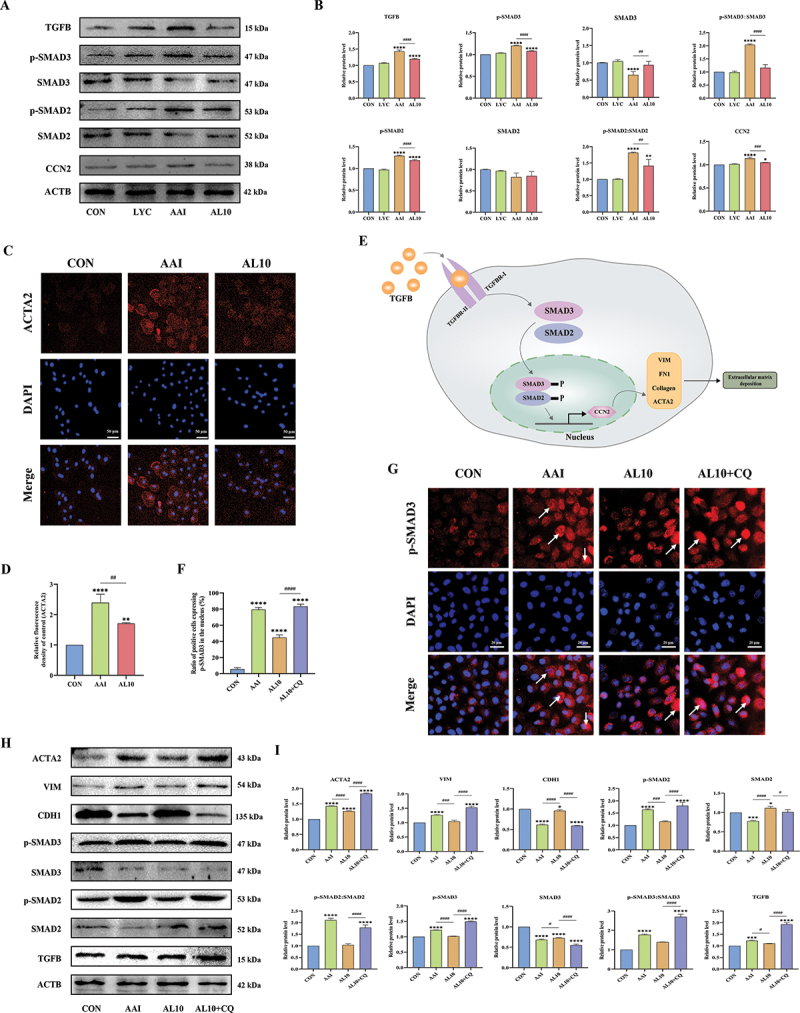
LYC alleviated renal fibrosis induced by TGFB signaling pathway through activation of mitophagy. (A-B) WB detected the expression of TGFB, p-SMAD2, p-SMAD3, CCN2. (C-D) if detected the expression of ACTA2 in NRK52E cells in each group. (E) schematic representation of TGFB signaling pathway transduction in renal cells. (F-G) if detected the expression of p-SMAD3 in NRK52E cells in each group. (H-I) WB detected the expression of ACTA2, VIM, CDH1, TGFB, SMAD3, SMAD2, p-SMAD2, p-SMAD3.
Figure 7.
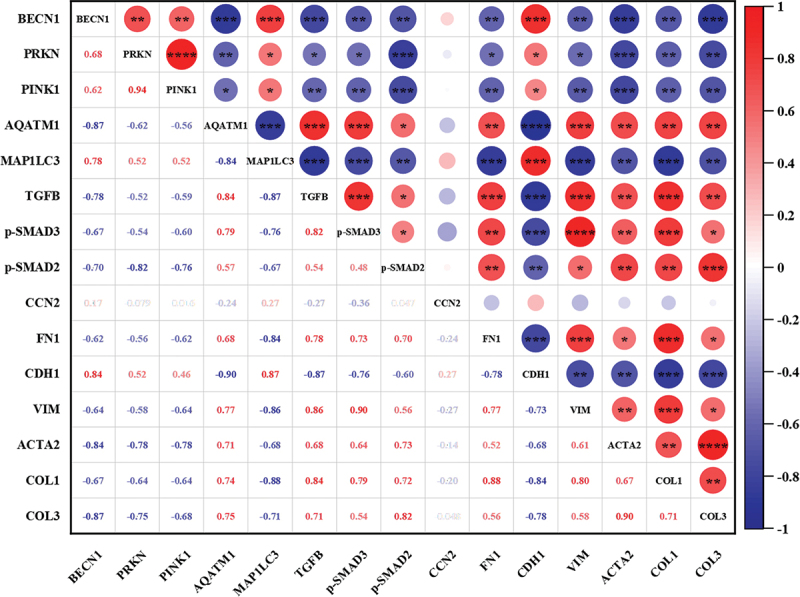
Correlation analysis between TGFB signaling pathway and mitophagy-related proteins. “Red” represented positive correlation and “blue” represented negative correlation. * indicates p < 0.05, ** indicates p < 0.01, *** indicates p < 0.001 and **** indicates p < 0.0001.
LYC activates mitophagy and inhibits EMT in renal cells by inhibiting AKT signaling
In order to further reveal the potential mechanism of LYC on autophagy function, the intersection of LYC target genes with “Autophagy” genes was taken to obtain a total of 54 gene targets. 16 hub genes in the topological network were obtained according to autophagic correlation as Atg5, Becn1, Atg7, Sqstm1, Trp53, Sirt1, Akt1, Casp3, Stat3, Mapk8, Mapk14, Casp8, Tnf, Casp9 June 2001and Mapk3. Among the numerous signaling pathways mediating cellular autophagy, there is a large correlation between AKT signaling and LYC (Figure 8A,B). In addition, molecular docking simulation experiments showed that LYC bound to the AKT active site and obtained the lowest binding energy arrangement and the best 3D molecular docking structure (Figure 8C-E). Under this structure, the lowest binding energy of AKT protein to LYC was −7.6 kcal/mol (Figure 8G). LYC can make nonbonded contacts with AKT protein in the molecular pocket, forming forces represented by electrostatic potential energy, Van der Waals force, and hydrophobic bonds (Figure 8E,F). These forces may allow both to form a tight and stable complex. The five docking results with the lowest molecular binding energy were all below −7 kcal/mol (Figure 8G). WB results showed that the expression of p-AKT:AKT, p-PI3K:PI3K, p-MTOR:MTOR was significantly increased in the kidney of mice in the model group compared with the normal group, but the expression of these proteins decreased after LYC intervention (Figure 8H,I). To determine whether LYC mediates mitophagy and EMT by inhibiting AKT signaling, we activated and inhibited AKT signaling in cells. Cells viability decreased at 4 μM SC79 and 5 μg/ml GSK-690693, but was not different from controls (Figure 9A,B). The optimal concentrations of the two interventions were selected. Compared with the AAI group, the expression of BECN1 was increased, and the expression of p-AKT, SQSTM1, p-SMAD2:SMAD2, p-SMAD3:SMAD3, and COL3 was decreased, reactive oxygen species (ROS) content was reduced, and MMP was increased in the AAI + GSK-690693 group cells. Compared with the AAI + LYC intervention group, the expression of PINK1, PRKN, BECN1, and MAP1LC3-II decreased, and the expression of p-AKT:AKT, SQSTM1, p-SMAD2, p-SMAD3, and COL3 increased, the ROS content increased, and the MMP decreased in the AAI + LYC + SC79 group cells (Figure 9C-L). The above results indicated that LYC activates mitophagy by inhibiting AKT signaling pathway and inhibits EMT in renal cells and improves the process of renal fibrosis.
Figure 8.
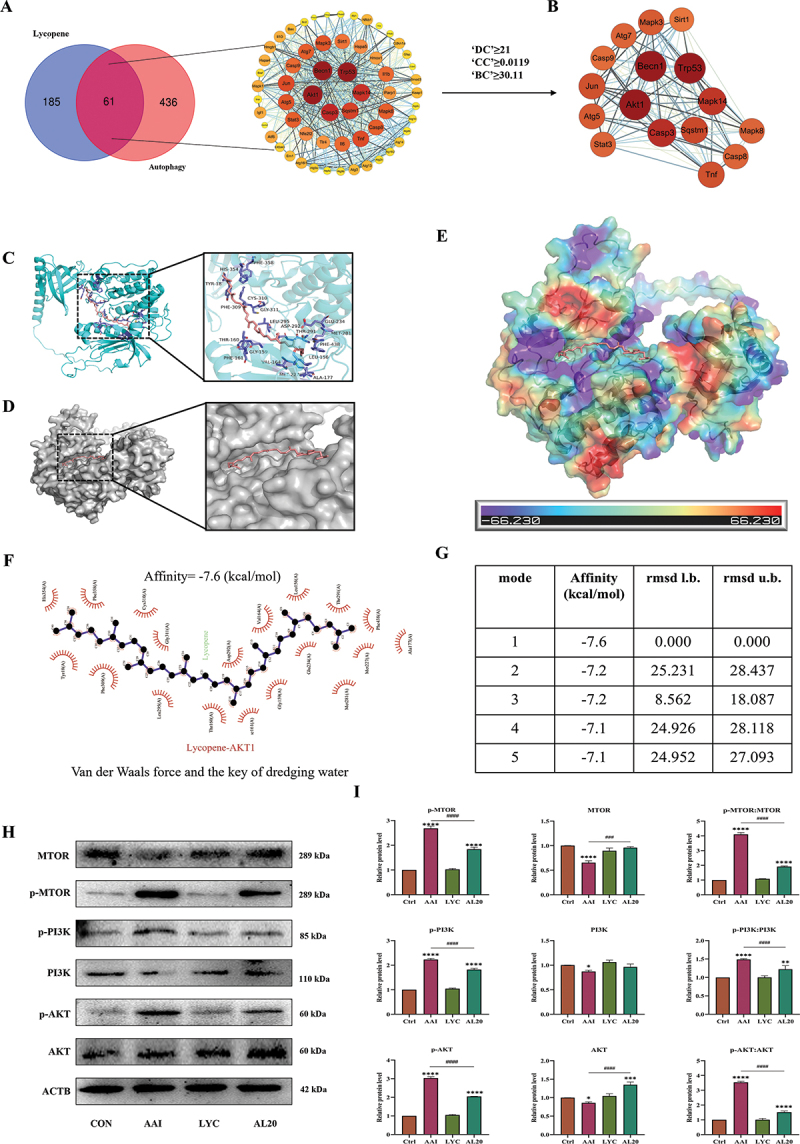
Effect of LYC on regulation of AKT signaling pathway. (A-B) hub genes were obtained by PPI topological network. (C) three-dimensional structure of LYC-AKT molecular docking. (D) LYC is located within the molecular pocket of AKT protein. (E) surface electrostatic forces of LYC-AKT. (F) two-dimensional structure of LYC-AKT. (G) Alignment of lowest binding energy for molecular docking of LYC-AKT. (H-I) WB detected the expression of MTOR, p-MTOR, PI3K, p-PI3K, AKT, p-AKT.
Figure 9.
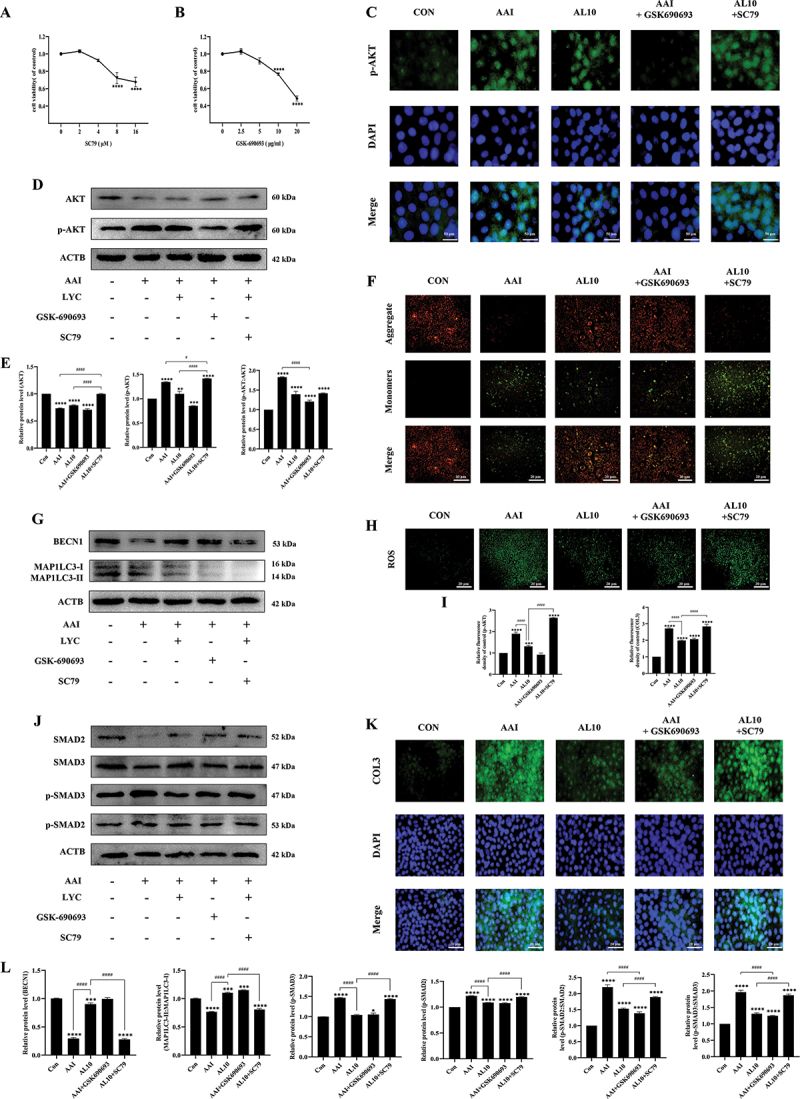
Effect of LYC on autophagy and EMT by inhibiting AKT signaling pathway. (A-B) Detection of cell viability in cells treated with different concentrations of SC79 and GSK690693 for 24 h. (C) if detected the expression of p-AKT in NRK52E cells in each group. (D-E) WB detected the expression of AKT, p-AKT. (F) Detection of MMP. (G, J, L) WB detected the expression of SMAD3, SMAD2, p-SMAD2, p-SMAD3, BECN1, MAP1LC3-II. (H-I) Detection of ROS content. (K) if detected the expression of COL3 in NRK52E cells in each group.
Discussion
Inflammatory pathways are initiated and a large number of inflammatory cells are recruited to the renal interstitium when kidney injury occurs in the body, which leads to increased secretion of proinflammatory cytokines and chemokines [31] and activation of profibrotic cells. This incomplete or persistent signal can precipitate fibrosis in the kidney [32,33]. While it has been shown in recent studies that the pathogenicity of AAI is closely related to the potential progression of renal fibrosis [34,35]. LYC is a dietary carotenoid with strong high antioxidant capacity mainly present in tomatoes and other red fruits [36]. Previously, we demonstrated that LYC alleviated AAI-induced inflammatory response and apoptosis by activating the antioxidant system. While studies have shown that the inflammatory response plays a critical role in chronic renal fibrosis disease [37,38]. Therefore, in this study, we proposed for the first time whether LYC can slow down the progression of AAI-induced renal fibrosis. The results of this study demonstrated that LYC intervention ameliorated AAI-induced collagen fibril deposition in mouse kidney, and renal function was restored and urine color was nearly normal. We further explored the specific mechanism by which LYC slows down the development of renal fibrosis.
Fibrosis is mainly driven by ACTA2-positive myofibroblasts [39], which produce excess ECM and eventually develop into organ dysfunction and death [40]. EMT refers to the process of transdifferentiation of epithelial cells into motile mesenchymal cells, and pathologically EMT is able to promote the progression of fibrosis and cancer [41], mainly characterized by changes in cell morphology, reduced or lost CDH1, and up-regulation of VIM, ACTA2 and FN1 expression [42]. It has been shown that AAI is able to continuously induce tubular epithelial cell redifferentiation and promote the EMT process and renal interstitial fibrosis [31]. TGFB family signaling plays a major role in the process of EMT [43]. When the TGFB signaling pathway is activated, regulatory SMADs (SMAD2 and SMAD3) are recruited to TGFBR (transforming growth factor beta receptor) and activate their phosphorylated forms, and translocate to the nucleus, while activating CCN2 transcription [44], transactivating the expression of downstream pro-fibrotic proteins [45], and further promoting the development of fibrosis. The results of this study demonstrated that LYC inhibited AAI-induced activation of TGFB signaling pathway and alleviated the occurrence of EMT, mainly manifested as decreased expression of ACTA2 and fibrosis marker proteins (FN1, CDH1, VIM) in kidney and NRK52E cells, as well as decreased deposition of COL1 and COL3. These results showed that LYC slowed the development of AAI-induced fibrosis in mice by acting on the TGFB signaling pathway.
The process of autophagy includes the formation of phagocytic vacuoles, the formation of autophagosomes, the combination of autophagosomes and lysosomes to form autolysosomes, and the degradation of autolysosomes, which are tightly regulated by different signaling pathways [46]. BECN1 is one of the most important autophagy-related proteins (ATGs) and is involved in the formation and maturation of autophagosomes [47]. Mitophagy refers to the selective autophagy and degradation of damaged mitochondria when the body recognizes damaged mitochondria [48]. PINK1 and PRKN are critical mediators of mitophagy. When mitochondrial damage such as MMP aberrations or excessive accumulation of unfolded mitochondrial proteins occurs, PINK1 accumulates outside the damaged mitochondrial membrane and recruits PRKN [49], which subsequently ubiquitinates extensive mitochondrial outer membrane proteins [50]. Ubiquitinated mitochondria associate with autophagosome formation sites and are selectively incorporated into autophagosomes [51]. When mitophagy occurs, SQSTM1 binds to ubiquitinated proteins and then forms a complex with MAP1LC3-II proteins localized on membranes in autophagic bodies [52]. Damaged mitochondria at this time depend on MAP1LC3 being incorporated into autophagosomes. We found that LYC intervention alleviated AAI-induced mitochondrial damage and dysfunction in renal cells. In this experiment, we first demonstrated a close relationship between LYC and autophagy by GO enrichment analysis and KEGG pathway enrichment analysis. The mechanism is associated with various pathways such as the formation of autophagosomes or pre-autophagosome structures as well as improving mitochondrial function. In addition, antioxidants NAC and LYC were consistently effective in AAI-induced cellular effects, but LYC was more effective, so LYC regulation of mitophagy may be based on its antioxidant properties. AAI intervention suppressed autophagosome formation and reduced the number of autophagosomes and blocked autophagic flux in cells. Autophagy pathway proteins were significantly elevated following LYC intervention.
Baf-A1 is an intervening agent capable of inhibiting the fusion of autophagosomes with autolysosomes, thereby inhibiting late autophagy. CQ is an inhibitor of autophagy and toll-like receptors (TLRs) with anti-malarial, anticancer and anti-inflammatory activities. Previously, the results showed that CQ was metabolized to renal tissue and mainly existed in the distal nephron [53]. It has been shown that the nephrotoxicity of AAI mainly acts on the distal renal tubules. Our results showed that MAP1LC3-II and SQSTM1 expression was further increased in cells after the addition of Baf-A1 and CQ, when LYC did not attenuate the promoting effect on autophagosome formation. This study showed that LYC intervention may activate autophagy by promoting the formation of autophagosomes, increasing the number of autolysosomes and promoting the conversion of autophagosomes to autolysosomes, then phagocytose a large number of damaged organelles, restore mitochondrial function and alleviate nephrotoxicity.
Basal autophagy in kidney cells plays an important role in maintaining renal homeostasis, structure, and function [54]. Autophagy has been demonstrated to prevent the concomitant pathogenesis and progression of apoptosis, inflammation and immune response in various diseases. There has been increasing evidence that impaired autophagy is associated with the pathogenesis of fibrosis [55]. Eicosapentaenoic acid is able to attenuate lipotoxicity-induced renal fibrosis by restoring autophagic flux [56]. In this experiment, we first demonstrated that LYC was able to activate mitophagy in renal cells. And we verified that LYC could ameliorate renal fibrosis by slowing the progression of renal EMT through acting on the TGFB signaling pathway. But the link between the two pathways of action is not clear. We examined the expression of fibrotic marker proteins and TGFB signaling pathways in NRK52E cells treated with both AAI and LYC by adding the autophagy inhibitor CQ. The results showed that inhibition of autophagy weakened the attenuation effect of LYC on fibrosis. Following inhibition of autophagy levels in renal cells, TGFB signaling was reactivated and fibrotic markers were elevated. Therefore, our results suggested that the alleviating effect of LYC on AAI-induced renal fibrosis is closely related to the activation of mitophagy in renal cells.
PI3K is an intracellular phosphatidylinositol kinase that is regulated by a variety of growth factors and is able to mediate autophagy and apoptosis, cell proliferation and differentiation, and cell membrane vesicle transport [57]. AKT is a major regulator of cell survival under stress conditions, and it regulates not only nutrient intake but also growth factor expression [58]. The PI3K-AKT-MTOR signaling pathway has emerged as an important regulatory pathway upstream of autophagy [59]. Some traditional pharmaceutical ingredients such as curcumin and sinomenine can exert important anticancer effects by blocking the PI3K-AKT-MTOR pathway [60]. Following stimulation by various growth factors, transmembrane receptors such as receptor tyrosine kinases (RTKs) undergo autophosphorylation resulting in activation of PI3K at the plasma membrane. Activated PI3K catalyzes the production of the second messenger PIP3 [61]. When PIP3 is activated, PIP33 is produced at the plasma membrane and binds to AKT, prompting the transfer of AKT from the cytoplasm to the inner membrane for phosphorylation and activation [62]. The p-AKT initiates the downstream effector MTOR (mechanistic target of rapamycin kinase) and can act directly on RPS6KB1 (ribosomal protein S6 kinase, polypeptide 1) and RPS6KB2, EIF4EBP (eukaryotic translation initiation factor 4E binding protein), and other proteins involved in translational regulation, thereby initiating protein synthesis, transcription and autophagy [63]. Activation of MTOR and the MTOR complex formed through AKT (MTORC1) ultimately prevent the formation of the ULK1 complex [64], which in turn negatively regulates cellular autophagy. To verify whether LYC could directly act on the AKT pathway, we used molecular docking approach to verify LYC could bind to AKT protein to form a stable structure and the conjugate is stable. In addition, the results of this study demonstrated that LYC intervention was able to inhibit AAI-induced activation of AKT signaling pathway in the kidney. AKT signaling pathway was being inhibited before AAI intervention in cells, and autophagy-related protein expression was elevated in renal cells. At this time, mitophagy was activated and EMT was inhibited. Showed that the effect of autophagy inhibitors was consistent with that of LYC. But the activation of mitophagy and inhibition of TGFB signaling pathway by LYC were weakened by adding AKT activator. Accumulation of collagen and ROS in cells was excessive and aggravated the extent of oxidative damage and fibrosis. The above results indicated that AKT is the main target of LYC in mediating mitophagy and EMT in renal cells to improve the development of AAI-induced renal fibrosis.
Conclusion
This study showed that LYC intervention was able to activate autophagy and slow AAI-induced renal fibrosis. The main mechanism is that LYC activates mitophagy by inhibiting the AKT signaling pathway. LYC promoted the generation of autophagosomes and then induces phagocytosis of injured mitochondria, ultimately maintaining tubular epithelial cell homeostasis, and inhibits the transduction of SMAD2 and SMAD3 signaling pathways. Our data provide a novel therapeutic idea for targeting to regulate mitophagy to ameliorate CKD. LYC is expected to be a protective agent against chronic drug-induced renal fibrosis. (Schematic diagram of specific mechanism of action in this study, as shown in Figure 10)
Figure 10.
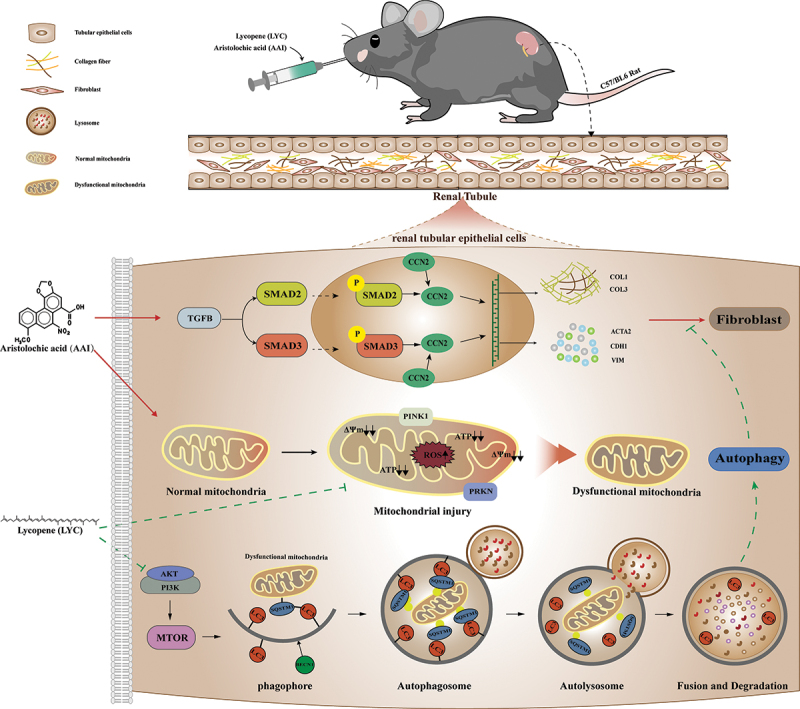
The mechanism of LYC inhibited AKT signaling pathway to activate autophagy and ameliorate TGFB-induced renal fibrosis.
Materials and methods
Animal experiment and grouping
All animal experiments were approved by the Animal Ethics Committee of Northeast Agricultural University. SPF C57BL/6 male mice aged 6 weeks and weighing (18–20 g) were purchased for this experiment. Experimental mice were adaptively fed for one week prior to the experiment. Mice were maintained under conditions of temperature 21°C − 23°C, humidity 35% − 65%, and 12 h light. SPF grade mouse growth and breed standard diet was provided and purchased from Liaoning Changsheng Biotechnology (Liaoning Changsheng Biotechnology Company, Benxi, Liaoning, China). The reagents used in this study are listed in Table 1.
Table 1.
Antibodies and other reagents.
| Antibodies and reagents | Manufacturers, Product No. |
|---|---|
| Antibodies for western blot | |
| Rabbit anti-BECN1 (1:1000) | Bioss, bsm -33,323 M |
| Rabbit anti-MAP1LC3/LC3 (1:1000) | Wanleibio, WL01506 |
| Rabbit anti-SQSTM1/p62 (1:1000) | Wanleibio, WL02385 |
| Rabbit anti-PINK1 (1:1000) | Wanleibio, WL04963 |
| Rabbit anti-PRKN (1:1000) | Wanleibio, WL02512 |
| Rabbit anti-TGFB/TGF-β (1:1000) | Wanleibio, WL02998 |
| Rabbit anti-ACTA2/α-SMA (1:1000) | Bioss, bs -10,196 R |
| Rabbit anti-p-SMAD2 (1:1000) | Bioss, bs -24,530 R |
| Rabbit anti-p-SMAD3 (1:1000) | Bioss, bs-5235 R |
| Rabbit anti-CCN2/CTGF (1:1000) Rabbit anti-VIM (1:1000) Rabbit anti-CDH1/E-Cadherin (1:1000) |
Wanleibio, WL02602 Wanleibio, WL01960 Wanleibio, WL01482 |
| Rabbit anti-p-AKT (1:1000) Rabbit anti-p-PI3K (1:1000) Rabbit anti-p-MTOR (1:1000) Rabbit anti-VDAC1 (1:1000) Rabbit anti-ACTB/β-actin (1:10000) |
ABclonal, AP0140 ZBNBIO 340,790 Wanleibio, WL03694 Bioss, bsm -52,251 R Bioss, bs-0061 R |
| Antibodies for Immunohistochemistry Rabbit anti-ACTA2 (1:200) Rabbit anti-CDH1 (1:400) Rabbit anti-FN1 (1:400) Rabbit anti-TGFB1/TGF-β1 (1:400) Rabbit anti-CCN2/CTGF (1:400) Rabbit anti-COL1 (1:400) Rabbit anti-COL3 (1:400) Goat anti-rabbit HRP antibody Histochemical reagent kit DAB chromogenic agent |
Wanleibio, WL02510 ABclonal, A11509 Wanleibio, WL00712a ABclonal, A16640 ABclonal, A11456 ABclonal, A1352 Wanleibio, WL03186 Servicebio, GB23303 Servicebio, G1211 |
| Antibodies for Immunofluorescence Rabbit anti-MAP1LC3/LC3-II (1:100) Rabbit anti-ACTA2 (1:100) Rabbit anti-p-SMAD3 (1:200) Rabbit anti-TGFB/TGF-β (1:200) Goat Anti-rabbit IgG/FITC antibody |
ABclonal, A5618 Bioss, bs -10,196 R Bioss, bs-5235 R ABclonal, A16640 Bioss, bs-0295 G-FITC |
| Aristolochic acid I Lycopene (B20378) Chloroquine High-glucose DMEM Fetal bovine serum Penicillin-streptomycin-gentamicin solution PBS DMSO Mitochondrial Extraction Kit DAPI staining solution (BL105A) SC79 GSK-690693 Epoxide resin NAC Bafilomycin A1/Baf-A1 Ad-GFP-LC3B Mitochondrial membrane potential assay kit with JC-1 Mito-Tracker Deep Red FM Protease inhibitors Phosphatase inhibitors BCA Protein Assay Kit Reactive oxygen species Assay Kit |
Dasfbio, 220311ZW Yuanye, B20378 AbMole, M9559 HyClone, SH30022.01 Wohong, WHRTNA101–1 Solarbio, P1410 Meilun, MA0015 Amresco, 0231 Solarbio, SM0020 Biosharp, BL105A MCE 305,834-79-1 MCE 937,174-76-0 Macklin, E871955 AbMole, M5385 AbMole, M4953 Beyotime, C3006 Beyotime, C2006 Beyotime, C1032 Sigma-Aldrich 04,693,116,001 Sigma-Aldrich 04,906,837,001 Meilun, MA0082 Nanjing jiancheng, E004-1-1 |
Our previous results demonstrated that AAI and LYC were metabolized and disappeared from the kidney at 2 h and 8 h, respectively. Parallel administration of AAI and LYC did not affect the absorption of AAI by kidney and the establishment of aristolochic acid nephropathy models. The mice were randomly divided into 5 groups: control group: (Ctrl), model group (AAI 10 mg/kg/day): (AAI), LYC control group (LYC 20 mg/kg/day): (LYC), LYC intervention group (AAI 10 mg/kg/day + LYC 20 mg/kg/day): (AL20) and CQ intervention group (AAI 10 mg/kg/day + LYC 20 mg/kg/day + CQ 20 mg/kg): (AL20+CQ). AAI was administered at 8:00 am, LYC was administered at 13:00 pm, and 0.5% CMC vehicle was administered to all other mice. CQ was injected intraperitoneally into mice. The administration route and dosage refer to our previous studies and reports. The model was established for 28 days.
Histopathologic observation of kidney
Mice were euthanized after 28 days of continuous administration. Serum and kidneys were collected. Collected urine and kidneys were photographed. Paraformaldehyde-fixed kidneys (fixed for approximately 24 h) were dehydrated in ethanol with increased concentration, bis-affinity with xylene, and embedded in liquid paraffin. Kidney tissue blocks were cut into 3 μm thicknesses with a microtome. Then, hematoxylin-eosin (HE) and Masson staining were performed for evaluation under a light microscope. Collagen deposition in kidney tissue sections after Masson staining was quantitatively analyzed.
Immunohistochemical assays (IHC)
Sections of 5 μm thick kidney tissue were deparaffinized using xylene and rehydrated in graded alcohols. Non-specific epitopes were blocked with rabbit serum within 30 min and subsequently incubated overnight with primary antibody (ACTA2, COL1, COL3, CCN2, CDH1, FN1 and TGFB) in a humidified chamber at 4°C. Sections were incubated for 50 min with HRP-labeled secondary antibodies of the same species, washed with PBS and dropped with freshly prepared DAB chromogen solution. Observed under a microscope, when the positive was brownish-yellow, the color development was terminated by rinsing the sections with tap water, and the nuclei were counterstained with hematoxylin for 3 min, dehydrated and mounted. Pictures were collected for quantitative analysis of positive staining.
Cell culture
The renal tubular duct epithelial cells of rat (NRK52E) were purchased from Shanghai Cell Bank, Chinese Academy of Sciences. NRK52E cells were cultured in DMEM medium containing 10% FBS, 100 U/mL penicillin, and streptomycin at 37°C in a 5% CO2 incubator. For cell experiments, NRK52E cells in logarithmic growth phase were divided into 8 groups, control group: (CON), AAI group: (AAI), AAI (40 μM) + LYC (10 μM) group: (AL10), AAI (40 μM) + LYC (10 μM) + CQ (5 ng/mL) group: (AL10+CQ), AAI (40 μM) + Baf-A1 (5 μM) group: (AAI+Baf-A1), AAI (40 μM) + LYC (10 μM) + Baf-A1 (5 μM) group: (AL10+Baf-A1), AAI (40 μM) + NAC (2 mM) group: (AAI+NAC). Cells were pretreated with the CQ (5 ng/mL) before being treated with AAI and LYC. After 24 h of treatment, the cells were harvested to determine the related parameters.
Cell viability testing
Renal tubular epithelial cells (NRK52E cell line derived from Shanghai Cell Bank, Chinese Academy of Sciences) were cultured as described previously [35]. Cytotoxicity was detected using CCK-8 assay kit (Bio sharp, BS350B). Cells were plated at a density of 8000 cells/well in 96-well plates. After incubation with SC79 (0, 2, 4, 8, 16 μM) and GSK-690693 (0, 2.5, 5, 10, 20 μg/ml) for 24 h, 10% CCK-8 solution diluted in serum-free DMEM was added to each well. OD values were determined using a microplate reader (Biotek, MQX200, Winooski, VT, USA) after incubation at 37°C for 2 h. The optimal SC79 and GSK-690693 concentrations were selected for subsequent experiments.
Cell viability (%) = (OD sample-OD blank)/(OD control-OD blank)×100%.
Transmission electron microscopy
The digested cells were centrifuged at low speed and fixed with 2.5% glutaraldehyde buffered fixative and 1% osmic acid fixative, respectively, and the ethanol in the sample was replaced with acetone after gradient dehydration of the sample with graded ethanol. Cells were then infiltrated into epoxy resin and embedded. Ultrathin sections of 50–60 nm were prepared. Organelles were observed under a transmission electron microscope.
Immunofluorescence (IF)
Kidney tissue slices (3 μm) were deparaffinized, and the cells in each group were preliminarily treated with the relevant reagents. Sections and cells were then incubated with the corresponding primary antibodies and fluorescence-conjugated secondary antibodies for MAP1LC3-II, ACTA2, COL1, FN1, p-SMAD3 for IF staining, and nuclei were stained with DAPI. Sections or cells were observed using a fluorescence microscope and images were taken blindly in random fields.
Detection of mitochondrial membrane potential (MMP)
MMP was measured using a MMP assay kit (JC-1) (Beyotime, C2006). The cells were evenly inoculated into a six-well plate, and after 24 h of drug intervention, the cells were washed once with PBS, 1 mL of cell culture medium and 1 mL of JC-1 staining working solution were added and mixed thoroughly. After incubation in a 37°C. Cell incubator for 20 min, the supernatant was removed, washed twice with JC-1 staining buffer (1×), 2 mL of cell culture medium was added, and images were observed and taken under the fluorescence microscope [65].
Detection of ATP content
ATP content was detected using a kit (Nanjing jiancheng Bioengineering Institude, A095-1-1). The cells incubated with the drug were centrifuged at 300 × g for 15 min, then the culture medium was discarded and the cells were collected to detect the protein concentration of the cells in each group. Pretreatment of samples was performed according to the instructions in the ATP assay kit. Absorbance values of each group were measured using a UV spectrophotometer at 636 nm with an optical diameter of 0.5 cm. The ATP content in each group of cells was calculated by substituting the formula in the instructions.
Western blot (WB)
Kidney tissue or cells were lysed with pre-chilled RIPA buffer. Protease inhibitors and phosphatase inhibitors were added to prevent degradation. Following sonication, lysates were centrifuged at 12,000 × g for 10 min. Protein levels were assessed using the BCA assay. Equal amounts of protein samples were separated by SDS-PAGE and then transferred to PVDF membranes. Membranes were blocked using 5% milk for 1 h and incubated overnight at 4°C with primary antibodies: PRKN (1:1000), PINK1 (1:1000), MAP1LC3 (1:1000), SQSTM1 (1:1000), BECN1 (1:1000), p-SMAD2 (1:1000), p-SMAD3 (1:1000); ACTA2 (1:1000), TGFB1 (1:1000), CCN2 (1:1000); CDH1 (1:1000). Finally, color development was performed using western ECL solution in a gel imaging system, and image analysis was performed using ImageJ software for densitometric analysis (relative protein expression = target protein gray value:ACTB/β-actin gray value).
Determination of ROS content in cells
Intracellular ROS were measured in NRK52E cells using DCFH-DA fluorescent probe. The drug-incubated cells were incubated with DCFH-DA (10 μM) for 30 min in a light-protected humidified chamber. Fluorescence images were acquired at the same parameters and fluorescence signals were quantified using Image-Pro Plus software (Version 3.0, Media Cybernetics, Bethesda, MD, USA).
Network construction and function analysis
LYC (CAS: 502-65-8) was queried by PubChem (https://pubchem.ncbi.nlm.nih.gov/), gene targets of LYC were collected, a LYC-gene target database was established, and a network diagram was constructed by Cytoscape 3.9.1 software [66]. GO functional (cellular function, molecular function, and biological function) enrichment analysis and KEGG pathway enrichment analysis (accessed on 29 March 2022) were performed on the collected gene targets using the David database (https://david.ncifcrf.gov/) (p < 0.05 indicates significant differences) [67]. The disease or functional gene targets were queried through the GeneCards database (https://www.genecards.org/) with the keyword “Autophagy”. A total of 7923 related gene targets were obtained, and 497 related genes were selected using the correlation coefficient “Relevance score ≥ 2.80616”. Enter targets into STRING database (https://cn.string-db.org/), predicted protein-protein interactions (PPI) [68], with confidence scores > 0.9. The above results were imported into Cytoscape 3.9.1 software for visualization and core topology networks were filtered using Centiscape. hub genes were selected by combining the gene network with the angiogenesis correlation coefficient “Relevance score” in GeneCards.
Molecular docking
Genes AKT were queried in the Uniprot database (https://www.uniprot.org/) to select the appropriate AKT protein structure. 3D structure files in PDB format for AKT protein were downloaded from the RCSB PDB database(https://www.rcsb.org/). 3D structure files in SDF format for LYC (CAS502-65-8) were downloaded in PubChem database (https://pubchem.ncbi.nlm.nih.gov/). SDF format files were converted to PDB format files via Open Babel 3.1.1. AKT was subjected to simulated molecular docking with LYC using AutoDockTools 1.5.6 and AutoDock Vina software. 2D structures were visualized using LigPlus and electrostatic potential energy and 3D structures were visualized by PyMoL 2.3.0.
Detection of autophagic flux by autophagy double-labeled adenovirus (mRFP-GFP-MAP1LC3)
An NRK52E cell suspension (500 μl) at a concentration of 105 cells/ml was added to a 15-mm confocal laser scanning plate and cultured in 37°C incubator with 5% CO2 for 2 h. Medium (1.5 ml) was added when the cells adhered. Cells were infected with 2.5 × 10⁷ adenoviruses. After 24 h, NRK52E cells were simultaneously treated with AAI and LYC for 24 h. Cells were fixed using 4% paraformaldehyde, counterstained with DAPI and observed and photographed under a confocal laser scanning microscope. The intensity of autophagic flow was analyzed by counting different color spots. The number of yellow and red spots after superposition was counted manually and bar graphs were made.
Mitochondria colocalize with MAP1LC3 first in cell culture
NRK52E cells were seeded at a density of 5 × 10⁵ cells/well in 15 mm confocal laser scanning dishes the day before infection (the specific number of inoculations was determined by cell size and cell growth rate). Two milliliters of complete culture medium were added to each plate. The following day, when the cell density reached about 50% during virus infection, the plate was removed from the cell incubator. Culture medium containing 2.5 × 10⁷ adenoviruses was added to each plate, respectively. After 24 hours of infection, NRK52E cells were treated with AAI and LYC. After 24 h of drug intervention, bioactive mitochondria were specifically labeled using the Mito-Tracker Deep Red FM kit (C1032). Observed and photographed under a confocal laser scanning microscope.
Mitochondrial extraction
Mitochondria were extracted from kidney tissue and cells using a mitochondrial extraction kit. First prepare tissue homogenate. Weigh 100–200 mg of kidney tissues, such as liver, brain, myocardium, etc., rinse with PBS or normal saline, wash the blood water, dry with filter paper, cut into pieces with scissors and place into a small volume glass homogenizer. One mL ice-cold Lysis Buffer was added, and the tissue was ground up and down in an ice bath at 0°C for 20 times; the cells were digested, washed with PBS, and collected by centrifugation at 800 × g for 5–10 min and counted. Each extraction required 5 × 10⁷ cells, 1 ml of ice-cold Lysis Buffer was added to resuspend the cells, and the cell suspension was transferred to a small volume glass homogenizer and ground in an ice bath at 0°C for 30–40 times. Mitochondria were extracted from tissues and cells following the steps of the kit instructions. The extracted mitochondria could be used immediately or dispensed and stored at −70°C to avoid repeated freezing and thawing. Mitochondrial proteins were subsequently extracted following the extraction method for total proteins.
Statistical analysis
All experimental data were analyzed using ImageJ, Graph-Pad Prism 8.0.2, and SPSS 22.0, and repeated independent assays were performed. Data are presented as mean ± SD, and one-way analysis of variance and Duncan’s multiple comparison method were used to test the differences among the groups of data, and p < 0.001 was considered statistically significant. Pearson correlation (PCC) was performed using Origin 2021.
Acknowledgements
This study was financially supported by the National Natural Science Foundation of China (Grant No: 32072909).
Funding Statement
The work was supported by the National Natural Science Foundation of China [32072909].
Disclosure statement
No potential conflict of interest was reported by the author(s).
Data availability statement
The data supporting the findings of this study are available within the article [and/or] its supplementary materials.
References
- [1].Li X, Pan J, Li H, et al. DsbA-L mediated renal tubulointerstitial fibrosis in UUO mice. Nat Commun. 2020;11(1):4467. doi: 10.1038/s41467-020-18304-z [DOI] [PMC free article] [PubMed] [Google Scholar]
- [2].Liu M, Liu T, Shang P, et al. Acetyl-11-keto-β-boswellic acid ameliorates renal interstitial fibrosis via Klotho/TGF-β/Smad signalling pathway. J Cell Mol Med. 2018;22(10):4997–5007. doi: 10.1111/jcmm.13766 [DOI] [PMC free article] [PubMed] [Google Scholar]
- [3].Li X, Zhuge Z, Carvalho LRRA, et al. Inorganic nitrate and nitrite ameliorate kidney fibrosis by restoring lipid metabolism via dual regulation of AMP-activated protein kinase and the AKT-PGC1α pathway. Redox Biol. 2022;51:102266. doi: 10.1016/j.redox.2022.102266 [DOI] [PMC free article] [PubMed] [Google Scholar]
- [4].Jadot I, Declèves A-E, Nortier J, et al. An integrated view of aristolochic acid nephropathy: update of the literature. Int J Mol Sci. 2017;18(2):297. doi: 10.3390/ijms18020297 [DOI] [PMC free article] [PubMed] [Google Scholar]
- [5].Kim JY, Leem J, Jeon EJ.. Protective effects of Melatonin against aristolochic acid-induced nephropathy in mice. Biomolecules. 2019;10(1):11. doi: 10.3390/biom10010011 [DOI] [PMC free article] [PubMed] [Google Scholar]
- [6].Zeisberg M, Hanai J-I, Sugimoto H, et al. BMP-7 counteracts TGF-β1–induced epithelial-to-mesenchymal transition and reverses chronic renal injury. Nat Med. 2003;9(7):964–968. doi: 10.1038/nm888 [DOI] [PubMed] [Google Scholar]
- [7].Jin B, Zhu J, Zhou Y, et al. Loss of MEN1 leads to renal fibrosis and decreases HGF-Adamts5 pathway activity via an epigenetic mechanism. Clin Transl Med. 2022;12(8):e982. doi: 10.1002/ctm2.982 [DOI] [PMC free article] [PubMed] [Google Scholar]
- [8].Liu L, Bai F, Song H, et al. Upregulation of TIPE1 in tubular epithelial cell aggravates diabetic nephropathy by disrupting PHB2 mediated mitophagy. Redox Biol. 2022;50:102260. doi: 10.1016/j.redox.2022.102260 [DOI] [PMC free article] [PubMed] [Google Scholar]
- [9].Song MK, Lee J-H, Ryoo I-G, et al. Bardoxolone ameliorates TGF-β1-associated renal fibrosis through Nrf2/Smad7 elevation. Free Radic Biol Med. 2019;138:33–42. doi: 10.1016/j.freeradbiomed.2019.04.033 [DOI] [PubMed] [Google Scholar]
- [10].Kopp JB, Factor VM, Mozes M, et al. Transgenic mice with increased plasma levels of TGF-beta 1 develop progressive renal disease. Lab Invest. 1996;74(6):991–1003. [PubMed] [Google Scholar]
- [11].Cai Y, Feng Z, Jia Q, et al. Cordyceps cicadae ameliorates renal hypertensive injury and fibrosis through the regulation of SIRT1-mediated autophagy. Front Pharmacol. 2021;12:801094. doi: 10.3389/fphar.2021.801094 [DOI] [PMC free article] [PubMed] [Google Scholar]
- [12].Ma Z, Li L, Livingston MJ, et al. p53/microRNA-214/ULK1 axis impairs renal tubular autophagy in diabetic kidney disease. J Clin Invest. 2020;130(9):5011–5026. doi: 10.1172/JCI135536 [DOI] [PMC free article] [PubMed] [Google Scholar]
- [13].Fang L, Zhou Y, Cao H, et al. Autophagy attenuates diabetic glomerular damage through protection of hyperglycemia-induced podocyte injury. PLoS One. 2013;8(4):e60546. doi: 10.1371/journal.pone.0060546 [DOI] [PMC free article] [PubMed] [Google Scholar]
- [14].Yi S, Zheng B, Zhu Y, et al. Melatonin ameliorates excessive PINK1/Parkin-mediated mitophagy by enhancing SIRT1 expression in granulosa cells of PCOS. Am J Physiol Endocrinol Metab. 2020;319(1):E91–E101. doi: 10.1152/ajpendo.00006.2020 [DOI] [PubMed] [Google Scholar]
- [15].Holvoet T, Devriese S, Castermans K, et al. Treatment of intestinal fibrosis in experimental inflammatory bowel disease by the pleiotropic actions of a local rho kinase inhibitor. Gastroenterology. 2017;153(4):1054–1067. doi: 10.1053/j.gastro.2017.06.013 [DOI] [PubMed] [Google Scholar]
- [16].Kang JW, Hong JM, Lee SM. Melatonin enhances mitophagy and mitochondrial biogenesis in rats with carbon tetrachloride-induced liver fibrosis. J Pineal Res. 2016;60(4):383–393. doi: 10.1111/jpi.12319 [DOI] [PubMed] [Google Scholar]
- [17].Mao YQ, Fan XM. Autophagy: a new therapeutic target for liver fibrosis. World J Hepatol. 2015;7(16):1982–1986. doi: 10.4254/wjh.v7.i16.1982 [DOI] [PMC free article] [PubMed] [Google Scholar]
- [18].Zhang XW, Zhou J-C, Peng D, et al. Disrupting the TRIB3-SQSTM1 interaction reduces liver fibrosis by restoring autophagy and suppressing exosome-mediated HSC activation. Autophagy. 2020;16(5):782–796. doi: 10.1080/15548627.2019.1635383 [DOI] [PMC free article] [PubMed] [Google Scholar]
- [19].Hidvegi T, Ewing M, Hale P, et al. An autophagy-enhancing drug promotes degradation of mutant α 1 -antitrypsin Z and reduces hepatic fibrosis. Science. 2010;329(5988):229–232. doi: 10.1126/science.1190354 [DOI] [PubMed] [Google Scholar]
- [20].Butera A, Quaranta MT, Crippa L, et al. CD147 targeting by AC-73 induces autophagy and reduces intestinal fibrosis associated with TNBS chronic colitis. J Crohns Colitis. 2022;16(11):1751–1761. doi: 10.1093/ecco-jcc/jjac084 [DOI] [PMC free article] [PubMed] [Google Scholar]
- [21].Podestà MA, Faravelli I, Ponticelli C. Autophagy in lupus nephritis: A delicate balance between regulation and disease. Autoimmun Rev. 2022;21(8):103132. doi: 10.1016/j.autrev.2022.103132 [DOI] [PubMed] [Google Scholar]
- [22].Wang S, Wu Y-Y, Wang X, et al. Lycopene prevents carcinogen-induced cutaneous tumor by enhancing activation of the Nrf2 pathway through p62-triggered autophagic Keap1 degradation. Aging. 2020;12(9):8167–8190. doi: 10.18632/aging.103132 [DOI] [PMC free article] [PubMed] [Google Scholar]
- [23].Song X, Luo Y, Ma L, et al. Recent trends and advances in the epidemiology, synergism, and delivery system of lycopene as an anti-cancer agent. Semin Cancer Biol. 2021;73:331–346. doi: 10.1016/j.semcancer.2021.03.028 [DOI] [PubMed] [Google Scholar]
- [24].Bi S, Li L, Gu H, et al. Lycopene upregulates ZO-1 and downregulates claudin-1 through autophagy inhibition in the human cutaneous squamous cell carcinoma cell line COLO-16. J Cancer. 2019;10(2):510–521. doi: 10.7150/jca.26578 [DOI] [PMC free article] [PubMed] [Google Scholar]
- [25].Choi S, Kim H. The remedial potential of Lycopene in pancreatitis through regulation of autophagy. Int J Mol Sci. 2020;21(16):5775. doi: 10.3390/ijms21165775 [DOI] [PMC free article] [PubMed] [Google Scholar]
- [26].Wang Q, Li R, Xiao Z, et al. Lycopene attenuates high glucose‑mediated apoptosis in MPC5 podocytes by promoting autophagy via the PI3K/AKT signaling pathway. Exp Ther Med. 2020;20(3):2870–2878. doi: 10.3892/etm.2020.8999 [DOI] [PMC free article] [PubMed] [Google Scholar]
- [27].El-Sheikh M, Mesalam A, Khalil AAK, et al. Downregulation of PI3K/AKT/mTOR Pathway in juglone-treated bovine oocytes. Antioxidants (Basel). 2023;12(1):114 . doi: 10.3390/antiox12010114 [DOI] [PMC free article] [PubMed] [Google Scholar]
- [28].Liu S, Gao W, Lu Y, et al. As a novel tumor suppressor, LHPP promotes apoptosis by inhibiting the PI3K/AKT signaling pathway in oral squamous cell carcinoma. Int J Biol Sci. 2022;18(2):491–506. 10.7150/ijbs.66841. [DOI] [PMC free article] [PubMed] [Google Scholar]
- [29].Lu R, Wei Z, Wang Z, et al. Mulberroside a alleviates osteoarthritis via restoring impaired autophagy and suppressing MAPK/NF-κB/PI3K-AKT-mTOR signaling pathways. iScience. 2023;26(2):105936. doi: 10.1016/j.isci.2023.105936 [DOI] [PMC free article] [PubMed] [Google Scholar]
- [30].Grassi G, Di Caprio G, Santangelo L, et al. Autophagy regulates hepatocyte identity and epithelial-to-mesenchymal and mesenchymal-to-epithelial transitions promoting snail degradation. Cell Death Dis. 2015;6(9):e1880. doi: 10.1038/cddis.2015.249 [DOI] [PMC free article] [PubMed] [Google Scholar]
- [31].Li J, Zhang M, Mao Y, et al. The potential role of aquaporin 1 on aristolochic acid I induced epithelial mesenchymal transition on HK-2 cells. J Cell Physiol. 2018;233(6):4919–4925. doi: 10.1002/jcp.26310 [DOI] [PubMed] [Google Scholar]
- [32].Puthumana J, Thiessen-Philbrook H, Xu L, et al. Biomarkers of inflammation and repair in kidney disease progression. J Clin Invest. 2021;131(3). doi: 10.1172/JCI139927 [DOI] [PMC free article] [PubMed] [Google Scholar]
- [33].Black LM, Lever JM, Agarwal A. Renal inflammation and fibrosis: a Double-edged sword. J Histochem Cytochem. 2019;67(9):663–681. doi: 10.1369/0022155419852932 [DOI] [PMC free article] [PubMed] [Google Scholar]
- [34].Wang X, Jia P, Ren T, et al. MicroRNA-382 promotes M2-like macrophage via the SIRP-α/STAT3 signaling pathway in aristolochic acid-induced renal fibrosis. Front Immunol. 2022;13:864984. doi: 10.3389/fimmu.2022.864984 [DOI] [PMC free article] [PubMed] [Google Scholar]
- [35].Ajay AK, Zhao L, Vig S, et al. Deletion of STAT3 from Foxd1 cell population protects mice from kidney fibrosis by inhibiting pericytes trans-differentiation and migration. Cell Rep. 2022;38(10):110473. doi: 10.1016/j.celrep.2022.110473 [DOI] [PMC free article] [PubMed] [Google Scholar]
- [36].Wang Y, Liu Z, Ma J, et al. Lycopene attenuates the inflammation and apoptosis in aristolochic acid nephropathy by targeting the Nrf2 antioxidant system. Redox Biol. 2022;57:102494. doi: 10.1016/j.redox.2022.102494 [DOI] [PMC free article] [PubMed] [Google Scholar]
- [37].Tang PM, Nikolic-Paterson DJ, Lan HY. Macrophages: versatile players in renal inflammation and fibrosis. Nat Rev Nephrol. 2019;15(3):144–158. doi: 10.1038/s41581-019-0110-2 [DOI] [PubMed] [Google Scholar]
- [38].Lu Q, Ma Z, Ding Y, et al. Circulating miR-103a-3p contributes to angiotensin II-induced renal inflammation and fibrosis via a SNRK/NF-κB/p65 regulatory axis. Nat Commun. 2019;10(1):2145. doi: 10.1038/s41467-019-10116-0 [DOI] [PMC free article] [PubMed] [Google Scholar]
- [39].Yuan Q, Ren Q, Li L, et al. A klotho-derived peptide protects against kidney fibrosis by targeting TGF-β signaling. Nat Commun. 2022;13(1):438. doi: 10.1038/s41467-022-28096-z [DOI] [PMC free article] [PubMed] [Google Scholar]
- [40].Wynn TA, Ramalingam TR. Mechanisms of fibrosis: therapeutic translation for fibrotic disease. Nat Med. 2012;18(7):1028–1040. doi: 10.1038/nm.2807 [DOI] [PMC free article] [PubMed] [Google Scholar]
- [41].Lamouille S, Xu J, Derynck R. Molecular mechanisms of epithelial-mesenchymal transition. Nat Rev Mol Cell Biol. 2014;15(3):178–196. doi: 10.1038/nrm3758 [DOI] [PMC free article] [PubMed] [Google Scholar]
- [42].Wang X, Xue N, Zhao S, et al. Upregulation of miR-382 contributes to renal fibrosis secondary to aristolochic acid-induced kidney injury via PTEN signaling pathway. Cell Death Dis. 2020;11(8):620. doi: 10.1038/s41419-020-02876-1 [DOI] [PMC free article] [PubMed] [Google Scholar]
- [43].Peng D, Fu M, Wang M, et al. Targeting TGF-β signal transduction for fibrosis and cancer therapy. Mol Cancer. 2022;21(1):104. doi: 10.1186/s12943-022-01569-x [DOI] [PMC free article] [PubMed] [Google Scholar]
- [44].Mao L, Liu L, Zhang T, et al. MKL1 mediates TGF-β-induced CTGF transcription to promote renal fibrosis. J Cell Physiol. 2020;235(5):4790–4803. doi: 10.1002/jcp.29356 [DOI] [PubMed] [Google Scholar]
- [45].Geng XQ, Ma A, He J-Z, et al. Ganoderic acid hinders renal fibrosis via suppressing the TGF-β/Smad and MAPK signaling pathways. Acta Pharmacol Sin. 2020;41(5):670–677. doi: 10.1038/s41401-019-0324-7 [DOI] [PMC free article] [PubMed] [Google Scholar]
- [46].Chen RJ, Lee Y-H, Yeh Y-L, et al. The roles of autophagy and the inflammasome during Environmental stress-Triggered Skin inflammation. Int J Mol Sci. 2016;17(12):17(12. doi: 10.3390/ijms17122063 [DOI] [PMC free article] [PubMed] [Google Scholar]
- [47].Li X, Yang K-B, Chen W, et al. CUL3 (cullin 3)-mediated ubiquitination and degradation of BECN1 (beclin 1) inhibit autophagy and promote tumor progression. Autophagy. 2021;17(12):4323–4340. doi: 10.1080/15548627.2021.1912270 [DOI] [PMC free article] [PubMed] [Google Scholar]
- [48].Yoshida GJ. Therapeutic strategies of drug repositioning targeting autophagy to induce cancer cell death: from pathophysiology to treatment. J Hematol Oncol. 2017;10(1):67. doi: 10.1186/s13045-017-0436-9 [DOI] [PMC free article] [PubMed] [Google Scholar]
- [49].Terešak P, Lapao A, Subic N, et al. Regulation of PRKN-independent mitophagy. Autophagy. 2022;18(1):24–39. doi: 10.1080/15548627.2021.1888244 [DOI] [PMC free article] [PubMed] [Google Scholar]
- [50].Bernardini JP, Lazarou M, Dewson G. Parkin and mitophagy in cancer. Oncogene. 2017;36(10):1315–1327. doi: 10.1038/onc.2016.302 [DOI] [PubMed] [Google Scholar]
- [51].Yoshii SR, Mizushima N. Autophagy machinery in the context of mammalian mitophagy. Biochim Biophys Acta. 2015;1853(10 Pt B):2797–2801. doi: 10.1016/j.bbamcr.2015.01.013 [DOI] [PubMed] [Google Scholar]
- [52].Fan Y, Dong W, Wang Y, et al. Glycyrrhetinic acid regulates impaired macrophage autophagic flux in the treatment of non-alcoholic fatty liver disease. Front Immunol. 2022;13:959495. doi: 10.3389/fimmu.2022.959495 [DOI] [PMC free article] [PubMed] [Google Scholar]
- [53].Koreeda A, Yonemitsu K, Kohmatsu H, et al. Immunohistochemical demonstration of the distribution of chloroquine (CQ) and its metabolites in CQ-poisoned mice. Arch Toxicol. 2007;81(7):471–478. doi: 10.1007/s00204-007-0185-6 [DOI] [PubMed] [Google Scholar]
- [54].Tang C, Livingston MJ, Liu Z, et al. Autophagy in kidney homeostasis and disease. Nat Rev Nephrol. 2020;16(9):489–508. doi: 10.1038/s41581-020-0309-2 [DOI] [PMC free article] [PubMed] [Google Scholar]
- [55].Kim WY, NAM SA, SONG HC, et al. The role of autophagy in unilateral ureteral obstruction rat model. Nephrology (Carlton). 2012;17(2):148–159. doi: 10.1111/j.1440-1797.2011.01541.x [DOI] [PubMed] [Google Scholar]
- [56].Yamamoto T, Takabatake Y, Minami S, et al. Eicosapentaenoic acid attenuates renal lipotoxicity by restoring autophagic flux. Autophagy. 2021;17(7):1700–1713. doi: 10.1080/15548627.2020.1782034 [DOI] [PMC free article] [PubMed] [Google Scholar]
- [57].Huang XY, Hu QP, Shi HY, et al. Everolimus inhibits PI3K/Akt/mTOR and NF-kB/IL-6 signaling and protects seizure-induced brain injury in rats. J Chem Neuroanat. 2021;114:101960. doi: 10.1016/j.jchemneu.2021.101960 [DOI] [PubMed] [Google Scholar]
- [58].Jiang C, Zhao X, Jeong T, et al. Novel specific pyruvate kinase M2 inhibitor, compound 3h, induces apoptosis and autophagy through suppressing Akt/mTOR Signaling pathway in LNCaP cells. Cancers (Basel). 2022;15(1):265. doi: 10.3390/cancers15010265. [DOI] [PMC free article] [PubMed] [Google Scholar]
- [59].Maheshwari M, Yadav N, Hasanain M, et al. Inhibition of p21 activates Akt kinase to trigger ROS-induced autophagy and impacts on tumor growth rate. Cell Death Dis. 2022;13(12):1045. doi: 10.1038/s41419-022-05486-1. [DOI] [PMC free article] [PubMed] [Google Scholar]
- [60].Wang H, Liu Y, Wang D, et al. The upstream pathway of mTOR-Mediated autophagy in liver diseases. Cells. 2019;8(12):1597. doi: 10.3390/cells8121597 [DOI] [PMC free article] [PubMed] [Google Scholar]
- [61].Wang Q, Shen ZN, Zhang SJ, et al. Protective effects and mechanism of puerarin targeting PI3K/Akt signal pathway on neurological diseases. Front Pharmacol. 2022;13:1022053. doi: 10.3389/fphar.2022.1022053 [DOI] [PMC free article] [PubMed] [Google Scholar]
- [62].Yang CZ, Wang SH, Zhang RH, et al. Neuroprotective effect of astragalin via activating PI3K/Akt-mTOR-mediated autophagy on APP/PS1 mice. Cell Death Discov. 2023;9(1):15. doi: 10.1038/s41420-023-01324-1 [DOI] [PMC free article] [PubMed] [Google Scholar]
- [63].Lipton JO, Sahin M. The neurology of mTOR. Neuron. 2014;84(2):275–291. doi: 10.1016/j.neuron.2014.09.034 [DOI] [PMC free article] [PubMed] [Google Scholar]
- [64].Younis NS, Abduldaium MS, Mohamed ME. Protective effect of Geraniol on oxidative, inflammatory and apoptotic alterations in Isoproterenol-induced Cardiotoxicity: role of the Keap1/Nrf2/HO-1 and PI3K/Akt/mTOR Pathways. Antioxidants (Basel). 2020;9(10):977. doi: 10.3390/antiox9100977 [DOI] [PMC free article] [PubMed] [Google Scholar]
- [65].Xiao JJ, Liu Q, Li Y, et al. Regulator of calcineurin 1 deletion attenuates mitochondrial dysfunction and apoptosis in acute kidney injury through JNK/Mff signaling pathway. Cell Death Dis. 2022;13(9):774. doi: 10.1038/s41419-022-05220-x [DOI] [PMC free article] [PubMed] [Google Scholar]
- [66].Sui H, Zhao J, Zhou L, et al. Tanshinone IIA inhibits β-catenin/VEGF-mediated angiogenesis by targeting TGF-β1 in normoxic and HIF-1α in hypoxic microenvironments in human colorectal cancer. Cancer Lett. 2017;403:86–97. doi: 10.1016/j.canlet.2017.05.013 [DOI] [PubMed] [Google Scholar]
- [67].Li Y, Chang L-H, Huang W-Q, et al. IL-17A mediates pyroptosis via the ERK pathway and contributes to steroid resistance in CRSwNP. J Allergy Clin Immunol. 2022;150(2):337–351. doi: 10.1016/j.jaci.2022.02.031 [DOI] [PubMed] [Google Scholar]
- [68].Nogales C, Mamdouh ZM, List M, et al. Network pharmacology: curing causal mechanisms instead of treating symptoms. Trends Pharmacol Sci. 2022;43(2):136–150. doi: 10.1016/j.tips.2021.11.004 [DOI] [PubMed] [Google Scholar]
Associated Data
This section collects any data citations, data availability statements, or supplementary materials included in this article.
Data Availability Statement
The data supporting the findings of this study are available within the article [and/or] its supplementary materials.


