Abstract
Auricularia heimuer, the third most frequently cultivated edible mushroom species worldwide, has high medicinal value. However, a shortage of molecular marker hinders the efficiency and accuracy of genetic breeding efforts for A. heimuer. High-throughput transcriptome sequencing data are essential for gene discovery and molecular markers development. This study aimed to clarify the distribution of SSR loci across the A. heimuer transcriptome and to develop highly informative EST-SSR markers. These tools can be used for phylogenetic analysis, functional gene mining, and molecular marker-assisted breeding of A. heimuer. This study used Illumina high-throughput sequencing technology to obtain A. heimuer transcriptome data. The results revealed 37,538 unigenes in the A. heimuer transcriptome. Of these unigenes, 24,777 (66.01%) were annotated via comparison with the COG, Pfam, and NR databases. Overall, 2510 SSRs were identified from the unigenes, including 6 types of SSRs. The most abundant type of repeats were trinucleotides (1425, 56.77%), followed by mononucleotides (391, 15.58%) and dinucleotides (456, 18.17%). Primer pairs for 102 SSR loci were randomly designed for validity confirmation and polymorphism identification; this process yielded 53 polymorphic EST-SSR markers. Finally, 13 pairs of highly polymorphic EST-SSR primers were used to analyze the genetic diversity and population structure of 52 wild A. heimuer germplasms, revealing that the 52 germplasms could be divided into three categories. These results indicated that SSR loci were abundant in types, numbers, and frequencies, providing a potential basis for germplasm resource identification, genetic diversity analysis, and molecular marker-assisted breeding of A. heimuer.
Keywords: Auricularia heimuer, Transcriptome, EST-SSRs, Genetic diversity, Population structure
Subject terms: Genetics, Microbiology
Introduction
Auricularia heimuer, a wood-decaying mushroom, is the third most frequently cultivated edible mushroom worldwide1. Globally, China has the highest cultivated yield of A. heimuer, and Northeast China contributes approximately 70% of the national yield. A. heimuer is an important food source in Asia because of its high protein, trace element, vitamin, and carbohydrate contents, as well as its low fat content2,3. It also has high medicinal potential4, including anti-tumor, antioxidant, anticoagulant, and hypolipidemic properties5–9. Thus far, A. heimuer strains have mainly been derived from the domestication of wild strains and isolation of natural mutants. Decreases in wild resources and gradual convergence through artificial selection have led to reduced genetic diversity among A. heimuer strains10. Additionally, it is difficult to distinguish A. heimuer strains via morphological characteristics, hindering the dissemination of enhanced A. heimuer and the process of cultivar improvement. Thus, there is a need to establish and improve methods for analyzing genetic diversity in A. heimuer. Research priorities include effective evaluation of germplasm resources and establishment of a genetic database for the protection and scientific utilization of A. heimuer resources11.
In non-model plants without reference genomes, the use of molecular markers has become a key method for studies of diversity levels, population genetic structures, and genetic relationships of species germplasm resources12. This method is not affected by environmental stress, natural selection, or disease susceptibility13. Molecular markers are specific DNA fragments that directly represent genetic variation at the DNA level and can reveal specific genomic differences among individuals or populations14. In previous studies, molecular markers such as ISSR, SRAP, TRAP, and SCAR were successfully used to study A. heimuer15–19. A key molecular marker, the simple sequence repeat (SSR), is widely used for identification. This marker is easy to use, demonstrates good versatility and polymorphism properties, exhibits good stability, and can be developed in a simple manner20,21. SSR markers can be divided into two types based on the source: gSSR and EST-SSR22. gSSR is randomly distributed on the genome, and EST-SSR is located in the expression sequence, which is a molecular marker directly related to functional genes. Because ESTs are derived from coding DNA, their flanking sequences are usually highly conserved, allowing EST-SSR markers to achieve greater versatility23. This property supports the implementation of molecular marker technology in plant research. Additionally, due to their codominant and often single-locus nature, SSR loci can be recognized across different genotypes within the same species and frequently in the genotypes of closely related species. Thus, SSR loci can be efficiently transferred to related species24,25.
Advances in high-throughput sequencing have led to the development of EST-SSR markers, which offers new methods for assessment of species diversity in many edible mushrooms, such as Lentinula edodes, Agaricus subrufescens, Bailinggu, Morchella esculenta, and A. heimuer26–30. To enhance the protection and utilization of wild germplasm resources, EST-SSR markers based on transcriptome sequencing and genetic analysis of A. heimuer have been developed. In this study, Illumina high-throughput sequencing technology was used to obtain A. heimuer transcriptome data, which were then subjected to assembly and functional annotation. Subsequently, the frequencies, distributions, and functions of SSR markers in the A. heimuer transcriptome were analyzed. Next, EST-SSRs were established and polymorphism levels were detected. Finally, EST-SSRs were used to evaluate genetic diversity and genetic structures in wild A. heimuer.
Results
De novo assembly of the transcriptome
In total, 465,568,126 raw reads and 443,583,204 clean reads (95.28%) were generated (Table 1), with a Q20 base percentage of 98.89% and a GC percentage of 60.92%. Trinity software assembled high-quality reads into 147,073 contigs, with a mean length of 1066 bp and an N50 length of 1742 bp. These contigs were then spliced into 37,538 unigenes, with a total length of approximately 36.7 Mb, a mean length of 979.94 bp, and an N50 length of 1748 bp. There were 19,022 (50.67%) unigenes between 200 and 500 bp, 14,133 (37.65%) unigenes between 501 and 2000 bp, and 4383 (11.68%) unigenes longer than 2000 bp.
Table 1.
Summary of the analysis of A. heimuer transcriptomic data.
| Number of raw reads | 465,568,126 |
| Number of high-quality reads | 443,583,204 |
| Number of clean nucleotides (nt) | 62,819,299,427 |
| Total length of contigs (bp) | 156,856,636 |
| Total length of unigenes (bp) | 36,785,052 |
| Number of contigs | 147,073 |
| Number of unigenes | 37,538 |
| Total number of identified SSRs | 2510 |
| Number of SSR-containing sequences | 2216 |
| Number of sequences containing more than one EST-SSR | 232 |
Gene annotation based on different databases
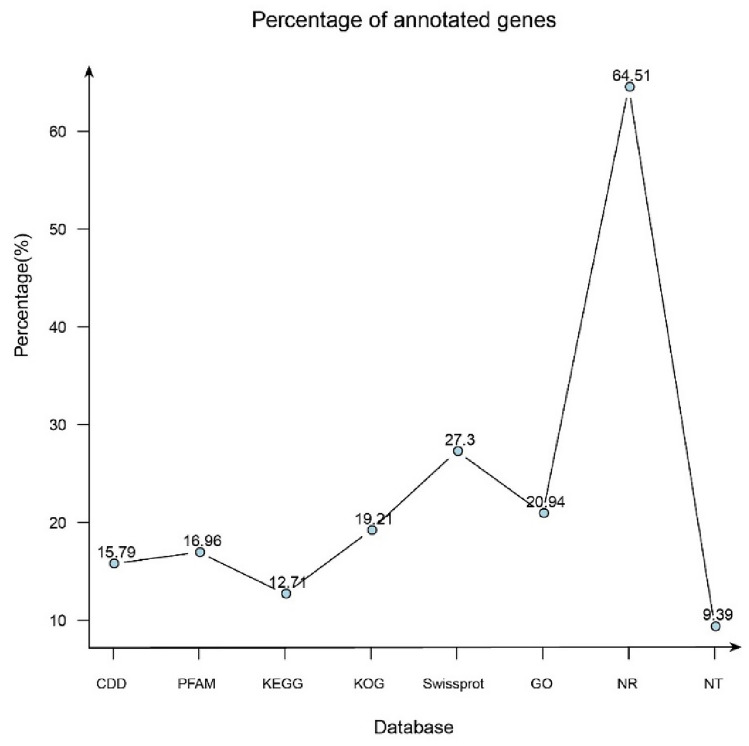
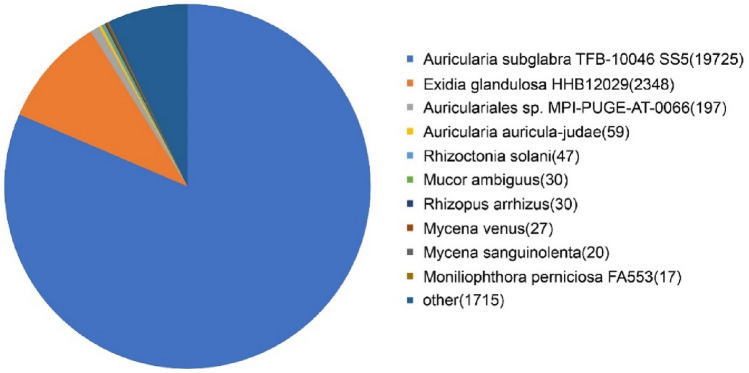
Sequence similarity was determined by BLAST algorithm. The functions of unigene sequences were evaluated and classified using the conserved domain database (CDD), Pfam, Kyoto encyclopedia of genes and genomes (KEGG), and KOG databases, as well as other databases. Because of the different databases used, the number of functional annotations greatly varied among the unigenes. The NR database had the highest number of annotated unigenes (24,215, 64.51%), whereas the NT database had the lowest number of annotated unigenes (3,525, 9.39%) (Fig. 1). According to the species distribution annotation, Auricularia subglabra had the highest percentage of unigenes (52.55%). This was followed by Exidia glandulosa, Auriculariales sp., Auricularia auricula-judae, Rhizoctonia solani, Mucor ambiguus, Rhizopus arrhizus, Mycena venus, Mycena sanguinolenta, and Moniliophthora perniciosa with percentages of 6.25%, 0.52%, 0.16%, 0.13%, 0.08%, 0.08%, 0.07%, 0.05%, and 0.05%, as indicated in Fig. 2.
Figure 1.
Frequency and distribution of SSRs on the basis of the motif.
Figure 2.
Homologous species distribution of A. heimuer transcripts annotated in the NR database.
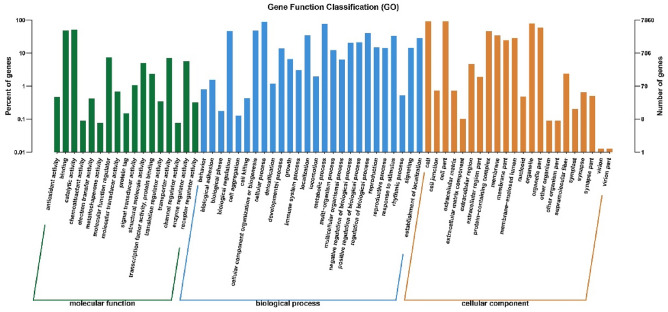
The functions of the identified genes were explored by graphene oxide analysis. According to the degree of graphene oxide enrichment, 7860 unigenes from A. heimuer were divided into 65 functional groups and assigned to three main categories: biological process (BP; 41,851, 46.95%), cellular component (CC; 36,996, 41.50%), and molecular function (MF; 10,292, 11.55%) (Fig. 3). The 65 subcategories were then subdivided into Gene Ontology terms. The three main BP subcategories were cellular process (7046, 16.84%), metabolic process (6030, 14.41%) and cellular component organization or biogenesis (3760, 8.98%). The three main CC subcategories were cell (7270, 19.65%), cell part (7270, 19.65%), and organelle (6294, 17.01%). Finally, the three main MF subcategories were catalytic activity (4035, 39.20%), binding (3801, 36.93%), and molecular function regulator (581, 5.65%).
Figure 3.
GO classification of assembled SSR-containing unigenes in A. heimuer.
KEGG analysis revealed that 12,551 (33.44%) of the 37,538 unigenes could be classified into 279 pathways. The most representative metabolic pathways were metabolism (3209, 25.57%), followed by genetic information processing (1775, 14.14%), organismal systems (1,405, 11.19%), cellular processes (1197, 9.54%), and environmental information processing (858, 6.84%). Functional analysis showed that unigenes were mainly enriched in the biosynthesis of amino acids (240) and RNA transport (240), as shown in Table S3.
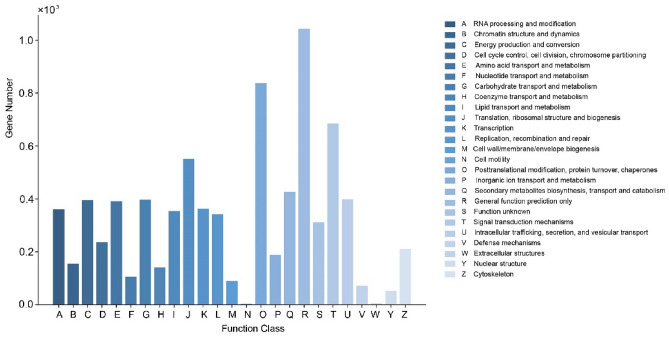
The KOG database was used to compare all unigenes from A. heimuer, with the goal of predicting the functions of A. heimuer genes. Upon annotation by KOG, 8921 unigenes could be classified into 25 categories. The largest predicted category was general function (1041, 11.67%). This was followed by posttranslational modification, protein turnover, and chaperones (836, 9.37%); signal transduction mechanisms (684, 7.67%); and translation, ribosomal structure, and biogenesis (550, 6.17%). The smallest predicted categories were cell mobility (2, 0.02%) and extracellular structures (4, 0.04%) (Fig. 4).
Figure 4.
KOG classification of the SSR-containing unigenes.
Frequency and distribution of SSRs
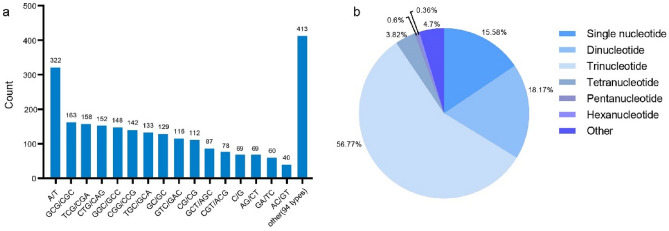
SSR markers play important roles in genetic diversity analysis, genetic mapping, and molecular marker-assisted breeding because of their wide distribution, co-dominance, high repeatability, large number of polymorphisms, and easy operation31. In total, 2510 EST-SSR loci were identified in 37,538 unigenes; among these unigenes, 232 had two or more SSR loci. The most common motifs were single repeats (391, 15.58%), double repeats (456, 18.17%) and triple repeats (1425, 56.77%).
Among all SSR markers, most were trinucleotide repeats (1425, 56.77%); the next most common markers were dinucleotide repeats (456, 18.17%). The numbers of mononucleotide repeats, tetranucleotide repeats, pentanucleotide repeats, and hexanucleotide repeats were 391, 96, 15, and 9, respectively, comprising 15.58%, 3.82%, 0.60%, and 0.36% of all markers (Fig. 5b). A/T was the most common single-base repeat (82.35%), GC/GC was the most common two-base repeat (28.29%), and GCG/CGC was the most common three-base repeat (11.44%); TACC/GGTA, and AACCA/TGGTT were the most common four-base and five-base repeats, respectively (Fig. 5a).
Figure 5.
The SSRs repeated nucleotide types for A. heimuer.
Genetic diversity and structure analysis
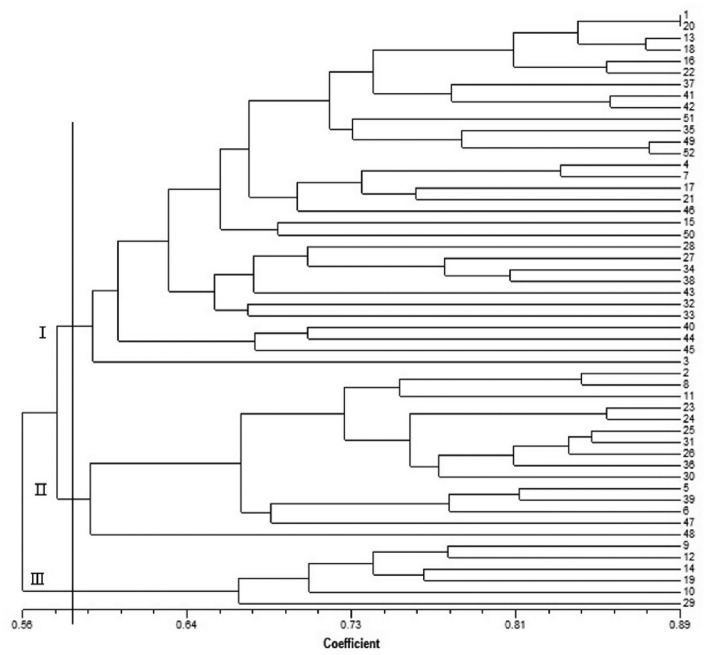
Of the 102 primer pairs, 97 were able to amplify PCR products from genomic DNA, and 43 PCR reactions produced a single band. Finally, 13 primer pairs of highly polymorphic EST-SSR primers were used to analyze the genetic diversity and population structure of 52 wild A. heimuer germplasms. The genetic similarity coefficients of 52 strains of A. heimuer ranged from 0.56 to 0.89, according to a cluster map of SSR markers constructed by NTSys using the unweighted pair group method with arithmetic mean (UPGMA) approach. Using a similarity index threshold of 0.58, 52 samples were divided into three main groups (Fig. 6). Class I contained 31 samples; of these, strains with a genetic similarity coefficient > 0.85 comprised 32.26%. Strains HMCC50008 and HMCC50931 were closely related, with a similarity coefficient of 0.89. Among the 15 samples in group II, HMCC50116 was genetically distant from other strains (similarity coefficient of 0.59). Class III contained 6 samples, with a similarity coefficient that ranged from 0.66 to 0.77.
Figure 6.
The UPGMA analysis among 52 wild A. heimuer.
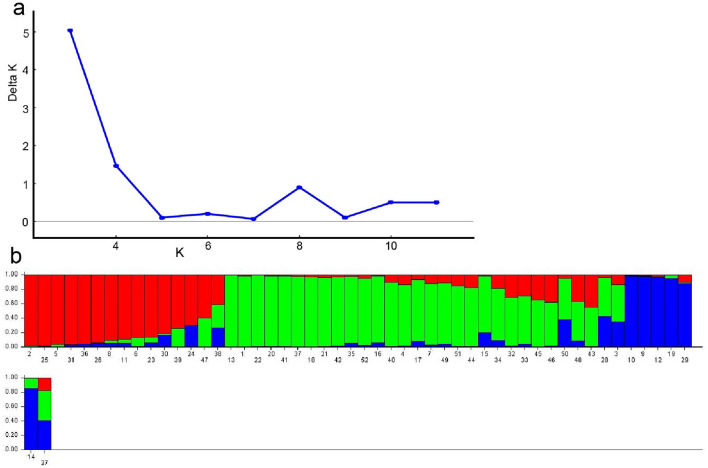
Vertical bars with various colors represent sample membership coefficients estimated using the Q statistic. The graph shows the membership scores of the ΔK estimator derived using LnP (D), with K ranging from 1 to 10. The number of A. heimuer strains cultivated in Northeast China was assumed to range from 2 to 12, and the calculation was repeated 15 times. Trend analysis of ΔK showed that when delt was 3, the ΔK value reached an obvious peak (Fig. 7a); all samples were then divided into the following three groups (Fig. 7b). Group I (red) comprised 15 samples, group II (green) comprised 31 samples, and group III (blue) comprised 6 samples. The UPGMA dendrogram shows that the germplasms can be divided into three groups (Fig. 6). Clustering analysis of the 52 wild A. heimuer strains revealed results that were largely consistent with the findings of population genetic structure analysis.
Figure 7.
Results of STRUCTURE analysis for 52 populations using 13 EST-SSR markers. (a) Estimation of population using ΔK value withcluster K ranging from 2 to 12. (b) Estimation of population structure based on STRUCTURE analysis.
Discussion
Advances in high-throughput sequencing technology and reduced sequencing costs have enhanced the efficiency and convenience of using transcriptomics data to identify SSR loci with large numbers of polymorphisms32. Compared with genomic-SSR molecular markers, EST-SSR molecular markers have lower development costs, greater versatility and conservation, and favorable associations with phenotypic traits33. In the present study, 2,510 SSR loci were identified from 37,538 unigenes in the A. heimuer transcriptome; the SSR frequency of 6.69% was higher than the rates for edible mushrooms such as Auricularia polytricha (4.70%) and Pleurotus eryngii (3.09%)34,35, indicating that the A. heimuer transcriptome contains abundant SSR loci. Factors such as database validity, species differences, and SSR search criteria may lead to differences in SSR frequency between A. heimuer and other analyzed species36,37.
SSR repeat types differ among species, but the dinucleotide and trinucleotide repeat types are dominant38. In the present study, SSRs were abundant in the A. heimuer transcriptome; trinucleotide repeats were most common (1425, 56.77%), followed by dinucleotide repeats (456, 18.17%). These results were consistent with previous findings regarding Commelina communis, Phyllostachys violascens, and Crataegus39–41. This study showed that differences in SSR number were partially related to the degree of species evolution; a high percentage of short repeat units indicated that the degree of species evolution was high42, implying that A. heimuer has a long evolutionary history and may have accumulated additional genetic variations. There is evidence that when the SSR length exceeds 20 bp, the polymorphism rate is high; a length of 12–19 bp is associated with a moderate polymorphism rate; a length below 12 bp leads to a low polymorphism rate43. In this study, 501 SSRs (19.96%) exceeded 20 bp in length.
SSR polymorphisms can be expressed as the difference in fragment length according to the numbers of base repeats and individual bases. Generally, as the number of repeats increases for a single base or a small number of bases, microsatellite sequences exhibit greater variability and increased polymorphism potential. In the present study, as the sequence copy number increased, the number of units of each SSR type in the A. heimuer genome tended to decrease. This phenomenon may be explained as follows: as the number of units of a particular SSR type increases, the SSR length also increases, resulting in outcomes such as greater instability and higher mutation rate; the long-term result is a decrease in the number of units of the affected SSR type44.
This study annotated the functions of unigenes containing SSRs; the functions of these potential SSR gene sequences mainly focused on biological activities such as metabolic processes, cellular component organization or biogenesis, catalytic activities, and regulators of molecular function. These biological activities are performed throughout plant growth and development, indicating that unigenes with SSR loci may have diverse gene functions. Additionally, this study demonstrated the utility of 13 newly developed polymorphic EST-SSR markers in evaluating genetic diversity among 52 wild A. heimuer germplasms in Northeast China. Among 102 primer pairs randomly selected for validation, 97 yielded distinct PCR product bands; this PCR success rate was higher than the rates for Morchella spp. and Pleurotus geesteranus45,46. In the analysis, the 13 markers divided the tested strains into three main groups according to UPGMA cluster analysis. The dendrogram revealed that wild A. heimuer individuals in Northeast China are highly diverse. The results of this study provide a scientific basis for future work regarding EST-SSR molecular markers, facilitating the use of functional genes and exploration of molecular marker-assisted breeding in A. heimuer.
Conclusions
In this study, 2510 SSR loci were identified based on 37,538 unigenes obtained from the A. heimuer transcriptome. Furthermore, 13 EST-SSR markers were used to analyze the genetic diversity of 52 wild A. heimuer individuals. Our results showed that the populations of wild A. heimuer in Northeast China had a high level of genetic diversity. These findings provide molecular evidence to support molecular breeding, germplasm resource conservation, and core germplasm collection involving A. heimuer.
Methods
A. heimuer materials
Fifty-two wild A. heimuer strains were used in this study; all strains were provided by the Heilongjiang Provincial Microbial Germplasm Resources Preservation Center (National Edible Mushroom Germplasm Resources Library (Heilongjiang)). These strains had been collected from Northeast China for the development and characterization of EST-SSRs. Detailed sample information is provided in Supplementary Table S1.
RNA extraction and transcriptome sequencing
The mycelia of A. heimuer were frozen and sent to Sangon Biotech (Shanghai) Co., Ltd. for extraction of total RNA. For each sample, 100 mg of A. heimuer mycelium were briefly washed in deionized water and frozen in liquid nitrogen. Total RNA was extracted from mycelium using Total RNA Extractor (TRIzol) (Sangon Biotech, Shanghai, China). RNA quality was verified using a Qubit 2.0 fluorometer (Thermo Fisher Scientific, Wilmington, DE, USA); RNA integrity and genomic contamination were assessed by RNase-free agarose gel electrophoresis. cDNA libraries were constructed. A normalized cDNA library of A. heimuer was constructed using methods described by Venugopal et al.47–50. Then, sequencing with an Illumina NovaSeq 6000 was performed to generate raw data. These raw Illumina sequencing data were submitted to the NCBI Sequence Read Archive (accession number, PRJNA1056119; http://www.ncbi.nlm.nih.gov/Traces/sra). The raw data underwent a series of quality assessments to obtain clean data. Transcripts were obtained by de novo assembly of clean data using the Trinity platform (https://github.com/trinityrnaseq/trinityrnaseq/wiki)51. The resulting transcripts were subjected to deduplication, and the longest transcript in each gene was regarded as a unigene; the set of unigenes was used for subsequent analyses.
Functional classification notes
A transcriptome database was established after transcript splicing had been completed; next, comprehensive analysis and annotation of A. heimuer were performed. The non-redundant transcription sequences obtained via splicing were compared with seven databases (including the NCBI NR database and the EuKaryotic Orthologous Groups [KOG] database), yielding annotation data for wild A. heimuer unigenes. Comprehensive functional information was obtained for all transcripts, and annotations from each database were counted.
EST-SSR mining and primer design
MISA (https://webblast.ipk-gatersleben.de/misa/)was used to search the SSR loci of the obtained unigenes. SSRs with < 6 single nucleotide repeats; < 6 dinucleotide repeats; and < 5 trinucleotide, tetranucleotide, pentanucleotide, and hexanucleotide repeats were filtered out. The sequence length on both sides of each SSR locus was > 100 bp; screening was conducted to identify compound SSRs with a base interval ≤ 100 bp. Primers were designed using Primer 3 (https://sourceforge.net/projects/primer3/)52, and 13 pairs of primers (synthesized by Shanghai Biotechnology Co., Ltd.; Shanghai, China) were randomly selected for polymerase chain reaction (PCR) amplification. The parameters for primer design were as follows: primer length, 18–25 bp; PCR product size, 100–300 bp; annealing temperature, 50–60 °C; and GC content, 40–60%. The specific sequences of primers used in this study are shown in Table S2.
EST-SSR analysis
Wet mycelia from each strain were used for genomic DNA isolation. DNA was extracted and purified using the DNAsafe Plant Kit (TIANGEN, China). Each DNA sample was diluted to a working concentration of 50 ng/μL, and whole-genome DNA was stored at − 20 °C. In total, 102 primer pairs were randomly chosen and synthesized by Shanghai Biotechnology Co., Ltd. to develop polymorphic EST-SSR markers. After screening, 13 pairs of polymorphic primers were selected for analysis of genetic diversity in 52 wild A. heimuer strains. The PCR reaction system (20 μL) contained 10 μL of 2 × Rapid Taq Master Mix (Vazyme Biotech, Nanjing, China), 1 μL of primer, 1 μL of genomic DNA (50 ng), and ddH2O to a total volume of 20 μL. The PCR amplification conditions were hot start for 5 min at 94 °C, followed by 35 cycles of denaturation for 30 s 94 °C, annealing for 45 s at a primer-specific temperature, and extension for 1 min at 72 °C; the final step comprised extension for 10 min at 72 °C. PCR products were analyzed using an Amersham Imager 600 PCR gel imager (GE Healthcare, USA). PCR product bands on gel images observed were scored as present (1) or absent (0). Dice genetic similarity coefficient values were calculated using NTSYSpc (https://www.appliedbiostat.com/ntsyspc/update_NTSYSpc.html), then compared via the unweighted pair group method with arithmetic mean (UPGMA) for cluster analysis and system tree construction40. STRUCTURE software (version 2.3.4) was used to analyze the population structure of 52 A. heimuer individuals. Fifteen independent runs were performed for K values ranging from 2 to 12, each with 10,000 burn-in iterations and 500,000 Markov chain Monte Carlo repetitions. The online tool STRUCTURE HARVESTER was used to calculate the ΔK value indicating optimal population stratification. Graphs were plotted according to the optimal K value results53,54.
Supplementary Information
Acknowledgements
Thanks are due to Professor Dai and Zhang for assistance with the experiments and valuable discussion. This work was supported by grants from special funds of scientific research business fee project of Heilongjiang scientific research insititution (CZKYF2022SW01).
Abbreviations
- SSR
Simple sequence repeats
- gSSR
Genomic-SSR
- EST-SSR
Expressed sequence tags-SSR
- EST
Expressed sequence tag
- Unigene
Universal gene
- NR
Non-redundant protein
- KOG
Eukaryotic homologous group
- MISA
MIcroSAtellite Identification Tool
- CDD
Conserved domains database
- Pfam
The protein family database
- KEGG
Kyoto encyclopedia of genes and genomes
- KOG
EuKaryotic Orthologous Groups
- BP
Biological processes
- CC
Cellular components
- MF
Molecular functions
Author contributions
Lihe Jiao: Methodology and Writing—Original Draft. Xiaodong Dai and Yunzhi Zhang: Conceptualization. Chuang Han: Writing—Review and Editing. Jianan Zhu: Visualization. Piqi Zhang and Yinpeng Ma: Project administration. All authors reviewed the manuscript.
Data availability
The data that support the findings of this study are available from the corresponding author upon reasonable request. The dataset is available from the NCBI BioProject (PRJNA1056119) and NCBI Short Read Archive (SRA) with accession number SRR27341122–SRR27341131.
Competing interests
The authors declare no competing interests.
Footnotes
Publisher's note
Springer Nature remains neutral with regard to jurisdictional claims in published maps and institutional affiliations.
These authors contributed equally: Chuang Han, Jianan Zhu, Piqi Zhang and Yinpeng Ma.
Contributor Information
Xiaodong Dai, Email: heiweihlj@126.com.
Yunzhi Zhang, Email: skxyzyz@163.com.
Supplementary Information
The online version contains supplementary material available at 10.1038/s41598-024-63080-1.
References
- 1.Wu F, Yuan Y, Malysheva V, Du P, Dai Y-C. Species clarification of the most important and cultivated Auricularia mushroom “Heimuer”: Evidence from morphological and molecular data. Phytotaxa. 2014;186:241–253. doi: 10.11646/phytotaxa.186.5.1. [DOI] [Google Scholar]
- 2.Wu, Z. C. Preliminary Study on the Biosynthesis of Main Active Ingredients of Auricuralia auricular. Wenzhou University (2018).
- 3.Sun, X. D. et al. Analysis of selemium content in common and selenium enriched Auricularia auricular and Lentinus edodes in China. Qual. Saf. Agroprod01, 38–41 (2021).
- 4.Ito VC, Lacerda LG. Black rice (Oryza sativa L.): A review of its historical aspects, chemical composition, nutritional and functional properties, and applications and processing technologies. Food Chem. 2019;301:125304. doi: 10.1016/j.foodchem.2019.125304. [DOI] [PubMed] [Google Scholar]
- 5.Reza MA, Jo WS, Park SC. Comparative antitumor activity of jelly ear culinary-medicinal mushroom, Auricularia auricula-judae (Bull.) J. Schrot. (higher basidiomycetes) extracts against tumor cells in vitro. Int. J. Med. Mushrooms. 2012;14:403–409. doi: 10.1615/intjmedmushr.v14.i4.80. [DOI] [PubMed] [Google Scholar]
- 6.Xiao-yan W, Wei-rong C, Ying Z. Ultrasonic ware extraction from Auricularia auricula and the anticoagulant activity of its polysaccharides. Food Ferment. Ind. 2015;41:219–223. doi: 10.13995/j.cnki.11-1802/ts.201512042. [DOI] [Google Scholar]
- 7.Zhang T, Zhao W, Xie B, Liu H. Effects of Auricularia auricula and its polysaccharide on diet-induced hyperlipidemia rats by modulating gut microbiota. J. Funct. Foods. 2020;72:104038. doi: 10.1016/j.jff.2020.104038. [DOI] [Google Scholar]
- 8.Xiao B, et al. The lipid lowering and antioxidative stress potential of polysaccharide from Auricularia auricula prepared by enzymatic method. Int. J. Biol. Macromol. 2021;187:651–663. doi: 10.1016/j.ijbiomac.2021.07.138. [DOI] [PubMed] [Google Scholar]
- 9.Pascoe MJ, Maillard JY. The role of melanin in Aspergillus tolerance to biocides and photosensitizers. Lett. Appl. Microbiol. 2021;72:375–381. doi: 10.1111/lam.13437. [DOI] [PubMed] [Google Scholar]
- 10.Yu, H. Y. et al. Domestication cultivation and evaluation of five wild Auricularia heimuer strains. North. Hortic 01, 1–8 (2024).
- 11.Fu Y-B. Understanding crop genetic diversity under modern plant breeding. Theor. Appl. Genet. 2015;128:2131–2142. doi: 10.1007/s00122-015-2585-y. [DOI] [PMC free article] [PubMed] [Google Scholar]
- 12.Grover A, Sharma PC. Development and use of molecular markers: Past and present. Crit. Rev. Biotechnol. 2016;36:290–302. doi: 10.3109/07388551.2014.959891. [DOI] [PubMed] [Google Scholar]
- 13.Verma KS, Ul Haq S, Kachhwaha S, Kothari SL. RAPD and ISSR marker assessment of genetic diversity in Citrullus colocynthis (L.) Schrad: A unique source of germplasm highly adapted to drought and high-temperature stress. 3 Biotech. 2017;7:288. doi: 10.1007/s13205-017-0918-z. [DOI] [PMC free article] [PubMed] [Google Scholar]
- 14.Gupta PK, Rustgi S. Molecular markers from the transcribed/expressed region of the genome in higher plants. Funct. Integr. Genom. 2004;4:139–162. doi: 10.1007/s10142-004-0107-0. [DOI] [PubMed] [Google Scholar]
- 15.Zhang JC, et al. Identification of cultivated strains of Auricularia auricula from northeastern China by ISSR marker. Mycosystema. 2007;26:534–538. [Google Scholar]
- 16.Tang L, Xiao Y, Li L, Guo Q, Bian Y. Analysis of genetic diversity among Chinese Auricularia auricula cultivars using combined ISSR and SRAP markers. Curr. Microbiol. 2010;61:132–140. doi: 10.1007/s00284-010-9587-4. [DOI] [PubMed] [Google Scholar]
- 17.Li L, Fan X-Z, Liu W, Xiao Y, Bian Y-B. Comparative analysis on the diversity of Auricularia auricula-judae by physiological characteristics, somatic incompatibility and TRAP fingerprinting. World J. Microbiol. Biotechnol. 2011;27:2081–2093. doi: 10.1007/s11274-011-0671-0. [DOI] [Google Scholar]
- 18.Yao FJ, et al. Development of a molecular marker for fruiting body pattern in Auricularia auricula-judae. Mycobiology. 2018;46:72–78. doi: 10.1080/12298093.2018.1454004. [DOI] [PMC free article] [PubMed] [Google Scholar]
- 19.Li H, Zhang M, Qu L, Liu GL, Liu YY. Analyse on genetic diversity of Auricularia auricular strains with ISSR-PCR molecular marker. Hortic. Seed. 2019;39:1–3+23. doi: 10.16530/j.cnki.cn21-1574/s.2019.06.001. [DOI] [Google Scholar]
- 20.Kalia R, Rai M, Kalia S, Singh R, Dhawan A. Microsatellite markers: An overview of the recent progress in plants. Euphytica. 2011;177:309–334. doi: 10.1007/s10681-010-0286-9. [DOI] [Google Scholar]
- 21.Jelvehgar N, Miri SM, Mostafavi K, Mohammadi A. Genetic analysis of Lepidium spp. by SSR and ISSR molecular markers. Plant Gene. 2021;28:100332. doi: 10.1016/j.plgene.2021.100332. [DOI] [Google Scholar]
- 22.Eujayl I, Sorrells ME, Baum M, Wolters P, Powell W. Isolation of EST-derived microsatellite markers for genotyping the A and B genomes of wheat. Theor. Appl. Genet. 2002;104:399–407. doi: 10.1007/s001220100738. [DOI] [PubMed] [Google Scholar]
- 23.Varshney RK, Graner A, Sorrells ME. Genic microsatellite markers in plants: Features and applications. Trends Biotechnol. 2005;23:48–55. doi: 10.1016/j.tibtech.2004.11.005. [DOI] [PubMed] [Google Scholar]
- 24.Fan L, et al. Transferability of newly developed pear SSR markers to other Rosaceae species. Plant Mol. Biol. Report. 2013;31:1271–1282. doi: 10.1007/s11105-013-0586-z. [DOI] [PMC free article] [PubMed] [Google Scholar]
- 25.Guo R, et al. Characterization and cross-species transferability of EST–SSR markers developed from the transcriptome of Dysosma versipellis (Berberidaceae) and their application to population genetic studies. Mol. Breed. 2014;34:1733–1746. doi: 10.1007/s11032-014-0134-z. [DOI] [Google Scholar]
- 26.Liu C-Y, Li N-Y, Zhang Y-Q. Development of expressed sequence tag-simple sequence repeat(EST-SSR)markers in Lentinula edodes. Acta Edulis Fungi. 2010;17:1–6. doi: 10.16488/j.cnki.1005-9873.2010.02.014. [DOI] [Google Scholar]
- 27.Foulongne-Oriol M, et al. The first set of expressed sequence tags (EST) from the medicinal mushroom Agaricus subrufescens delivers resource for gene discovery and marker development. Appl. Microbiol. Biotechnol. 2014;98:7879–7892. doi: 10.1007/s00253-014-5844-y. [DOI] [PubMed] [Google Scholar]
- 28.Fu Y, et al. Comparative transcriptome analysis identified candidate genes related to Bailinggu mushroom formation and genetic markers for genetic analyses and breeding. Sci. Rep. 2017;7:9266. doi: 10.1038/s41598-017-08049-z. [DOI] [PMC free article] [PubMed] [Google Scholar]
- 29.Ma J, et al. Development of EST-SSR markers based on transcriptome sequencing of Morchella spp. and its genetic diversity analysis Jiangsu. J. Agric. Sci. 2020;36:1282–1290. [Google Scholar]
- 30.Yiqin, W. et al. Characteristics and polymorphism analysis of EST-SSR markers from Auricularia fibrillifera transcriptome. Mol. Plant Breed 22(08), 2611–2619 (2024).
- 31.Taheri S, et al. Mining and development of novel SSR Markers using next generation sequencing (NGS) data in plants. Molecules. 2018;23:399. doi: 10.3390/molecules23020399. [DOI] [PMC free article] [PubMed] [Google Scholar]
- 32.Faure D, Joly D. Next-generation sequencing as a powerful motor for advances in the biological and environmental sciences. Genetica. 2015;143:129–132. doi: 10.1007/s10709-015-9831-8. [DOI] [PubMed] [Google Scholar]
- 33.Jiang Y, et al. Characterization, validation, and cross-species transferability of EST-SSR markers developed from Lycoris aurea and their application in genetic evaluation of Lycoris species. BMC Plant Biol. 2020;20:522. doi: 10.1186/s12870-020-02727-3. [DOI] [PMC free article] [PubMed] [Google Scholar]
- 34.Zhou Y, Chen L, Fan X, Bian Y. De novo assembly of Auricularia polytricha transcriptome using Illumina sequencing for gene discovery and SSR marker identification. PLoS One. 2014;9:e91740. doi: 10.1371/journal.pone.0091740. [DOI] [PMC free article] [PubMed] [Google Scholar]
- 35.Fu Y-P, et al. De novo sequencing and transcriptome analysis of Pleurotus eryngii subsp. tuoliensis (Bailinggu) mycelia in response to cold stimulation. Molecules. 2016;21:560. doi: 10.3390/molecules21050560. [DOI] [PMC free article] [PubMed] [Google Scholar]
- 36.Deng K, Deng R, Fan J, Chen E. Transcriptome analysis and development of simple sequence repeat (SSR) markers in Zingiber striolatum Diels. Physiol. Mol. Biol. Plants. 2018;24:125–134. doi: 10.1007/s12298-017-0485-0. [DOI] [PMC free article] [PubMed] [Google Scholar]
- 37.Cheng X, Wang F, Luo W, Kuang J, Huang X. Transcriptome analysis and identification of a female-specific SSR marker in Pistacia chinensis based on Illumina paired-end RNA sequencing. Genes (Basel) 2022;13:1024. doi: 10.3390/genes13061024. [DOI] [PMC free article] [PubMed] [Google Scholar]
- 38.Haq SU, Jain R, Sharma M, Kachhwaha S, Kothari SL. Identification and characterization of microsatellites in expressed sequence tags and their cross transferability in different plants. Int. J. Genom. 2014;2014:863948. doi: 10.1155/2014/863948. [DOI] [PMC free article] [PubMed] [Google Scholar]
- 39.Emami A, Shabanian N, Rahmani M-S, Khadivi A, Mohammad-Panah N. Genetic characterization of the Crataegus genus: Implications for in situ conservation. Sci. Hortic. 2018;231:56–65. doi: 10.1016/j.scienta.2017.12.014. [DOI] [Google Scholar]
- 40.Yang J, Yu H-Y, Li X-J, Dong J-G. Genetic diversity and population structure of Commelina communis in China based on simple sequence repeat markers. J. Integr. Agric. 2018;17:2292–2301. doi: 10.1016/S2095-3119(18)61906-9. [DOI] [Google Scholar]
- 41.Cai K, et al. Development and characterization of EST-SSR markers from RNA-Seq data in Phyllostachys violascens. Front. Plant Sci. 2019;10:50. doi: 10.3389/fpls.2019.00050. [DOI] [PMC free article] [PubMed] [Google Scholar]
- 42.Dreisigacker S, et al. SSR and pedigree analyses of genetic diversity among CIMMYT wheat lines targeted to different megaenvironments. Crop Sci. 2004;44:381–388. doi: 10.2135/cropsci2004.3810. [DOI] [Google Scholar]
- 43.Temnykh S, et al. Computational and experimental analysis of microsatellites in rice (Oryza sativa L.): Frequency, length variation, transposon associations, and genetic marker potential. Genome Res. 2001;11:1441–1452. doi: 10.1101/gr.184001. [DOI] [PMC free article] [PubMed] [Google Scholar]
- 44.Wierdl M, Dominska M, Petes TD. Microsatellite instability in yeast: Dependence on the length of the microsatellite. Genetics. 1997;146:769–779. doi: 10.1093/genetics/146.3.769. [DOI] [PMC free article] [PubMed] [Google Scholar]
- 45.Xin Y, et al. Cluster analysis of ten Pleurotus geesteranus strains based on random amplification of polymorphic DNA (RAPD) and expressed sequence tag- single sequence repeats (EST-SSR) markers. Acta Edulis Fungi. 2008;15:20–25. doi: 10.16488/j.cnki.1005-9873.2008.04.009. [DOI] [Google Scholar]
- 46.Ma J, et al. Development of EST-SSR markers based on transcriptome sequencing of Morchella spp. and its genetic diversity analysis. Jiangsu J. Agric. Sci. 2020;36:1282–1290. [Google Scholar]
- 47.Venugopal V, et al. Development of EST-SSR markers based on transcriptome and its validation in ginger (Zingiber officinale Rosc.) Public Libr. Sci. One. 2021;16:e0259146. doi: 10.1371/journal.pone.0259146. [DOI] [PMC free article] [PubMed] [Google Scholar]
- 48.Lu S. Transcriptome analysis and development of EST-SSR markers in Anoectochilus emeiensis (Orchidaceae) Public Libr. Sci. One. 2022;17:e0278551. doi: 10.1371/journal.pone.0278551. [DOI] [PMC free article] [PubMed] [Google Scholar]
- 49.Sun M, et al. EST–SSR marker development and full-length transcriptome sequence analysis of Tiger Lily (Lilium lancifolium Thunb) Appl. Bionics Biomech. 2022;2022:1–9. doi: 10.1155/2022/7641048. [DOI] [PMC free article] [PubMed] [Google Scholar] [Retracted]
- 50.Xiang N, et al. De novo transcriptome assembly and EST-SSR marker development and application in Chrysosplenium macrophyllum. Genes. 2023;14:279. doi: 10.3390/genes14020279. [DOI] [PMC free article] [PubMed] [Google Scholar]
- 51.Grabherr MG, et al. Full-length transcriptome assembly from RNA-Seq data without a reference genome. Nat. Biotechnol. 2011;29:644–652. doi: 10.1038/nbt.1883. [DOI] [PMC free article] [PubMed] [Google Scholar]
- 52.Rozen S, Skaletsky H. Primer3 on the WWW for general users and for biologist programmers. Methods Mol. Biol. 2000;132:365–386. doi: 10.1385/1-59259-192-2:365. [DOI] [PubMed] [Google Scholar]
- 53.Evanno G, Regnaut S, Goudet J. Detecting the number of clusters of individuals using the software STRUCTURE: A simulation study. Mol. Ecol. 2005;14:2611–2620. doi: 10.1111/j.1365-294X.2005.02553.x. [DOI] [PubMed] [Google Scholar]
- 54.Ma S, Dong W, Lyu T, Lyu Y. An RNA sequencing transcriptome analysis and development of EST-SSR markers in Chinese Hawthorn through Illumina sequencing. Forests. 2019;10:82. doi: 10.3390/f10020082. [DOI] [Google Scholar]
Associated Data
This section collects any data citations, data availability statements, or supplementary materials included in this article.
Supplementary Materials
Data Availability Statement
The data that support the findings of this study are available from the corresponding author upon reasonable request. The dataset is available from the NCBI BioProject (PRJNA1056119) and NCBI Short Read Archive (SRA) with accession number SRR27341122–SRR27341131.


