

Abstract

Methanol-to-gasoline (MtG) is an alternative process for the production of liquid fuel that involves the conversion of methanol into light and heavy hydrocarbons. The attractiveness of this option relies on multiple feedstocks that can be used to produce methanol, which can impact the greenhouse gases emitted into the atmosphere in comparison to petroleum-based feedstocks. However, one of the challenges of this alternative gasoline production is its high investment cost. This study presents a solution to increase affordability by using repurposed equipment from petrochemical industries. The study employs three modeling techniques, i.e., kinetic modeling, process modeling, and techno-economic analysis. First, a lumped MtG kinetic mechanism using an hierarchical zeolite socony mobil-5 (HZSM-5) catalyst was developed and validated against the literature data to enable high-accuracy process modeling and optimization. Then, the kinetics were implemented in Aspen Plus V12 for process simulations of the fixed-bed MtG, optimization of the operating conditions, and heat integration to increase energy efficiency. Lastly, a techno-economic analysis (TEA) gives the levelized cost of the e-gasoline along with the sensitivity analysis to demonstrate the variables that mainly affect the cost. The TEA showed a price for the e-gasoline with a gray methanol feedstock of 1.82 USD/L, which is comparable with the current average retail gasoline price (1.29 USD/L). Additionally, increasing the capacity by 161 times can reduce the levelized price of e-gasoline to 0.761 USD/L.
1. Introduction
In the dynamic landscape of energy, oil-based fuels have long been the backbone, driving 90% of the energy supply for various transportation methods.1 They are also related to high levels of greenhouse gas emissions in the environment, prompting governmental actions that have recently been taken for oil displacement. One of the solutions is the partial or total implementation of electrified vehicles and the ban on internal combustion engine (ICE) sales between 2025 and 2050 across multiple countries.2 Despite the strides in cleaner energy alternatives, ICE vehicles and their infrastructure remain predominant in the current automobile market. Additionally, the technological and industrial transition from the usage of conventional fuels to the maturity of hydrogen-based technology, larger electric vehicle capacities, and infrastructure advancements3 is expected to take place over a long period of time. Consequently, conventional fuels still need to be produced in the next 20–30 years; meanwhile, the diversification of fuel feedstocks is designed to be compatible with the existing industrial operations, as they also provide alternative ways to reduce well-to-wheel emissions.
Research has been conducted for over a century to seek alternative ways to produce conventional fuels.4,5 Historically, oil crises have boosted the exploration of new fuel feedstocks and processes. An example is the Fischer–Tropsch (FT), invented in 1923, which had its first commercial plant installed in the 1930s.6 Functioning with a cobalt-based catalyst, FT aims to produce diesel from syngas. The popularity of this gas-to-liquid (GtL) process increased during the Second World War with the production of syngas from coal gasification. In opposition to the traditional FT methods, biomass thermal conversion methods have gained attention.7 However, major drawbacks such as the technology efficiency and investment costs have limited their application in more competitive scenarios.
Stepping beyond traditional fuels, alcohols like methanol, ethanol, or butanol have been used directly as fuels or additives for spark-ignition engines according to the US Energy Policy Act of 1992.8,9 Methanol is considered a strong candidate for feedstock diversification because it has an already established market and settled infrastructure for gray methanol, which is traditionally produced from natural gas by steam methane reformation (SMR) or partial oxidation.10 Nevertheless, methanol can be produced from other production methods with a lower carbon footprint, for example, through the utilization of biomethane derived from biomass or waste feedstocks.11 Green methanol synthesis by CO2 hydrogenation (as illustrated in Reaction R1,12) opens avenues for obtaining carbon dioxide from direct air capture and hydrogen from renewable-powered water electrolysis,13 or from syngas from bioenergy with carbon capture and storage (BECCS).12 This alternative generates a substantial reduction of emissions compared to the SMR.14
| R1 |
In addition to the application of methanol as a fuel, its high chemical potential allows the production of acetic acid, formaldehyde, ethylene, and propylene.12 Furthermore, it has been reported as an intermediate in the production of gasoline since the 1970s.15
This simple alcohol can be transformed into light and heavy hydrocarbons (including paraffin, olefins, naphthenes, and aromatics) in a process known as methanol-to-gasoline (MtG), a brainchild of ExxonMobil in 1987. The procedure describes the conversion of methanol into dimethyl ether (DME) and the subsequent transformation of DME into the hydrocarbon mixture in the presence of the zeolite socony mobil-5 (ZSM-5) catalyst in a fixed-bed reactor with a total or partial recycle of unreacted methanol.16 A simplified mechanism can be described as shown by Reactions R2–R4.17
| R2 |
| R3 |
| R4 |
The first MtG process, depicted in Figure 1, uses fixed-bed reactors and continues to this day.18 The process, as defined by Rojas in his thesis,19 starts with the input of methanol inside a packed-bed reactor filled with the γ-Al2O3 catalyst where Reaction R2 takes place. Then, the products enter a second reactor where Reactions R3 and R4 take place by using the ZSM-5 catalyst.
Figure 1.

Fixed-bed MtG process was performed by ExxonMobil.
After the reaction section, the temperature of the produced hydrocarbons is reduced, and the products are separated into light gases, the liquid organic phase (raw gasoline), and water. The light gases are recompressed and recycled in the produced DME, and the water is sent to a water treatment plant.
Then, the raw gasoline is refined by using three distillation columns in series. The first column is a de-ethanizer, where ethane and other light gases are removed. The second column is a stabilizer. Its purpose is the separation of low-pressure gas (LPG) composed of light hydrocarbons. Finally, the third column is a gasoline splitter. The objective is to isolate the heavier aromatics (≥C10), especially the produced durene (C10H14 or 1,2,4,5-tetramethylbenzene).
Durene has a high melting point (Tmelting = 79 °C); in other words, it can solidify at higher temperatures compared to other hydrocarbons.20 For this reason, the heavy-gasoline stream needs to be treated in a hydroisomerization process where Reactions R5 and R6 take place21 under the presence of a sulfided base metal catalyst for the production of two durene isomers whose melting temperatures are much lower: isodurene (1,2,3,5-tetramethylbenzene, Tmelting = −24 °C) and prehnitene (1,2,3,4-tetramethylbenzene, Tmelting = −7 °C).22
 |
R6 |
Finally, the light gasoline and treated gasoline are mixed in the final gasoline product. The reported characteristics and volumetric composition of the MtG gasoline by ExxonMobil are shown in Table 1.23 The sulfur content in the methanol sources as partial oxidation of natural gas can present a very low percentage of sulfur (approximately less than 10 wt %24,25). Hence, sulfur can be transmitted to the e-gasoline. However, if the production is done by CO2 hydrogenation with green hydrogen from renewable sources, the sulfur content in the MtG gasoline is zero.26
Table 1. MtG Gasoline Properties According to ExxonMobil.
| property | typical values |
|---|---|
| octane number, RON | 92–95 |
| octane number, MON | 82–85 |
| aromatics, vol % | 25–35 |
| olefins, vol % | 10–14 |
| benzene, vol % | ≤0.3 |
| durene, wt % | <2 |
| sulfur, mg/kg | ≤10 |
| final boiling point (FBP), °C | 200–210 |
Since the 1970s, the MtG process has evolved using different catalysts and reactors. For example, the mechanism in the MtG reactor is sensitive to the deposition of coke on the surface of the catalyst.27 To reduce this problem, the catalyst is replaced with hierarchical ZSM-5 (HZSM-5), which has shown lower coke formation due to the inclusion of micropores and mesopores where larger molecules can enter.28,29 Currently, more companies have implemented the MtG process and invested in innovation. For example, in 2015, ExxonMobil started a pilot plant using one fluidized-bed reactor operating at higher temperatures and pressures for the replacement of the DME and MtG reactors. This change has proven to make capital expenditures (CAPEX) and operational and maintenance expenditures (OPEX) more efficient, increase energetic efficiency, and increase reliability.23 However, the scalability and commercialization of the technology used in the fixed-bed MtG process was demonstrated in New Zealand from 1985 to 1997 by ExxonMobil.30
The expenditures of the MtG process have been explored in previous literature in a more holistic perspective as an alternative method in biomass-to-liquid (BTL) processes, aiming to serve as potential carbon-neutral technologies for the conversion of different types of biomasses into liquid fuels. Haro et al.31 demonstrated that combining hydrogen production from biomass gasification, gas cleaning, methanol synthesis, and gasoline synthesis increases the production costs of gasoline by 72% with respect to the retail price in 2013. In 2016, Dimitriou et al.32 concluded that the MtG process has a higher investment cost than FT due to the necessity of additional equipment for the methanol synthesis, thereby reducing its feasibility. Notwithstanding, the MtG process can simplify the production of gasoline by reducing the chain length of the produced hydrocarbons in fewer steps than the FT process.21 Moreover, the growing research toward CO2-to-methanol synthesis (for example, catalyst improvement, novel process routes, or equipment design) benefits the probabilities of commercialization.33 Albeit the initial investment cost is shown to be one of the major risks of the MtG process.
In this study, an alternative to reduce the CAPEX of the MtG process is presented, enabling this technology to be more competitive in the market and applied on a larger scale. It consists of repurposing old equipment used in the petrochemical industry, for example, reactors from refineries facing oil displacement.
In the production of heavy hydrocarbons, the operation at high pressures is crucial for enhancing olefin conversion. Therefore, the repurposing process was commenced by the selection of a high-pressure reactor from a refinery. This choice was based on the compatibility of the fixed-bed reactors from the catalytic reforming units with the MtG reaction conditions.
Catalytic reformation is a common process found in refineries where the objective is to increase the octane number of the gasoline through multiple catalytic packed fixed-bed reactors, as seen in Figure 2.34 The average length of these reactors is 12.5 m with 293–412 tubes35,36 and pressures varying between 100 and 1000 psi.37
Figure 2.

Process flowsheet of a catalytic reforming unit.
The present research aims to estimate the costs related to an MtG process using repurposed equipment, employing kinetic development and process simulations. The proposed kinetic modeling resulted in a lumped mechanism, where representative molecules were defined for each group of hydrocarbons. This method simplifies the MtG mechanism to make it suitable for process modeling and meanwhile gives a good overall agreement with the literature data. The results provided in this study hope to amplify the existing ideas of gasoline production with greener alternatives during the tech-transformation scenario, and it proposes a solution for the economic competitiveness of MtG gasoline in the market.
2. Methodology
2.1. Lumped Kinetic MtG Mechanism Development
A surrogate mechanism for the MtG reaction network was developed. As shown in Figure 3, methanol first undergoes dehydration to form dimethyl ether (DME), which was reported to happen very fast, according to the literature.38 DME undergoes further dehydration to form olefins (lower, higher). Lower olefins are known to give rise to aromatics, thereby releasing hydrogen gas. The hydrogen gas reacts with lower and higher olefins to form lower and higher alkanes, respectively. Higher alkanes in the presence of hydrogen can also break down to form lower alkanes.
Figure 3.

Simplified reaction diagram.
In this work, representative molecules were defined as surrogates for lower olefins, higher olefins, lower alkanes, higher alkanes, small aromatics, and large aromatics, as shown in Table 2. This simplified surrogate mechanism is intended to not only match the experimental literature data but also be used to optimize the Aspen Plus modeling of the complete MtG process, including the downstream section.
Table 2. Surrogate Molecules for the MtG Reactive Mechanism.
| type | surrogate molecule | name |
|---|---|---|
| lower olefins | C2H4 | ethylene |
| higher olefins | nC6H12 | hexene |
| lower alkanes | C2H6 | ethane |
| higher alkanes | nC6H14 | n-hexane |
| small aromatics | C6H6 | benzene |
| large aromatics | C10H14 | durene |
The experimental work from Choe et al. was the primary source for the development of the kinetic mechanism using Chemkin-Pro software.38,39 In their experiments, the MtG process was held in a batch microreactor packed with the HZSM-5 catalyst and fed with methanol. The reported pore space of the catalyst is 0.77 cm3/g, and its loading in the reactor is 2.5 g. Hence, the total pore space is 1.925 cm3. Especially, the results obtained by the authors for the MtG product distribution varied with the contact time and were used to determine the kinetics for a continuous process. For this case, the contact time can be converted to residence time by knowing the volumetric flow of methanol at 400 °C and 1 bar where the substance is present in the gas phase. The calculations are shown in Table 3 where the units of the contact time are equivalent to (gcat)/(g/hmethanol) and the volumetric flow of methanol considers the gas properties at 400 °C and 1 bar.
Table 3. Experimental Conversion of Contact Time to Residence Timea.
| methanol
flow |
|||
|---|---|---|---|
| contact time (h) | mass (g/h) | volume (cc/s) | residence time (s) |
| 0 | inf | inf | 0 |
| 0.2 | 12.5 | 5.99 | 0.32 |
| 0.4 | 6.25 | 3.0 | 0.64 |
| 0.6 | 4.17 | 2.0 | 0.96 |
| 0.8 | 3.13 | 1.5 | 1.28 |
Adapted from Choe et al.38
2.2. Aspen Plus Process Simulation
An Aspen Plus simulation (shown in Figure 4) was developed for the conversion of methanol into gasoline. The process started with the input of 100 wt % methanol (Stream 1) going into the tubular reactor packed with the γ-Al2O3 catalyst simulated as an RSTOIC model (Unit R-101) operating at 440 °C and 10 bar, where Reaction R1 takes place with 90% methanol conversion.40 Then, the produced water, DME, and unreacted methanol (Stream 5) flowed to hydrocarbon or e-gasoline production. This reactive section was simulated in two stages. The first one is an RSTOIC model for the conversion of methanol over the HZSM-5 catalyst (Unit R-101–2) including Reaction R1 at 10 bar and 400 °C with 80% methanol conversion.41 The second reactive section consists of three RPlug Aspen models (Units R-102, R-103, and R-104) in parallel, resembling three repurposed catalytic reforming packed-bed reactors of 400 tubes of 12.5 m length and 1 in. diameter operating at 400 °C and 10 bar.42 For this reaction, Stream 8 was divided into three equal parts, resulting in Streams 8–1, 8–2, and 8–3, to ensure consistent reactor performance. Additionally, each RPlug reactor includes the lumped kinetic model developed in this study and is presented in Section 3.1 for the conversion of DME into hydrocarbons. The capacity and product distribution of detailed reactive models such as the RPlug or CSTR are limited by the length or volume of the reactor. Therefore, by using the three repurposed reactors in a parallel configuration, the total e-gasoline capacity can be maximized.
Figure 4.

Simulation flowsheet of a fixed-bed MtG process.
After the reaction, the products were mixed in Stream 9 and cooled in multiple stages (Units E-105, E-106, and E-107) before an adiabatic three-phase flash separation (Unit S-101). This unit divides the products of the reaction into gas (Stream 16, recycled to the reaction system), wastewater (Stream 21, sent to treatment), and raw gasoline (Stream 22).
The raw gasoline went through a de-ethanizer (T-101) and stabilizer (T-102). The purpose of the refining of gasoline is the thermal separation of the components that can affect the gasoline composition at ambient conditions. Following this, the separation yielded two byproducts: an ethylene-rich stream (Stream 24) from the top of T-101 and a gaseous mixture of light alkanes and lower benzenes (Stream 28) from the top of T-102. Then, a gasoline splitter (T-103) was used to concentrate the higher hydrocarbons in Stream 32 and fully separate the durene in the bottom of T-103 (Stream 33). Table 4 shows the specifications used in the simulation for the distillation columns.
Table 4. Specifications of the Distillation Columns.
| T-101 | T-102 | T-103 | |
|---|---|---|---|
| Tentrance (°C) | 40 | 50 | 60 |
| # stages | 12 | 8 | 4 |
| distillate rate (kmol/h) | 0.63 | 6.7 | 4.5 |
| reflux ratio | 1.45 | 0.91 | 0.01 |
The durene-rich stream (Stream 33) was processed in a hydroisomerization section using an RSTOIC reactor (Unit R-105) with 49% durene conversion in Reaction R4 and 0.015 kmol/h molar extent in Reaction R5 at 345 °C and 16 bar requiring a continuous and equimolar input of hydrogen (total hydrogen input in Stream 49 with a makeup stream calculated in Stream 45).21 The product of hydroisomerization (Stream 50) was heavy gasoline with a low durene content that was mixed with the light gasoline (Stream 32, top product of T-103), resulting in Stream 51. Finally, a flash separation at 25 °C and 1 bar (S-103) gives the final gasoline product in the liquid fraction (Stream 54). Variations in the temperatures and dimensions of the MtG reactors were critical for the final quality of the gasoline.
2.3. CAPEX and OPEX Calculations
To determine the OPEX, utilities, reagents, and labor costs were defined. The utilities (such as fired heat, low- or medium-pressure steam, cooling water, and propane refrigerant) were specified to all the units depending on their operating temperatures in the Aspen Plus simulation. Then, the total utility consumption and cost were reported by Aspen Energy Analyzer, where the unit prices of the utilities were fixed by the software.
Continuing with the definition of the expenditures of the reagents, the price of hydrogen was fixed at 1500 USD/ton.43 Also, the price of methanol was varied between 150 and 1000 USD/ton44,45 to understand the impact of different methanol sources (gray or green methanol) over the levelized price of e-gasoline.
Finally, the Aspen Process Economic Analyzer (APEA) was used for the estimation of the costs related to supervision, operating, and maintenance labor, which depends on the total plant size. This software was also used in the calculation of CAPEX for the determination of equipment costs and engineering, procurement, and construction (EPC). APEA is a helpful tool for sizing, mapping, and evaluating the equipment, as well as estimating other values such as piping, accessories, insulation, etc.
Based on the capital expenditure and operational costs estimated, the suggested plant’s levelized cost of production was calculated using the carrying charge method to account for all the capital and operational costs. The LCOP reflects the net present cost of production for the plant over the project’s lifetime, which also equals the price at which the product should be sold for the plant to break even at the end of its lifetime.
The financial assumptions made in the calculations are listed in Table 5. The plant would run with 20,000 cells with an annual capacity of 309 kg at a 90% utilization rate. The lifetime of the plant was assumed to be 10 years, which is the same for depreciation and debt payback period. The project was financed with 50% debt at an after-tax cost of 2.4 and 50% equity at a real internal rate of return of 8% (nominal 9.24%), typical for chemical plants. The depreciation method was a straight line for 10 years. The development and construction of the plant were completed in one year, and there would be no salvage value of the plant at the end. The inflation rate was set to be 1.18% and the tax rate to be 20%, both of which are based on the KSA average value.
Table 5. Assumptions for the Techno-Economic Assessment.
| assumptions | value | unit | |
|---|---|---|---|
| plant specifications | plant capacity | 4745 | metric ton |
| plant life | 20 | year | |
| utilization rate | 90% | ||
| annual output | 4217 | metric ton | |
| starting year | 2023 | ||
| development and construction period | 1 | year | |
| financial specifications | nominal hurdle IRR | 9.24% | |
| cost of debt (after tax) | 2.40% | ||
| gearing ratio | 1:1 | ||
| debt tenor | 10 | year | |
| inflation rate | 1.18% | ||
| income tax rate | 20% | ||
| depreciation method | straight line | ||
| depreciation life | 10 | year | |
| salvage value | 0 | USD |
The scalability of the process can be explored through a simplified method for cost estimation. This method involves defining a scaling factor (Sca), as shown in eq 1. By multiplying this factor with the utilities and materials, it becomes possible to predict the OPEX for larger capacities.46
| 1 |
Similarly, the scaling factor can be applied to the CAPEX by considering terms such as EPC or equipment cost. In this case, eq 2 is used to calculate the cost of the new equipment, where e is the proration or capacity factor. The value of e can be defined between 0.5 and 0.7 depending on the type of equipment.47
| 2 |
3. Results and Discussion
3.1. Kinetic Model Validation
In the Chemkin-Pro software, a closed homogeneous batch reactor was used to simulate the MtG process to form predefined surrogate molecules by a set of lumped reactions, as listed in Table 6.
Table 6. List of Reactions Considered in the Lumped Kinetic System.
| no. | reactions |
|---|---|
| 1 |  |
| 2 |  |
| 3 |  |
| 4 |  |
| 5 |  |
| 6 |  |
| 7 |  |
| 8 |  |
The kinetics parameters calculated in the Chemkin-Pro software are shown in Table 7 for the Arrhenius expression eq 3. The basis unit for the kinetic expression are mol/cm3, and the rate units are mol/(cm3·s).
| 3 |
Table 7. Calculated Kinetic Parameters for the MtG Reaction over the HZSM-5 Catalysta.
| no. | A | Ea (cal/mol) |
|---|---|---|
| 1 | 629 | 1.9246 × 10¹¹ |
| 2 | 3.98 | 49,748 |
| 3 | 1.92 | 41,840 |
| 4 | 1.23 | 39,480 |
| 5 | 5.23 | 58,706 |
| 6 | 8.23 × 10⁶ | 259,410 |
| 7 | 1.28 × 10⁶ | 25,941 |
| 8 | 1.28 × 10¹⁰ | 1882.8 |
A: pre-exponential factor; Ea: activation energy.
Based on it, the major and minor product trends are shown in the Figures 5 and 6 and compared with the experimental information reported by Choe et al.38 As expected, the lower olefin content first rises and then falls as it is converted to aromatics and to lower alkanes by hydrogenation. Higher olefin content also displays a maximum as it is converted to higher alkanes. The content of oxygenates (represented as methanol or DME) decreases in the first-order trend. Additionally, the aromatics and alkanes increase over time. In summary, the trends from the experiment were reproduced by the kinetic mechanism, and an acceptable agreement of the final yield at a residence time of 1.3 s was achieved for all species. Overall, the lumping mechanism is considered adequate for a further process modeling study. Additionally, an alternative lumped kinetic mechanism is shown in the Supporting Information.
Figure 5.

Model validation with the MtG experimental data (1 atm and 400 °C) for oxygenates, lower olefins, and aromatics.
Figure 6.

Model validation with the MtG experimental data (1 atm, 400 °C) for higher olefins and lower and higher alkanes.
3.2. Optimization of the MtG Process
The defined operating conditions of the optimized process are listed in Table 8. The following paragraphs explore the variation in the main parameters of the simulation as the capacity, recycles, and product distribution in some of the implemented models.
Table 8. Defined Operating Conditions for Different Units.
| unit number | type of aspen model | Toperating (°C) | Poperating (bar) | other specifications |
|---|---|---|---|---|
| P-101 | pump | 10 | ||
| E-101 | heatX | 316 | cold stream outlet | |
| E-102 | heater | 316 | 10 | |
| R-101 | RStoic | 10 | adiabatic | |
| E-103 | heater | 400 | 10 | |
| R-101–2 | RStoic | 400 | 10 | |
| C-100 | compressor | 20 | isentropic | |
| R-102 | RPlug | 400 | 20 | isothermal |
| R-103 | RPlug | 400 | 20 | isothermal |
| R-104 | RPlug | 400 | 20 | isothermal |
| E-104 | heatX | 5 K hot/cold out temp. appr. | ||
| E-105 | heater | 100 | 20 | |
| E-106 | heater | 70 | 20 | |
| E-107 | heater | 30 | 20 | |
| V-100 | valve | 15 | adiabatic flash | |
| S-101 | flash3 | 15 | adiabatic | |
| C-101 | compressor | 21 | isentropic | |
| E-108 | heater | 40 | 15 | |
| V-105 | valve | 5 | adiabatic flash | |
| E-109 | heater | 50 | 5 | |
| V-106 | valve | 1 | adiabatic flash | |
| E-110 | heater | 60 | 1 | |
| P-102 | pump | 16 | ||
| E-111 | heatX | 150 | cold stream out temp. increase | |
| E-112 | heater | 345 | 16 | |
| R-105 | RStoic | 345 | 16 | isothermal |
| E-113 | heater | 135 | 16 | |
| E-114 | heater | 80 | 16 | |
| E-115 | heater | 30 | 16 | |
| S-102 | flash2 | 30 | 16 | |
| C-102 | turbine | 16 | isentropic | |
| E-116 | heater | 345 | 16 | |
| E-117 | heater | 60 | 16 | |
| E-118 | heater | 25 | 1 | |
| S-103 | flash2 | 25 | 1 | isothermal |
Initially, the focus of the process modeling was to study whether the repurposed catalytic reforming unit was suitable for the MtG process. The first stage of the process simulation is the definition of the capacity of the plant. In this case, the production of gasoline is constrained by the design specifications of the three reactors provided by the catalytic reforming unit. It was determined that the amount of methanol that can be processed is 1600–4900 kg/h under the defined operating conditions. The operation at full capacity increases the production of the e-gasoline by only 10 kg/h, and it affects the final product distribution as seen in Figure 7. Consequently, the following results are based on the conversion of 1600 kg/h of methanol.
Figure 7.

Variation of the plant capacity and e-gasoline composition with methanol input.
Therefore, the composition of the reactor products was simulated as a function of the reactor length, and the results are shown in Figure 8. As expected, by implementing the lumped mechanism in the Aspen Plus simulation, the olefins and paraffins are produced and consumed inside the MtG reactor to be converted into higher alkanes (n-hexane) and aromatics (benzene). As seen in the figure, the reactor length of the repurposed catalytic reforming unit (12.5 m) gives a high conversion of DME and a high yield to alkanes and benzene for the studied plant capacity.
Figure 8.

Mass flow profile of reaction products and methanol conversion along the MtG reactor length.
One of the most relevant steps for the quality of the final gasoline product is the first recycling performed after the MtG reaction in the water separation and recycle section of the process (identified in Figure 4). In Figure 9, the mass flow variation of the raw gasoline components (in Stream 21) that are mainly affected by the split fraction in the splitter V-104 is shown. At larger values of split fraction in this joint, higher mass flows will be in the purge stream (Stream 16). Then, a value of 1 means no recycling of gas into the reactor, and a 0 value represents full recycling to the methanol and MtG reaction units (R-101, R-101–2, R-102, R-103, and R-104). The recycled gas is mainly composed of ethane; therefore, having less ethane recirculating in the system gives less conversion of olefins in the MtG reactor and increases the presence of ethane in the raw gasoline, simultaneously changing the refining conditions. A split fraction of 0.5 gives a hexane production near the maximum value and reduces the requirements of compression in the recycle.
Figure 9.

Effect of the split fraction in V-104 on the mass flow of the main components of the raw gasoline (Stream 21).
The refining of the raw gasoline starts in T-101 where the objective is the separation of ethane. As seen in Figure 10a,b, a high concentration of ethane is recovered at the top of the column; meanwhile, heavier hydrocarbons are recovered at the bottom. At the operating conditions, light components such as ethane and ethylene are mainly shown as vapor along the tower. The second column (T-102) increases the operating conditions (temperature and pressure). This way, the light alkanes, paraffins, olefins, and oxygenates can be recovered at the top of the column as a low-pressure gas (Figure 10c,d). The separation of these components allows the storage of gasoline in atmospheric tanks. Finally, the gasoline splitter (T-103) successfully separates the total amount of durene at the bottom of the column, as seen in Figure 10e. The top of T-103 is called the light-gasoline cut, and it is composed of 65 wt % hexane and 29 wt % benzene. The bottom is heavy gasoline and has a composition of 49 wt % hexane, 35 wt % benzene, and 13 wt % durene. Different country and ExxonMobil regulations allow a maximum of 2 wt % of durene in commercial gasoline.48 For this reason, it is mandatory to treat the heavy-gasoline cut as previously described.
Figure 10.

Mass composition profiles of distillation. (a) Liquid composition of T-101. (b) Vapor composition of T-101. (c) Liquid composition of T-102. (d) Vapor composition of T-102. (e) Liquid composition of T-103. (f) Vapor composition of T-103.
The hydroisomerization unit successfully reduces the composition of 13 to 5.5 wt % with a low input of hydrogen. Finally, the mixture of the light and hydrotreated heavy-gasoline cuts after the separation of light components at atmospheric conditions gives the composition shown in Table 9, along with the MtG gasoline compositions reported by ExxonMobil.23 The aromatic and alkane compositions fit in the ranges of the commercial values; however, the clear discrepancies between the reported olefin volumetric compositions are the result of the limitations of the lumped model regarding its simplicity. As shown in Figure 6, the final yield of higher olefins is significantly underestimated by the lumped mechanism. However, given its generally good agreement and simplified nature, we consider that a combination of the kinetic and process modeling successfully reproduces the e-gasoline blends for the MtG process.
Table 9. Composition of MtG e-Gasoline.
| lumped group | ExxonMobil23 | our simulation |
|---|---|---|
| aromatics (vol %) | 25–35 | 29 |
| oefins (vol %) | 10–14 | 5 |
| durene (wt %) | ≤2 | 1.9 |
| alkanes (vol %) | 51–65 | 66 |
Figure 11 shows the behavior of the final MtG gasoline components with the variation in the purity of the fed methanol blending with levels of water. As can be seen, the changes in the produced quantities of ethane and durene are not significant. Meanwhile, the production of large alkanes (hexane) and light aromatics (benzene) increases by 28.5%, and the production of olefins (hexene) decreases at higher purity values. This means that the conversion of olefins into larger hydrocarbons is enhanced at a lower water content. As previously mentioned, in the present study, a 100 wt % methanol input was assumed. Nevertheless, despite commercial methanol of grades A and AA having a very high purity (99.85 wt %), a coupled production of methanol and gasoline can permit lower methanol concentrations.
Figure 11.

Effect of methanol purity on the e-gasoline components.
3.3. CAPEX and OPEX Results
The total consumption of energy is 1164 MW (equivalent to 10,197,840 MWh/year) distributed as shown in Table 10 by different types of utilities used in the simulation. A clearer view of the distribution of the total utility consumption is shown in Figure 12a.
Table 10. Energy Consumption and Cost by Utility.
| utility consumption | energy price | |
|---|---|---|
| units | MWh/year | USD/MWh |
| cooling water | 3569.21 | 0.76 |
| electricity | 8.57 | 77.50 |
| fired heat | 172.98 | 15.30 |
| low-pressure steam | 536.40 | 6.84 |
| medium-pressure steam | 545.05 | 7.92 |
| refrigerant | 48.88 | 9.86 |
Figure 12.

Distribution of the heating and cooling utilities (a) and distribution of the total utility cost (b).
As seen in Figure 12b, the utility costs are mainly represented by the heating utilities because of the high unit price of the fired heat. Based on the reported utility consumption and for a plant capacity of 4916 t of gasoline per year, the detailed expenditures of operation and maintenance are shown in Table 11.
Table 11. Detailed OPEX for a Plant Production of 4916 Tons/Yeara.
| cost | unit | |
|---|---|---|
| total O&M | 6,330,499.91 | USD/year |
| total variable O&M | 3,384,899.91 | USD/year |
| total unit opex | 1343.00 | USD/ton gasoline |
| labor cost | 2,897,800 | USD/year |
| operating labor | 1,800,000 | USD/year |
| maintenance | 47,800 | USD/year |
| supervision | 1,050,000 | USD/year |
| reagents cost | 715.02 | USD/ton gasoline |
| methanol | 714 | USD/ton gasoline |
| unit cost | 250 | USD/ton |
| consumption | 3 | ton/ton gasoline |
| hydrogen | 1 | USD/ton gasoline |
| unit cost | 1500 | USD/ton |
| consumption | 0.001 | ton/ton gasoline |
| total utility cost | 14,502.69 | USD/year |
All units in metric tons.
In Table 12, the detailed CAPEX expenditures are shown. The total equipment costs include the materials and installation, and the costs of reactors are assumed to be zero.
Table 12. Detailed CAPEX.
| cost | unit | |
|---|---|---|
| total capital cost | 37,686,628 | USD |
| equipment cost | 12,822,775.5 | USD |
| purchased equipment | 6,599,600 | USD |
| heat exchangers | 165,800 | USD |
| recycling units | 463,700 | USD |
| distillation | 223,300 | USD |
| pump/compression | 986,500 | USD |
| reactive units | 4,705,800 | USD |
| flash separation | 54,500 | USD |
| equipment setting | 44,321.6 | USD |
| piping | 1,971,853 | USD |
| civil | 165,371.8 | USD |
| steel | 71,874.3 | USD |
| instrumentation | 1,360,953.2 | USD |
| electrical | 1,098,704.2 | USD |
| insulation | 114,326.4 | USD |
| paint | 101,170.9 | USD |
| EPC cost | 15,727,700 | USD |
| contingency | 2,855,047.55 | USD |
| owner’s cost | 6,281,104.61 | USD |
As seen in Figure 13, the dominating factor of the total expenses is the operation of the plant, and the investment cost represents less than 50%. The levelized cost of e-gasoline is 2426 USD per metric ton (or 1.819 USD per liter) when gray methanol is fed into the process at the cost of 250 USD/ton. The break-even point happens in the eighth year; therefore, starting from this year, the plant will generate profit. However, Figure 14 shows that the levelized cost changes with the methanol price variation. As expected, higher values of methanol will increase the operational costs, therefore boosting LCOeG. In 2023, the average price of retail gasoline worldwide was 1.29 USD per liter.49 Understandably, feeding green methanol to produce gasoline is less competitive but still a comparable alternative in the current panorama. The future landscape in terms of environmental regulations (e.g., carbon tax) and oil reserves can enhance the investment of this process.
Figure 13.
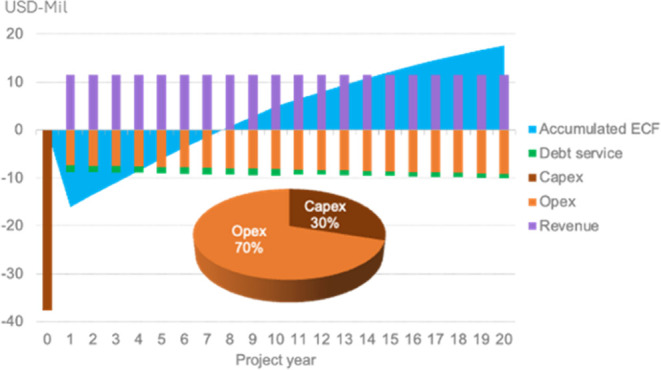
Break-even point and distribution of the expenditures.
Figure 14.

Sensitivity analysis of the e-gasoline price with different methanol prices.
Figure 15 is the result of multiple sensitivity analyses where utilities and maintenance are not relevant in the variation of the price of gasoline. On the other hand, the evident price changes due to the capital cost help to understand the importance of the repurpose of equipment. Then, if distillation columns, pumps, heat exchangers, or compressors can be reused in new processes, the final product price can be reduced even further and, therefore, be more viable. Finally, Figure 15 confirms the results given in Figure 14, as the methanol price has the same impact as the capital cost in the price of e-gasoline. With continuous improvements in gray methanol production and readiness of the new green methanol technology, the MtG process will be more and more attractive given its comparable (even competitive in the future) retail price, cleaner production, and potential to seize a vast existing market for industry and transportation.
Figure 15.

Sensitivity analysis of the e-gasoline price with multiple variables.
The case study examined the expenditures of a pilot plant that produces 127.07 barrels per day of e-gasoline. The expenditure estimation has been extrapolated to an industrial scale (14,500 barrels per day) based on the MtG plant in Montunui, New Zealand, built in 1979.50 This new capacity is equivalent to a scaling factor of 114.1, resulting in CAPEX and OPEX values of 2,439,260,154 USD and 405,218,012 USD/year, respectively. Next, when evaluating these expenditures for a plant operation of 20 years using gray methanol, the estimated levelized price for e-gasoline can be reduced to 0.761 USD/L in comparison to the pilot plant evaluation. In Figure 16, it can be observed that increasing the plant’s capacity also leads to a linear increase in CAPEX and OPEX. Conversely, the levelized price of gasoline can decrease substantially with larger plants due to higher production of gasoline with a more efficient process.
Figure 16.

Estimated CAPEX, OPEX, and levelized cost of e-gasoline at different plant scales.
4. Conclusions and the Path Forward
In the present study, the repurpose of conventional refinery equipment was studied for the production of gasoline from methanol by the well-studied process called “MtG” originally developed by ExxonMobil.
First, a simple lumped mechanism of the MtG kinetics was developed based on the experimental literature data. Finally, eight reactions were proposed, representing the decomposition of methanol into DME, the formation of olefins from DME, and the formation of bigger hydrocarbons from the dehydrogenation of olefins. This study showed comparable results to laboratory-scale experiments in terms of the gasoline composition.
Then, an Aspen Plus process simulation was conducted for a fixed-bed MtG process with a production capacity of 13 t of gasoline per day using fixed-bed reactors. The results of the simulation showed a total consumption of 3 tons of methanol per ton of gasoline and 1164 MW of energy. Also, a simple method for scalability was applied based on the studied case giving a lower levelized cost of e-gasoline with the increment in the plant scale.
Finally, a techno-economic analysis was generated to estimate the levelized price of e-gasoline, along with some sensitivity analyses. The results gave a similar price of e-gasoline (1.82 USD/L) in comparison to the current average retail gasoline price (1.29 USD/L) for gray methanol feeding. Therefore, the proposed idea of reusing reactors for catalytic reforming units or similar reactors from the petrochemical industry is profitable, especially in countries facing oil depletion or oil crises. Additionally, through this study, the MtG process becomes a more attractive technology during the energy transition promoted by multiple governments (e.g., carbon tax) by potentially supplying conventional fuel using greener feedstocks.
This study can be improved by replacing the reactive section from fixed-bed to fluidized-bed reactors, for example, from fluid catalytic cracking (FCC) units. These reactors can enhance the total energy efficiency and reduce the initial investment cost.
Acknowledgments
The authors gratefully acknowledge the research funding from the FLEET consortium. They also thank Dr. Qi Wang for his useful contributions.
Supporting Information Available
The Supporting Information is available free of charge at https://pubs.acs.org/doi/10.1021/acsomega.4c01327.
Additional details and validation for the alternative formulation of the conversion of DME into higher hydrocarbons; the following content is included: (1) new model formulation and its calculated kinetic parameters (Table S1); (2) model validation with the MtG experimental data (1 atm, 400 °C) for oxygenates, lower olefins, and aromatics (Figure S1), and (3) model validation with the MtG experimental data (1 atm, 400 °C) for higher olefins and lower and higher alkanes (Figure S2) (PDF)
The authors declare no competing financial interest.
Supplementary Material
References
- IEA Use of Energy Explained—Energy Use for Transportation, 2023https://www.eia.gov/energyexplained/use-of-energy/transportation.php. (accessed October 11, 2023).
- IEA Global EV Outlook 2023, 2023. https://www.iea.org/reports/global-ev-outlook-2023.
- IEA Net Zero by 2050, 2021. https://www.iea.org/reports/net-zero-by-2050.
- Nemmour A.; Inayat A.; Janajreh I.; Ghenai C. Green hydrogen-based E-fuels (E-methane, E-methanol, E-ammonia) to support clean energy transition: A literature review. Int. J. Hydrogen Energy 2023, 48, 29011–29033. 10.1016/j.ijhydene.2023.03.240. [DOI] [Google Scholar]
- Priya P. S.; Deora Y.; Verma R. A.; Muhal C.; Goswami; Singh T. Biofuels: An alternative to conventional fuel and energy source. Mater. Today: Proc. 2022, 48, 1178–1184. 10.1016/j.matpr.2021.08.227. [DOI] [Google Scholar]
- Schulz H. Short history and present trends of Fischer–Tropsch synthesis. Appl. Catal., A 1999, 186 (1–2), 3–12. 10.1016/S0926-860X(99)00160-X. [DOI] [Google Scholar]
- Evans G.; Smith C.. Biomass to Liquids Technology. In Comprehensive Renewable Energy; Elsevier, 2012; pp 162–183. [Google Scholar]
- U.S. Deparment of Energy Alternative Fuels Data Center: Methanol, 2023https://afdc.energy.gov/fuels/emerging_methanol.html. (accessed April 18, 2023).
- Awad O. I.; Mamat R.; Ali O. M.; et al. Alcohol and ether as alternative fuels in spark ignition engine: A review. Renewable Sustainable Energy Rev. 2018, 82, 2586–2605. 10.1016/j.rser.2017.09.074. [DOI] [Google Scholar]
- Blumberg T.; Morosuk T.; Tsatsaronis G. A comparative exergoeconomic evaluation of the synthesis routes for methanol production from natural gas. Appl. Sci. 2017, 7 (12), 1213 10.3390/app7121213. [DOI] [Google Scholar]
- Wang C.; Xu J.; Qi G.; et al. Methylbenzene hydrocarbon pool in methanol-to-olefins conversion over zeolite H-ZSM-5. J. Catal. 2015, 332, 127–137. 10.1016/j.jcat.2015.10.001. [DOI] [Google Scholar]
- Mäyrä O.; Leiviskä K.. Modeling in Methanol Synthesis. In Methanol; Elsevier, 2018; pp 475–492. [Google Scholar]
- Cui X.; Kær S. K.; Nielsen M. P. Energy analysis and surrogate modeling for the green methanol production under dynamic operating conditions. Fuel 2022, 307, 121924 10.1016/j.fuel.2021.121924. [DOI] [Google Scholar]
- Methanol Institute Carbon Footprint of Methanol 2022https://www.methanol.org/wp-content/uploads/2022/01/CARBON-FOOTPRINT-OF-METHANOL-PAPER_1-31-22.pdf.
- ExxonMobil Synthetic Fuels (Methanol to Gasoline), 2023https://www.exxonmobilchemical.com/en/catalysts-and-technology-licensing/synthetic-fuels. (accessed April 18, 2023).
- Marsh S. K.; Owen H.; Mead B.; Wright B. S.. Conversion of Methanol to Gasoline. U.S.A. Patent, US4788369A, 1988.
- Aguayo A. T.; Gayubo A. G.; Castilla M.; Arandes J. M.; Olazar M.; Bilbao J. MTG process in a fixed-bed reactor. Operation and simulation of a pseudoadiabatic experimental unit. Ind. Eng. Chem. Res. 2001, 40 (26), 6087–6098. 10.1021/ie0101893. [DOI] [Google Scholar]
- Krohn D. E.; Melconian M. G.. The First Fixed-Bed Methanol-to-Gasoline (MTG) Plant: Design and Scale-Up Considerations. In Methane Conversion, Proceedings of a Symposium on the Production of Fuels and Chemicals from Natural Gas; Elsevier, 1988; Vol. 36, pp 679–689. [Google Scholar]
- Rojas C. E. O.Dimethyl Ether as Building Block for the Production of Green Fuels. Ph.D. Thesis; Eindhoven University of Technology, 2018. [Google Scholar]
- Dwyner F. G.; Huss A. J.. Treatment of Effluent Resulting from Conversion of Methanol to Gasoline in Order to Decrease Durene and Produce Distillate. U.S. Patent, US4347397A, 1981.
- Ruokonen J.; Nieminen H.; Dahiru A. R.; et al. Modelling and cost estimation for conversion of green methanol to renewable liquid transport fuels via olefin oligomerisation. Processes 2021, 9 (6), 1046 10.3390/pr9061046. [DOI] [Google Scholar]
- Vivas A. H.; Joensen F.. Process and Catalyst for Upgrading Gasoline. WO Patent, WO178375A1, 2013.
- ExxonMobil Product Solutions Synthetic Fuel Process (Methanol to Gasoline), 2023. https://www.exxonmobilchemical.com/en/catalysts-and-technology-licensing/synthetic-fuels. (accessed May 01, 2023).
- Brynolf S.; Fridell E.; Andersson K. Environmental assessment of marine fuels: Liquefied natural gas, liquefied biogas, methanol and bio-methanol. J. Cleaner Prod. 2014, 74, 86–95. 10.1016/j.jclepro.2014.03.052. [DOI] [Google Scholar]
- Deka T. J.; Osman A. I.; Baruah D. C.; Rooney D. W. Methanol fuel production, utilization, and techno-economy: a review. Environ. Chem. Lett. 2022, 20 (6), 3525–3554. 10.1007/s10311-022-01485-y. [DOI] [Google Scholar]
- Gu Y.; Wang D.; Chen Q.; Tang Z. Techno-economic analysis of green methanol plant with optimal design of renewable hydrogen production: A case study in China. Int. J. Hydrogen Energy 2022, 47 (8), 5085–5100. 10.1016/j.ijhydene.2021.11.148. [DOI] [Google Scholar]
- Rojo-Gama D.; Signorile M.; Bonino F.; et al. Structure–deactivation relationships in zeolites during the methanol–to-hydrocarbons reaction: Complementary assessments of the coke content. J. Catal. 2017, 351, 33–48. 10.1016/j.jcat.2017.04.015. [DOI] [Google Scholar]
- Müller S.; Liu Y.; Vishnuvarthan M.; et al. Coke formation and deactivation pathways on H-ZSM-5 in the conversion of methanol to olefins. J. Catal. 2015, 325, 48–59. 10.1016/j.jcat.2015.02.013. [DOI] [Google Scholar]
- Fathi S.; Sohrabi M.; Falamaki C. Improvement of HZSM-5 performance by alkaline treatments: Comparative catalytic study in the MTG reactions. Fuel 2014, 116, 529–537. 10.1016/j.fuel.2013.08.036. [DOI] [Google Scholar]
- Haggin J. First Methanol-to-Gasoline Plant Nears Startup in New Zealand. Chem. Eng. News Arch. 1985, 63 (12), 39–41. 10.1021/cen-v063n012.p039. [DOI] [Google Scholar]
- Haro P.; Trippe F.; Stahl R.; Henrich E. Bio-syngas to gasoline and olefins via DME - A comprehensive techno-economic assessment. Appl. Energy 2013, 108, 54–65. 10.1016/j.apenergy.2013.03.015. [DOI] [Google Scholar]
- Dimitriou I.; Goldingay H.; Bridgwater A. V. Techno-economic and uncertainty analysis of Biomass to Liquid (BTL) systems for transport fuel production. Renewable Sustainable Energy Rev. 2018, 88, 160–175. 10.1016/j.rser.2018.02.023. [DOI] [Google Scholar]
- Ramirez A.; Sarathy S. M.; Gascon J. CO2 Derived E-Fuels: Research Trends, Misconceptions, and Future Directions. Trends Chem. 2020, 2 (9), 785–795. 10.1016/j.trechm.2020.07.005. [DOI] [Google Scholar]
- Speight J. G.Refinery of the Future; Elsevier, 2020. [Google Scholar]
- Iranshahi D.; Karimi M.; Amiri S.; Jafari M.; Rafiei R.; Rahimpour M. R. Modeling of naphtha reforming unit applying detailed description of kinetic in continuous catalytic regeneration process. Chem. Eng. Res. Des. 2014, 92 (9), 1704–1727. 10.1016/j.cherd.2013.12.012. [DOI] [Google Scholar]
- Ivanchina E.; Chernyakova E.; Pchelintseva I.; Poluboyartsev D. Mathematical modeling and optimization of semi-regenerative catalytic reforming of naphtha. Oil Gas Sci. Technol. 2021, 76, 64 10.2516/ogst/2021041. [DOI] [Google Scholar]
- Moulijin J. A.; Makkee M.; van Diepen A. E.. Chemical Process Technology, 2nd ed.; Wiley, 2013. [Google Scholar]
- Choe J.; Choe C.; Kim T.; Pak Y.; Han C.; Yun H. Novel kinetic modelling of methanol-to-gasoline (MTG) reaction on HZSM-5 catalyst: Product distribution. J. Indian Chem. Soc. 2021, 98 (2), 100003 10.1016/j.jics.2021.100003. [DOI] [Google Scholar]
- Ansys Chemkin-Pro; Ansys: San Diego, 2021.
- Raoof F.; Taghizadeh M.; Eliassi A.; Yaripour F. Effects of temperature and feed composition on catalytic dehydration of methanol to dimethyl ether over γ-alumina. Fuel 2008, 87 (13–14), 2967–2971. 10.1016/j.fuel.2008.03.025. [DOI] [Google Scholar]
- Kim S.; Kim Y. T.; Zhang C.; Kwak G.; Jun K. W. Effect of Reaction Conditions on the Catalytic Dehydration of Methanol to Dimethyl Ether Over a K-modified HZSM-5 Catalyst. Catal. Lett. 2017, 147 (3), 792–801. 10.1007/s10562-017-1981-0. [DOI] [Google Scholar]
- Vijay S.Catalyst and Processes for Aromatization, 2021https://worldwide.espacenet.com/patent/search/family/068159136/publication/US2021115341A1?q=pn%3DUS2021115341A1. Accessed: May 15, 2023.
- IEA . Global Average Levelised Cost of Hydrogen Production by Energy Source and Technology, 2019 and 2050 – Charts – Data & Statistics - IEA, 2019https://www.iea.org/data-and-statistics/charts/global-average-levelised-cost-of-hydrogen-production-by-energy-source-and-technology-2019-and-2050. (accessed May 15, 2023).
- Bos M. J.; Kersten S. R. A.; Brilman D. W. F. Wind power to methanol: Renewable methanol production using electricity, electrolysis of water and CO2 air capture. Appl. Energy 2020, 264, 114672 10.1016/j.apenergy.2020.114672. [DOI] [Google Scholar]
- Kajaste R.; Hurme M.; Oinas P. Methanol-Managing greenhouse gas emissions in the production chain by optimizing the resource base. AIMS Energy 2018, 6 (6), 1074–1102. 10.3934/energy.2018.6.1074. [DOI] [Google Scholar]
- Dysert L. Sharpen Your Capital-Cost-Estimation Skills. Chem. Eng. 2001, 108, 70–81. [Google Scholar]
- Whitesides R. W.Process Equipment Cost Estimating By Ratio And Proportion, Solana Beach, 2020. https://www.pdhonline.com/courses/g127/g127content.pdf.
- Fitch F. B.; Lee W. In Methanol-to-Gasoline, An Alternative Route to High Quality Gasoline, SAE Technical Paper Series; SAE, 1981.
- Valev N.Gasoline Prices Around the World, May 15, 2023, 2023https://www.globalpetrolprices.com/gasoline_prices/. (accessed May 22, 2023).
- Milikin M.DKRW Selects ExxonMobil’s Methanol-to-Gasoline (MTG) Technology for Coal-to-Liquids Project, Green Car Congress, 2007. https://www.greencarcongress.com/2007/12/dkrw-selects-ex.html.
Associated Data
This section collects any data citations, data availability statements, or supplementary materials included in this article.