

Abstract
The appearance of multidrug-resistant Gram-negative bacterial infections, along with the lack of newly discovered antibiotics, resulted in the return to old antimicrobial medications like Polymyxins. As a result, the suggested technique aims to develop a fast, environmentally friendly, and sensitive fluorimetric method for quantifying Polymyxin B. The investigated approach depends on generating a highly fluorescent derivative by a condensation pathway between the studied drug and ninhydrin in the presence of phenylacetaldehyde and then estimated spectrofluorimetrically. After the reaction conditions were well optimized, the fluorescent product was estimated at emission wavelength (λem) = 475.5 nm (following excitation at a wavelength (λex) = 386 nm. The developed calibration plot displayed rectilinear throughout the following range (0.2-3 µg mL− 1), and the calculated limit of detection and quantification were 0.062 µg mL− 1 and 0.187 µg mL− 1, respectively. As a consequence, the drug’s ophthalmic and intravenous pharmaceutical forms were both successfully quantified with an excellent degree of recovery. Finally, the methodology’s greenness was assessed utilizing Analytical Eco-Scale scores.
Keywords: Polymyxin B, Ninhydrin, Phenylacetaldehyde, Ophthalmic and intravenous pharmaceutical forms, Methodology’s greenness
Introduction
The treatment of multidrug-resistant (MDR) bacterial infections remains a major unresolved clinical demand despite considerable progress across the scientific fields. Due to the limited development of new antibiotics capable of treating these types of infections, scientists are returning to older antimicrobial medications [1]. Polymyxins (PMS), notably Polymyxin B (Poly B), have attracted attention due to their specific efficacy against MDR Gram-negative bacteria. Poly B, a cyclic polypeptide protein widely used for clinical purposes, disrupts bacterial cell membranes, causing cell death, as shown in (Fig. 1).
Fig. 1.
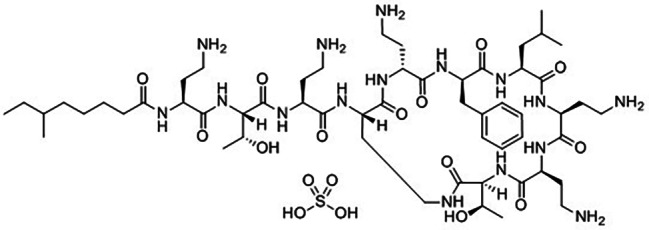
Polymyxin B sulfate (Poly B) chemical structure
Belongs to published papers, more than one chromatographic approach as HPLC [2–7] and LC-Mass [8–19] also microbiological articles were reported [20, 21]. On the other hand, spectroscopic techniques were listed, including spectrophotometric [22–25] and spectrofluorimetric [26–28] approaches. Owing to its simplicity, sensitivity, and no need for a complex apparatus or sample preparation, the spectrofluorimetry technique is frequently employed in recent drug analyses. On the other side, separative techniques have several drawbacks such as excessive solvent utilization, equipment with high cost, and exhausted extraction operations. Furthermore, spectrophotometric and microbiological tests lack sensitivity.
The previously reported fluorimetric methods had limitations such as utilizing drastic conditions (boiling for a long time, 35 min.) [28] or employing an expensive reagent [27], or using hazardous chemicals [26]. So the described approach aimed to overcome these drawbacks by establishing a fast, cost-effective, and environmentally friendly methodology to be easily applied in routine quality control assay.
Ninhydrin, in the presence of phenylacetaldehyde, is a commonly used derivatizing reagent for numerous primary amine-containing pharmaceuticals for spectrophotometric and spectrofluorimetric analysis, owing to its accuracy, cost-effectiveness, and reproducibility. In this study, the fluorogenic reagents interacted with Poly B’s primary amine groups to form a highly fluorescent derivative, which was detected at λex = 386 nm and λem = 475.5 nm.
Experimental
Devices
A Jasco FP-8350 spectrofluorimeter (Tokyo, Japan) was employed to obtain the spectrofluorimetric measurements. The apparatus had a 150 W Xenon-arc lamp, a 400 V PMT voltage, a 5 nm slit width for both the emission and excitation monochromators, and a 1000 nm. min− 1 scan rate. Also, a temperature controller (Schwabach, Germany) and pH meter Adwa AD 1100 (Romania) were utilized in the prescribed approach.
Chemicals and reagents
Standard Poly B was kindly gifted from The National Organization of Drug Control and Research (NODCAR), which was used without additional purification. Paximid® vial a product of Cipla Company product (is claimed to contain 500,000 IU, which is equal to 5 mg of the studied drug). Terramycin® ophthalmic ointment, a product from Pfizer pharmaceutical company (contains 10,000 IU of Poly B equivalent to 1.6667 mg per 1 gm). Ninhydrin, 0.1% (w/v) (Alpha Chemicka, Mumbai, India) was daily prepared in distilled water, and phenylacetaldehyde, 0.2% (v/v) (Sigma Aldrich, Germany) was weekly set in ethyl alcohol. All experimental solvents, including acetone, acetonitrile, methyl alcohol, ethyl alcohol, hexane, and dimethylformamide (DMF), were supplied by ElNasr Chemical CO (Cairo, Egypt). The same company also supplied phosphoric acid, citric acid, HCL, and NaOH. Adjust the pH of Teorell & Steinhagen buffer using 0.1 M HCL after mixing suitable quantities of 1 molar sodium hydroxide, citric, and phosphoric acids.
Standard drug solution preparation
The Poly B stock solution at a final concentration of 100 µg mL− 1 was daily prepared by dissolving 10 mg of Poly B in distilled water. After further dilution, working solutions were obtained.
General analytical procedures
Numerous test tubes were pipetted with 1 mL of working solutions in a range of 2 to 30 µg mL− 1 along with 1 mL of Teorell& Steinhagen buffer (pH = 7), and 1 mL of 0.1% (w/v) ninhydrin, and 0.02% (v/v) phenylacetaldehyde solutions. To ensure a reaction pathway was completed, all tubes were kept in a water bath of 80 °C for 15 min, after which it was cooled in an ice bath. The mixtures in the test tubes were transferred to 10.0-mL volumetric flasks and completed to mark using ethyl alcohol. Lastly, relative fluorescence intensity (RFI) was evaluated at λem = 475.5 nm (after λex = 386 nm). With each experiment, a blank was employed, following all previous procedures but without the addition of the studied drug.
Preparation of vial solution
An accurate amount from Paximid® vials equal to 10 mg of Poly B was transferred to a 100-mL volumetric flask and completed to mark with the employed solvent. Sequential dilution was carried out until the concentration reached (2–30 µg mL− 1), after which all steps in Sect. 2.4 were repeated.
Preparation of ophthalmic ointment solution
An exact quantity of Terramycin® eye ointment equivalent to 10 mg of Poly B was vigorously shaken with 30 mL of a mixture solution of distilled water and n-hexane in a ratio of 1:1. Using a separating funnel, the two immiscible layers were obtained, after which the aqueous layer was collected and the organic one received further aqueous washings. Then the collecting solution was transferred to a 100-mL volumetric flask and completed to mark by distilled water. After filtering, further dilution was employed to obtain working solutions, and general analytical procedures were followed.
Results and discussion
In the presence of phenylacetaldehyde, ninhydrin is utilized as a derivatizing agent to assay drugs with primary amine groups. producing yellow fluorescent derivatives [29–36]. In the developed experiment, ninhydrin condensed with the amino moiety of Poly B in addition to phenylacetaldehyde at λem = 475.5 nm (following excitation at λex. = 386 nm). The reaction pathway and the spectra are illustrated in (Fig. 2) and (Fig. 3), respectively. To raise the value of the current work, a comparative table with other reported fluorimetric articles was established, and all values were inserted in (Table 1).
Fig. 2.
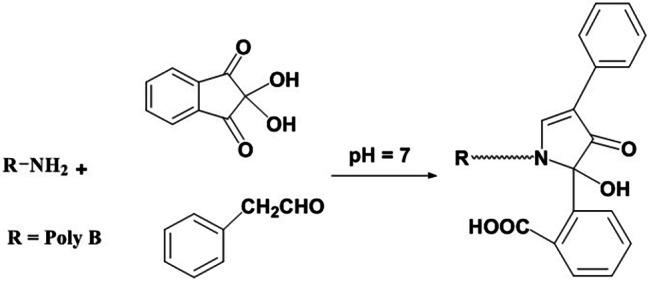
Suggested pathway of the reaction between the investigated drug and the fluorogenic reagent
Fig. 3.

Excitation and emission spectra of Poly B (2 µg mL− 1) with fluorogenic reagents
Table 1.
A comparison between the investigated study and the reported fluorimetric methods
| Method | Linear range (µg mL− 1) | Temperature | Cost | Hazardous agents | Ref. |
|---|---|---|---|---|---|
| Hantzsch Reaction | 0.1–3 | 100 ºC (boiling) for 35 min. | Cost-effective | Not utilized | [28] |
| NBD-CL Reaction | 0.1–1.2 | 60 ºC for 45 min. |
Not cost-effective |
Conc. H2SO4 | [26] |
| Fluorescamine Reaction | 0.07–1.8 | Room temperature for 10 min. | Not cost-effective | Not utilized | [27] |
| Ninhydrin & phenylacetaldehyde | 0.2–3 | 80 ºC for 15 min. | Cost-effective | Not utilized | Current work |
Optimization of the reaction parameters
To determine the ideal reaction conditions that would yield the highest RFI values, each parameter was optimized while the others remained fixed.
Buffer optimization
Since any small change in the pH of the experimental media had a considerable influence on the approach’s fluorescence intensity, Teorell & Steinhagen buffer was employed to establish a pH scale (5–9). The RFI peaked at a pH range (6.8–7.2); any deviation led to a significant decrease in fluorescence intensity. While checking the optimal buffer volume, the (0.8–1.2 mL) range yielded the best outcomes. So, one mL of the utilized buffer (pH 7) was the best choice. Data are shown in (Fig. 4).
Fig. 4.

Effect of the pH and buffer volume on the RFI of the reaction product of Poly B (2 µg mL− 1)
Regeants volume optimization
To study the optimum volumes of ninhydrin and phenylacetaldehyde affect the approach performance, a scale of (0.5–2.0 mL) was successfully investigated. RFI was raised in tandem with increased volumes of each of them until a plateau was reached at 0.8 to 1.2 mL, beyond this range, fluorescence declined. Therefore, 1.0 mL was the optimum volume from each reagent. All information was gathered in (Fig. 5).
Fig. 5.

Effect of fluorogenic reagents volumes on the RFI of the reaction product of Poly B (2 µg mL− 1)
Temperature and heating time optimization
A temperature controller instrument was employed to get various degrees of temperatures in the range of 50 to 100 °C. RFI peaked at 60 to 90 °C. After which, various heating time was tested at 80 °C. Fluorescence increased rapidly as the time intervals were extended until reached a steady line at 10 to 20 min. As a result, heating at 80 °C for 15 min. was the optimum thermal setting. All data were gathered in (Fig. 6) and (Fig. 7).
Fig. 6.
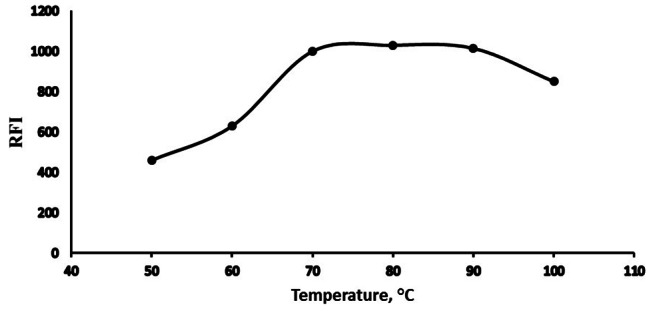
Temperature on the RFI of the reaction product of Poly B (2 µg mL− 1)
Fig. 7.
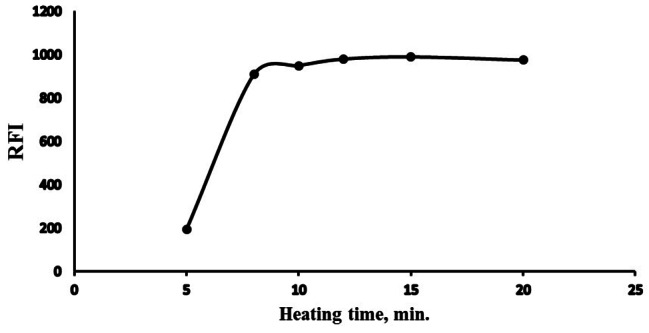
Heating time effect on the RFI of the reaction product of Poly B (2 µg mL− 1)
Solvent optimization
While other variables were kept constant, acetone, acetonitrile, ethyl alcohol, methyl alcohol, distilled water, and DMF were employed to further dilute the final fluorescent products. Ethyl and methyl alcohols have the greatest RFI levels, consequently, ethyl alcohol was chosen as the optimum one owing to its greenness profile, as displayed in (Fig. 8).
Fig. 8.
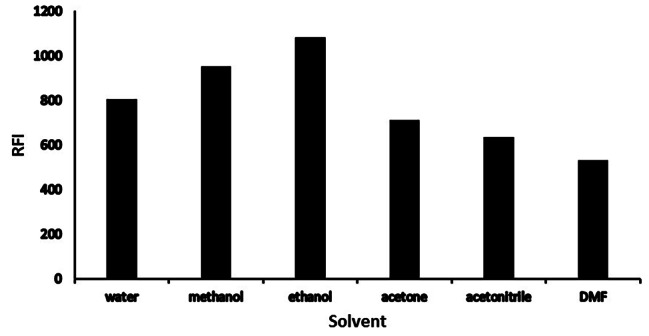
Solvent type effect on the RFI of the reaction product of Poly B (2 µg mL− 1)
Validation of the studied method
The proposed approach was carefully validated using ICH criteria [37], which included estimating its linearity and range, accuracy, precision, robustness, and sensitivity, as well as LOD and LOQ.
Linearity & range
A calibration curve of the developed method was plotted of Poly B different concentrations versus RFI values. A linear relationship in the range of 0.2 to 3 µg mL− 1 was obtained, with a correlation coefficient value of 0.9996. All analytical parameters related to the linear regression equation were inserted in (Table 2).
Table 2.
Regression equation and related validation parameters
| Parameters | Investigated approach |
|---|---|
| λex (nm) | 386 |
| λem (nm) | 475.5 |
| Linear range (µg mL− 1) | 0.2–3 |
| Correlation coefficient (r) | 0.9996 |
| Determination coefficient (r2) | 0.9993 |
| Intercept ± SD* | -71.72 ± 9.274 |
| Slope ± SD | 497.13 ± 5.99 |
| Calculated LOD (µg mL− 1) ** | 0.062 |
| Calculated LOQ (µg mL− 1) *** | 0.187 |
* SD: Standard Deviation
**LOD: Limit of detection
***LOQ: Limit of quantitation
Accuracy
Over the methodology’s calibration range, five different concentrations of the studied drug of 0.2, 0.6, 1, 2, or 3 µg mL− 1 were evaluated three times. The calculated data showed a significant agreement between the experimental and true values, proving the current technique was accurate. All values were inserted in (Table 3).
Table 3.
Evaluation of the accuracy of the proposed spectrofluorimetric method
| Sample no. | Taken conc. (µg mL− 1) | Found conc. (µg mL− 1) | % R* |
|---|---|---|---|
| 1 | 0.2 | 0.199 | 99.50 |
| 2 | 0.6 | 0.589 | 98.17 |
| 3 | 1 | 1.018 | 101.80 |
| 4 | 2 | 1.987 | 99.35 |
| 5 | 3 | 3.009 | 100.30 |
| Mean | 99.82 | ||
| SD | 1.341 | ||
| RSD | 1.343 |
RSD: relative standard deviation *Mean of three replicate measurements
Precision
Three different drug concentration levels (0.6, 1.5, and 3 µg mL− 1) and three duplicates of each one were utilized throughout the day and over three successive days to assess intra- and inter-day precision, respectively. The calculated mean relative standard deviation (RSD), did not surpass 2, indicating that the proposed methodology was reliable and reproducible. (Table 4) gathering all information.
Table 4.
Developed approach intra- and inter-day precisions
| Concentration level (µg mL− 1) | % R* ± RSD | |
|---|---|---|
| Intra-day | Inter-day | |
| 0.6 | 98.98 ± 0.88 | 101.21 ± 0.72 |
| 1.5 | 100.12 ± 1.76 | 99.66 ± 1.26 |
| 3 | 99.54 ± 1.33 | 100.09 ± 1.35 |
* Mean of three determinations
Robustness
The method’s robustness was estimated by checking small changes in approach conditions like pH and fluorogenic reagent volumes. The tested parameter was altered while the others remained constant, then the recovery percentage (%R) was estimated. Minor alterations had no significant influence on the approach’s performance since the obtained RSD did not exceed 2%, so the outcomes confirmed the robustness of the described approach. All values were inserted in (Table 5).
Table 5.
Robustness for determination of Poly B (2 µg mL− 1) by the developed approach
| Method Parameters | % R* ± SD | RSD |
|---|---|---|
| pH | ||
| 6.8 | 98.69 ± 0.38 | 0.39 |
| 7 | 100.72 ± 1.15 | 1.14 |
| 7.2 | 99.19 ± 0.70 | 0.71 |
| Volume of Ninhydrin | ||
| 0.8 | 99.72 ± 0.78 | 0.78 |
| 1 | 101.06 ± 1.65 | 1.63 |
| 1.2 | 100.33 ± 0.44 | 0.44 |
| Volume of Phenyl acetaldehyde | ||
| 0.8 | 100.80 ± 1.22 | 1.21 |
| 1 | 99.97 ± 0.47 | 0.47 |
| 1.2 | 98.99 ± 1.03 | 1.04 |
* Mean of three determinations
To assess the sensitivity of the technique under investigation, LOD, and LOQ values were computed. Using the equation “LOD = 3.3 × ϭ / S or LOQ = 10 × ϭ / S,” where S denotes the calibration graph’s slope and ϭ denotes the intercept’s standard deviation, LOD = 0.187 µg mL− 1 and LOQ = 0.062 µg mL− 1 were accurately estimated.
Application of the developed method
The suggested methodology was successfully employed to determine the amount of Poly B in the paximid® vial and Terramycin® eye ointment. %R values of the established approach were statistically compared with a previously published article [28], which showed lower T and F values than tabulated ones, showing good accuracy and precision of the developed methodology. All data were observed in (Table 6).
Table 6.
Data for quantification of pharmaceutical formulations by the investigated method and compared with the reported one [28]
| Dosage form | Mean of % R* ± SD | t-value# | F-value# | |
|---|---|---|---|---|
| investigated approach | Comparison method | |||
| Paximid® vial | 99.95 ± 1.39 | 99.53 ± 0.56 | 0.485 | 6.146 |
| Terramycin® eye ointment | 99.71 ± 0.57 | 98.99 ± 0.83 | 0.962 | 5.88 |
*Mean is average of five determinations
*Tabulated values at 95% confidence limit are t- value = 2.306, F- value = 6.338
Greenness evaluation
Various metrics have been used to assess the analytical method’s greenness, such as Analytical Eco-Scale (AES) [38]. The formula used to compute the AES score is 100 minus the total penalty point, considering parameters such as reagent amounts, occupational risks, waste, and energy. The higher the score reflects the more green the methodology. The designed approach included no extraction step, and the operation consumed less than 0.1 kW/h of energy for one sample. With an Eco-Scale score of 90, the developed approach can be regarded as having outstanding greenness. A comparison between the developed and reported approaches is illustrated in (Table 7).
Table 7.
Comparison between the prescribed and reported method for assessing the approach’s greenness according to Analytical Eco-Scale tool
| Item | The prescribed method | The reported method | |||||
|---|---|---|---|---|---|---|---|
| Parameter | Word sign | Penalty point | Parameter | Word sign | Penalty point | ||
| Reagent | Amount | < 10 mL | 0 | < 10 mL | 0 | ||
| Hazard | Ninhydrin | LSH** | 1 | Acetylacetone | LSH | 1 | |
| Phenylacetaldehyde | LSH | 1 | Formaldehyde | LSH | 1 | ||
| Ethanol | None | 0 | Distilled Water | None | 0 | ||
| Hexane | MSH* | 2 | Hexane | MSH | 2 | ||
| Acetonitrile | LSH | 1 | |||||
| Instrument | Energy (Spectrofluorimetry) | ≤ 0.1 | 0 | ≤ 0.1 | 0 | ||
| Heater | Temperature (80 °C for 15 min) | 1 | Temperature (100 °C for 35 min) | 3 | |||
| Occupational hazard | Emission of vapors and gases to the air | 3 | Emission of vapors and gases to the air | 3 | |||
| Waste | 1–10 mL | 3 | 1–10 mL | 3 | |||
| TPPs*** | 11 | 14 | |||||
| Eco-Scale score | = 100 - TPP | 89 | 86 | ||||
MSH* More Severe Hazard LSH
** Less Severe Hazard TTPs
*** Total Penalty Points
Conclusion
Through utilizing the amino group present in Poly B, designing a new and rapid fluorimetric strategy for quantification of the cited drug in intravenous and ophthalmic dosage forms was the aim of the current work. The extraction step, as well as the employment of instruments with a high cost, solvents, and reagents with a high grade of purity, were all obstacles that were overcome in the current approach. Lastly, AES tool was employed to assess the approach’s greenness. As a consequence, the current methodology could successfully quantify the studied drug in quality control laboratories with a high degree of reproducibility and greenness.
Author contributions
Mahmoud A. Abdelmajed: Methodology and writing the original draft, Tamer Z. Attia: Validation and reviewing, Khalid M. Badr El-Din: reviewing and publishing editing, Mahmoud A. Omar and Mohamed Orab: reviewing.
Funding
Non-funding.
Data availability
The datasets during and/or analyzed during the current study are available from the corresponding author upon reasonable request.
Declarations
Ethical approval and consent to participate
Not applicable.
Consent for publication
Not applicable.
Ethical guidelines
Guidelines according to BMC journal.
Competing interests
The authors declare that they have no competing interests.
Footnotes
Publisher’s Note
Springer Nature remains neutral with regard to jurisdictional claims in published maps and institutional affiliations.
References
- 1.DL P. Multidrug-resistant gram-negative pathogens: the Urgent need for old polymyxins. Adv Exp Med Biol. 2019;1145:9–13. doi: 10.1007/978-3-030-16373-0_2. [DOI] [PubMed] [Google Scholar]
- 2.Ghanem A, Marzouk AA, El-Adl SM, Fouad A. A polymer-based monolithic Capillary Column with Polymyxin-B Chiral Selector for the Enantioselective Nano-High Performance Liquid Chromatographic Pharmaceutical Analysis. J Chromatogr A. 2022;1662:462714. doi: 10.1016/J.CHROMA.2021.462714. [DOI] [PubMed] [Google Scholar]
- 3.Setiawati H, Harmita H, Suryadi H. Development and validation method for simultaneous quantification of neomycin and polymyxin B by HPLC-ELSD and comparison with microbiological method. J Appl Pharm Sci. 2020 doi: 10.7324/JAPS.2020.104016. [DOI] [Google Scholar]
- 4.Cao G, Ali FEA, Chiu F, Zavascki AP, Nation RL, Li J. Development and validation of a reversed-phase high-performance liquid chromatography assay for polymyxin B in human plasma. J Antimicrob Chemother. 2008 doi: 10.1093/jac/dkn343. [DOI] [PubMed] [Google Scholar]
- 5.Pendela M, Adams E, Hoogmartens J. Development of a liquid chromatographic method for ear drops containing neomycin sulphate, polymyxin B sulphate and dexamethasone sodium phosphate. J Pharm Biomed Anal. 2004 doi: 10.1016/j.jpba.2004.08.011. [DOI] [PubMed] [Google Scholar]
- 6.Orwa JA, Van Gerven A, Roets E, Hoogmartens J. Liquid chromatography of polymyxin B sulphate. J Chromatogr A. 2000 doi: 10.1016/S0021-9673(99)00936-X. [DOI] [PubMed] [Google Scholar]
- 7.Chaudhary T, Das Kurmi B, Singh D. Convenient estimation of oxytetracycline and polymyxin B by a novel high-performance liquid chromatography method: development and validation, (2023) 6–17.
- 8.Wang P, Zhang Q, Qin Z, Xing H, Xu M, Pei H, Yang J, Zhang X. A simple and robust liquid chromatography with Tandem Mass Spectrometry Analytical Method for Therapeutic Drug Monitoring of plasma and cerebrospinal fluid polymyxin B1 and B2. Ther Drug Monit. 2020 doi: 10.1097/FTD.0000000000000754. [DOI] [PubMed] [Google Scholar]
- 9.Liu X, Yu Z, Wang Y, Wu H, Bian X, Li X, Fan Y, Guo B, Zhang J. Therapeutic drug monitoring of polymyxin B by LC-MS/MS in plasma and urine, Bioanalysis. (2020). 10.4155/bio-2020-0051 [DOI] [PubMed]
- 10.Zhang B, Li X, Chen Y, Chen B, Cheng Y, Lin H, Que W, Liu M, Zhou L, Zhang H, Qiu H, Wu C. Journal of Pharmaceutical and Biomedical Analysis determination of polymyxin B in human plasma and epithelial lining fluid using LC-MS / MS and its clinical application in therapeutic drug monitoring. J Pharm Biomed Anal. 2023;227:115291. doi: 10.1016/j.jpba.2023.115291. [DOI] [PubMed] [Google Scholar]
- 11.Wang Y, Chen J, Du J, Lei L, Zhao B, Bai Y, Chen D, Wang X, Chen C. The Determination of Polymyxin B in Critically Ill Patients by the HPLC-MS / MS Method, 2023 (2023). [DOI] [PMC free article] [PubMed]
- 12.Covellia J, Ruszaj D, Straubinger R, Li J, Rao G. The development and validation of a simple liquid chromatography-tandem mass spectrometry method for polymyxin B1 and B2 quantification in different matrices. J Chromatogr B Analyt Technol Biomed Life Sci. 2017;1065–6. 10.1016/J.JCHROMB.2017.09.031 [DOI] [PubMed]
- 13.Cheng C, Liu S, Xiao D, Hollembaek J, Yao L, Lin J, Hansel S. LC-MS/MS method development and validation for the determination of polymyxins and Vancomycin in rat plasma. J Chromatogr B Anal Technol Biomed Life Sci. 2010;878:2831–8. doi: 10.1016/j.jchromb.2010.08.037. [DOI] [PubMed] [Google Scholar]
- 14.Hee KH, Leaw YKJ, Ong JL, Lee LS. Development and validation of liquid chromatography tandem mass spectrometry method quantitative determination of polymyxin B1, polymyxin B2, polymyxin B3 and isoleucine-polymyxin B1 in human plasma and its application in clinical studies. J Pharm Biomed Anal. 2017;140:91–7. doi: 10.1016/j.jpba.2017.03.018. [DOI] [PubMed] [Google Scholar]
- 15.Cheah SE, Bulitta JB, Li J, Nation RL. Development and validation of a liquid chromatography-mass spectrometry assay for polymyxin B in bacterial growth media. J Pharm Biomed Anal. 2014;92:177–82. doi: 10.1016/j.jpba.2014.01.015. [DOI] [PMC free article] [PubMed] [Google Scholar]
- 16.Huang X, Liu X, Wang Y, Zhang J. Determination of polymyxin B in dried blood spots using LC-MS/MS for therapeutic drug monitoring. J Chromatogr B Anal Technol Biomed Life Sci. 2022;1192:123131. doi: 10.1016/j.jchromb.2022.123131. [DOI] [PubMed] [Google Scholar]
- 17.Meng M, Wang L, Liu S, Jaber OM, Gao L, Chevrette L, Reuschel S. Simultaneous quantitation of polymyxin B1, polymyxin B2 and polymyxin B1-1 in human plasma and treated human urine using solid phase extraction and liquid chromatography-tandem mass spectrometry. J Chromatogr B Anal Technol Biomed Life Sci. 2016;1012–3. 10.1016/j.jchromb.2016.01.013 [DOI] [PubMed]
- 18.Zhang H, Li F, Dun J, Sun N, Liu H, Chen G. Combination of Derivatization–HPLC–MS and enzymatic hydrolysis–edman degradation for amino acid sequence and configuration of Polymyxin B Components. Chromatographia. 2021;84:1057–64. doi: 10.1007/s10337-021-04091-2. [DOI] [Google Scholar]
- 19.Thomas TA, Broun EC, Abildskov KM, Kubin CJ, Horan J, Yin MT, Cremers S. High performance liquid chromatographyg-mass spectrometry assay for polymyxin B1 and B2 in human plasma. Ther Drug Monit. 2012 doi: 10.1097/FTD.0b013e31825c827a. [DOI] [PMC free article] [PubMed] [Google Scholar]
- 20.Liu J, Huang Z, Ruan B, Wang H, Chen M, Rehman S, Wu P. Quantitative proteomic analysis reveals the mechanisms of polymyxin B toxicity to Escherichia coli. Chemosphere. 2020 doi: 10.1016/j.chemosphere.2020.127449. [DOI] [PubMed] [Google Scholar]
- 21.Kjeldsen NJ, Beezer AE, Miles RJ. Flow microcalorimetric assay of antibiotics-III. Zinc bacitracin and its combinations with polymyxin B sulphate and neomycin sulphate on interaction with Micrococcus luteus. J Pharm Biomed Anal. 1989;7:865–9. doi: 10.1016/0731-7085(89)80007-X. [DOI] [PubMed] [Google Scholar]
- 22.Mannan A, Khan AJ, Khan M, Abbas G. Validated Spectrophotometric Method for determination of Polymaxin-B sulfate in Pharmaceutical formulations. RADS J Pharm Pharm Sci. 2017;5:33–8. [Google Scholar]
- 23.Severino, Silveira, Vazzana M, Chaud MV, Santana, Souto Validation of an UV spectrophotometric assay for the quantification of polymyxin B in solid lipid nanoparticles. Pharmazie. 2015 doi: 10.1691/ph.2015.5073. [DOI] [PubMed] [Google Scholar]
- 24.Lemus Gallego JM, Pérez J, Arroyo Spectrophotometric resolution of ternary mixtures of Dexamethasone, Polymyxin B and Trimethoprim in synthetic and pharmaceutical formulations. Anal Chim Acta. 2001;437:247–57. doi: 10.1016/S0003-2670(01)01008-X. [DOI] [Google Scholar]
- 25.Gallego JML, Arroyo JP. Simultaneous resolution of dexamethasone and polymyxin B by spectrophotometry derivative and multivariate methods. Anal Lett. 2001;34:1265–83. doi: 10.1081/AL-100104152. [DOI] [Google Scholar]
- 26.El-Kosasy AM, Abdel-Aziz O, Magdy N, El NM, Zahar Screening and optimization of the reaction of polymyxin B sulphate with NBD-Cl for the synchronous spectrofluorimetric determination of polymyxin B sulphate in human plasma. J Fluoresc. 2015 doi: 10.1007/s10895-015-1555-8. [DOI] [PubMed] [Google Scholar]
- 27.Badr El-Din KM, Abdelmajed MA, Omar MA, Attia TZ. Salvage parenteral antibiotics for multidrug-resistant (MDR) Gram-negative bacteria; a fluorescamine-based technique for ultrasensitive spectrofluorimetric measurement of polymyxins; human plasma application. Luminescence. 2022;37:971–9. doi: 10.1002/bio.4245. [DOI] [PubMed] [Google Scholar]
- 28.Attia TZ, Abdelmajed MA, Omar MA, El-Din KMB. Selective Spectrofluorimetric Protocol for determination of commonly used Gram-negative Bactericidal Drug in Combined Pharmaceutical Dosage forms and Human plasma. J Fluoresc. 2022;32:603–12. doi: 10.1007/s10895-021-02862-6. [DOI] [PubMed] [Google Scholar]
- 29.Ali MFB, Salman BI, Hussein SA, Marzouq MA. Applicability of ninhydrin as a fluorescent reagent for estimation of teicoplanin in human plasma using salting-out assisted liquid-liquid extraction technique. Luminescence. 2020;35:1118–24. doi: 10.1002/BIO.3824. [DOI] [PubMed] [Google Scholar]
- 30.Abdel-Lateef MA, Almahri A. Spectrofluorimetric determination of α-difluoromethylornithine through condensation with ninhydrin and phenylacetaldehyde: application to pharmaceutical cream and spiked urine samples. Chem Pap. 2022;76:741–8. doi: 10.1007/S11696-021-01894-3/TABLES/3. [DOI] [Google Scholar]
- 31.Anwer EF, Nour El-Deen DAM, Omar MA. Design and strategy for spectrofluorimetric determination of tranexamic acid in its authentic form and pharmaceutical preparations: application to spiked human plasma. Luminescence. 2021;36:1327–34. doi: 10.1002/BIO.4068. [DOI] [PubMed] [Google Scholar]
- 32.Omar MA, Nagy DM, Halim ME. Utility of ninhydrin reagent for spectrofluorimetric determination of heptaminol in human plasma. Luminescence. 2018;33:1107–12. doi: 10.1002/BIO.3516. [DOI] [PubMed] [Google Scholar]
- 33.Derayea SM, Attia TZ, Elnady M. Development of spectrofluorimetric method for determination of certain antiepileptic drugs through condensation with ninhydrin and phenyl acetaldehyde, Spectrochim. Acta - Part A Mol. Biomol Spectrosc. 2018;204:48–54. doi: 10.1016/j.saa.2018.06.027. [DOI] [PubMed] [Google Scholar]
- 34.Mostafa IM, Derayea SM, Nagy DM, Omar MA. An experimental ninhydrin design approach for the sensitive spectrofluorimetric assay of milnacipran in human urine and plasma. Spectrochim Acta - Part Mol Biomol Spectrosc. 2018;205:292–7. doi: 10.1016/j.saa.2018.07.040. [DOI] [PubMed] [Google Scholar]
- 35.Omar MA, Derayea SM, Mostafa IM. Selectivity improvement for Spectrofluorimetric Determination of Oseltamivir Phosphate in human plasma and in the Presence of its degradation product. J Fluoresc. 2017;27:1323–30. doi: 10.1007/s10895-017-2066-6. [DOI] [PubMed] [Google Scholar]
- 36.Attia TZ, Abdelmajed MA, Omar MA, Al Thagfan SS, El-Din KMB. New validated spectrofluorimetric protocol for colistin assay through condensation with 2, 2-dihydroxyindan-1, 3-dione: application to content uniformity testing. RSC Adv. 2022;12:33559–66. doi: 10.1039/D2RA04259B. [DOI] [PMC free article] [PubMed] [Google Scholar]
- 37.I.C.H.H T, Guideline, editors. others, Validation of analytical procedures: text and methodology, Q2. 1 (2005) 5.
- 38.Gałuszka A, Migaszewski ZM, Konieczka P, Namieśnik J. Analytical Eco-scale for assessing the greenness of analytical procedures. TrAC - Trends Anal Chem. 2012;37:61–72. doi: 10.1016/j.trac.2012.03.013. [DOI] [Google Scholar]
Associated Data
This section collects any data citations, data availability statements, or supplementary materials included in this article.
Data Availability Statement
The datasets during and/or analyzed during the current study are available from the corresponding author upon reasonable request.