

Abstract
Objective:
Framework Matrix Analysis (FMA) and Applied Thematic Analysis (ATA) are qualitative methods that have not been as widely used/cited compared to content analysis or grounded theory. This paper compares methods of FMA with ATA for mobile health (mHealth) research. The same qualitative data were analyzed separately, using each methodology. The methods, utility, and results of each are compared, and recommendations made for their effective use.
Methods:
Formative qualitative data were collected in eight focus group discussions with physicians and nurses from three hospitals in Bangladesh. Focus groups were conducted via video conference in the local language, Bangla, and audio recorded. Audio recordings were used to complete a FMA of participants’ opinions about key features of a novel mHealth application (app) designed to support clinical management in patients with acute diarrhea. The resulting framework matrix was shared with the app design team and used to guide iterative development of the product for a validation study of the app. Subsequently, focus group audio recordings were transcribed in Bangla then translated into English for ATA; transcripts and codes were entered into NVivo qualitative analysis software. Code summaries and thematic memos explored the clinical utility of the mHealth app including clinicians’ attitudes about using this decision support tool.
Results:
Each of the two methods contributes differently to the research goal and have different implications for an mHealth research timeline. Recommendations for the effective use of each method in app development include: using FMA for data reduction where specific outcomes are needed to make programming and design decisions and using ATA to capture the more nuanced issues that guide use, product implementation, training, and workflow.
Conclusions:
By describing how both analytical methods were used in this context, this paper provides guidance and an illustration for use of these two methods, specifically in mHealth design.
Keywords: framework matrix, thematic analysis, qualitative data analysis, mHealth
Introduction
Qualitative methods, long a key approach in the social sciences, has expanded into the field of medical research over the last two decades, becoming an essential component of intervention and public health research. Multi-disciplinary and mixed methods studies are increasingly used in applied health research with several advocating for the use of both qualitative and quantitative methods (Barbour, 1999; Molina-Azorin, 2016; Morgan, 2015; Poses and Isen, 1998; Regnault et al, 2018). While less common in mobile health (mHealth) research, qualitative methods contribute much needed understanding of how users interact with mobile products and can play an important role in the development and design of mHealth systems. Qualitative data provide insight into how mobile and digital health systems and tools are used and can address shortcomings that occur when intervention and product design rely solely on quantitative methods (Barbour, 1999; Molina-Azorin, 2016; Morgan, 2015; Regnault et al, 2018).
There are a variety of qualitative methods a clinical researcher can incorporate into their research design, including content analysis, narrative analysis, and thematic analysis. Choosing the most appropriate research methodology for a project depends on several factors including the research timeline and how the data analysis will contribute to research aims. Linking the correct analytical strategy to the research task is therefore an essential component of qualitative method design and implementation. Framework Matrix Analysis (FMA) and Applied Thematic Analysis (ATA) and are two more recently articulated analytic qualitative methods. A review of qualitative data analysis methods of studies published in Human Resource Development Quarterly between 1990 and 2019 and found that out of 59 qualitative studies, more than half used content analysis or grounded theory as their qualitative analysis approach with only 5.1% applying an ATA approach (Lester et al, 2020). For both of these forms of qualitative analysis, there is no one programmatic process that exactly guides all analyses (Braun & Clarke, 2006; Collaço et al, 2021; Gale et al, 2013; Ritchie & Spencer, 1994; Ritchie & Spencer, 2007; Ward et al, 2013). The comparative lack of literature on FMA, and the relatively recent articulation of each of these methods – specifically as compared to older approaches such as grounded theory, narrative analysis, or content analysis for example – may cause novice researchers to be unsure of how or when to incorporate these approaches into their research design (Braun & Clarke, 2006; Collaço et al, 2021; Gale et al, 2013; Nowell et al, 2017; Ritchie & Spencer, 1994; Ritchie & Spencer, 2007; Ward et al, 2013).
FMA is a highly structured approach for analyzing qualitative data developed by Jane Ritchie and Liz Spencer in the United Kingdom for use in social policy research in the late 1980s (Ritchie & Spencer, 1994). A distinguishing feature that differentiates FMA from other qualitative methods is the charting of data into a matrix; a spreadsheet which organizes participants by rows and thematic codes in columns. Codes in this process often closely align with questions asked in the qualitative topic guide used to collect data (Chakrapani et al, 2017). In the matrix charting process, participant comments are summarized in spreadsheet cells (Collaço et al, 2021; Pope et al, 2000; Ritchie & Spencer, 1994; Ritchie & Spencer, 2007; Srivastava et al, 2009; Ward et al, 2013). By creating a matrix, researchers can easily compare data across cases and within individual cases, with ease, providing a visually straightforward method to recognize patterns (Collaço et al, 2021; Gale et al, 2013; Ritchie & Spencer, 2007; Srivastava et al, 2009). This both reduces the amount of data for final review and provides researchers with a comprehensive perspective in which differences and similarities within the data can be easily identified. This flexibility adds more depth and understanding of the phenomenon under study (Collaço et al, 2021; Gale et al, 2013; Ritchie & Spencer, 2007; Srivastava et al, 2009; Ward et al, 2013;). Matrix development is not limited to interview data, as focus group participant comments can also be charted into matrix cells. FMA provides a systematic approach without requiring special software or theoretical knowledge, and is especially useful when multiple researchers from multi-disciplinary and decentralized teams are working on a project (Gale et al, 2013; Ward et al, 2013). It is particularly well-suited to mHealth research, as it synthesizes large amounts of data into a format that can be easily reviewed by mobile application (app) software developers to guide product development.
ATA is a flexible approach to qualitative data analysis as it can be used within different theoretical frameworks and modified for a study’s needs (Braun & Clarke, 2006; Braun et al, 2019; Smith & Firth, 2011; Vaismoradi et al, 2013). This flexibility allows researchers across a range of disciplines to apply various theories and perspectives when conducting a thematic analysis, resulting in meaningful themes and rich insight (Lester et al, 2020). Similar to other qualitative analysis approaches, ATA is especially useful rich and detailed datasets, allowing researchers to identify, analyze, and report patterns and themes (Braun & Clarke, 2006; Lester et al, 2020). Though sometimes criticized for lacking depth and transparency in how themes are developed, researchers who are relatively unfamiliar with qualitative analysis may find this approach particularly appealing as it does not require detailed technical knowledge, unlike other methods (Attride-Stirling 2001; Braun & Clarke, 2006; Braun et al, 2019; Nowell et al, 2017). Aside from its accessibility, thematic analysis forces the researcher to take a well-structured approach to handling data, helping to produce a clear and organized final report (Braun & Clarke, 2006; Nowell et al, 2017).
ATA is a particularly pragmatic research application of thematic analysis which is useful in public health and other applied qualitative research contexts. ATA uses many of the tools of grounded theory, phenomenology, and other qualitative approaches (Guest et al, 2011). Articulated as a single methodological perspective by Guest et al in 2011, this analytical methodology provides a systematic approach for coding textual data and identifying themes from qualitative data (Guest et al, 2011). First, both deductive and inductive codes are used to sort or segment the data into key topics, and the content of these coding topics is then read in aggregate. The analyst next searches for patterns in the data by attending to repeated content, and whether certain types of participants are linked with particular concepts (Braun & Clarke, 2022; Guest et al, 2011).
The aim of this paper is to describe and compare the strengths and application of FMA and ATA methods using qualitative data from a study that developed a novel mobile health (mHealth) clinical decision support tool (CDST) app for clinical management of dehydration in patients with acute diarrhea in resource-limited settings. Each type of analysis contributes differently to the research goal and each has different implications for the research timeline. We provide guidance for researchers interested in qualitative research for mHealth design, including an illustration of the practical use of these two methods, in order to make recommendations for their optimal use.
Background and research context:
novel mHealth CDST app Development
The “Novel Innovative Research for Understanding Dehydration in Adults and Kids” (NIRUDAK) is an ongoing research study developing a novel mHealth CDST app for use in the treatment and assessment of dehydration severity in patients with acute diarrhea in resource-limited settings. The novel mHealth CDST app uses several clinical diagnostic models developed by this research team for assessment of dehydration severity in patients with acute diarrhea over five years of age and in children under five years of age (Lee et al, 2021; Levine et al, 2021; Levine et al, 2015). This research team previously incorporated the clinical models’ algorithms into an mHealth prototype, derived from a mHealth CDS (‘Rehydration Calculator’) that adapted paper-based World Health Organization (WHO) guidelines to an mHealth platform (Garbern et al, 2021; Haque et al, 2017). The prototype version of the app allows clinicians to enter a patient’s symptoms into an input screen, and displays the patient’s dehydration severity level and specific treatment recommendations on the output screen. Once validated, the novel mHealth CDST app will enable dehydration severity level assessment (none, some or severe) and improve the management of patients with acute diarrhea in resource-limited settings.
Study Design and Setting
To develop the novel mHealth CDST app from the prototype, formative qualitative data were collected in a series of focus group discussions (FGDs) from November to December 2020 among clinicians working at three different types of hospitals in Bangladesh: 1) the International Centre for Diarrhoeal Disease Research, Bangladesh’s (icddr,b) Dhaka Hospital (a private specialty hospital), 2) Narayanganj General Victoria District Hospital (a public referral hospital), and 3) Shaheed Ahsan Ullah Master General Hospital (also known as Tongi Upazilla/Subdistrict Hospital, a public community level hospital). The focus groups solicited feedback from nurses and physicians at each hospital on the following: anticipated clinical utility of the novel mHealth CDST app, current use of mHealth and other CDS tools, factors important to clinicians when treating diarrheal patients, feedback on preliminary app design and content. The aim of qualitative data collection was to seek feedback on the app for further development prior to a pilot test and subsequent use in a validation study.
Due to travel restrictions imposed by the COVID-19 pandemic, all data were gathered virtually, via Zoom, and facilitated by a member of the Bangladesh-based research team. The Bangladesh team included a physician, an anthropologist, and two research assistants, one of whom had experience teaching and translating English. They were supported by the US-based project coordinator and co-investigators (a clinician and a medical anthropologist). The US and Bangladesh teams adapted the focus group agenda and translated it into Bangla. Several weeks of qualitative training, including facilitation practice and remote data collection protocol development took place before the first focus group. A total of eight FGDs were conducted; two FGDs were conducted at each of the district and subdistrict hospitals (one with nurses and the other with physicians) and four additional FGDs were conducted with specialty providers (two with nurses and two with physicians). The number of participants per focus group was kept deliberately low, each consisting of two to four participants, in keeping with best practices for remote FGDs (Archibald et al, 2019; Gray et al 2020).
Data Collection
Facilitators used a written focus group agenda (also called a topic guide) to direct the discussion which began by asking participants about their current use of mHealth tools, and then presented a standardized diarrhea patient case. The patient case vignette was used to generate discussion about essential information clinicians use when managing diarrheal patients. Specific feedback solicited included: how participants would treat the case (including when and how to provide fluids), whether to treat the patient in the hospital versus outpatient, and when antibiotic use should be considered. After the patient case, a two-minute video of the prototype app was shown to participants which demonstrated key app features, patient data entry into the input screens, and interpretation of the recommended treatment and rehydration from the output screens.
We collected general feedback on the app based on the video demonstration and by directing participants to information about specific screens using a PowerPoint presentation displaying still screen shots, known as “cards”. Feedback was solicited on the input screen, format for entry of the chief complaint, dehydration assessment and medical danger signs, inclusion of medications and allergies, presentation of the dehydration and fluid deficit information, and additional treatment recommendations including guidance on the administration of zinc, vitamin A and antibiotics. In this conversation, we asked about the availability of two specific resources: mid-upper arm circumference (MUAC) and systolic blood pressure (SBP). Since these predictors are used by one of the app algorithms to calculate dehydration severity and treatment recommendations, the team needed to know if these tools were readily available and currently in use in each of the treatment contexts. We then showed side-by-side comparisons of two different versions of the input screen, dehydration assessment, and output screen fluid deficit cards and asked participants which they preferred (Appendix 1). Finally, feedback on participants’ expectations of the use of the app in clinical care, including during outbreak situations (e.g., cholera outbreak), was obtained. This discussion also considered whether other healthcare workers such as pharmacists or community health workers (CHWs) could use the app, and in what contexts. Physicians were also asked to evaluate the likelihood of correct treatment, overtreatment, and undertreatment using the World Health Organization’s (WHO) Integrated Management of Adolescent and Adults Illnesses (IMAI) algorithm versus the NIRUDAK models by comparing three possible prediction cut points for classifying patients with severe dehydration in the novel mHealth CDST app (Appendix 2) (Rosen et al, 2022; WHO, 2011). Each discussion was audio recorded for transcription and translation by the local research team.
Data Analysis
Framework Matrix Analysis
FMA was conducted using Excel spreadsheets and review of the FGD audio recordings, which were in Bangla. Eight spreadsheets were initially created, one for each focus group. In each spreadsheet, the rows were participant IDs (one per row) and the columns were key elements the app developers wanted feedback on, and based on the qualitative agenda questions. There were also columns that recorded choices between two different layouts or presentation of the dehydration assessment, input and output/fluid deficit screens. Matrices for the physician groups included a column for preferences regarding over- versus under-treatment (i.e., fluid under- or over-resuscitation). A total of fourteen columns were used for elements including “medication/allergies”, “rehydration bar”, “MUAC available”, “SBP available”.
The Bangladesh based team listened to each audio in Bangla and then summarized participant comments in the corresponding cells. This resulted in a matrix in which reading across a column one can see all of one participant’s comments. Reading down a column, one can see – and, importantly, easily compare – what all of the participants thought of a particular feature, or what choice they made when asked to select between different sample screens. A brief summary was written in the final cell of each column. For example, in one summary it was noted that three of four participants in a focus group chose layout A (rather than layout B) for the input screen. Similar summary cells were written for each column allowing us to easily track trends in the participant’s choices and recommendations. For example, stating: “Three out of six participants believed the rehydration bar would be helpful. The other three participants had no comment”. An overview of the FMA process is summarized in Figure 1.
Figure 1.
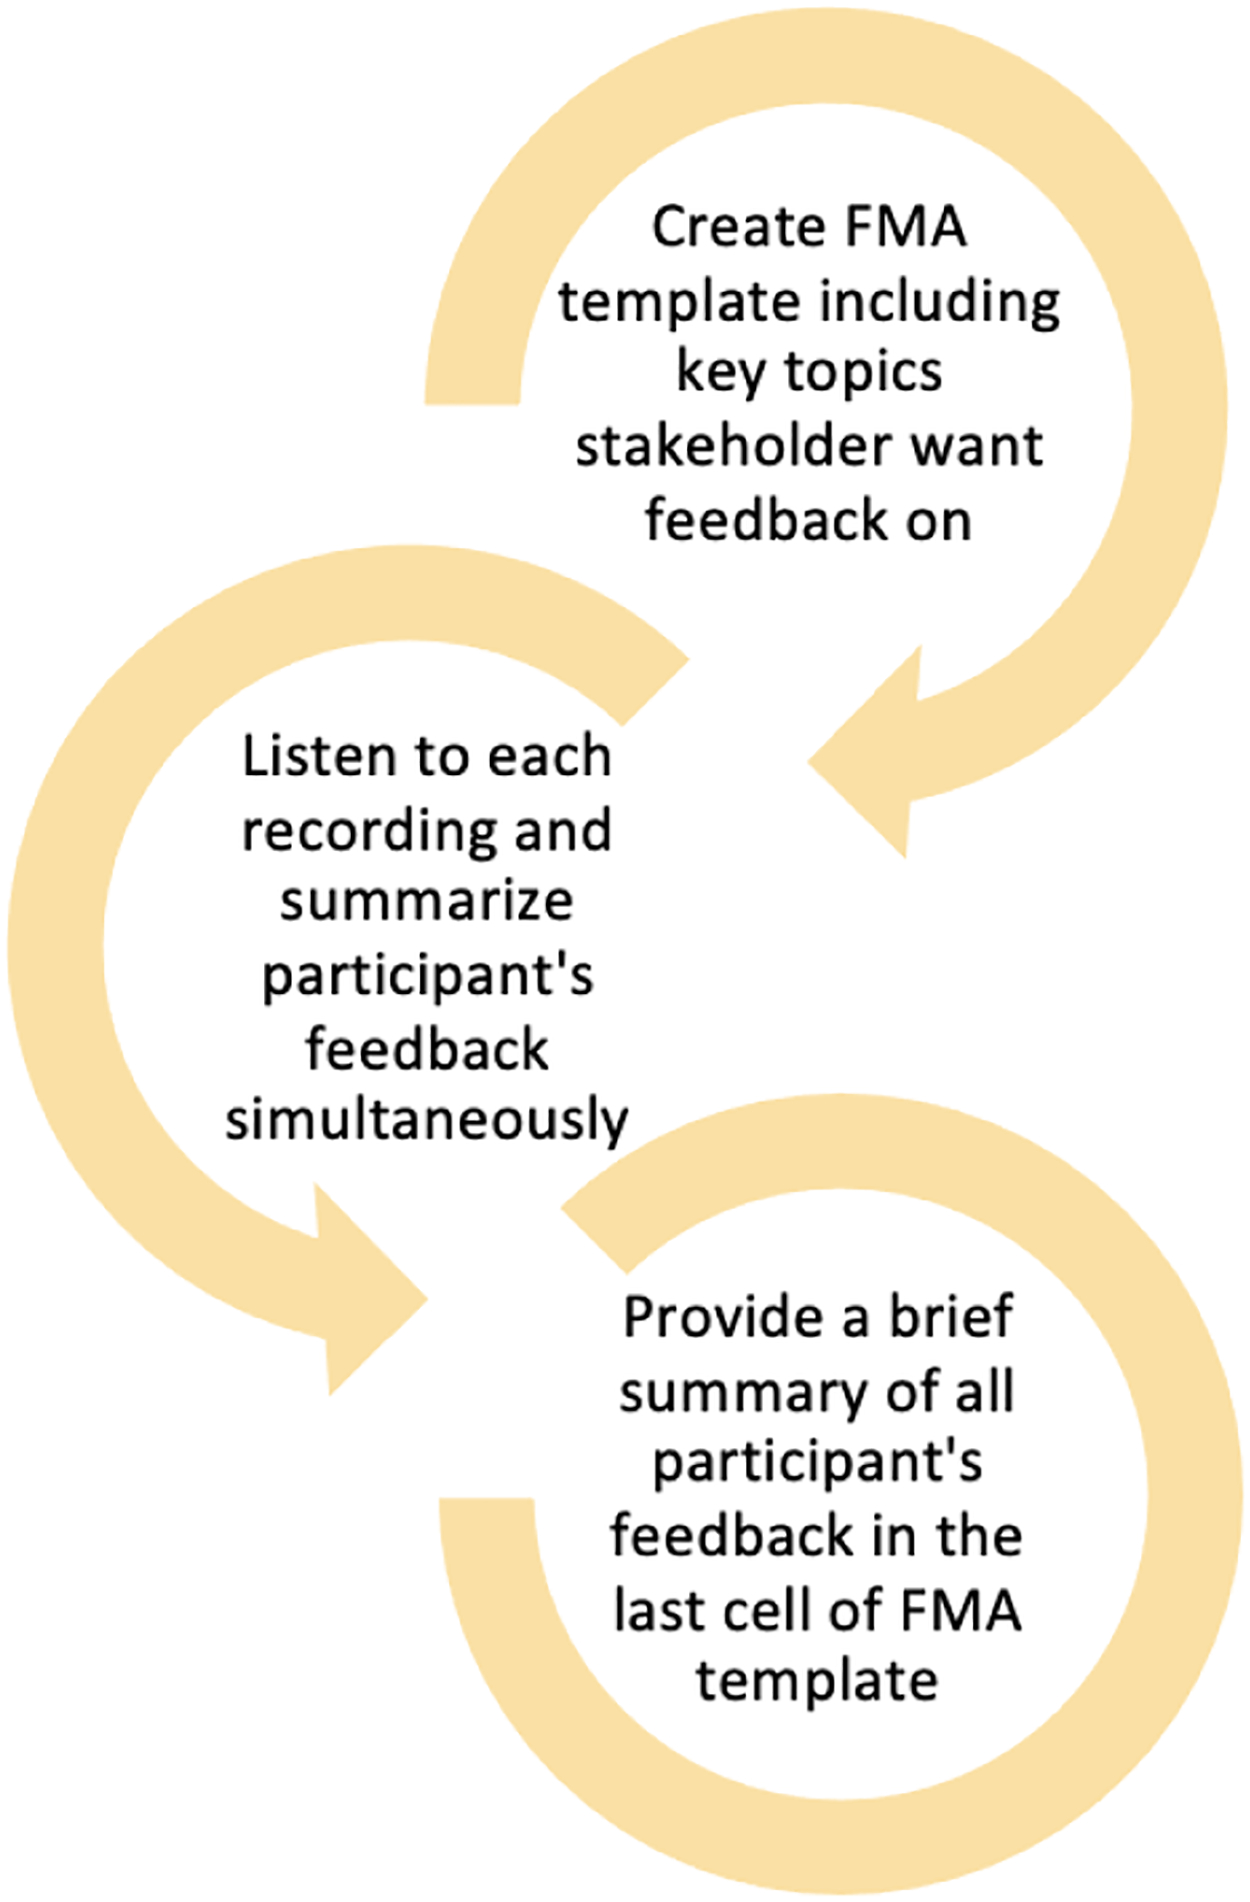
Summary of FMA process.
Applied Thematic Analysis
The transcription and translation process required several steps. Audio recordings were first transcribed into Bangla transcripts, which were then translated into English by a research team member proficient in written and spoken English. English transcripts were reviewed for completeness and accuracy by a third team member in Bangladesh. US-based research team members then read the English transcripts, notating any areas for which they needed clarification, to ensure that meanings and idiomatic speech forms were well understood. The Bangladesh-based research team reviewed and resolved all translation clarification requests. Once these were addressed, the de-identified English transcripts were considered finalized and used in the coding and ATA process.
Deductive codes were created using the qualitative research agenda. Codes were created for each of the key questions and sub-questions in the agenda, including: current experience with mobile medical apps, presentations essential to treating diarrhea, responses to the case scenario and specifics comments about app design. We created a top level (parent) code for each of the app screens, with second level (child) codes for specific elements of the screens (Appendix 3A shows a sample of the coding structure for the app design).
The initial codes were used by two analysts, who independently coded the first focus group transcript. The coders met to review and compare their individual coding. In this process, the two coders came to an agreement on the codes. After coding the initial transcripts, inductive codes were added that captured comments about the importance of clinical judgement in treating diarrhea as well as codes that focused on the practical aspects of using the app, including comorbid illness, treating patients of different ages, and barriers and facilitators of app use. The finalized code structure was used on each of the eight transcripts (initial transcripts were re-coded to apply subsequent inductive codes). Two coders independently coded each transcript, then met to review their codes. Finalized, agreed-upon codes were entered into NVivo software for analysis (QSR International Pty Ltd, 2012).
When all the data were coded, the analysts wrote summaries of key codes (Appendix 3B). To do so they reviewed, in aggregate, all of the transcript passages assigned to a given code and wrote a prose summary of the participant comments in those passages. Each code summary followed the same organization, presenting data separately for specialty hospital physicians, specialty hospital nurses, district/subdistrict hospital physicians, and district/subdistrict hospital nurses. This structure allowed comparison of comments on each app component or use topic by clinician and hospital-type. A total of 15 summaries were written by the analysts then shared with the PI and app developers. Summaries were then used to write several thematic memos (Appendix 3C). Memos gathered data from several code summaries and were used to write the team’s first qualitative paper which focused on designing the novel mHealth CDST app (Rosen et al, 2022). The final ATA documents were written summaries of selected codes, which allowed the researchers to focus on the logic and explanation behind many of those same choices. For example, a specialty hospital physician said: “many times…digital blood pressure for children are not available. In that case, getting these two things [MUAC, SBC] accurately will be a bit difficult if I want to use if for mass population. I think the things [MUAC and SBC] are good, but to use in mass population is a bit difficult.” An overview of the ATA process is summarized in Figure 2.
Figure 2.
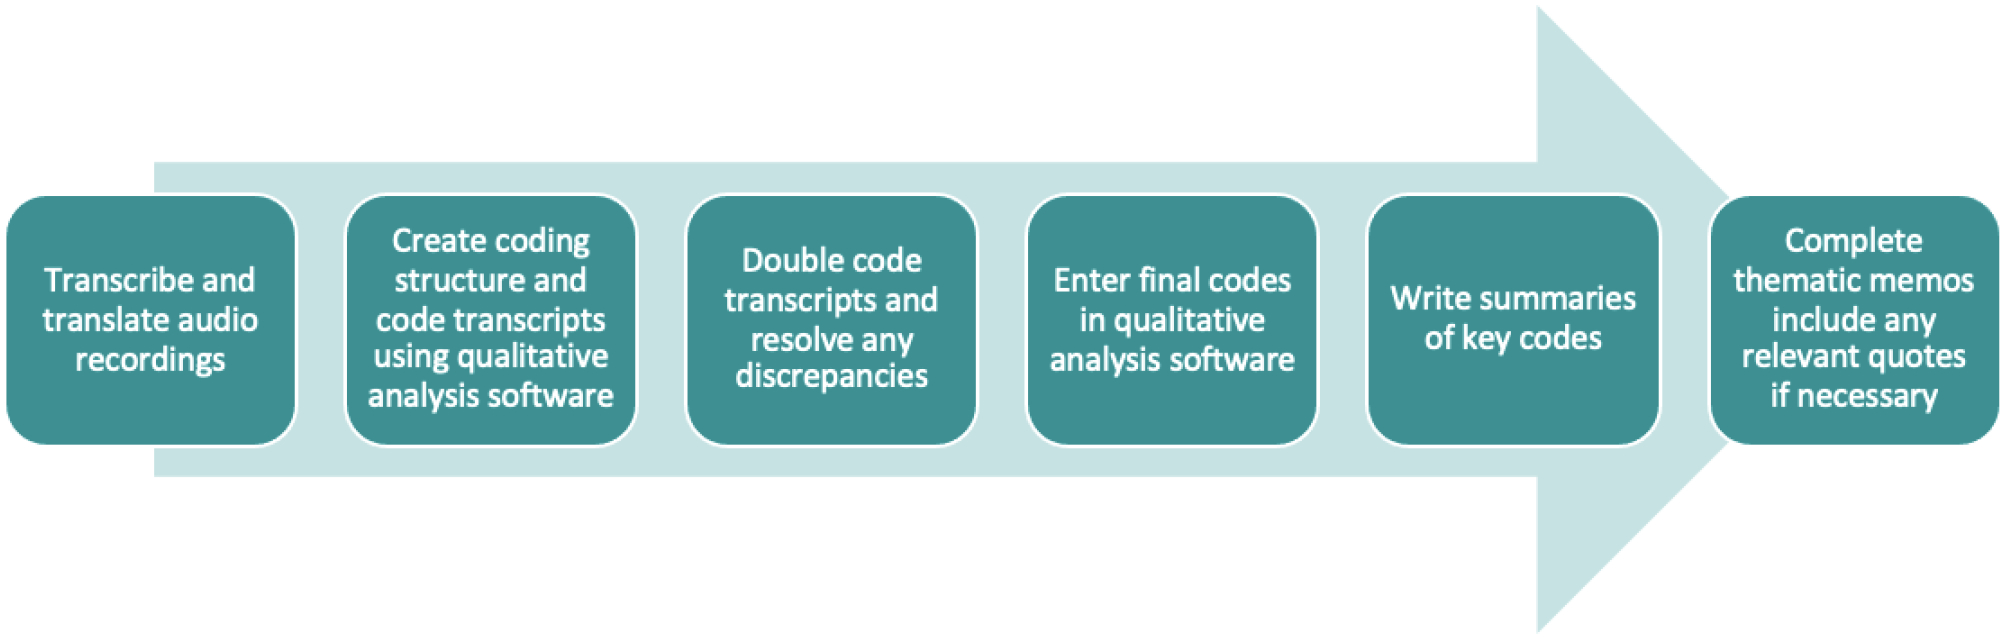
Summary of ATA process.
Results
Framework Matrix Analysis
The framework matrices were presented to the research team and used to guide decisions for development of the app. Despite the significant reduction from the transcript data that the matrices provide, it was found that eight matrices (one for each focus group) were not the ideal organization for presenting data to the research team. Therefore, matrices were combined to create a total of four: one for the specialty hospital physicians, one for the specialty hospital nurses, one for district/subdistrict hospital physicians on one for district/subdistrict hospital nurses. This organization made it easier to look at patterns in the data and app preferences by user category. Finally, the matrices were further reorganized in a single document containing all the feedback in the summary cells compared by both hospital type and clinician role (Table 1).
Table 1:
FMA Matrix and App Development Decisions. FMA summaries for each participant group were combined into a final matrix. The last column illustrates the final decision that was made by researchers based on the participant’s feedback.
| Framework Matrix Summaries | ||||||
|---|---|---|---|---|---|---|
| Specialty Nurses (8) | District Nurses (6) | Specialty Physicians (7) | District Physicians (6) | Decision | ||
| INPUT SCREEN | Input Screen A/B a | 4 liked Model A as an app since it is better to measure accurately though measurements may be difficult sometimes. 2 felt the app is good for ICU. 4 liked Model B. 3 felt they might not get BP in severe cases and adult MUAC for malnutrition assessment is not necessary. | All participants favored Model A. 3 participants brought up difficulties in getting MUAC/BP measurement. Patient load was a concern for 1 participant. 2 suggested training may be needed. | First FG didn’t make selection, focusing instead on difficulty of getting MUAC and BP cuff. 3 participants in second group preferred Model B because MUAC and SBC are difficult to obtain. | Responses were split. 3 preferred Model A because it is more accurate. 3 favored Model B. 2 who said Model B were influenced by resource availability in allowing them to assess BP and MUAC. | No change needed. Input screen will divert to correct screen if MUAC/SBP is available. |
| Medication/ Allergies | All agreed that drug allergy information is needed and helpful for treatment. | 4 stated knowing patient allergies is needed. Other 2 did not understand the question. | 5 said med/allergy info is needed with 2 noting patients may not be able to provide the information. 1 asked for an additional field for paracetamol information. 1 had no answer. | All agreed allergies are important. 1 felt it depends on patient needs. | Leave option in. | |
| Danger Signs | All felt danger signs are good but need to add more information, like hypoxia. 1 felt to understand sepsis, more information is needed. | All of the participants agreed to include danger signs as it is helpful to understand. | 6 liked/felt danger signs were important. 2 questioned 40 as cut off for rapid breathing. 1 felt thirst should be moved within a dropdown menu. | General support for including danger signs. Some advised to add information on renal function; urine output should be included in assessment. 1 felt that reporting inability to drink is unnecessary. | Keep as is for patients under 5 years old. Create a similar expanded list for those over 5 years of age. | |
| MUAC Available | MUAC is available. Participants think MUAC measurement will be difficult. Also, they were confused about using MUAC for adults. | Most of the participants who answered felt that MUAC is not readily available or they do not know how to use it (3 participants). 1 stated that it’s not something that would be difficult to arrange while the other 2 had no comment. | While MUAC is available at the specialty hospital, several noted it may not be available at community hospitals and/or that staff training will be needed. Others suggested that it is not possible to obtain MUAC for unconscious patients. | There was variability of responses. 4 expressed willingness/support in the use of MUAC if available. 2 stated it is not possible with 1 explaining that it is only used by pediatricians. | No change needed. If MUAC is available, first model will be used. If not, app will divert to second model. | |
| SBP Available | All said BP is available. 2 said BP is non-recordable in severe cases. 3 said depends on patient ratio. 1 felt BP is necessary. 1 said measuring BP and MUAC may delay other patient care. 1 mentioned about child BP is also available. | 3 participants stated that it’s a measurement that wouldn’t be difficult to obtain as machines are available (although child cuffs may not be available). Other 3 participants had no comment. | BP is possible, but likely difficult to get. Easier for adult than for children. Not possible for unconscious patients. | Participants find the information valuable but expressed concern regarding ability to collect information. | No change needed. If BP cuff is available, first model will be used. If not, app will divert to second model. | |
| OUTPUT SCREEN | Output Fluid Deficit A/B a | All liked Model A. All liked the fluid deficit bar. 5 mentioned about the need treat in the hospital. | All participants preferred Model A. | All preferred Model A. Liked rehydration bar and treatment at hospital recommendation. | All said Model A is better. Expressed appreciation for the visual component and detail. | Will change phrase to “fluid deficit” rather than “percent body weight loss” and present results in liters. Will leave bar in for now and come to a final decision after next round of testing. |
| Rehydration Bar | 1 clearly mention rehydration bar is good, liked the fluid count. Overall, no specific comments but seems they liked the bar. | 3 believed the rehydration bar would be helpful. The other 3 had no comment. | 3 found this helpful. 3 had no comment. 1 expressed concern that the recommended fluid level could be harmful. | Everyone liked the rehydration bar. | Same decision as cell above. | |
| Treatment at Hospital | All 8 liked it. It is helpful, easy. 1 said good for new clinicians. 1 said outside the specialty hospital all clinicians can use the app. | 5 believed treating at hospital sign is necessary; the severe patients must be treated in the hospital. 1 did not comment. | All felt this was needed and/or liked this. 1 suggested that it be color coded. | All participants liked, felt it was useful to include | Think about word choice: if no dehydration, treat at home; if some dehydration, treat at center/hospital; if severe dehydration, treat at hospital. Possibly link to danger signs. Consider color choice and font size. | |
| Dehydration Assessment A/B a | 8 liked Model B as they felt radial pulse and urine information is necessary. 4 said all the information is needed for diarrhea cases so adding all information would be a good idea. 4 suggested to input urine information as “urine pass time” in hours (6, 8, 12 hours). | 3 preferred Model A and the other 3 preferred Model B. 2 participants who preferred Model B misunderstood the urine output feature. | All preferred Model B. Radial pulse and urine output are important. Consider adding vomiting. | 2 preferred Model A for ease. 1 preferred Model B because urine output is necessary. 2 said either were fine. | No change needed. Input screen will divert to correct screen if MUAC/SBP is available. | |
| OTHER | Context Specific Factors | 7 felt doctor and nurses can use it. 1 felt only doctors should use it. For CHW, 7 felt they need special training. They can use the assessment section only. Chance of over treatment or undertreatment. | 1 stated CHW can use app in remote areas though training would be needed. 1 agreed about app’s usage in remote area. 1 stated both doctors and nurses would be able to use the app. Other 3 participants did not provide additional context specific recommendations. | All felt can be used by doctor and nurses. Concern about CHW and pharmacist making mistake, misunderstanding. Some feel CHWs can enter/use the app but not interpret and will certainly need training. | There was a great deal of variability in answering this. 2 said it would take time to learn how to use the app but would get used to it. 2 said it is not possible to use in emergencies. 1 said it can be used at home instead. 3 said nurses can use it. 3 said physicians can use it. 1 person said CHWs can use it. 1 person said anyone with proper training. 1 said nurses and medical assistants can input information only. | Not for immediate app development. Will get a better sense after next round of testing. |
| OTHER | Cholera Epidemic/ High Case Load Times | 5 said will be difficult to use the app in epidemic. 2 said they can use the app in epidemic. 1 said BP will take time in epidemic. 1 is confused, would prefer to use the app first before making a decision. | 2 stated app will be difficult to use during cholera season as case load is high. They believed it will help but it will take training/organization and some time to do so. 1 believed the app can be used in a cholera outbreak as more people are on hand to help during such times. 3 did not provide additional information. | Agreement that app will be difficult to use in cholera outbreak/high case load, particularly because MUAC and BP take time. 1 suggests IV should be started first, then the app used. | 2 noted epidemics are a special case and manpower at the hospital increases. 1 said because the app is not something they use regularly; it should only be used during the study period. Another person felt they should use it but need to get habituated to its use via training. 2 said they can use the app because it is easy to use with one person noting it already takes time to collect data from the patient and the app immediately organizes the information for them. | Not for immediate app development. Will get a better sense after next round of testing. |
| Emesis | This information is needed. 1 advised to include vomiting hours/days. | No comment from any participants. | 3 noted emesis information can be collected. Other 3 felt emesis information was needed. | Those who responded all agreed it was easy to collect. | Keep the same danger signs we have at this time. App development Co-I will look back at adult danger signs (WHO’s IMAI). | |
| Over/Under-treatment b | N/A | N/A | 4 preferred Option 1. 2 preferred Option 2. 1 chose Option 2/3. Doctor felt it important not to undertreatment any patients. Others were more divided, indicating they would rely on clinical experience. | 4 preferred Option 1 due to concern for undertreatment. 2 preferred Option 2. | We already have cut offs for Option 2. PI will send cut offs for Option 1 to be included in the settings. We will include what the sensitivity level is in the output screen as to inform the clinician (final decision of including this will be determined after pilot testing). | |
| Interface | 3 suggested to add morbidity options as they get critical cases. 4 recommended to use dark color (especially red for severe dehydration and make this font bigger). Can use red for bloody diarrhea. 1 preferred button system to dropdown. 2 mentioned there should be referral option. | 2 said it’s difficult to comment on the app’s usefulness at this time (will know better after usage). 2 suggested additional information that should be added in the app: kidney problems, diabetes, hypertension. 2 explicitly said they would recommend this app. 3 said they believe the app will help in treatment. | Design generally liked. Other suggestions include: add co-morbidities, pregnancy, BMI weight range. Add a reassessment option. Color code: severe dehydration = red, some dehydration = orange. Comments here vary, and are hard to summarize-read the column for details. | Participants felt it was easy to use and recommended the following additions: acute vs chronic diarrhea, co-morbidities (3), bloody stool with mucus (2), abdominal crump, physician email address, and hotline. | Suggestion to include information tabs for each clinical sign (how to assess that sign). Button was preferred to drop down (final decision will likely be made after pilot testing). Reassessment option may not be possible as app zeros out after each use. Co-morbidities may not be included as model does not account for complex cases. | |
Abbreviations: BMI: body mass index; CHW: community health workers; ICU: Intensive Care Unit; IMAI: Integrated Management of Adolescent and Adult Illnesses; IV: intravenous; MUAC: mid-upper arm circumference; (S)BP: (systolic) blood pressure; WHO: World Health Organization
For specific topics (i.e. input screen, dehydration assessment, output screen), focus group participants were provided with two design choices (Model A and Model B), and asked which option they preferred. Appendix 1A–C provides models shown to participants.
Only physicians were asked questions regarding over/undertreatment, and they were provided with three treatment scenarios and asked which option they preferred (Option 1, Option 2, Option 3). Appendix 2 provides the options shown to participants.
The combined matrices were shared with the app development team in a meeting in which the qualitative analysts presented each matrix, summarizing the participants’ opinions, noting when there was agreement, if that was uniform, and where there were differences of opinion. The lead app designer and the PI then identified changes to be made in the app based on the summary results. In this discussion, the qualitative research team represented the opinions of the participants, explaining the participants’ logic and reasoning. The project coordinator and app designer created summary documents that tracked the changes to be made. Table 1 provides a summary of the framework matrix and app development decisions made based upon it.
Thematic Analysis
Several key themes emerged using ATA, including: details of participants’ current experiences with other CDS tools as well as their overall perception of the app’s clinical utility, including barriers and facilitators of app use. ATA included detailed, specific consideration of the use of guidelines for diarrheal disease management, including the possibility of fluid over- and under-treatment. This specific focus was developed partly because of the research teams’ interest in dehydration prediction model development overall, and because of the desire to refine how the app used guidelines for the algorithms that drive treatment recommendations. After participant feedback on key app features were summarized using FMA, we also developed thematic codes and wrote summaries to look in detail at a few specific features, including age, danger signs, and dehydration assessment. Details of the thematic analysis have been previously published (Rosen et al, 2022). That paper uses direct participant quotes for illustration and as evidence for participants’ thought processes and the decision-making behind their opinions and choices.32 It provides context about clinicians’ willingness to use the novel mHealth CDST app, suggestions for needed training, options about which types of clinicians could and should use the app, and details about the role of clinician experience versus treatment models for guiding patient care.
Discussion
Qualitative analysis has become an essential tool in global clinical and public health research. The increase in its application and the articulation of a variety of data collection and analysis methods presents researchers with many choices for analysing qualitative research data. As qualitative research can be notoriously time consuming, a challenge is matching the qualitative analysis methods to the needs of the research project and overall project timeline. The efficiency of qualitative data analysis is a particular concern in formative qualitative research because accomplishing subsequent project aims depends on the timely completion of the qualitative analysis. Researchers therefore need to be aware of the various qualitative analysis methods available in order to decide which approach is most suited to the needs and the timeline of the research project.
FMA uses focused, brief summaries created by analysts which track key information needed to guide decision-making, rather than working in narrative text (i.e., transcripts using the participants’ own words). In this project, the app development team needed a summary of the focus group participants’ reactions to specific components of the app within two months of the completion of the FGDs to stay on track for the project’s timeline, necessitating a quick turnaround of data. The use of audio review and a simple excel spreadsheet format allowed the Bangladesh-based team to quickly produce the needed results. It also provided a format that was easily shared with the PI and app developers who would not have been able to either listen to audios in Bangla or to read eight focus group transcripts, even if there had been time to transcribe and translate them. In contrast, while ATA is a pragmatic approach to qualitative analysis, it is still a time-consuming process. Its strengths include attending to the nuances of participants’ discussion and being able to work in verbatim transcripts and use direct quotes. Challenges for ATA use includes the time it takes to complete the analysis, including to translate, transcribe, clean and deidentify data, and then to double code, reconcile coding, enter data, write code summaries and thematic memos for analysis.
Charting data in a FMA requires significant data reduction. Participant’s own words are rarely used. Instead, several paragraphs or pages of discussion are reduced to the key relevant points. Matrix cells capture what choice a participant makes, but not all the nuances in a discussion of why that choice might be made. This was appropriate for app development. The process was also mostly limited to deductive data – that is, data that came from the questions the researchers asked, and the answers participants gave. While inductive, or emergent, data certainly could have become matrix columns, we did not find that was the case in our project. In contrast, inductive codes and an emergent topic became a focus of the thematic memos in our ATA process. Perhaps because working directly with transcripts, and therefore in the participant’s own words, several inductive codes were developed. In fact, one of them, the importance of clinician experience in patient care, became a key focus of our first paper.
While qualitative research is not statistically representative, and does not usually quantify data or present frequencies, in some opinion or consensus-based work, it is necessary to poll opinions and track preferences (Pope et al, 2000). This was the case in these focus groups, and the resulting FMA matrix, and summaries made this easy to do and simple to track.
FMA is more targeted and the column headers (an analog to ATA codes) are usually based on questions from the qualitative topic guides used to facilitate the focus groups (Charkrapani et al, 2017). FMA is therefore more deductive-leaning, while ATA more inductive-leaning (Pope et al, 2000). Charted FMA cell content focuses on the outcomes of participants’ choices whereas ATA focuses on the reasoning and discussions that informed those choices. FMA is data reduction, and analysis proceeds from summaries of what participants have said. ATA uses participants own words. As a result, FMA may streamline collaboration between qualitative researchers and design teams or other non-qualitative researchers because there is less data for these collaborators to review (Ward et al, 2013). Counting participant responses is easy to do and relatively simple to track and compare across types of participants with in an FMA. Key differences between the use of FMA and ATA are also summarized in Table 2 below:
Table 2.
Key differences between FMA and ATA.
| Framework Matrix Analysis | Applied Thematic Analysis | |
|---|---|---|
| Input | Audio recordings | Narrative text (i.e. transcripts) |
| Output | Brief summaries | Detailed summaries and memos |
| Timeline | Quick turnaround | Time consuming as it requires transcribing (and sometimes translating) audio recording, double and reconcile coding |
| Software Needed | Any spreadsheet software (i.e. Microsoft Excel, iOS Numbers) | Qualitative analysis software (i.e. NVivo) |
| Level of Detail | Limited/streamlined as FMA is data reduction-based analysis | Very detailed as ATA uses participant’s own words |
| Type of Feedback | Brief summaries allow for less detailed feedback and overall summary of how many participants support recommendations | Detailed summaries provide better understanding and logic of participants decisions/recommendations. Able to use more direct quotes to support findings. |
| Analytical Reasoning | Deductive-leaning | Inductive-leaning |
Taken together, the two approaches allowed the analysis team to provide a thorough assessment of how many participants endorsed particular app responses and recommendations (FMA), the changes the PI and app development team made based on those recommendations (FMA summary documents), and the logic and reasoning behind those choices including how they might impact product use (ATA analysis).
Concerns that guided the team’s choice of which analysis method to use for which analysis task include timeline, deductive and inductive data needs, and practicalities such as software access, transcription, translation, and the decentralized study team. The FMA analysis was conducted within six weeks of completing the focus groups. Transcription, translation, and transcript verification could not have been accomplished in that time. Audio review of the Bangla focus groups was used, and an excel spreadsheet rather than a formal framework matrix software tool, such as the one build into NVivo, was also used because Excel did not take additional time to learn. These choices allowed the Bangladesh team to work independently and efficiently. Weekly meetings of the full qualitative team were held to review data as it was charted in the matrices, and then both US and Bangladesh researchers participated in final review, summarization, and presentation of the data to the PI, Co-Investigators, and app development team.
Limitations and Strengths
The COVID-19 pandemic necessitated the use of Zoom for these remote focus groups, and poor internet connectivity limited participants to those who were able to connect at the scheduled time. These qualitative data were collected in Bangla and translated into English for use by this international global health team. Translation always presents challenges and limitations include the possibility of having meaning lost in the translation process. In this project, the Bangladesh based team, which included a physician, an anthropologist, and an English teacher, was a particular strength. Most framework analyses use transcripts, while this analysis was created using a review of the Banga audios. Though a departure from other uses of FMA, conducting the analysis using review of responses in the actual language of the discussion, may in fact have been a strength, particularly given the expertise of the Bangladesh based team and the need for a quick turnaround of data to the app development team.
Conclusion
FMA and ATA were used on the same qualitative data for comparison of these two analytical methods as part of a research study developing a new mHealth tool for diarrhea management in resource-limited settings. FMA using Bangla audio recordings allowed for more focused, rapid analysis, important for immediate use by an app development team to guide app development. A subsequent ATA using English transcripts, focused on the context of app use, including experiences with other apps and clinical decision support tools, the overall utility of the app in clinical care, and barriers and facilitators of the app use. Each analysis method was complementary and suited the needs and timeline of this project.
Supplementary Material
Figure 3.
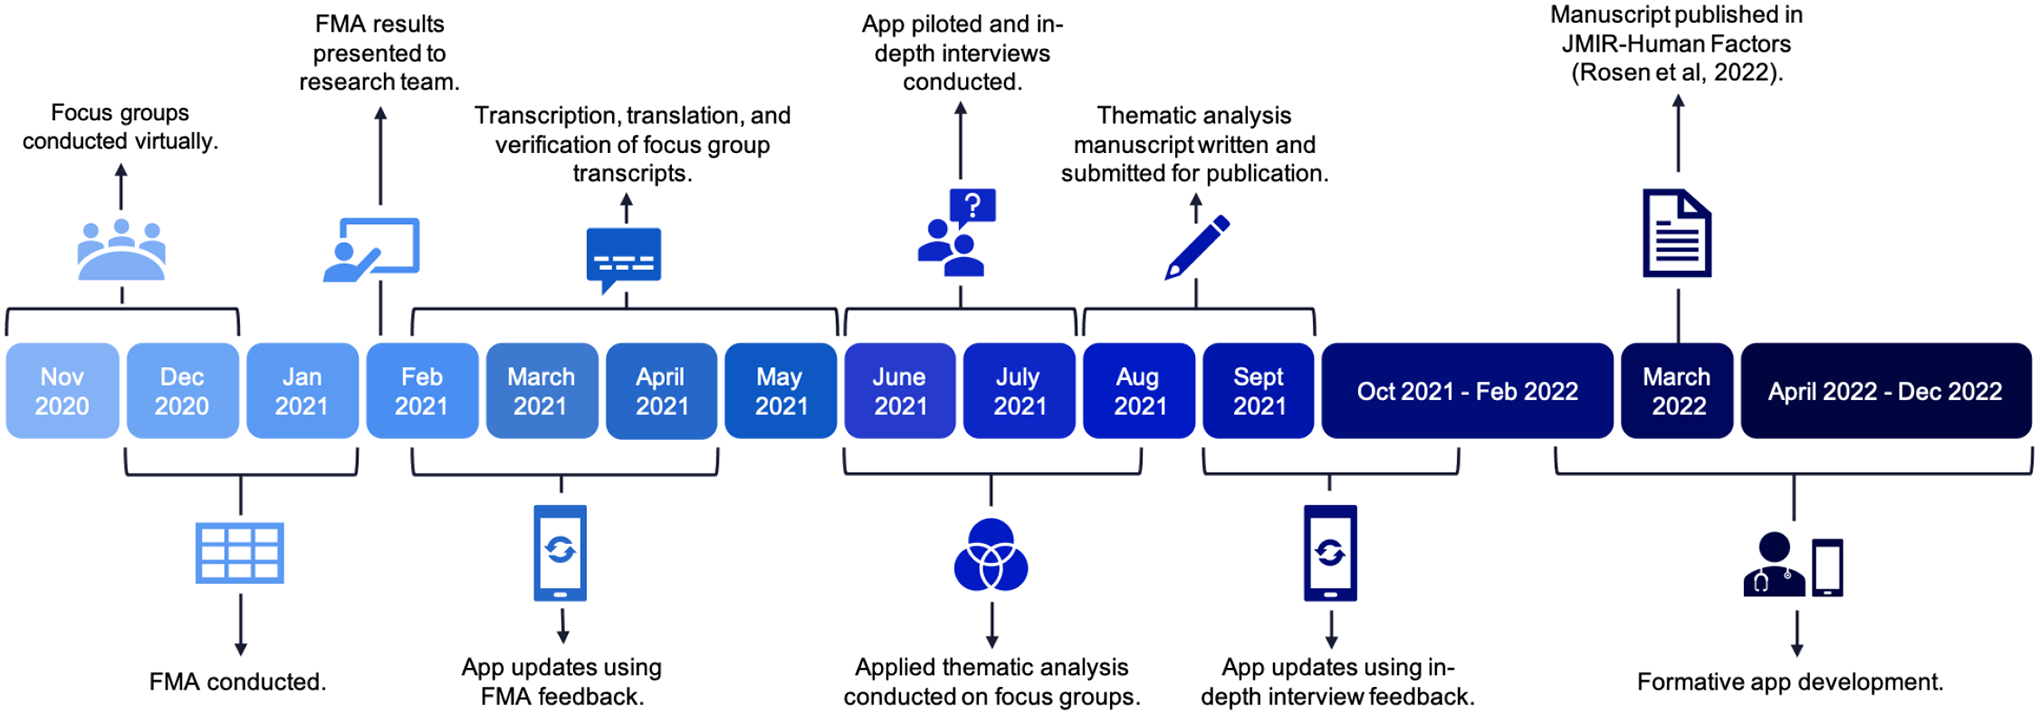
Timeline of data analysis.
Acknowledgements:
The authors thank all study participants and the study staff at icddr,b Dhaka Hospital who were instrumental in collecting the data used in this study.
Funding:
Funding was provided through grants from the National Institute for Health (NIH) National Institute for Diabetes and Diarrheal and Kidney Diseases (NIDDK), (PI Levine, 1R01DK116163-01A1). This research was supported in part by NIH/NIAID R25AI140490.
Footnotes
Conflict of interest: The authors have no conflicts of interest. The content of this manuscript is solely the responsibility of the authors and does not necessarily represent the views of NIDDK or any governmental bodies or academic organizations.
Ethical Approval and Consent to Participate: Ethical approval for the formative phase of the NIRUDAK Study was obtained from the International Center for Diarrhoeal Disease Research, Bangladesh (icddr,b) and the Lifespan (Rhode Island Hospital) Institutional Review Boards.
REFERENCES
- Archibald MM, Ambagtsheer RC, Casey MG, & Lawless M (2019). Using Zoom Videoconferencing for Qualitative Data Collection: Perceptions and Experiences of Researchers and Participants. International Journal of Qualitative Methods, 18:160940691987459. doi: 10.1177/1609406919874596. [DOI] [Google Scholar]
- Attride-Stirling J (2001). Thematic networks: An analytic tool for qualitative research. Qualitative Research, 1, 385–405. doi: 10.1177/146879410100100307. [DOI] [Google Scholar]
- Barbour RS (1999). The case for combining qualitative and quantitative approaches in health services research. Journal of Health Services Research Policy, 4(1):39–43. doi: 10.1177/135581969900400110. [DOI] [PubMed] [Google Scholar]
- Braun V, Clarke V, Hayfield N, & Terry G (2019). Thematic analysis. In Liamputtong P (Ed.), Handbook of research methods in health social sciences (843–860). Sage Publications. [Google Scholar]
- Braun V, & Clarke V (2013). Successful Qualitative Analysis: A practical guide for Beginners. Sage Publications. Accessed from: https://us.sagepub.com/en-us/nam/successful-qualitative-research/book233059. [Google Scholar]
- Braun V, & Clarke V (2022). Thematic Analysis: A practical guide. Los Angeles, CA. Sage Publications. Accessed from: https://us.sagepub.com/en-us/nam/thematic-analysis/book248481. [Google Scholar]
- Braun V, & Clarke V (2006). Using thematic analysis in psychology. Qualitative Research in Psychology, 3:(2):77–101. doi: 10.1191/1478088706qp063oa. [DOI] [Google Scholar]
- Chakrapani V, Newman PA, Shunmugam M, Mengle S, Nelson R, Rubincam C, & Kumar P (2017). “Like Holding an Umbrella Before It Rains”: Acceptability of Future Rectal Microbicides Among Men Who Have Sex with Men in India-A Modified Technology Acceptance Model. Qualitative Health Research, 27(8):1236–1248. doi: 10.1177/1049732317697947. [DOI] [PubMed] [Google Scholar]
- Collaço N, Wagland R, Alexis O, Gavin A, Glaser A, & Watson EK (2021). Using the Framework Method for the Analysis of Qualitative Dyadic Data in Health Research. Qualitative Health Research, 31(8):1555–1564. doi: 10.1177/10497323211011599. [DOI] [PMC free article] [PubMed] [Google Scholar]
- Eisikovits Z, & Koren C (2010). Approaches to and outcomes of dyadic interview analysis. Qualitative Health Research, 20(12), 1642–1655. doi: 10.1177/1049732310376520. [DOI] [PubMed] [Google Scholar]
- Gale NK, Heath G, Cameron E, Rashid S, & Redwood S (2013). Using the Framework method for the analysis of qualitative data in multi-disciplinary health research. BMC Medical Research Methodology, 13(1), 117. doi: 10.1186/1471-2288-13-117. [DOI] [PMC free article] [PubMed] [Google Scholar]
- Garbern SC, Nelson EJ, Nasrin S, Keita AM, Brintz BJ, Gainey M, Badji H, Nasrin D, Howard J, Taniuchi M, Platts-Mills JA, Kotloff KL, Haque R, Levine AC, Sow SO, Alam NH, & Leung DT (2022). External validation of a mobile clinical decision support system for diarrhea etiology prediction in children: A multicenter study in Bangladesh and Mali. eLife, 11, e72294. 10.7554/eLife.72294. [DOI] [PMC free article] [PubMed] [Google Scholar]
- Gray L, Wong-Wylie G, Rempel G, & Cook K (2020) Expanding Qualitative Research Interviewing Strategies: Zoom Video Communications. The Qualitative Report, 25(5), 1292–1301. doi: 10.46743/2160-3715/2020.4212. [DOI] [Google Scholar]
- Guest G, MacQueen KM, & Namey EE (2011). Applied thematic analysis. Sage Publications. [Google Scholar]
- Haque F, Ball RL, Khatun S, Ahmed M, Kache S, Chisti MJ, Sarker SA, Maples SD, Pieri D, Vardhan Korrapati T, Sarnquist C, Federspiel N, Rahman MW, Andrews JR, Rahman M, & Nelson EJ (2017). Evaluation of a Smartphone Decision-Support Tool for Diarrheal Disease Management in a Resource-Limited Setting. PLoS neglected tropical diseases, 11(1), e0005290. 10.1371/journal.pntd.0005290. [DOI] [PMC free article] [PubMed] [Google Scholar]
- Lee JA, Qu K, Gainey M, Kanekar SS, Barry MA, Nasrin S, Alam NH, Schmid CH, & Levine AC (2021). Continuous diagnostic models for volume deficit in patients with acute diarrhea. Tropical medicine and health, 49(1), 70. 10.1186/s41182-021-00361-9. [DOI] [PMC free article] [PubMed] [Google Scholar]
- Lester JN, Cho Y, Lochmiller CR (2020). Learning to Do Qualitative Data Analysis: A Starting Point. Human Resource Development Review, 19(1):94–106. doi: 10.1177/1534484320903890. [DOI] [Google Scholar]
- Levine AC, Barry MA, Gainey M, Nasrin S, Qu K, Schmid CH, Nelson EJ, Garbern SC, Monjory M, Rosen R, & Alam NH (2021). Derivation of the first clinical diagnostic models for dehydration severity in patients over five years with acute diarrhea. PLoS neglected tropical diseases, 15(3), e0009266. 10.1371/journal.pntd.0009266. [DOI] [PMC free article] [PubMed] [Google Scholar]
- Levine AC, Glavis-Bloom J, Modi P, Nasrin S, Rege S, Chu C, Schmid CH, & Alam NH (2015). Empirically Derived Dehydration Scoring and Decision Tree Models for Children With Diarrhea: Assessment and Internal Validation in a Prospective Cohort Study in Dhaka, Bangladesh. Global health, science and practice, 3(3), 405–418. 10.9745/GHSP-D-15-00097. [DOI] [PMC free article] [PubMed] [Google Scholar]
- Molina-Azorin J (2016). Mixed methods research: An opportunity to improve our studies and our research skills. European Journal of Management and Business Economics, 25:37–38. doi: 10.1016/j.redeen.2016.05.001. [DOI] [Google Scholar]
- Morgan DL (2015) From themes to hypotheses: following up with quantitative methods. Qualitative Health Research, 25(6):789–93. doi: 10.1177/1049732315580110. [DOI] [PubMed] [Google Scholar]
- Nowell LS, Norris JM, White DE, & Moules NJ (2017). Thematic Analysis: Striving to Meet the Trustworthiness Criteria. International Journal of Qualitative Methods. doi: 10.1177/1609406917733847. [DOI] [Google Scholar]
- Pope C, Ziebland S, & Mays N (2000). Qualitative research in health care. Analysing qualitative data. BMJ Clinical Research, 320(7227):114–116. doi: 10.1136/bmj.320.7227.114. [DOI] [PMC free article] [PubMed] [Google Scholar]
- Poses RM, & Isen AM (1998). Qualitative research in medicine and health care: questions and controversy. Journal of General Internal Medicine, 13(1), 32–38. 10.1046/j.1525-1497.1998.00005.x. [DOI] [PMC free article] [PubMed] [Google Scholar]
- QSR International Pty Ltd. NVivo qualitative data analysis Software. Version 10, 2012.
- Regnault A, Willgoss T, Barbic S, & International Society for Quality of Life Research (ISOQOL) Mixed Methods Special Interest Group (SIG) (2017). Towards the use of mixed methods inquiry as best practice in health outcomes research. Journal of patient-reported outcomes, 2(1), 19. 10.1186/s41687-018-0043-8. [DOI] [PMC free article] [PubMed] [Google Scholar]
- Ritchie J, Spencer L, & O’Connor W (2007). Carrying out qualitative analysis. In Ritchie J, Lewis J (Eds.), Qualitative research practice: A guide for social science students and researchers. Sage Publications. doi: 10.4135/9781452230108. [DOI] [Google Scholar]
- Ritchie J, & Spencer L (1994). Qualitative data analysis for applied policy research. In Bryman A, Burgess RG [Eds.], Analysing qualitative data (173–194). Routledge Publications. [Google Scholar]
- Rosen RK, Garbern SC, Gainey M, Lantini R, Nasrin S, Nelson EJ, Elshabassi N, Alam NH, Sultana S, Hasnin T, Qu K, Schmid CH, & Levine AC (2022). Designing a Novel Clinician Decision Support Tool for the Management of Acute Diarrhea in Bangladesh: Formative Qualitative Study. JMIR human factors, 9(1), e33325. 10.2196/33325. [DOI] [PMC free article] [PubMed] [Google Scholar]
- Smith J, & Firth J (2011). Qualitative data analysis: the framework approach. Nurse researcher, 18(2), 52–62. 10.7748/nr2011.01.18.2.52.c8284. [DOI] [PubMed] [Google Scholar]
- Srivastava A, & Thomson SB (2000). Framework Analysis: A Qualitative Methodology for Applied Policy Research. Journal of Administration and Governance, 4 (2). [Google Scholar]
- Vaismoradi M, Turunen H, & Bondas T (2013). Content analysis and thematic analysis: Implications for conducting a qualitative descriptive study. Nursing & health sciences, 15(3), 398–405. 10.1111/nhs.12048. [DOI] [PubMed] [Google Scholar]
- Ward DJ, Furber C, Tierney S, & Swallow V (2013). Using Framework Analysis in nursing research: a worked example. Journal of advanced nursing, 69(11), 2423–2431. 10.1111/jan.12127. [DOI] [PubMed] [Google Scholar]
- World Health Organization (WHO). (2011) IMAI District Clinician Manual: Hospital Care for Adolescents and Adults. World Heal Organization. Available from: http://apps.who.int/iris/bitstream/10665/77751/3/9789241548290_Vol2_eng.pdf?ua=1. [Google Scholar]
Associated Data
This section collects any data citations, data availability statements, or supplementary materials included in this article.